
The Daily Shot: 07-May-20
• The United States
• The United Kingdom
• The Eurozone
• Asia – Pacific
• China
• Emerging Markets
• Energy
• Equities
• Alternatives
• Credit
• Rates
• Food for Thought
The United States
1. According to the ADP private payrolls report, nearly a decade worth of job gains have been wiped out in a month.
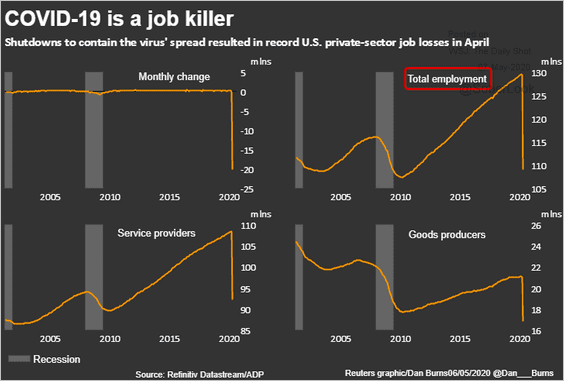 Source: Reuters Read full article
Below is the ADP summary.
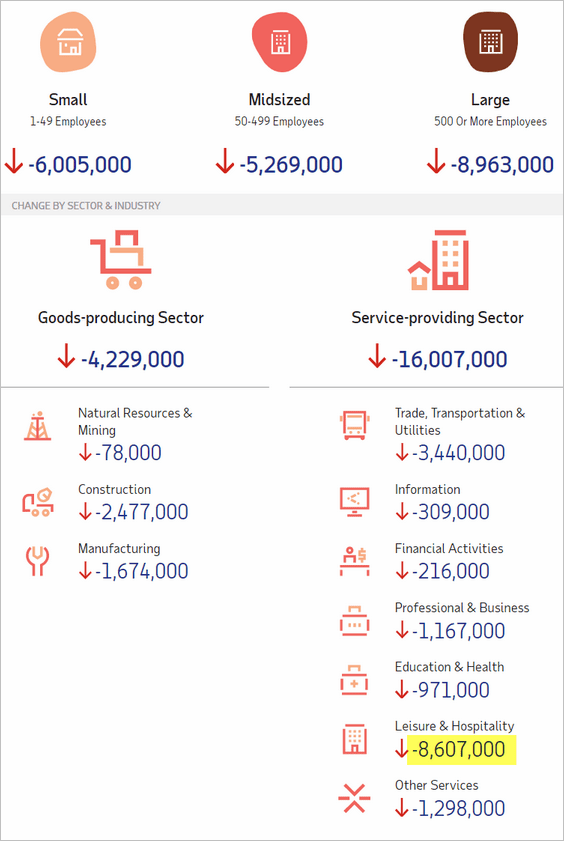 Source: ADP
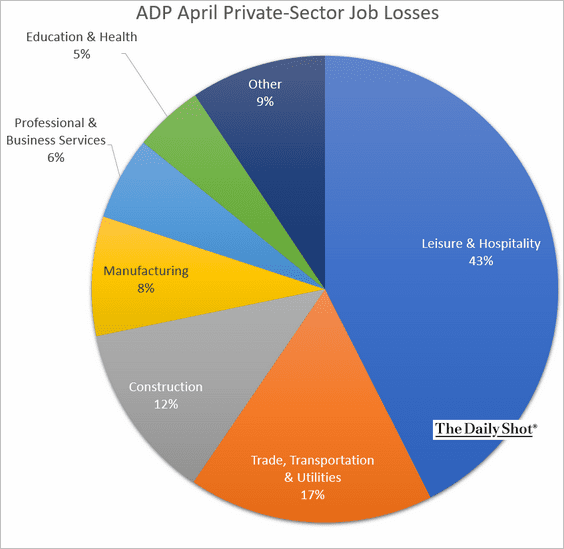
And here is the distribution by sector.
——————–
2. Initial jobless claims are moderating. Nonetheless, economists are estimating that another three million Americans filed for unemployment last week.
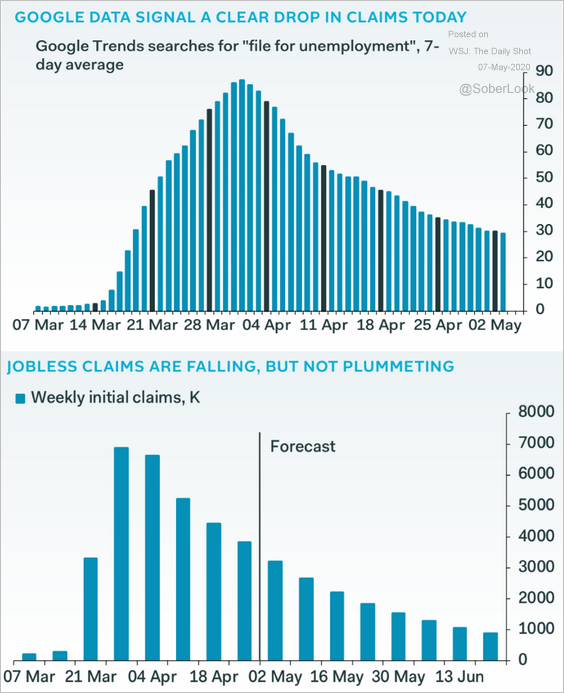 Source: Pantheon Macroeconomics
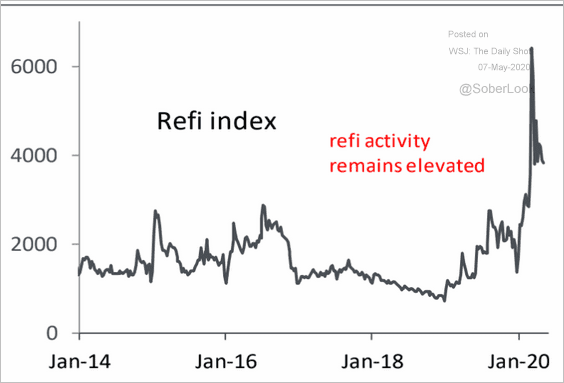
3. Mortgage applications to purchase a home continue to rebound.
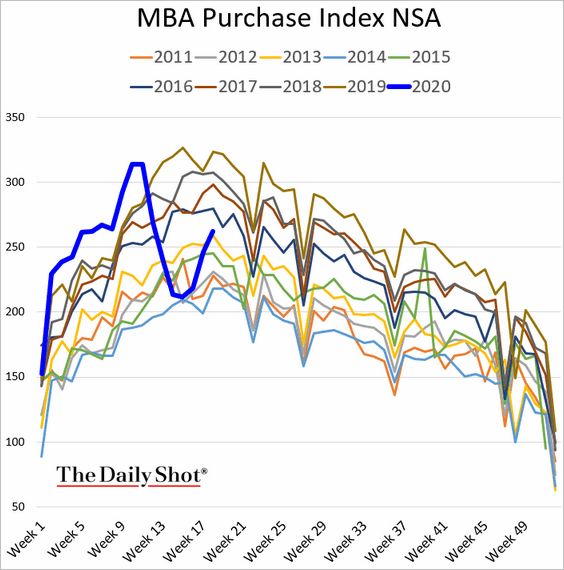
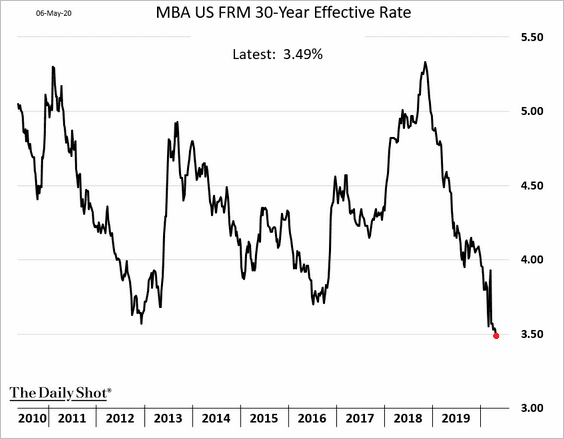
And refi activity remains elevated amid record-low mortgage rates (second chart).
 Source: Piper Sandler
——————–
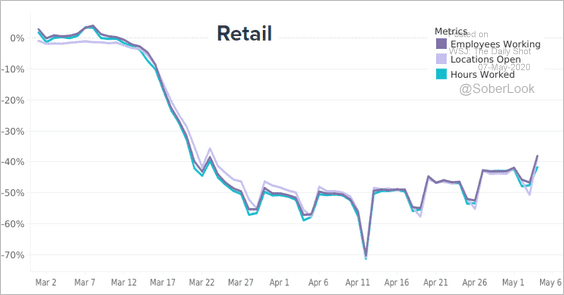
4. US retail activity is gradually recovering.
 Source: Homebase
More states are lifting restrictions, even as some fall short of the White House reopening criteria.
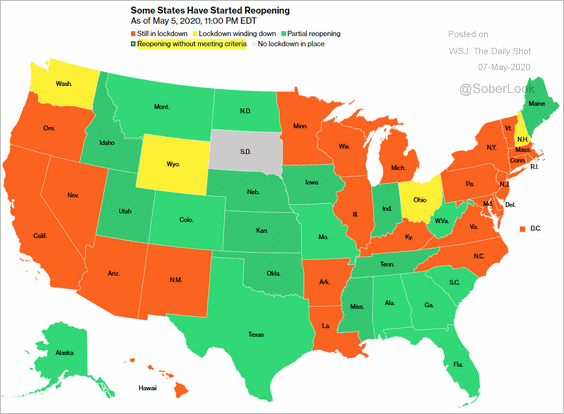 Source: @bbgvisualdata Read full article
The number of new cases is still rising in many states.
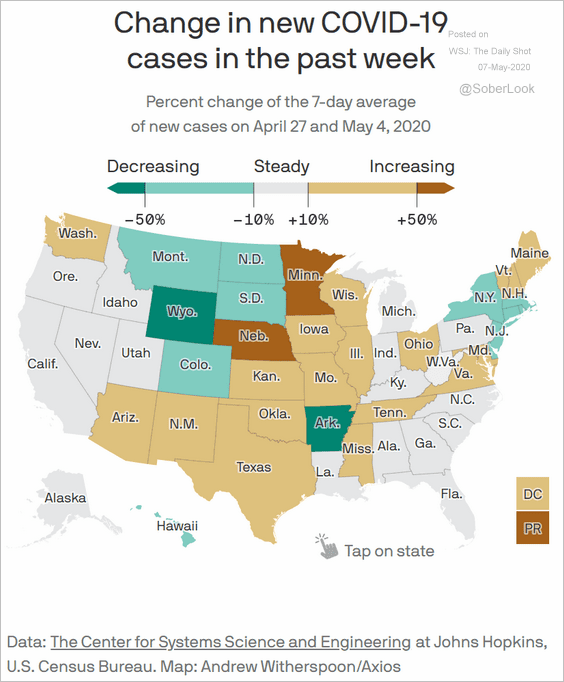 Source: @axios Read full article
——————–
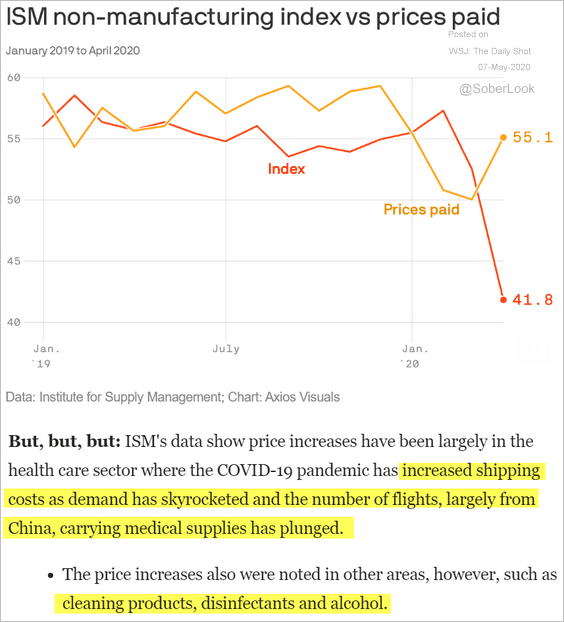
5. The ISM non-manufacturing report showed an uptick in prices. See the comment below from Axios.
 Source: @axios Read full article
6. Trucks outsold cars for the first time.
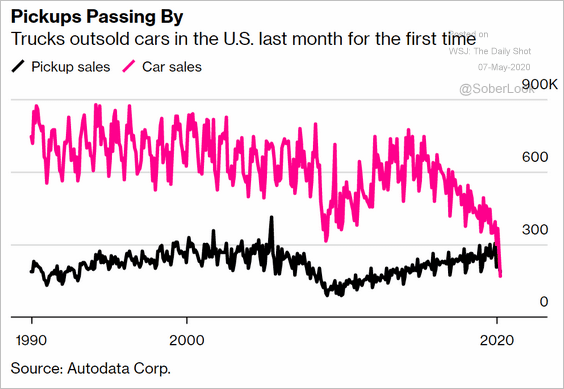 Source: @markets Read full article
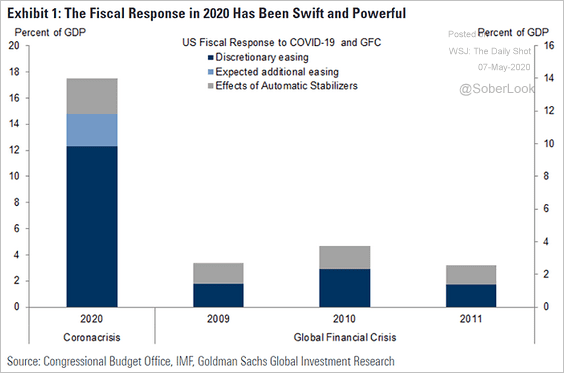
7. As we saw last week (#6 here), the US fiscal response to the pandemic has been much larger and faster than it was after the financial crisis.
 Source: @ISABELNET_SA, @GoldmanSachs
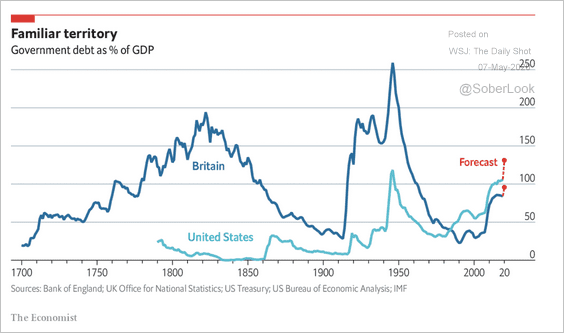
8. This chart compares the US and the UK debt-to-GDP ratio, including forecasts.
 Source: The Economist Read full article
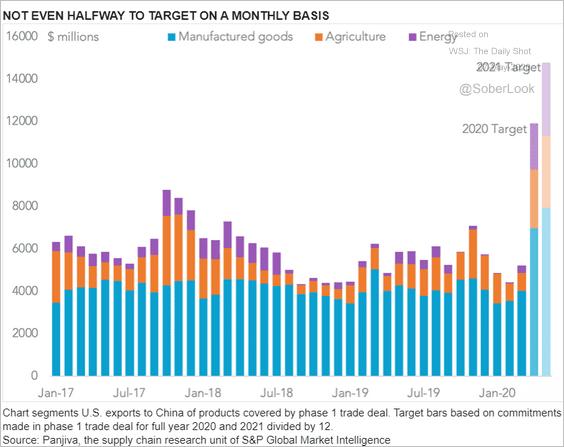
9. The trade deal with China increasingly looks like a pipe dream. The chart shows China’s targeted purchases of US goods.
 Source: S&P Global Market Intelligence
The United Kingdom
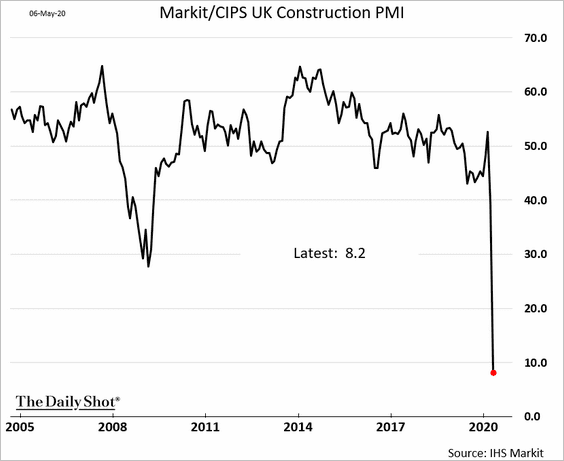
1. Construction activity ground to a halt last month.
2. While the composite PMI already shows a massive GDP decline, …
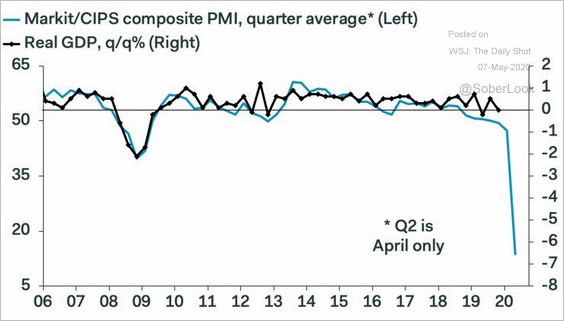 Source: Pantheon Macroeconomics
The actual contraction could be even worse (it’s a nonlinear relationship).
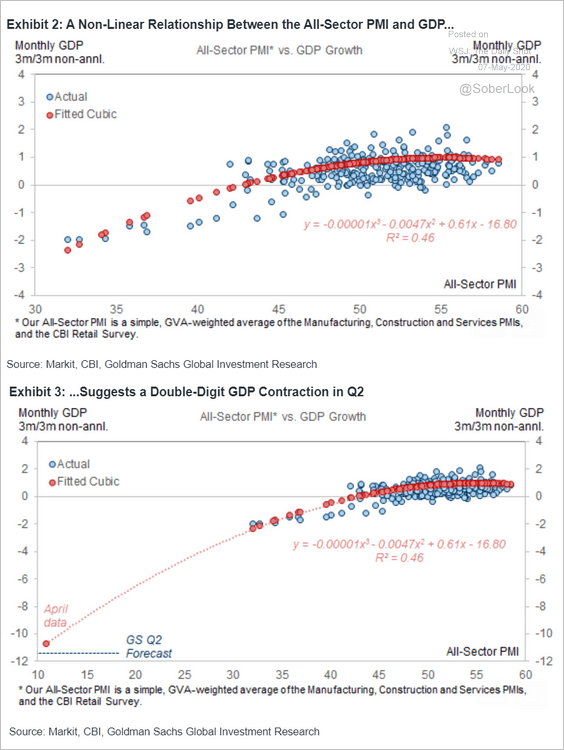 Source: Goldman Sachs
——————–
3. Without UK schools reopening, there is little hope for recovery.
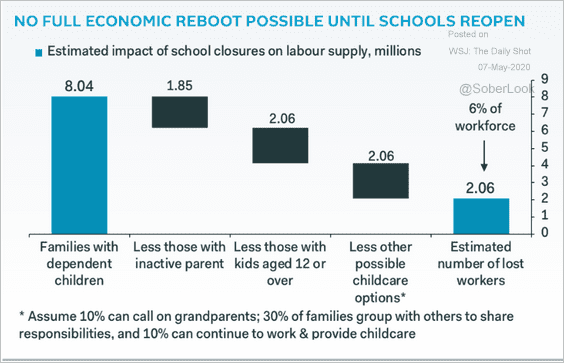 Source: Pantheon Macroeconomics
4. Policy uncertainty is rising, especially with Brexit back on the radar.
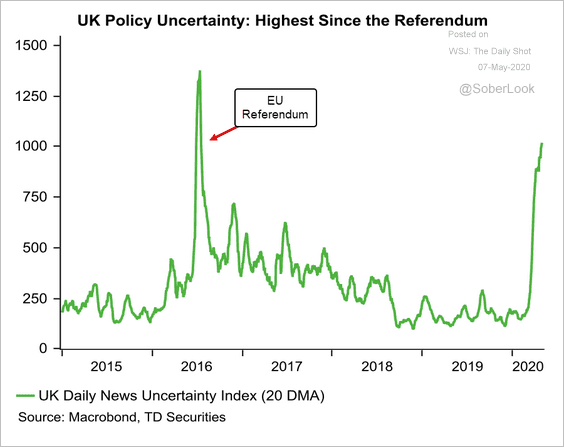 Source: TD Securities
5. BoE’s quantitative easing is absorbing most gilts issued this year.
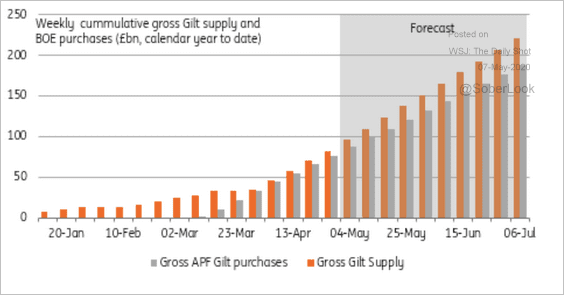 Source: ING
The Eurozone
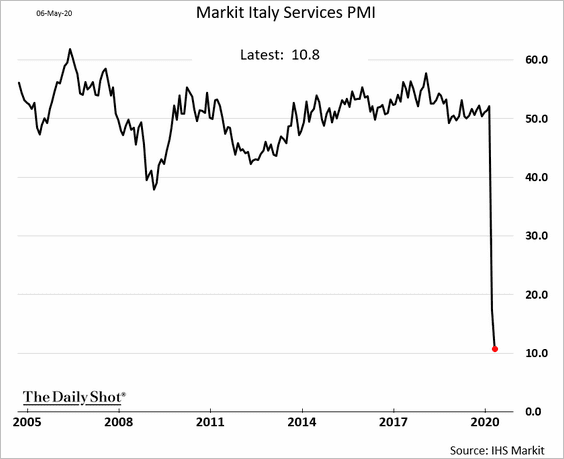
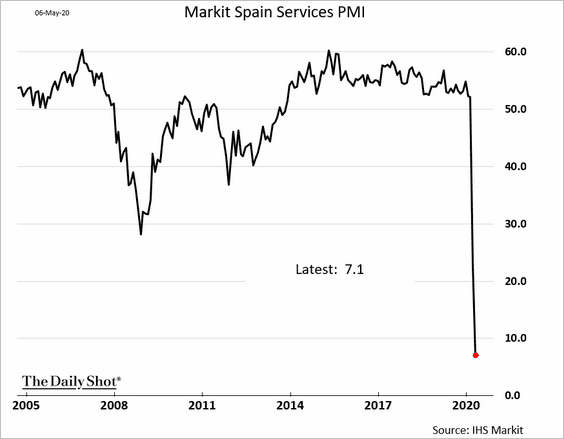
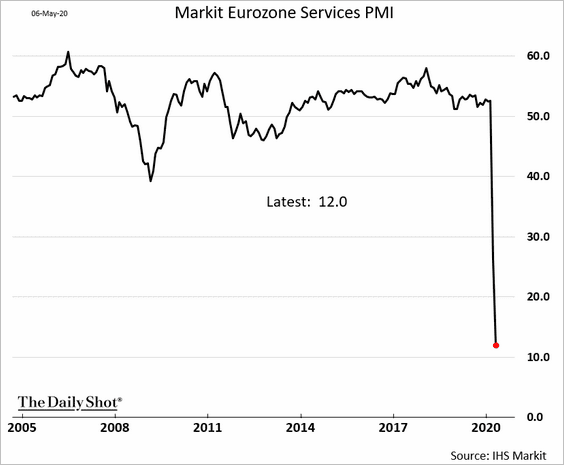
1. The euro-area service sector has undergone devastation not seen in the post-WW-II era. These have been the lowest readings ever recorded by Markit PMI globally. Surely, this is the bottom.
• Italy:
• Spain:
• The Eurozone:
——————–
2. Retail sales crashed in March.
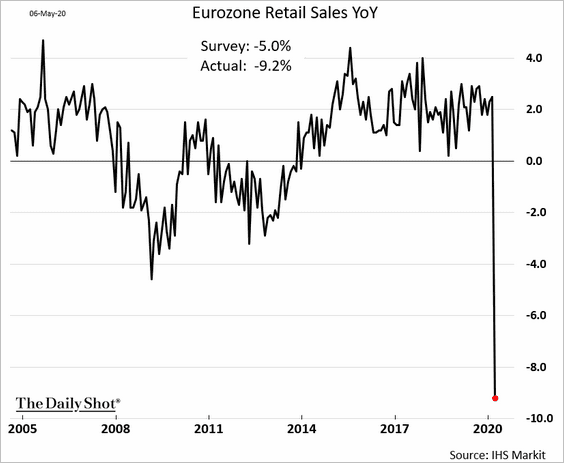
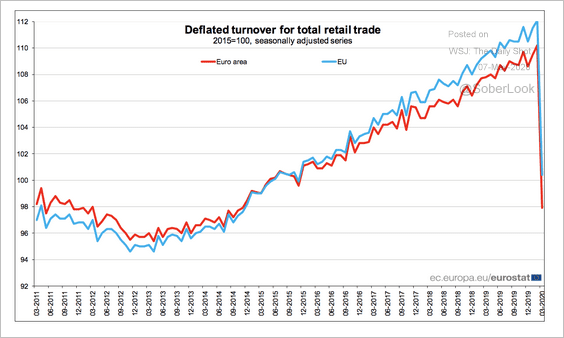 Source: European Commission Read full article
Here is food vs. everything else.
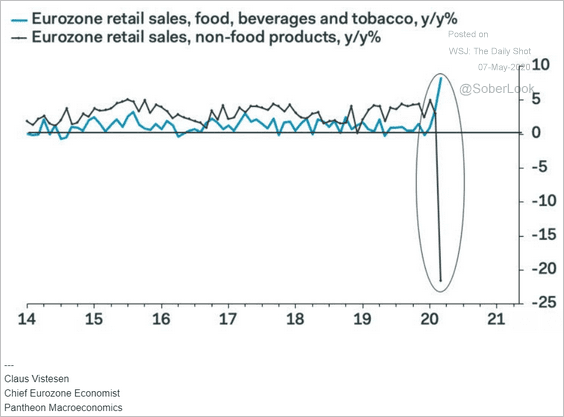 Source: Pantheon Macroeconomics
——————–
3. The euro-area savings ratio likely spiked this year to the highest level in decades.
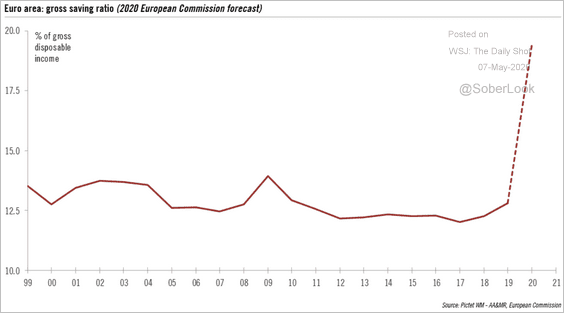 Source: @nghrbi
4. Next, we have some GDP forecasts.
• 2020 and 2021:
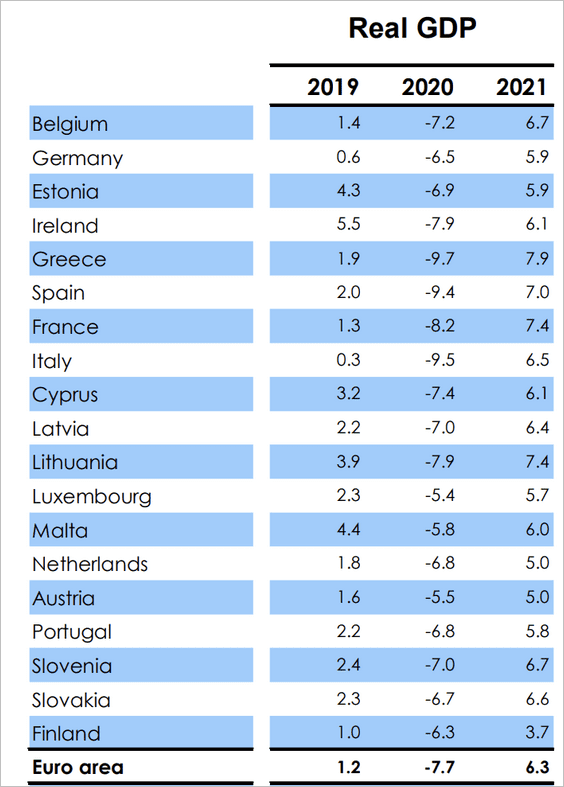 Source: European Commission Read full article
• Germany, France, Italy, and Spain:
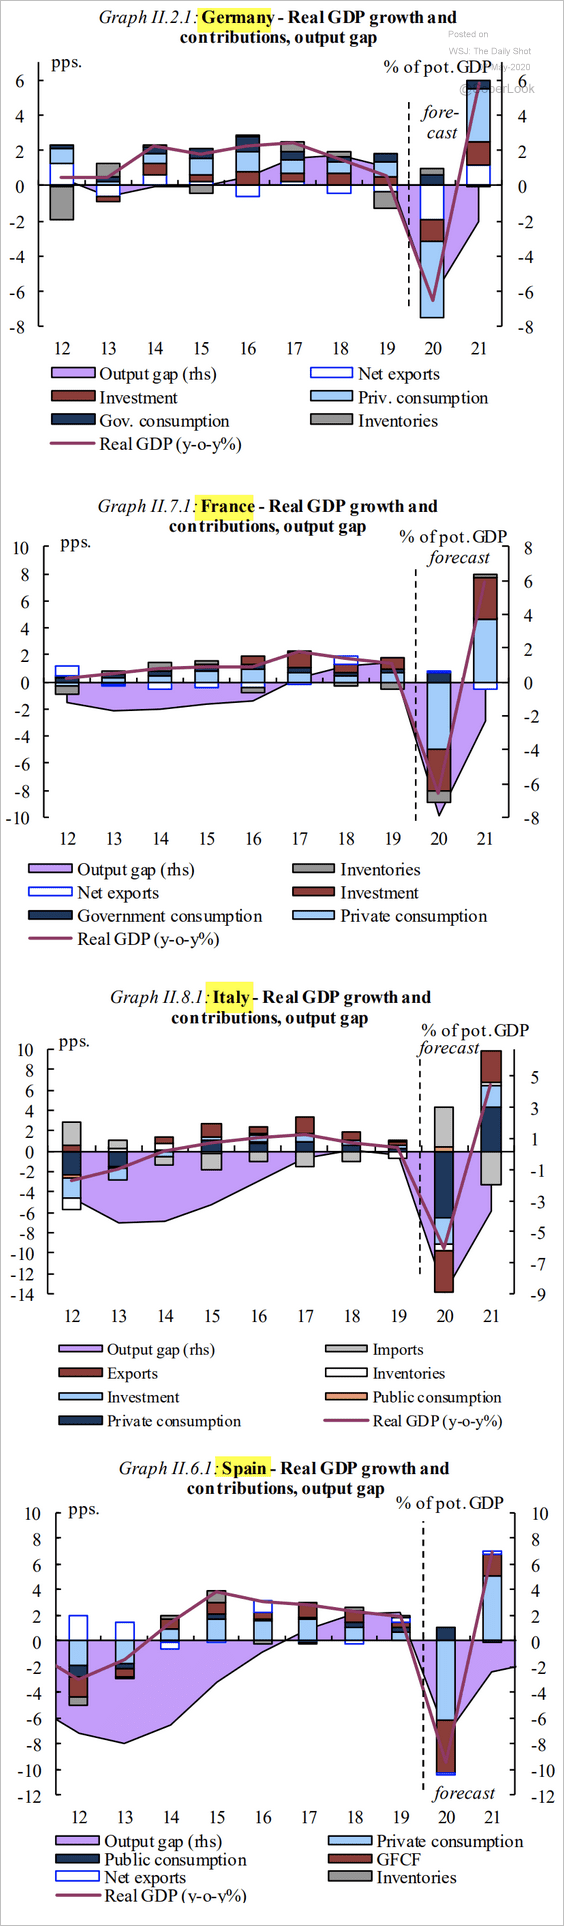 Source: European Commission Read full article
• Here is a long-term trend in the French GDP growth rate.
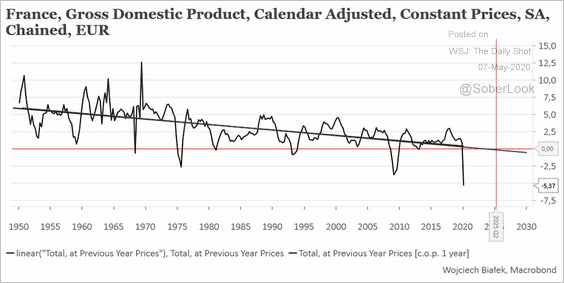 Source: @wb_kNOw_FUTURE
——————–
5. The euro-area government debt-to-GDP ratio is expected to increase to 102.5%.
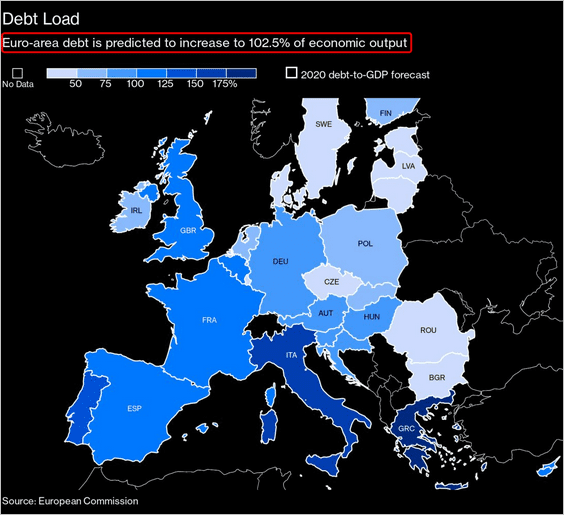 Source: @BloombergQuint Read full article
6. The euro hit the lowest level since 2016 against the yen.
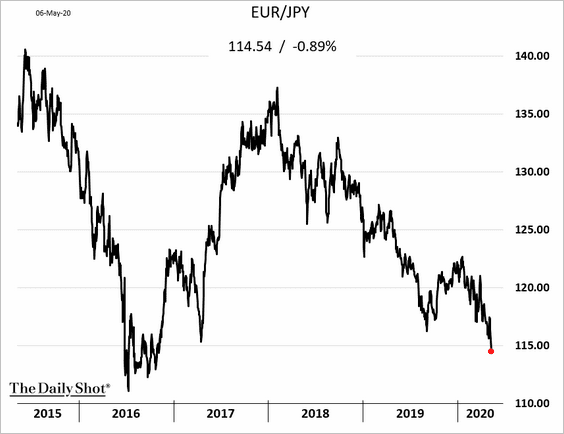 h/t Robert Fullem
Asia – Pacific
1. South Korea’s corporate earnings are dependent on exports.
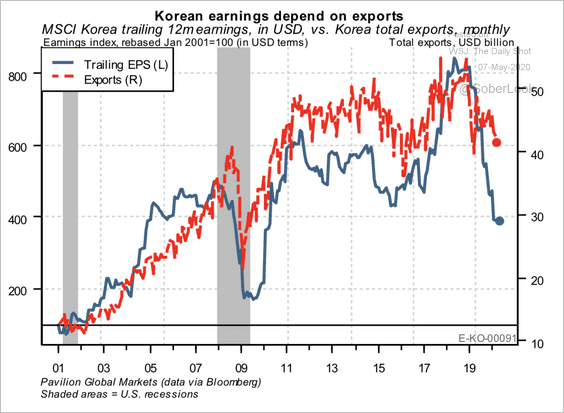 Source: Pavilion Global Markets
The nation’s unemployment rate is about to spike.
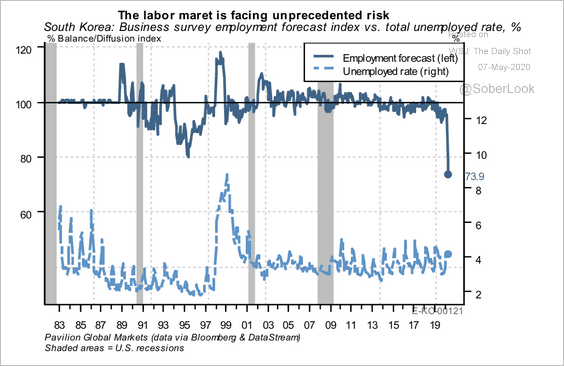 Source: Pavilion Global Markets
——————–
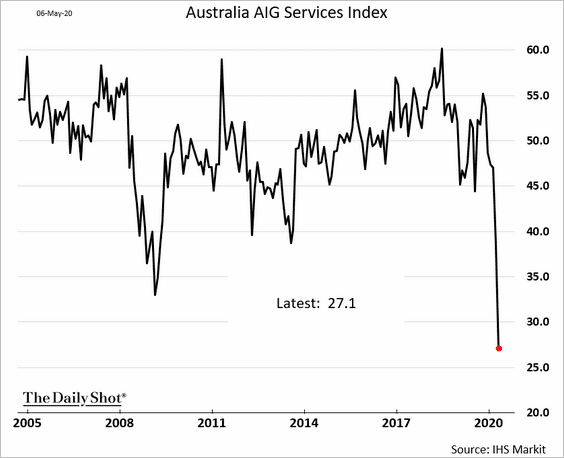
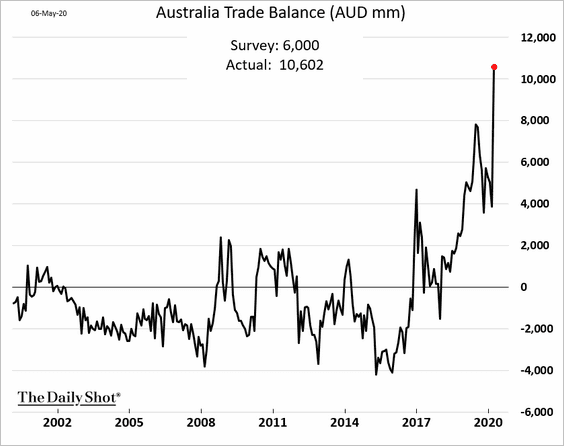
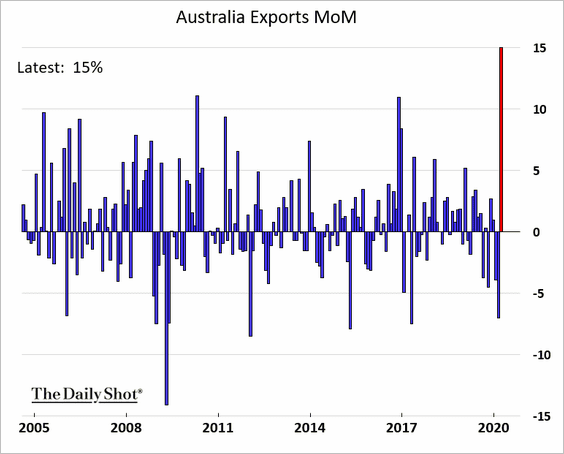
2. Next, we have a couple of updates on Australia.
• The AIG service-sector index is at the lowest level on record.
• Trade surplus hit a record high as exports spiked (second chart). Part of the increase was due to iron ore shipments delayed by the lockdown.
This chart shows the tourism service trade balance.
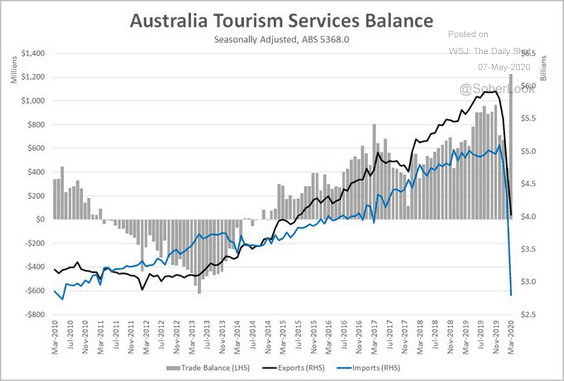 Source: @Scutty
China
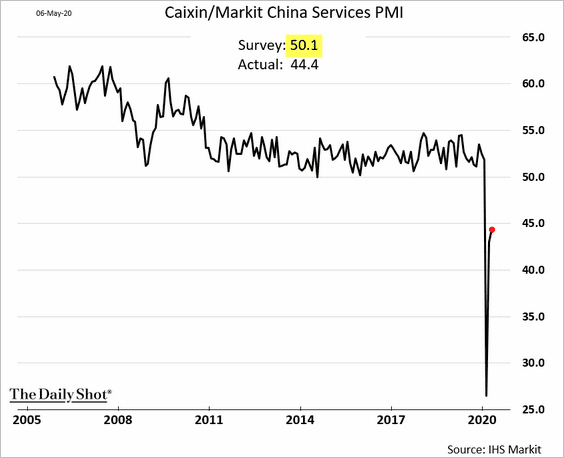
1. China’s service-sector remained in contraction last month (PMI < 50). Economists expected stabilization.
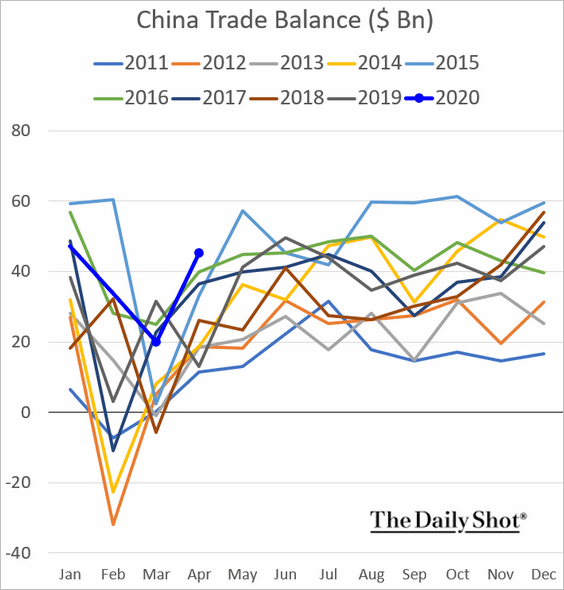
2. Exports unexpectedly increased, and trade surplus climbed (second chart).
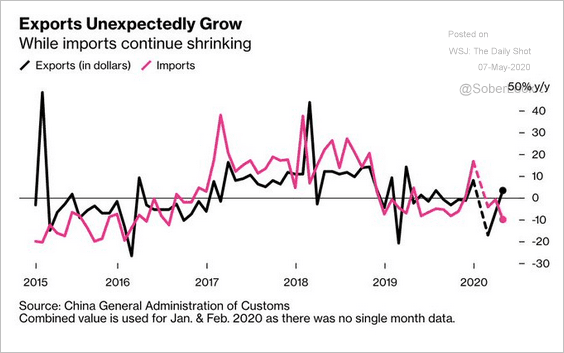 Source: @markets Read full article
——————–
3. Economists continue to downgrade their 2020 GDP forecasts.
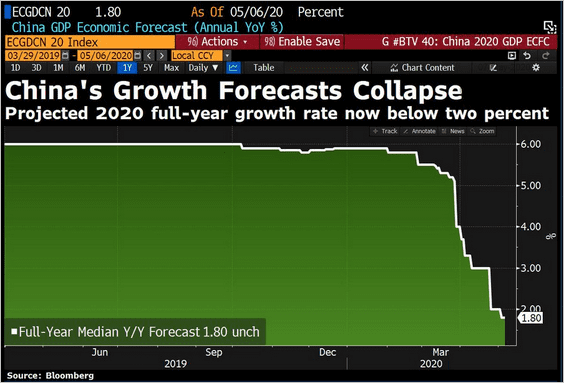 Source: @DavidInglesTV
4. According to Pantheon Macroeconomics, China’s fiscal deficit probably blew out in the first quarter.
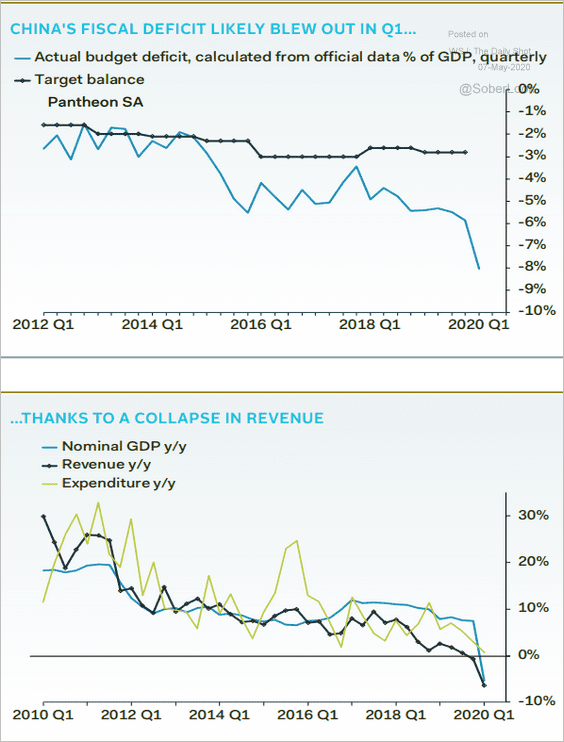 Source: Pantheon Macroeconomics
Emerging Markets
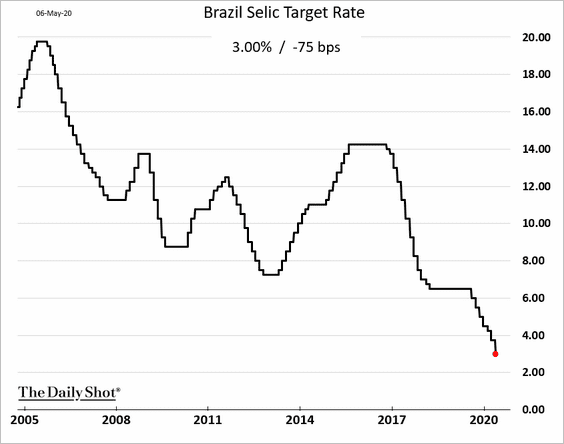
1. Let’s begin with Brazil.
• The central bank cut rates aggressively, with more easing on the way.
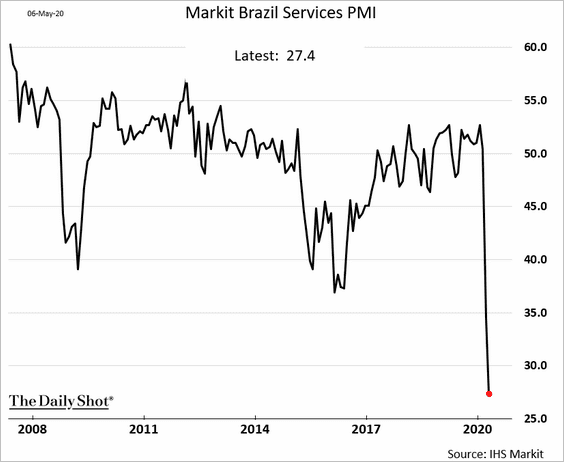
• Service sector ground to a halt last month.
• The number of new infections continues to accelerate.
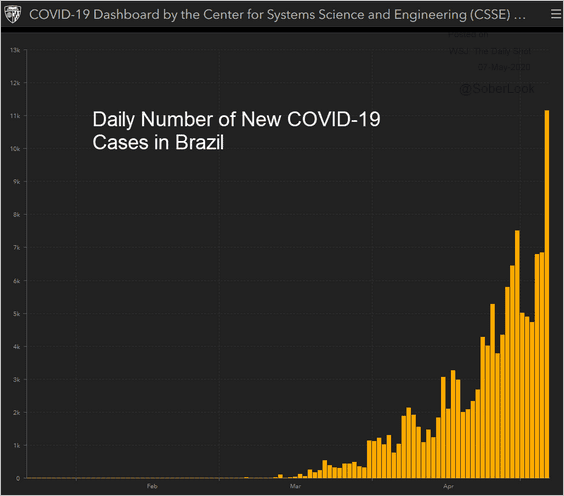 Source: JHU CSSE
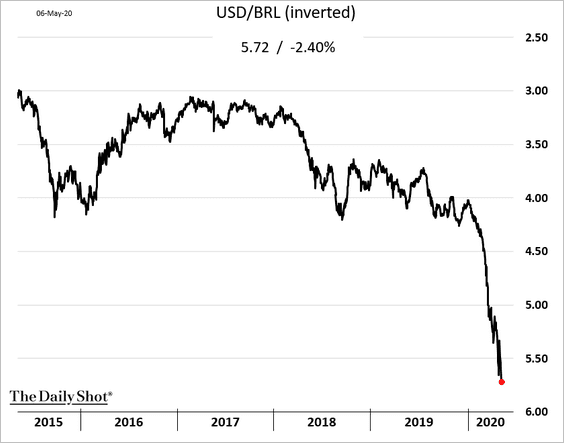
• The Brazilian real hit another record low.
——————–
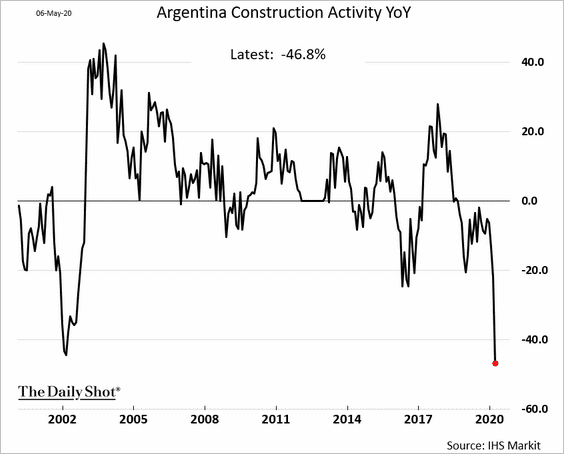
2. Argentina’s decline in construction activity was worse than what we saw after the 2001 debt default.
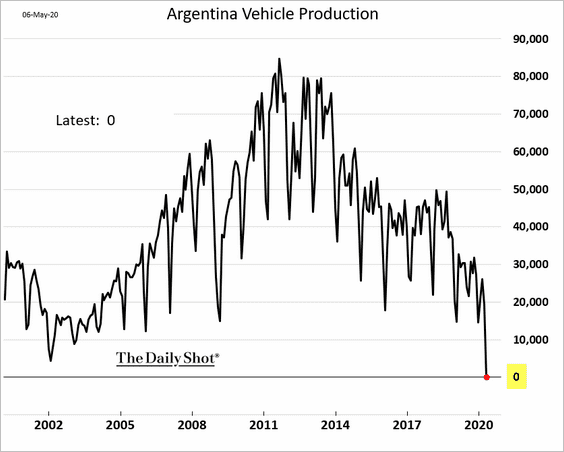
No vehicles were made last month.
——————–
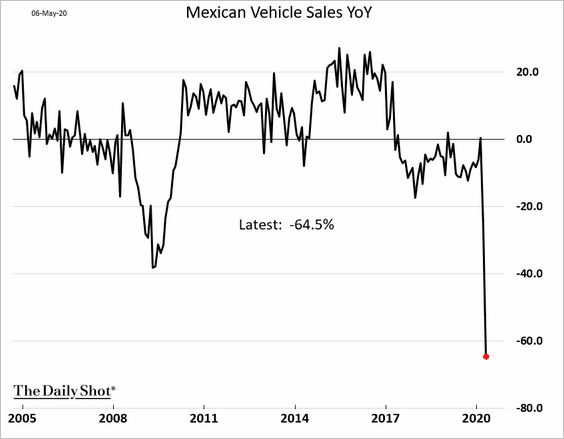
3. Mexico’s car sales tumbled but did not completely collapse.
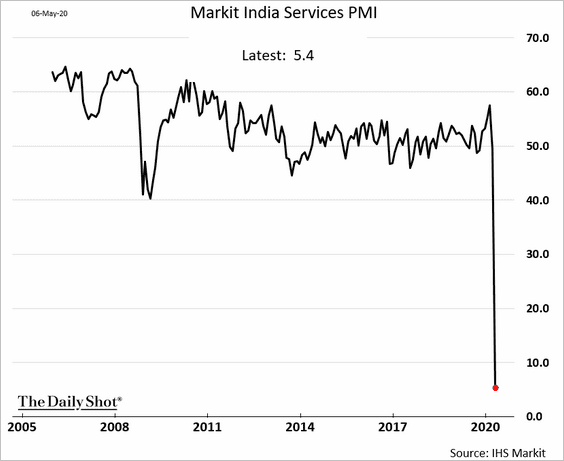
4. Service-sector activity in India stopped in April.
 Source: The Economic Times Read full article
5. Which countries rely most on remittances?
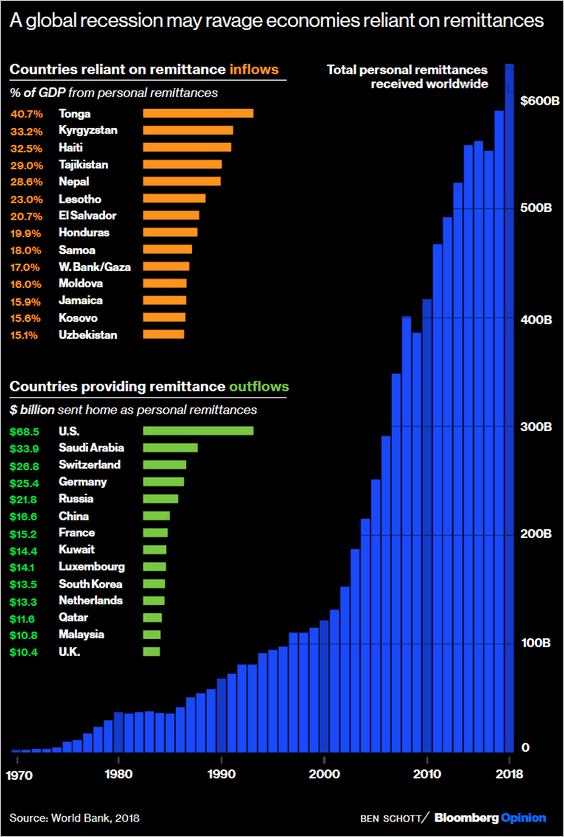 Source: @bopinion Read full article
Energy
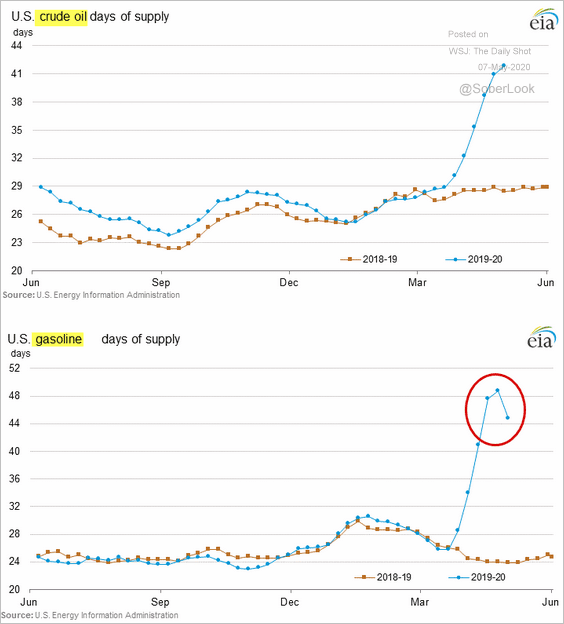
1. US gasoline demand is recovering (second chart).
 Source: Princeton Energy Advisors
• The spread between gasoline and diesel has become positive, which is also signaling stronger demand.
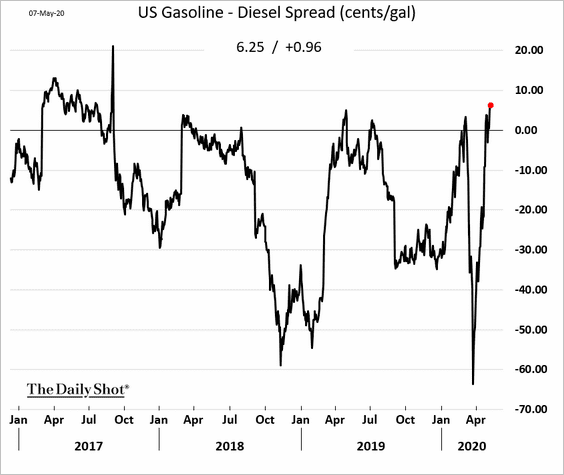 Source: Olivia Raimonde
• Gasoline inventories appear to have peaked.
• Refinery inputs have bottomed.
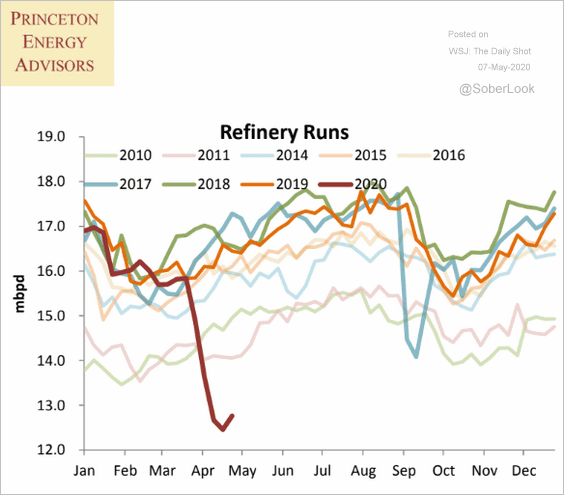 Source: Princeton Energy Advisors
——————–
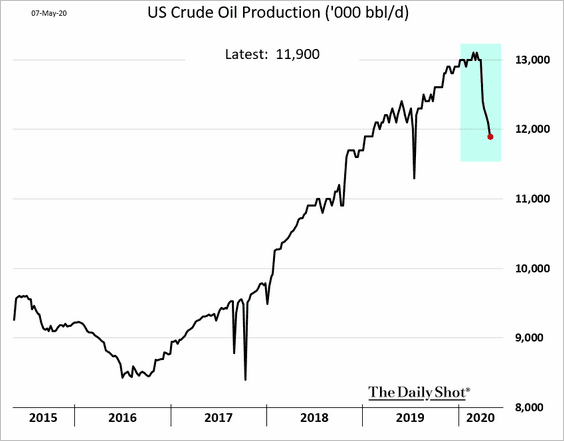
2. US crude oil production continues to slow.
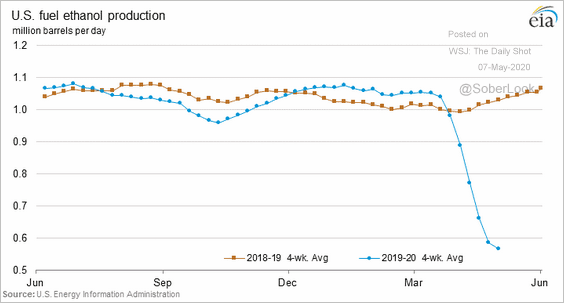
3. Here is the 4-week average of fuel ethanol production.
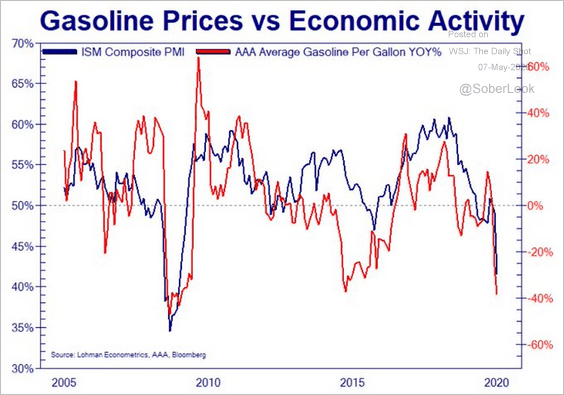
4. Gasoline prices tend to be correlated with US economic activity.
 Source: @Not_Jim_Cramer
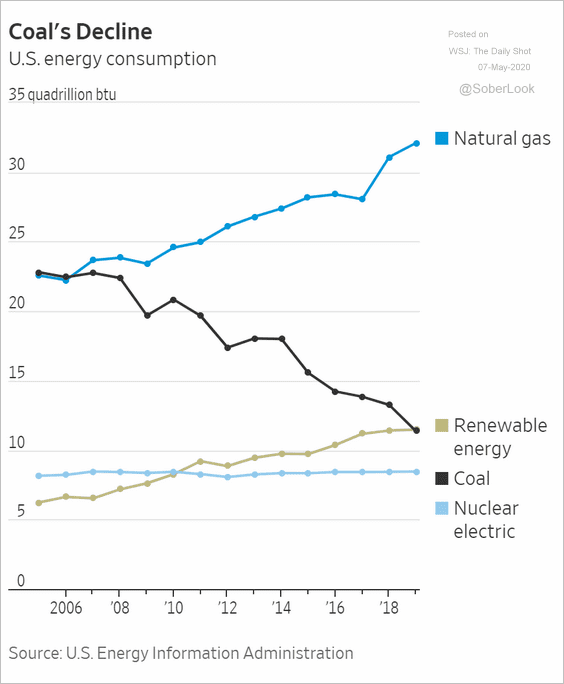
5. This chart shows US energy consumption by source.
 Source: @WSJ Read full article
Equities
1. Based on corporate earnings calls, financing concerns in April were worse than in 2008.
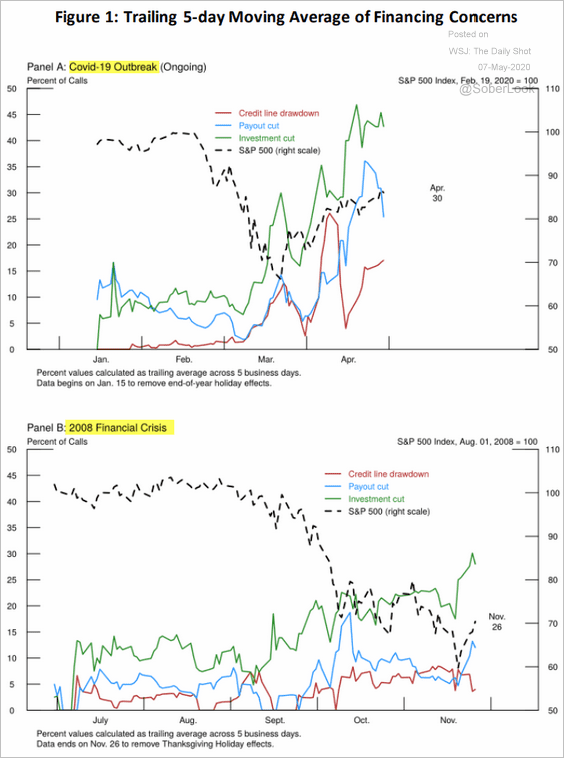 Source: Andrew Chen, Jie Yang (Federal Reserve Board) Read full article
2. Earnings sentiment appears to have bottomed.
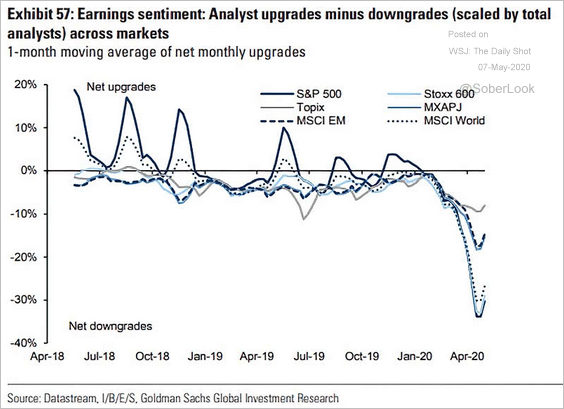 Source: @ISABELNET_SA, @GoldmanSachs
3. US markets have outperformed peers on a stock-to-bond ratio basis since 2009.
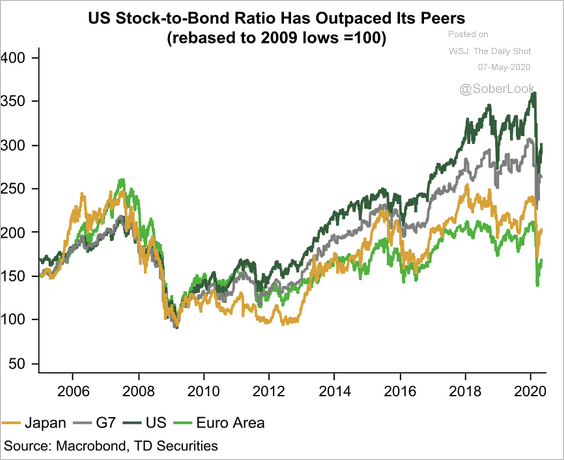 Source: TD Securities
4. The equal-weighted S&P 500 performance is on par with the MSCI World ex-US Index this year (mega-cap tech shares have been driving US outperformance).
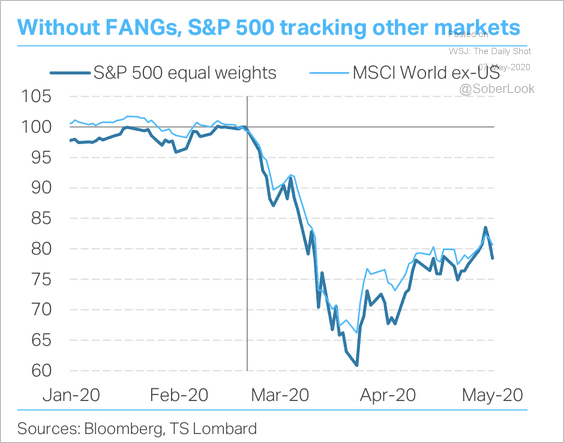 Source: TS Lombard
5. This chart shows the relative performance (2 years) of S&P 500 (SPX), Russell 2000 (RTY), transportation shares (TRAN), Nasdaq 100 (NDX), and Brent crude oil (CO1).
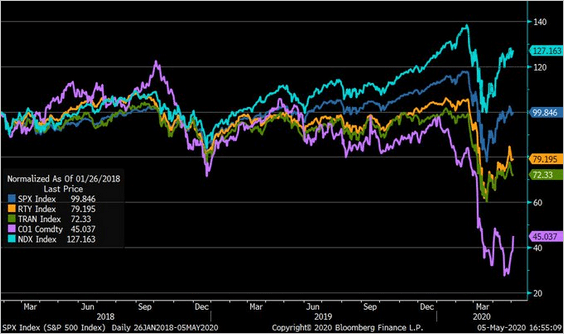 Source: @LizAnnSonders
6. Small-cap staples and utilities (defensives) have outperformed since the start of the 2020 correction, according to BofA.
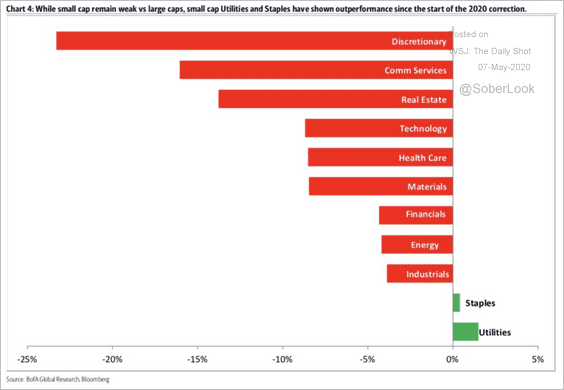 Source: BofA Merrill Lynch Global Research
7. Large-cap quant funds have underperformed “fundamental” funds in the first quarter.
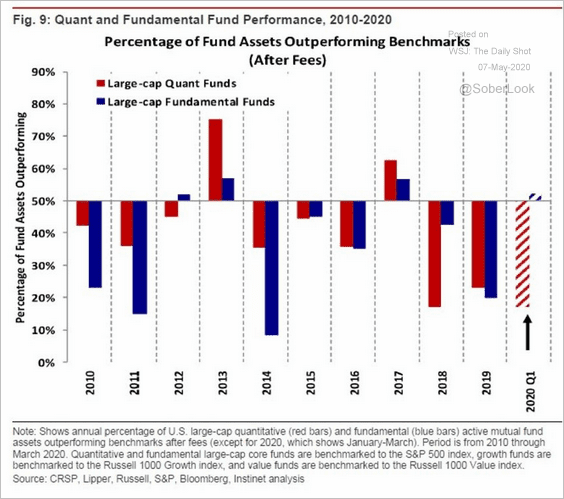 Source: Nomura Instinet, @markets Read full article
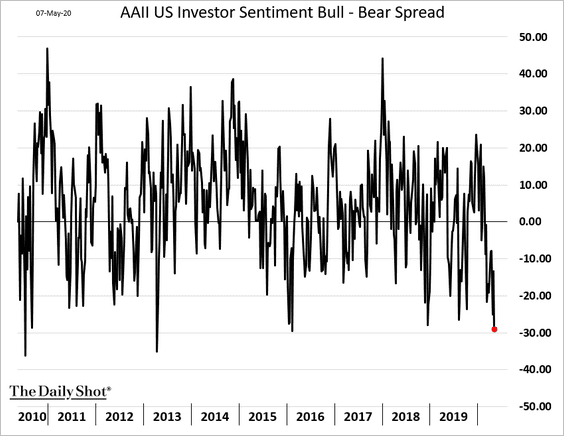
8. The AAII Bull-Bear spread hit the lowest level since 2016.
9. Analysts remain concerned about US equity valuations.
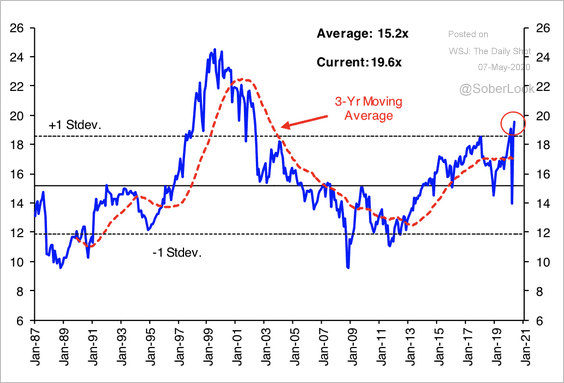 Source: Hugo Ste-Marie, Portfolio & Quantitative Strategy Global Equity Research, Scotia Capital
This chart shows the current 12-month forward P/E vs. long-term averages by sector.
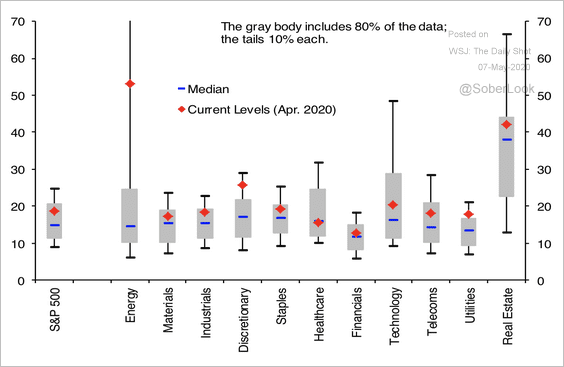 Source: Hugo Ste-Marie, Portfolio & Quantitative Strategy Global Equity Research, Scotia Capital
——————–
10. Here is the monthly US equities trading volume.
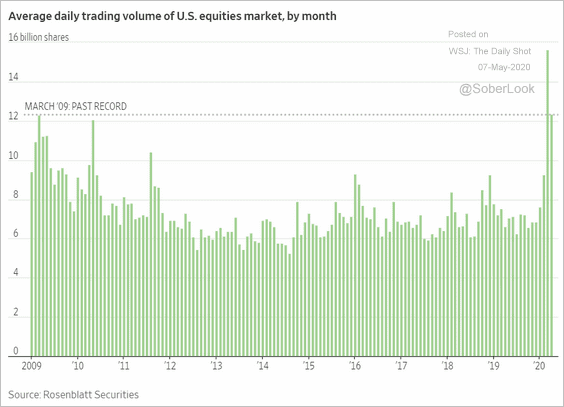 Source: @WSJ Read full article
Alternatives
1. This chart shows the Venture Capital Barometer.
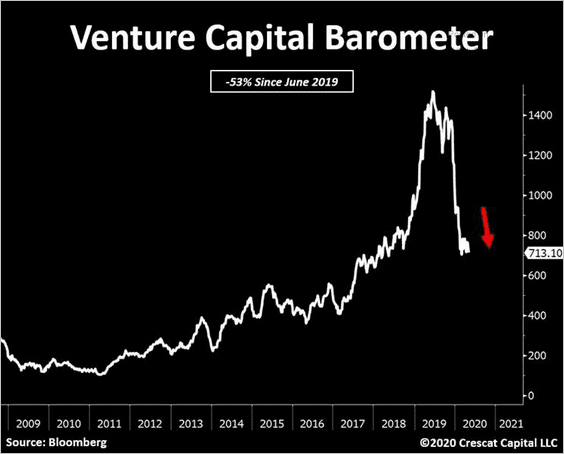 Source: @TaviCosta
2. Private equity and private credit dry powder keeps climbing.
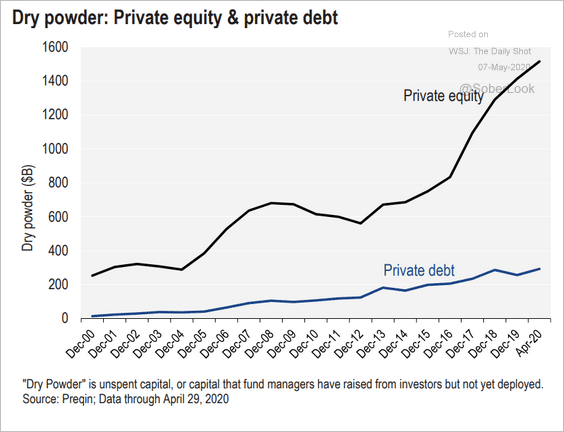 Source: LCD, S&P Global Market Intelligence
Credit
1. The chart below shows the monthly issuance of leveraged finance debt.
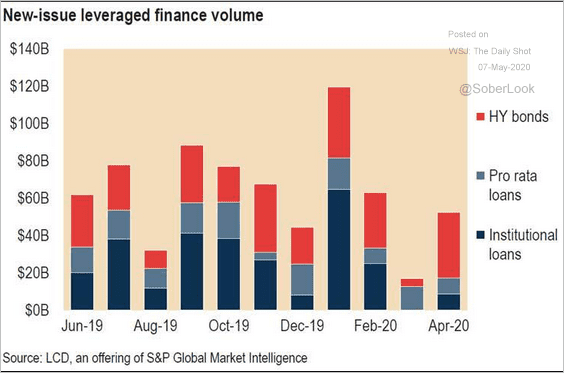 Source: LCD, S&P Global Market Intelligence
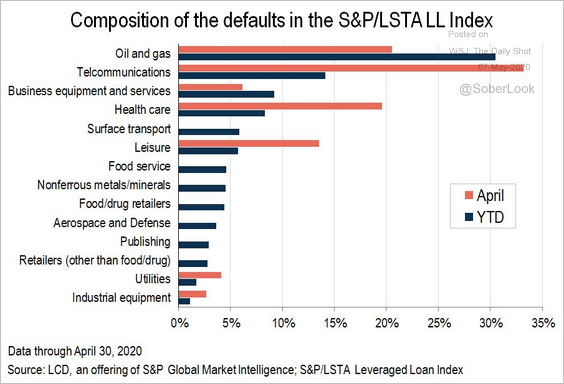
2. Next, we have some updates on leveraged loans.
• Default rates:
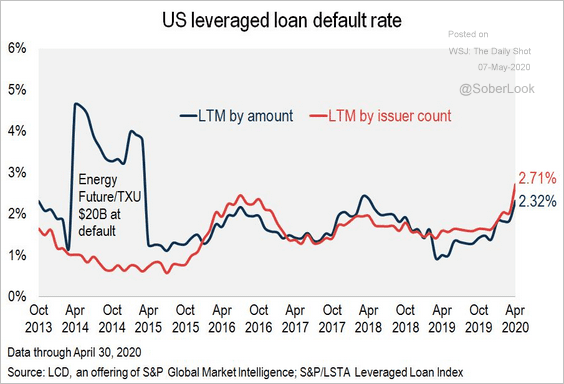 Source: S&P Global Market Intelligence Read full article
 Source: S&P Global Market Intelligence Read full article
• Returns:
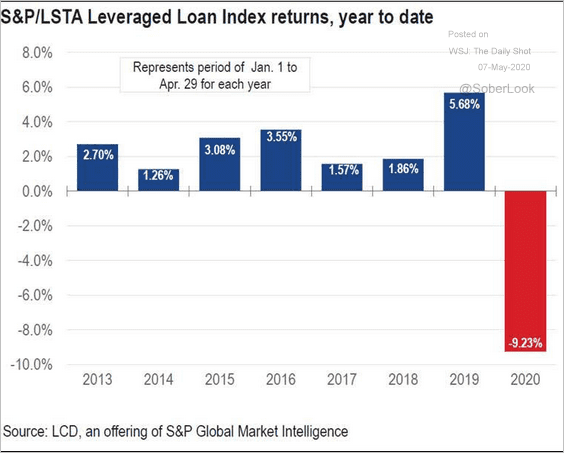 Source: LCD, S&P Global Market Intelligence
• BB- vs. B-rated loan prices:
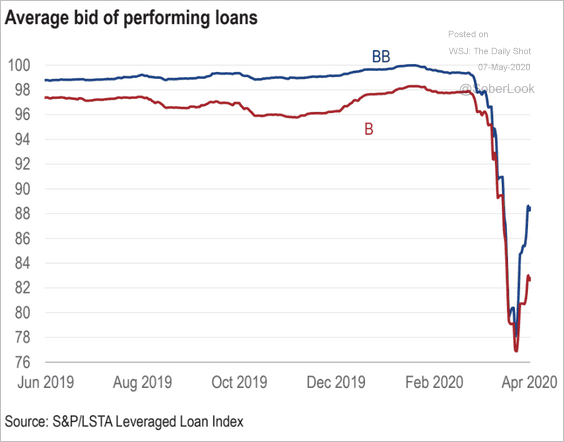 Source: LCD, S&P Global Market Intelligence
• The total leveraged loan market:
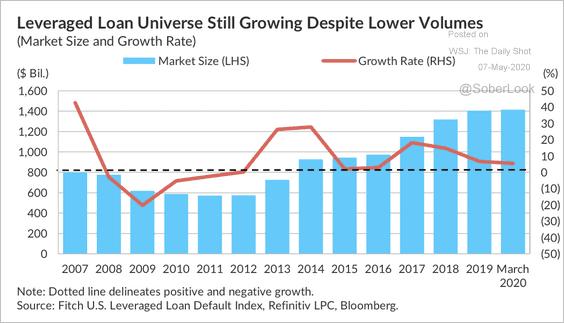 Source: Fitch Ratings
• Loan funds AUM:
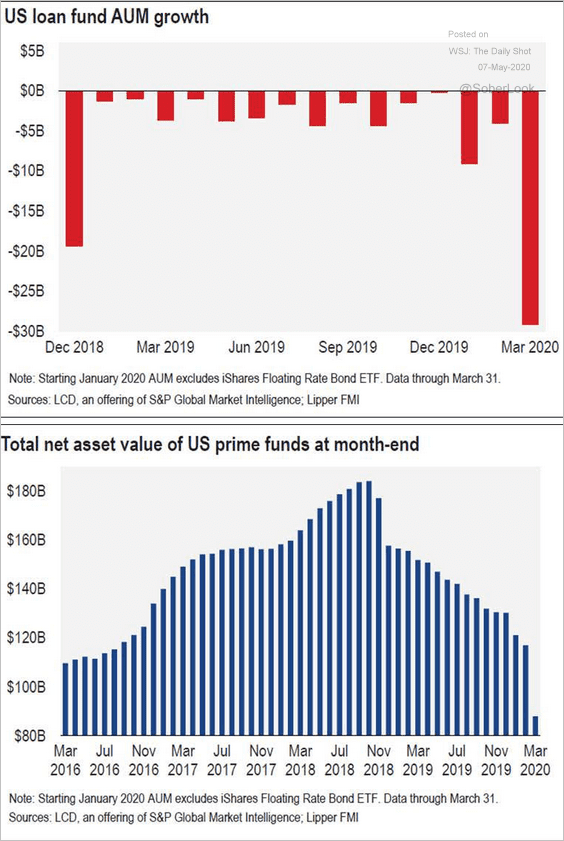 Source: LCD, S&P Global Market Intelligence
——————–
3. CCC-rated bonds have widened their underperformance.
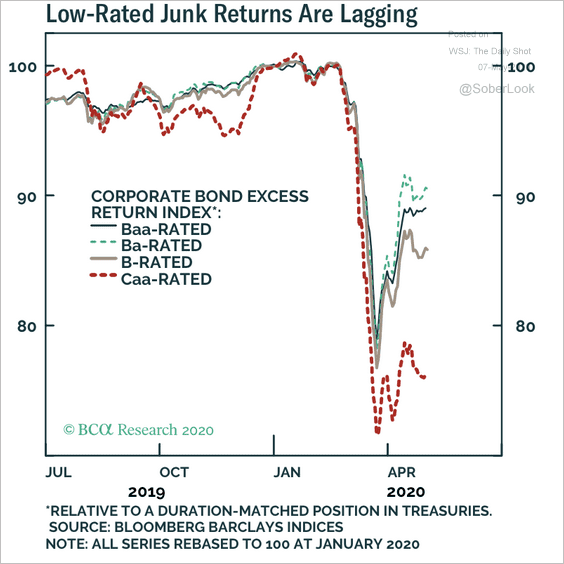 Source: BCA Research
4. This chart shows the relative performance of Europen corporate bonds.
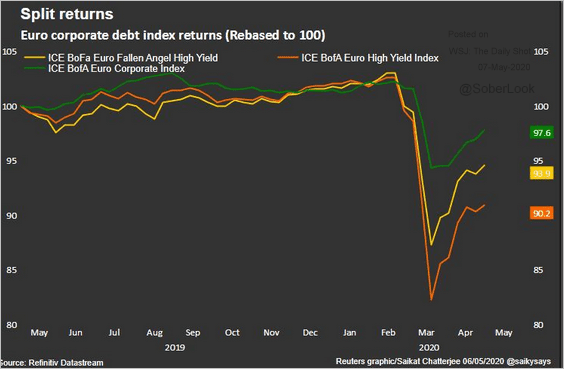 Source: Reuters Read full article
5. The largest high-yield bond ETF is getting some inflows.
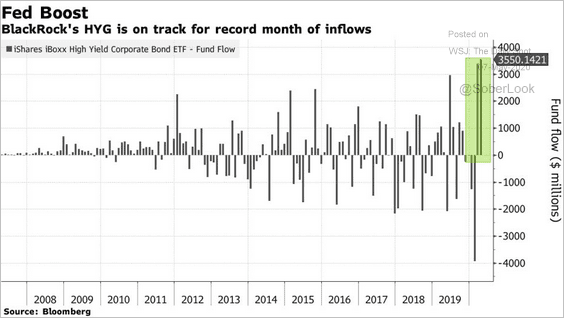 Source: @markets Read full article
Rates
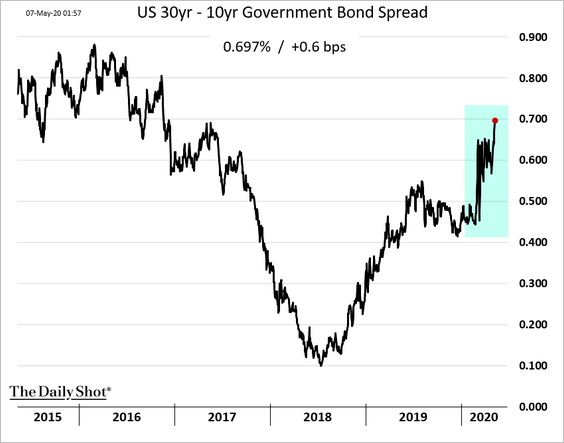
1. Is the massive US debt issuance starting to weigh on the Treasury market?
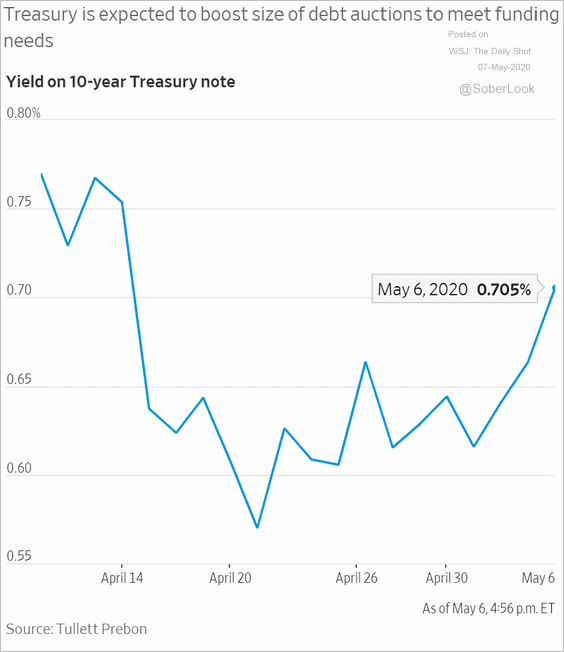 Source: @WSJ Read full article
The expected supply increase, including the introduction of the 20-year Treasury, nudged the 30-year yield higher. Below is the spread between the 30yr and the 10yr Treasuries.
——————–
2. Money market funds have been absorbing the increased T-Bill supply.
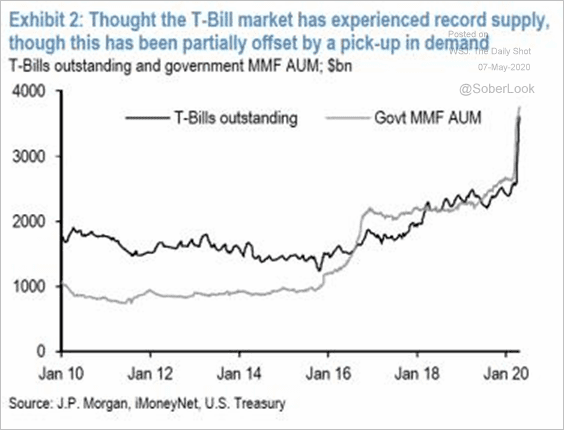 Source: JP Morgan, {ht} Adam Kneller
3. Here is the evolution of the Fed’s balance sheet composition.
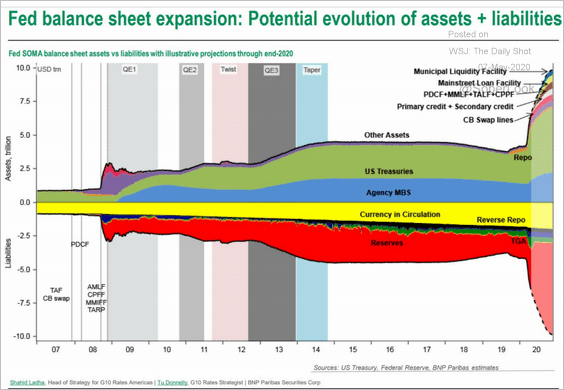 Source: BNP Paribas Securities, {ht} John Coleman
Food for Thought
1. Long-term care users:
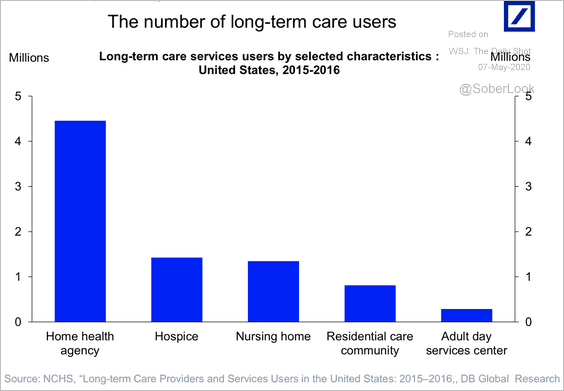 Source: Deutsche Bank Research
2. Seeking non-COVID-19 treatments:
 Source: Morning Consult Read full article
3. Political regimes:
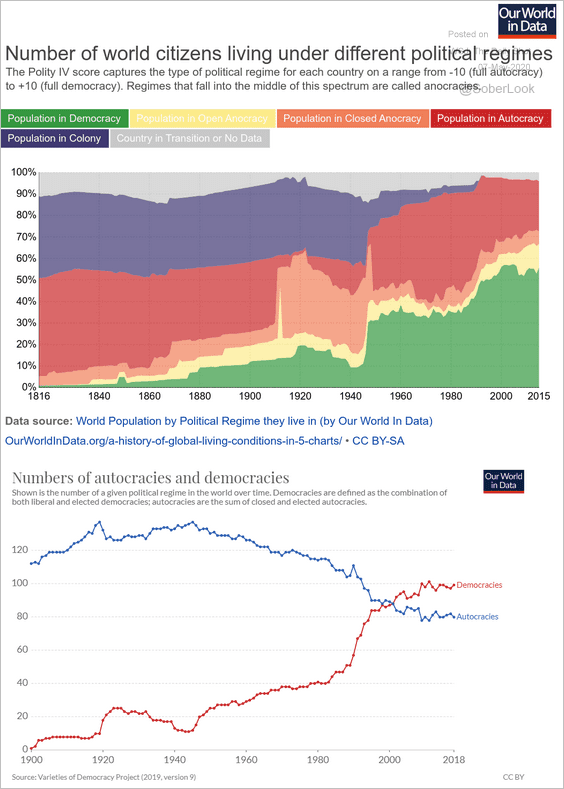 Source: Our World In Data Read full article
4. Trump vs. Biden social media followers:
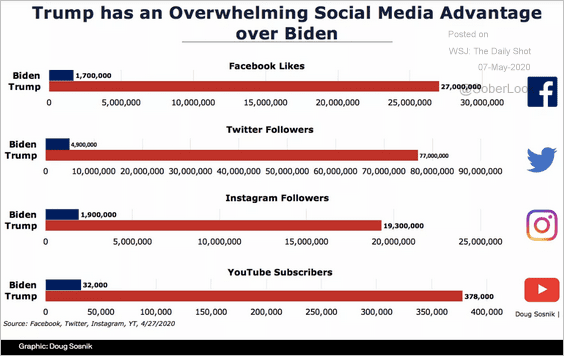 Source: @axios Read full article
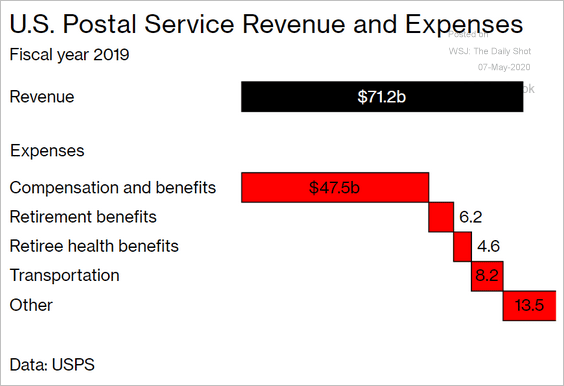
5. US Postal Service volume, revenues/expenses (2 charts):
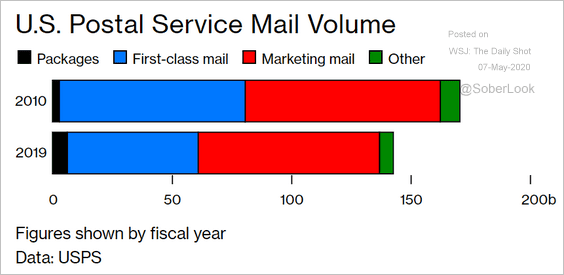 Source: @BW Read full article
 Source: @BW Read full article
——————–
6. Food freight prices:
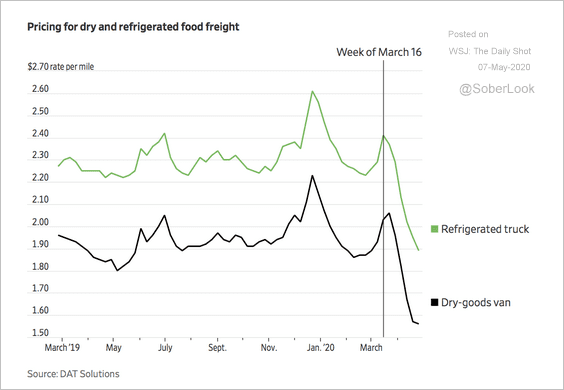 Source: @WSJ Read full article
7. Online searches for “staying in”:
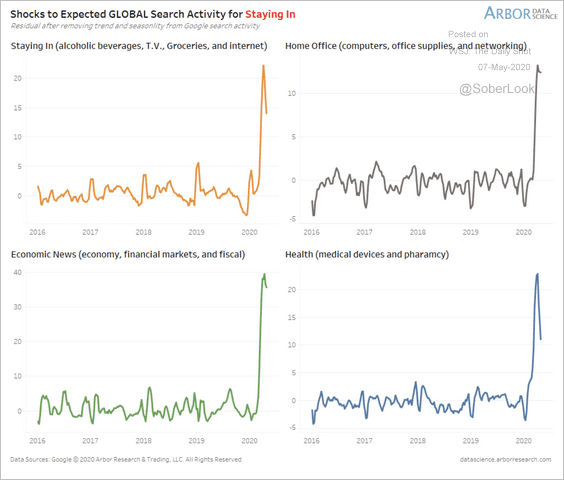 Source: Arbor Research & Trading
vs. going out:
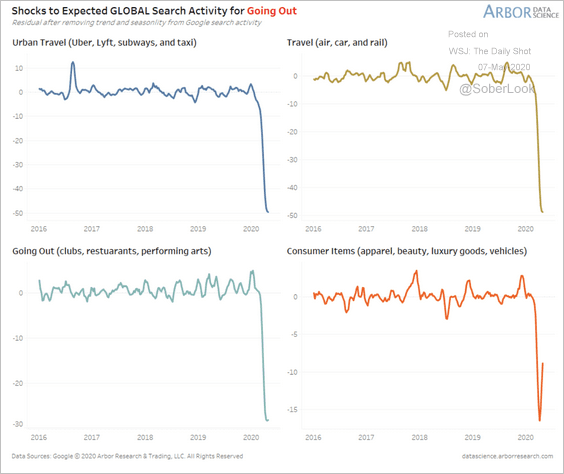 Source: Arbor Research & Trading
——————–