
The Daily Shot: 12-May-20
• The United States
• Canada
• Europe
• Asia – Pacific
• China
• Emerging Markets
• Cryptocurrency
• Commodities
• Energy
• Equities
• Credit
• Rates
• Global Developments
• Food for Thought
The United States
1. Let’s start with some high-frequency data.
• Federal tax receipts continue to slow.
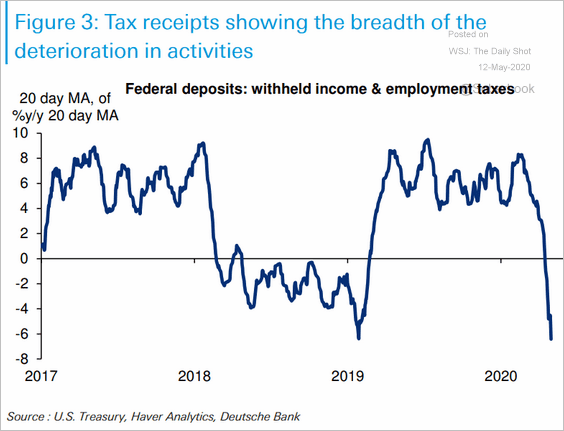 Source: Deutsche Bank Research
• Mobility indicators point to some recovery in activity.
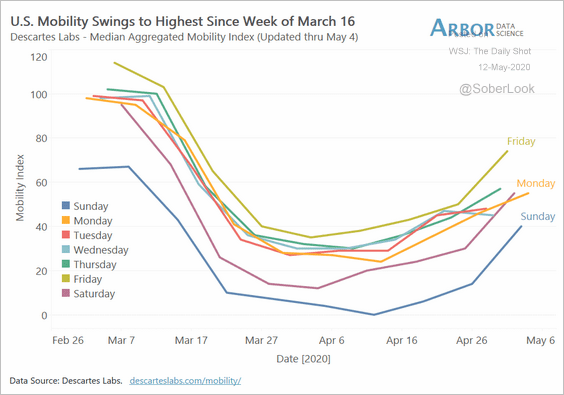 Source: Arbor Research & Trading
Here is road traffic since the beginning of April.
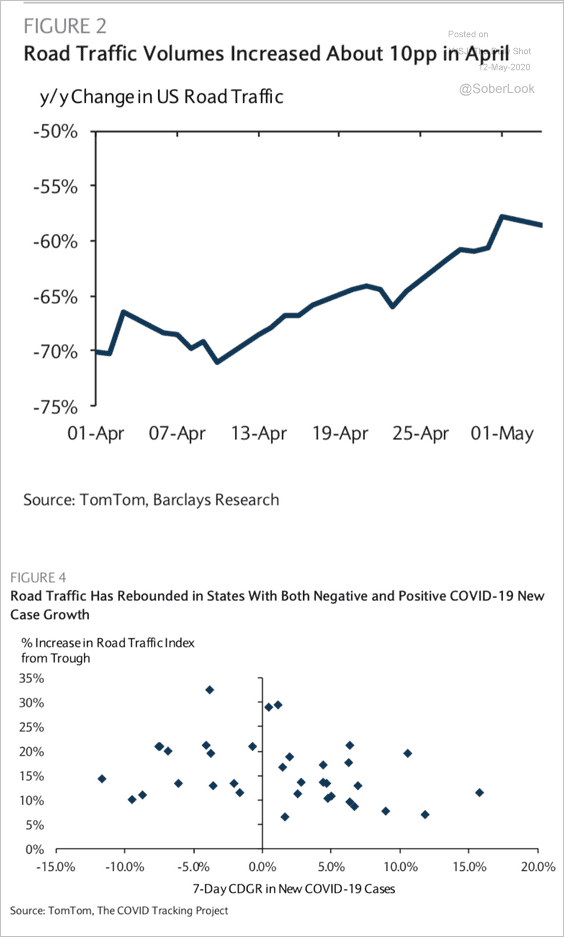 Source: Barclays Research
• Rail freight is rebounding.
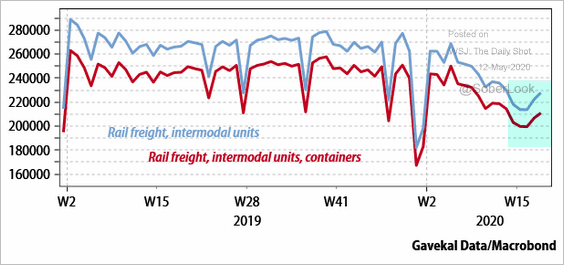 Source: Gavekal
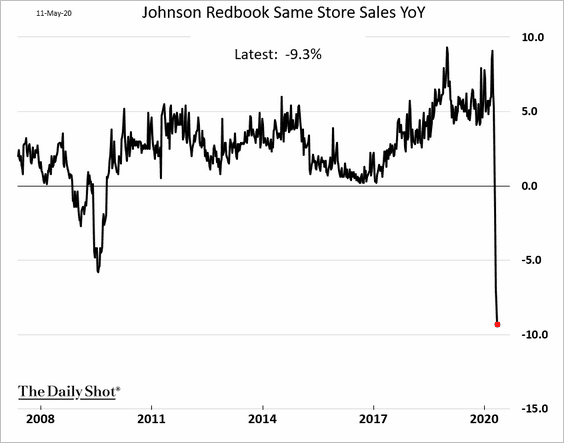
• The Johnson Redbook same-store sales (year-on-year change) is at record lows, but the decline appears to be slowing.
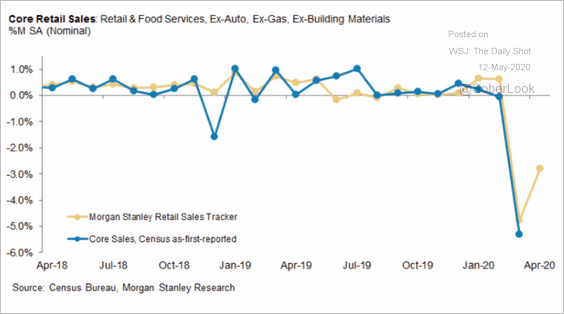
Here is Morgan Stanley’s retail sales tracker.
 Source: Morgan Stanley Research
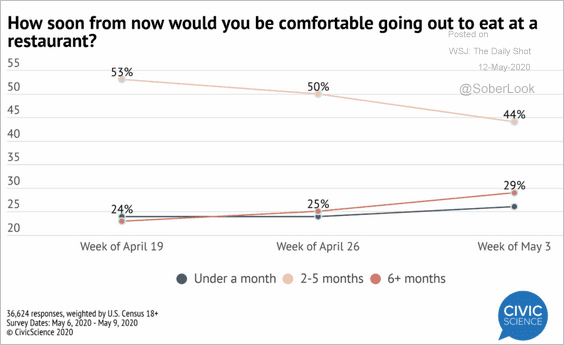
• Consumers remain cautious about spending time in public spaces.
 Source: @CivicScience
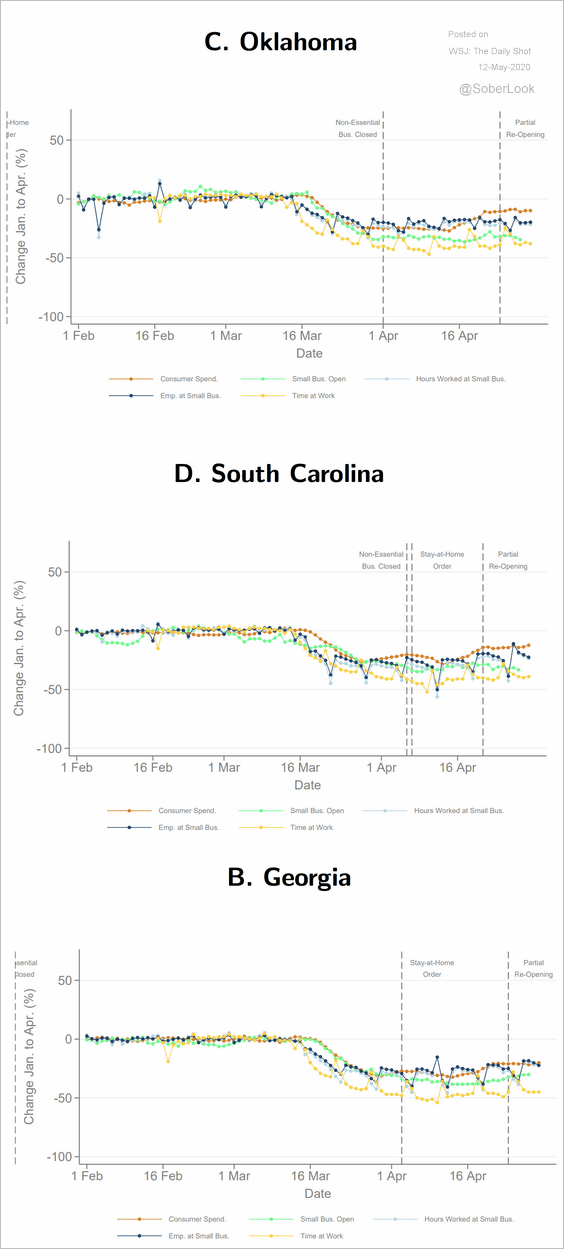
That’s why “reopening” doesn’t necessarily bring about quick improvements in consumer activity. Here are some examples.
 Source: Opportunity Insights Team Read full article
• But confidence is gradually lifting.
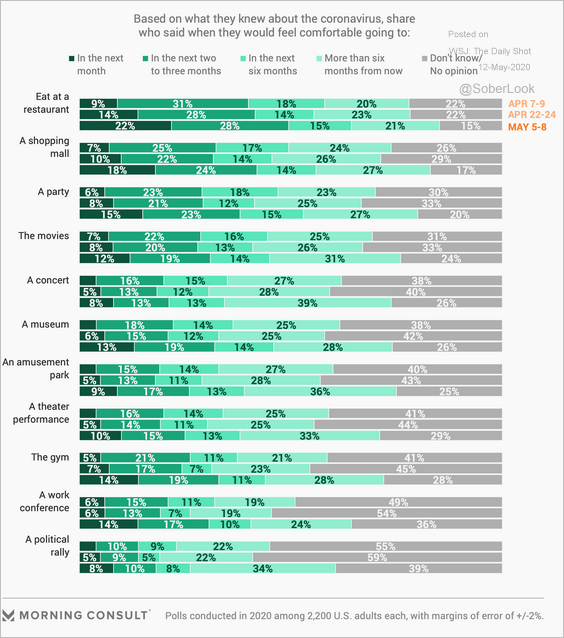 Source: Morning Consult Read full article
• The stock market has been signaling stabilization in economic activity. Here is the ratio of cyclical to defensive sectors.
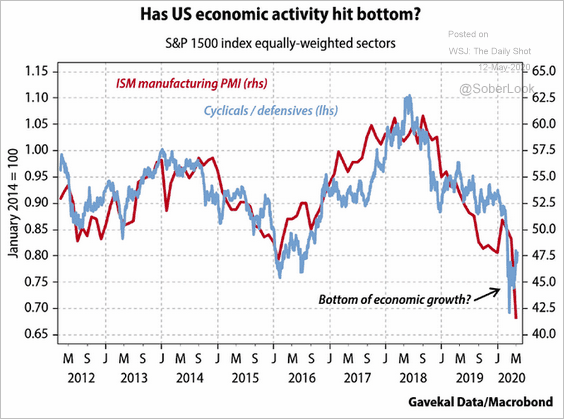 Source: Gavekal
——————–
2. Next, we have some updates on the labor market.
• Low-wage industries were hit particularly hard in April.
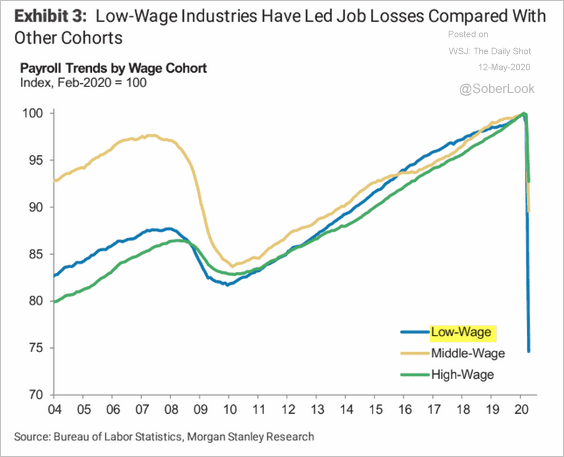 Source: Morgan Stanley Research
• The unemployment rate will climb further.
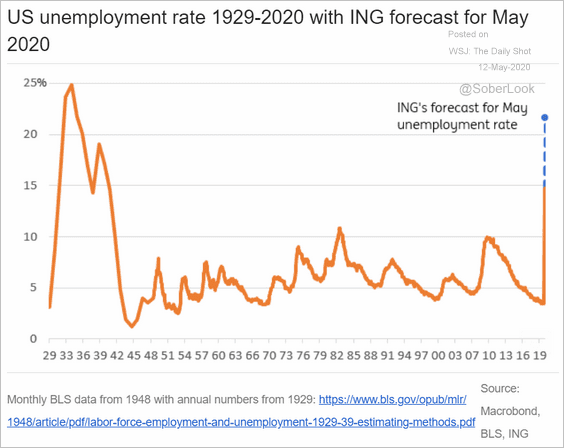 Source: ING
• The percentage of sectors with job gains has collapsed.
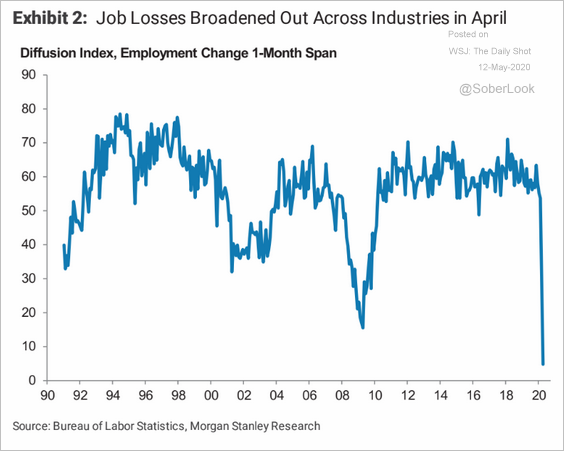 Source: Morgan Stanley Research
——————–
3. Americans have been delaying bill payments.
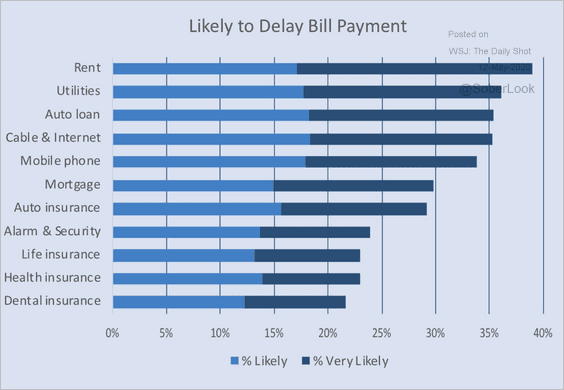 Source: doxo INSIGHTS
And mortgage forbearance rates keep rising, albeit at a slower pace.
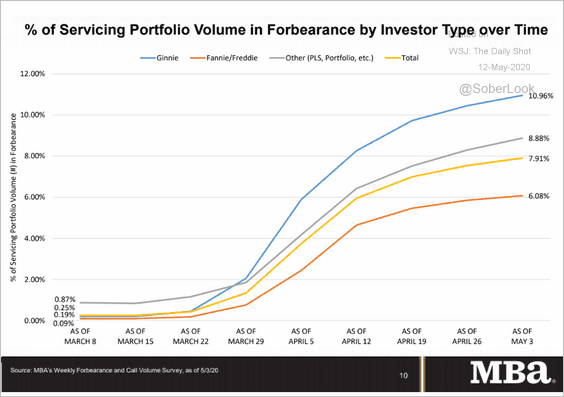 Source: Mortgage Bankers Association
——————–
3. The Paychex April small business employment index hit a record low. Workers’ hours were cut sharply.
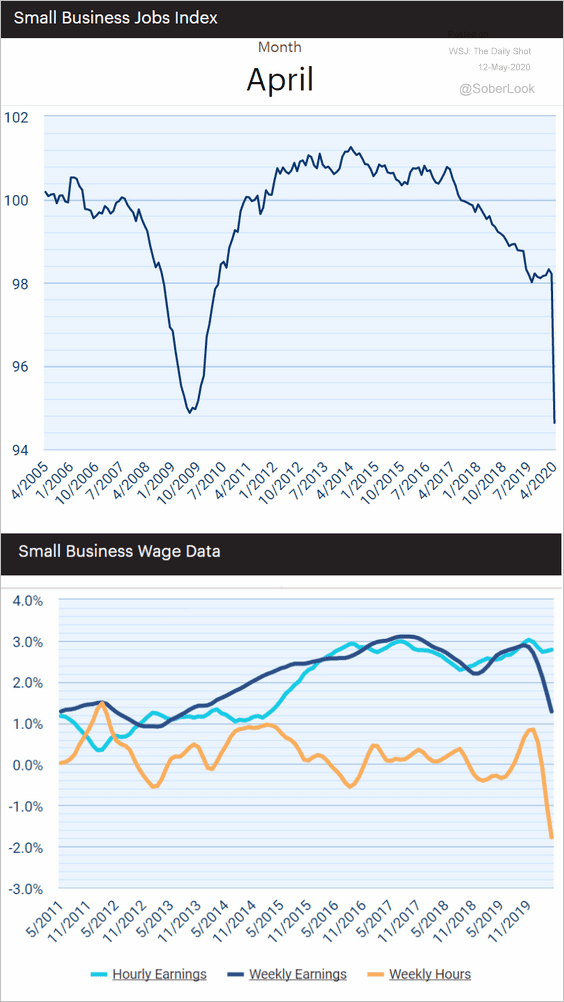 Source: Paychex/IHS Markit Small Business Employment Watch
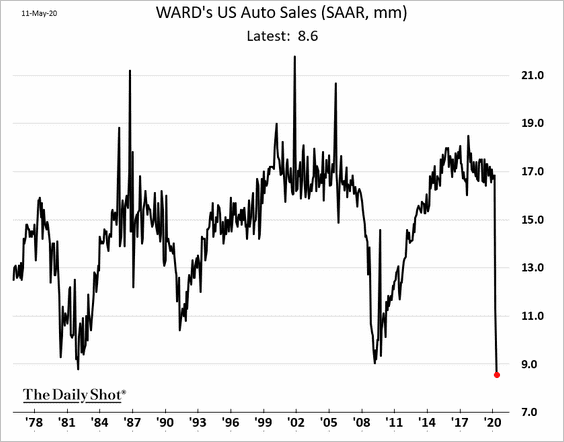
4. Automobile sales hit a multi-decade low last month.
5. Nomura expects a sharp CPI decline in April.
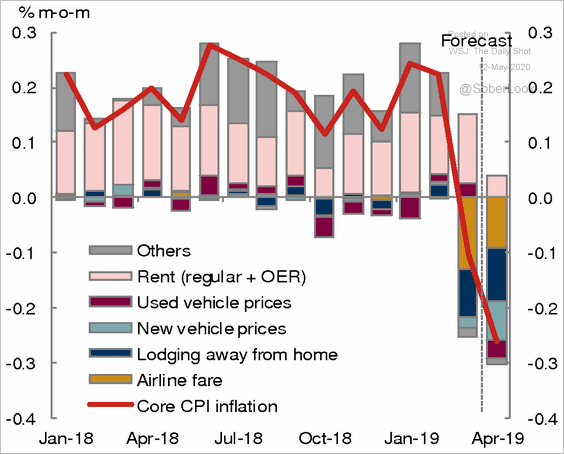 Source: Nomura Securities
Used cars will be a drag on inflation in the months to come.
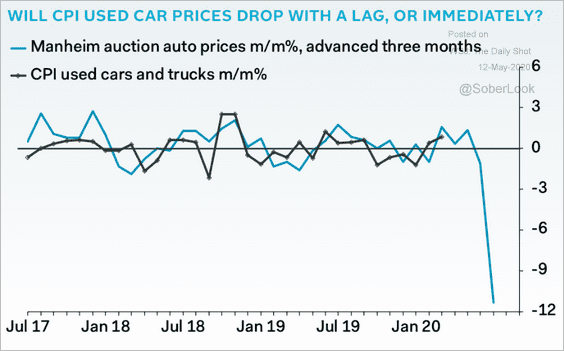 Source: Pantheon Macroeconomics
Canada
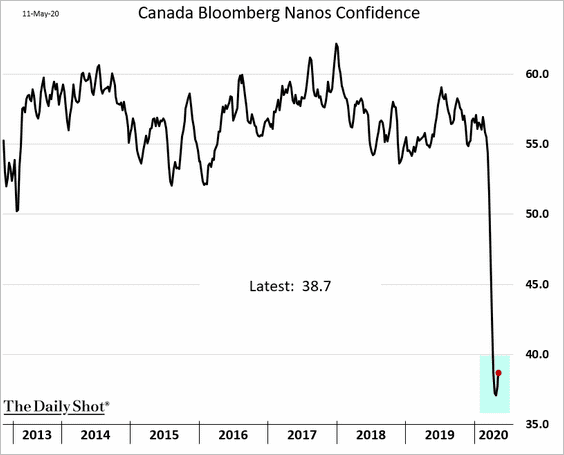
1. Consumer confidence is rebounding from extreme lows.
2. The decline in workers’ hours has been unprecedented.
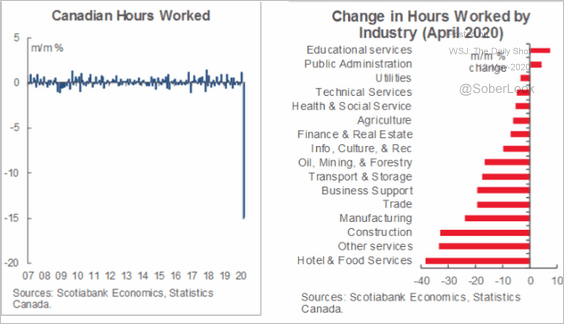 Source: Scotiabank Economics
3. Most layoffs appear to be “temporary.”
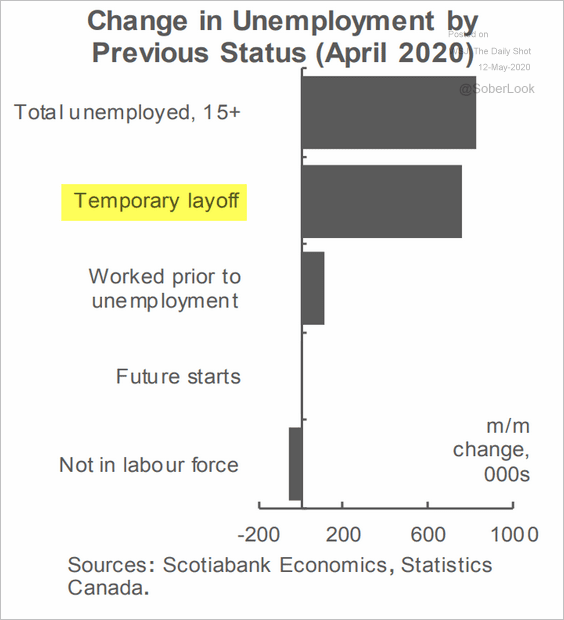 Source: Scotiabank Economics
4. Canada is well-positioned for fiscal stimulus.
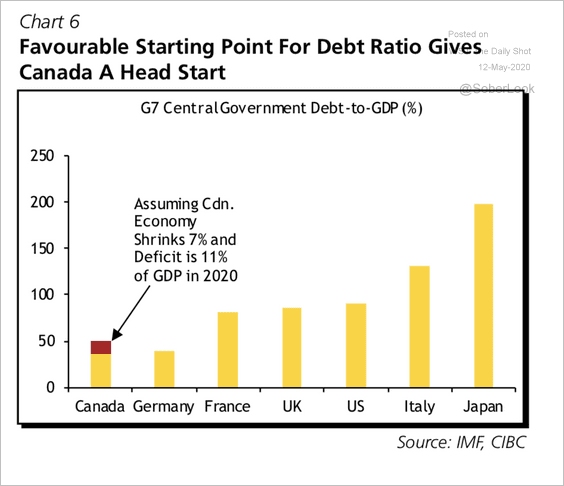 Source: CIBC Capital Markets
5. Speculators are increasingly net-short the loonie.
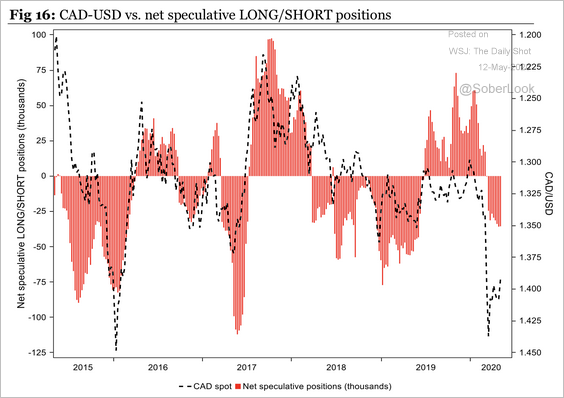 Source: Longview Economics
Europe
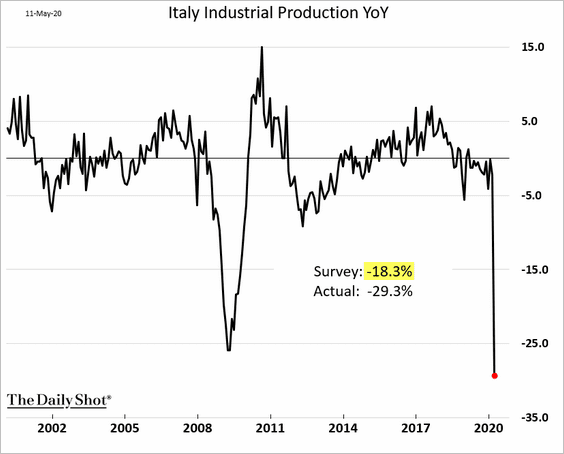
1. Italian industrial output collapsed in March.
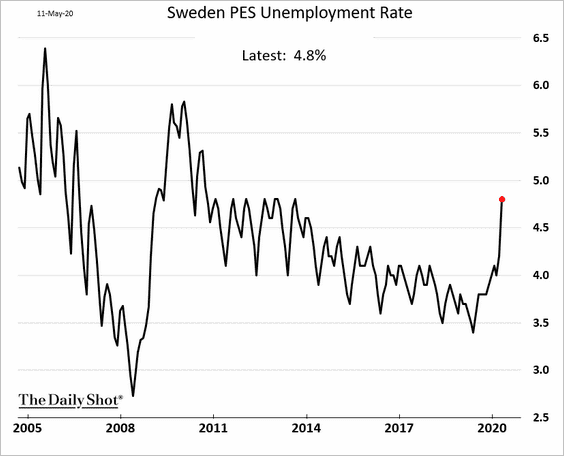
2. Sweden’s unemployment rate rose in April but remains well below the financial-crisis highs.
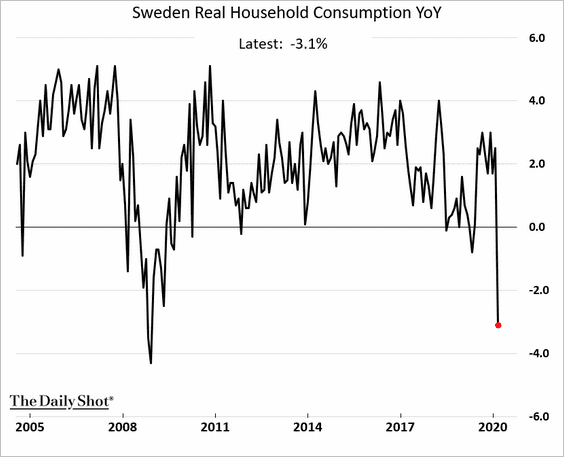
Consumption tumbled in March.
——————–
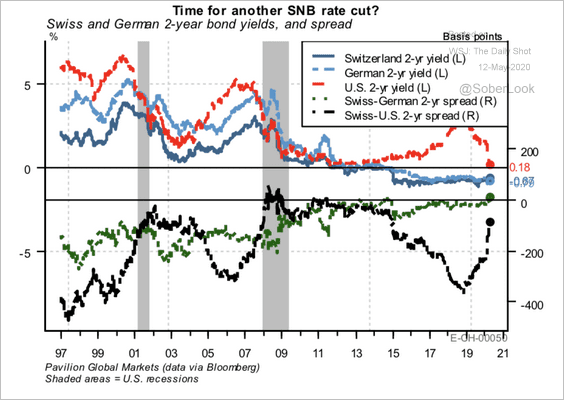
3. Switzerland’s 2yr yields are now higher than Germany’s. Will the SNB cut rates?
 Source: Pavilion Global Markets
4. Below this year’s UK household spending vs. 2019.
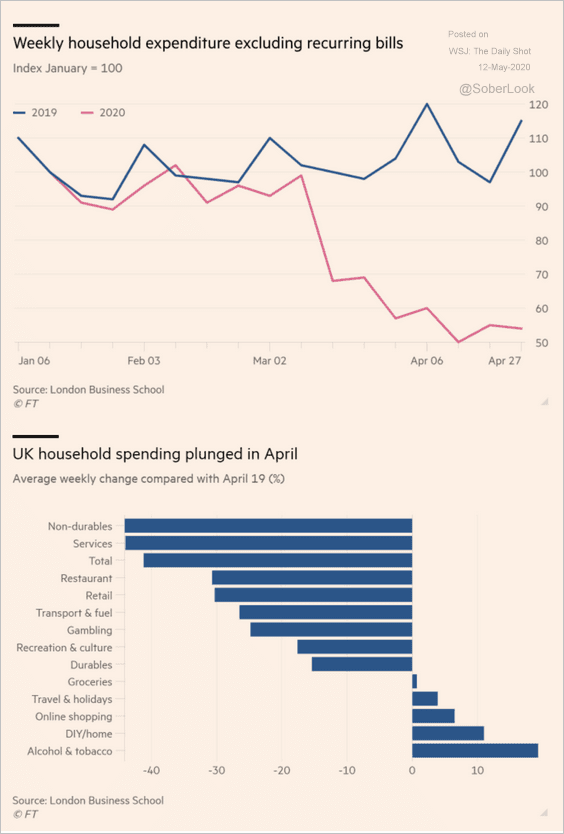 Source: @financialtimes Read full article
5. Countries with a higher percentage of the population working from home saw smaller reductions in working hours.
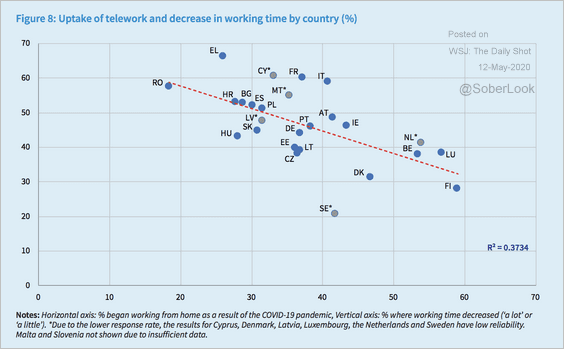 Source: European Foundation for the Improvement of Living and Working Conditions Read full article
Asia – Pacific
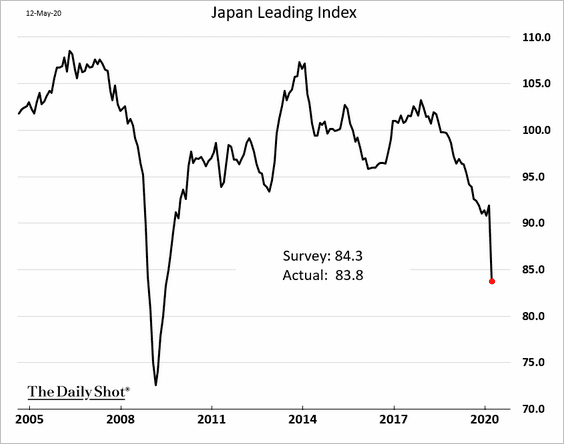
1. Japan’s leading index fell further in March.
2. South Korea’s small and medium-sized businesses (SMEs) are struggling.
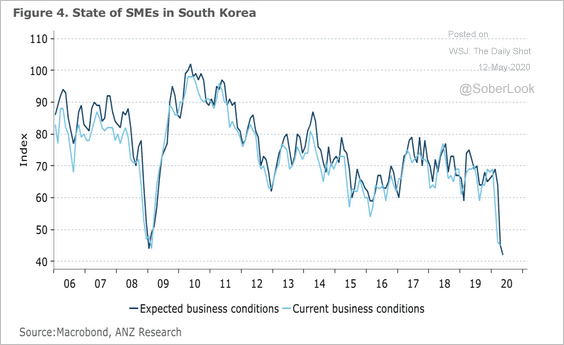 Source: ANZ Research
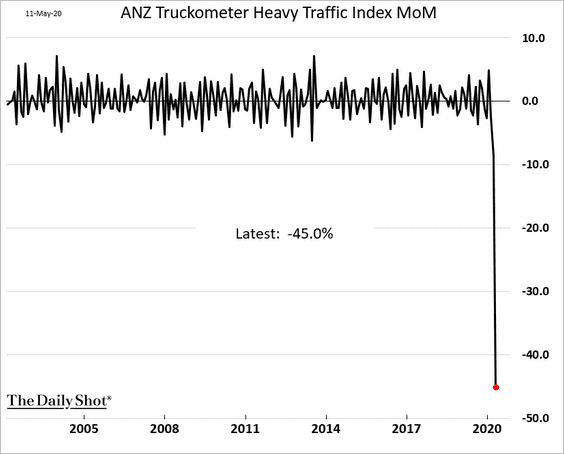
3. Here is New Zealand’s Truckometer Heavy Traffic Index.
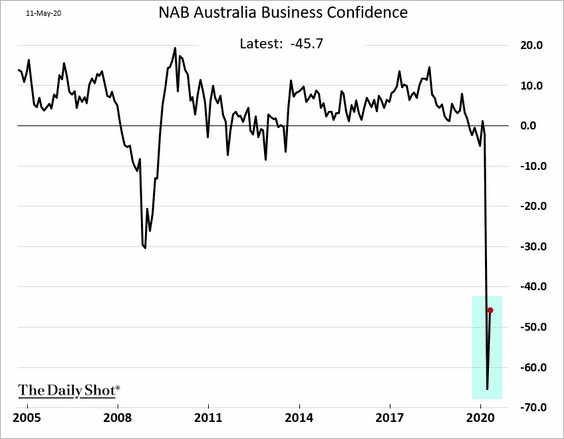
4. Australia’s business and consumer confidence is recovering from extreme lows.

——————–
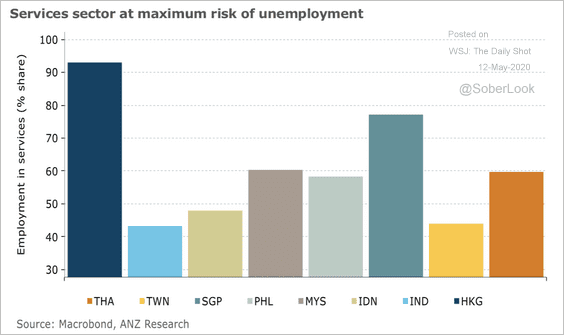
5. This chart shows the percentage of employment in services.
 Source: ANZ Research
China
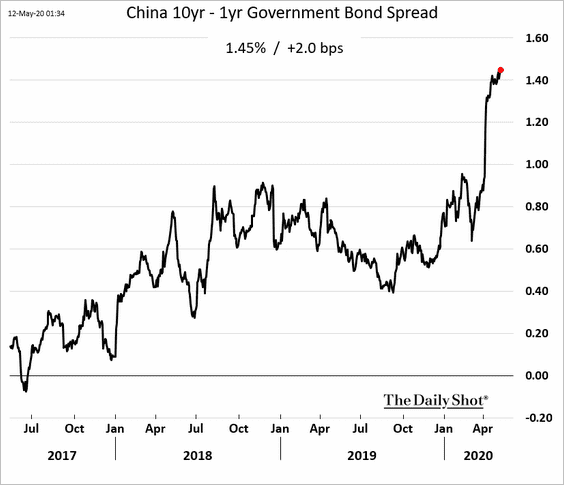
1. The yield curve continues to steepen.
2. Credit expansion is running well ahead of historical trends.
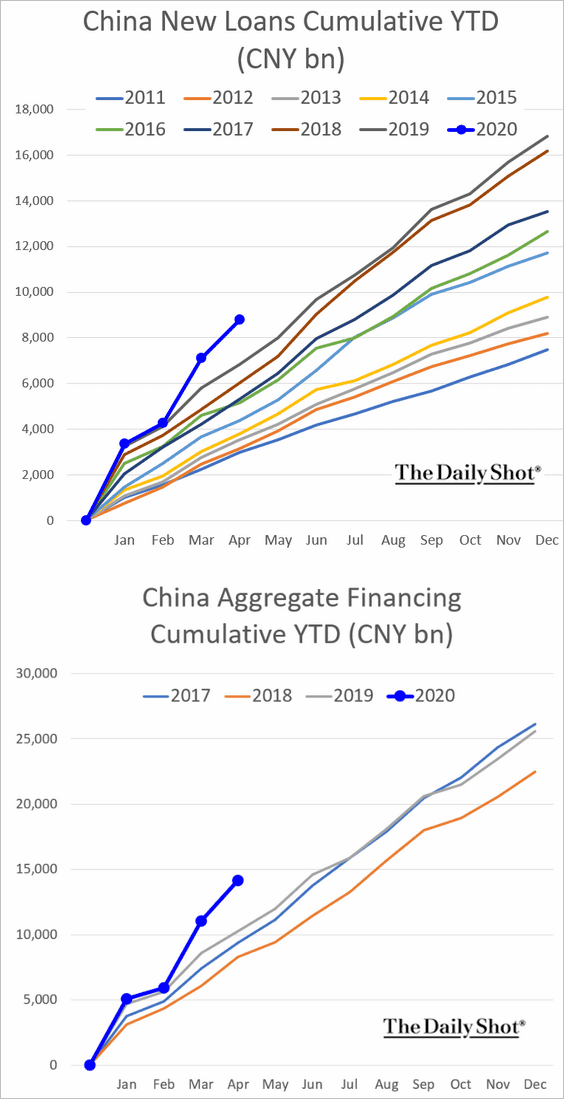
Here is the broad money supply (M2).
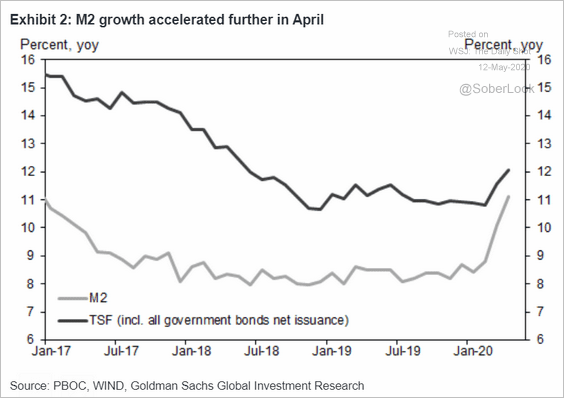 Source: Goldman Sachs
——————–
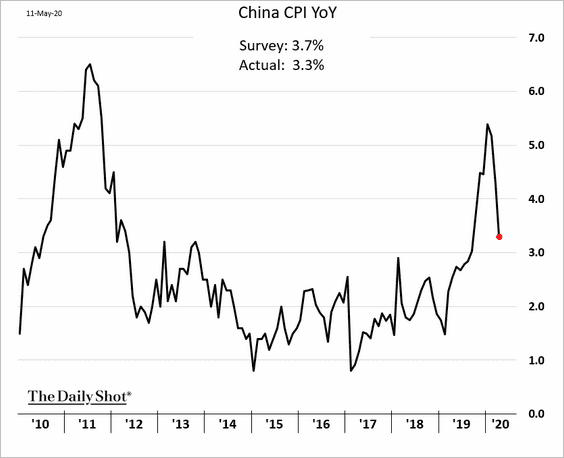
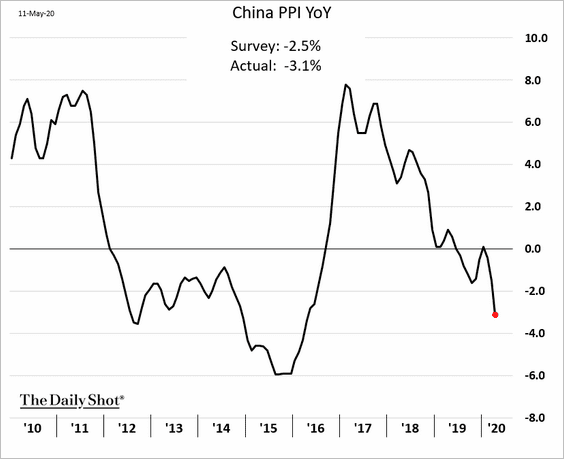
3. The headline inflation is moderating as meat prices stabilize.
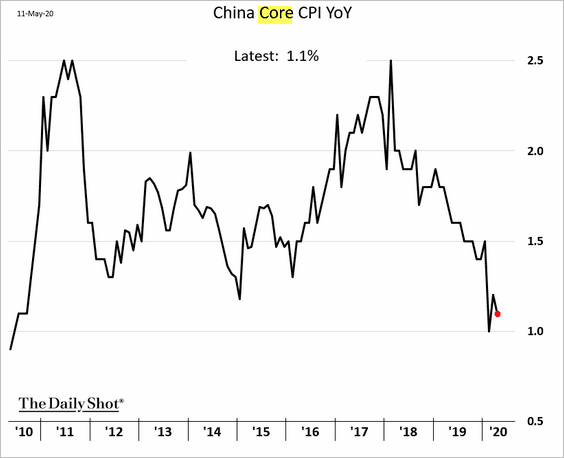
Core inflation is trending lower.
Producer prices are back in deflation mode.
——————–
4. The strength in exports last month was probably related to the backlog of orders, not new demand.
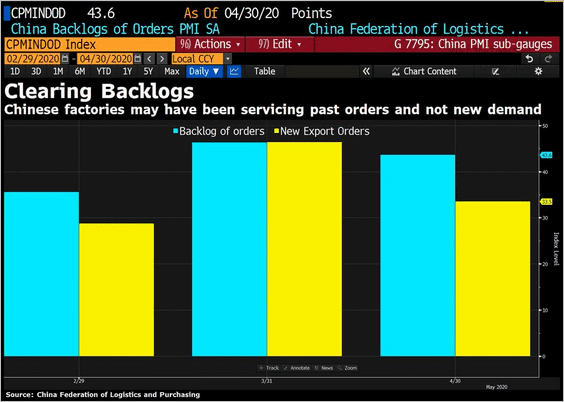 Source: @DavidInglesTV
5. Economic activity continues to recover.
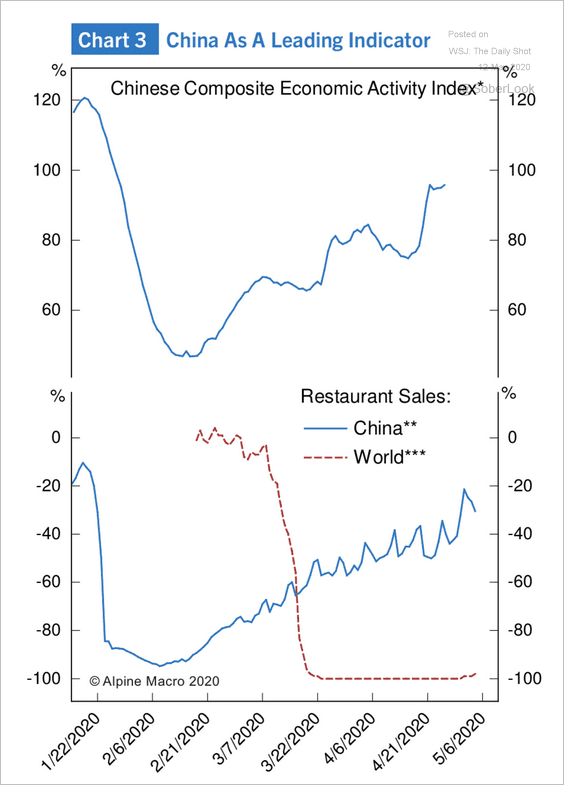 Source: Alpine Macro
Emerging Markets
1. Private net savings offset EM countries’ fiscal deficits.
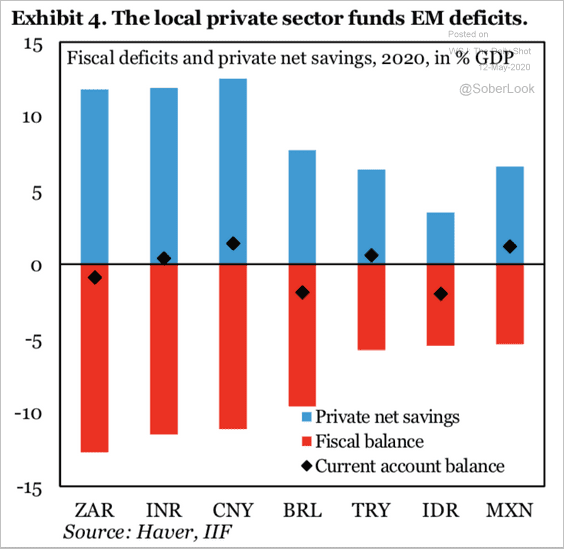 Source: IIF
2. Access to banking is still limited in many EM economies.
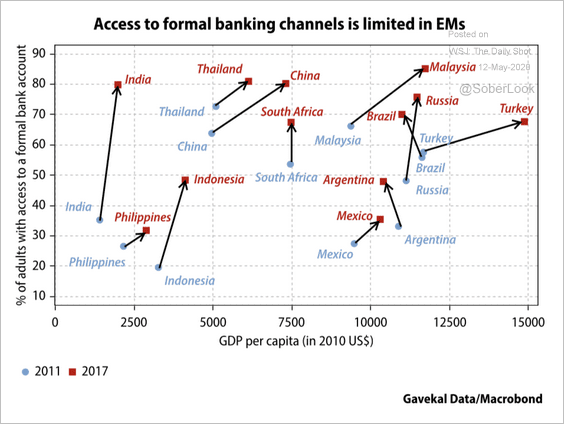 Source: Gavekal
3. EM currencies have yet to see a risk-on rally.
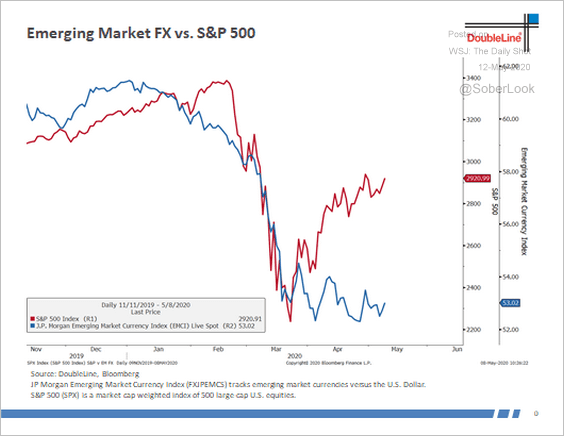 Source: @DLineCap
By the way, asset managers are extremely net short EM currencies.
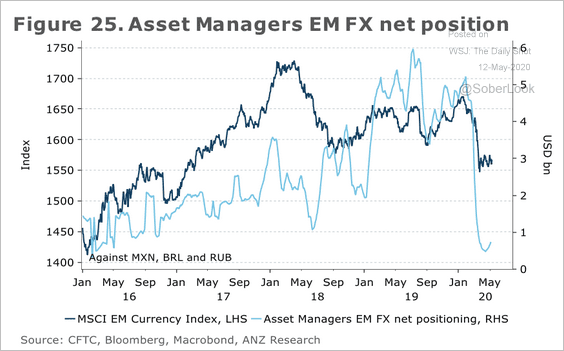 Source: ANZ Research
——————–
4. Corporate defaults are coming.
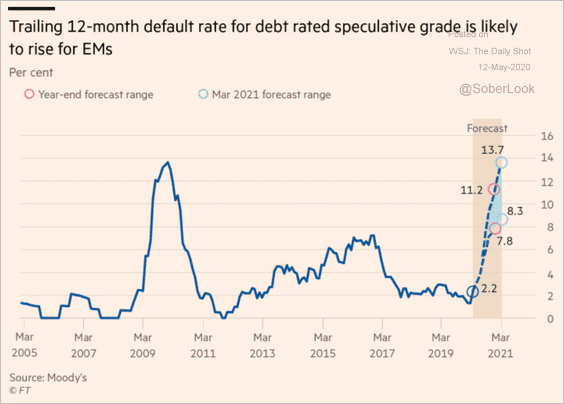 Source: @financialtimes Read full article
Cryptocurrency
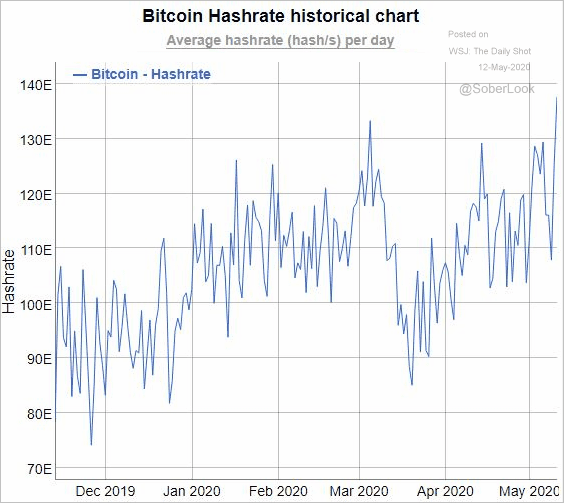
The Bitcoin hash rate hit a record high.
 Source: coinnounce.com Read full article
 Source: @hodlonaut
Commodities
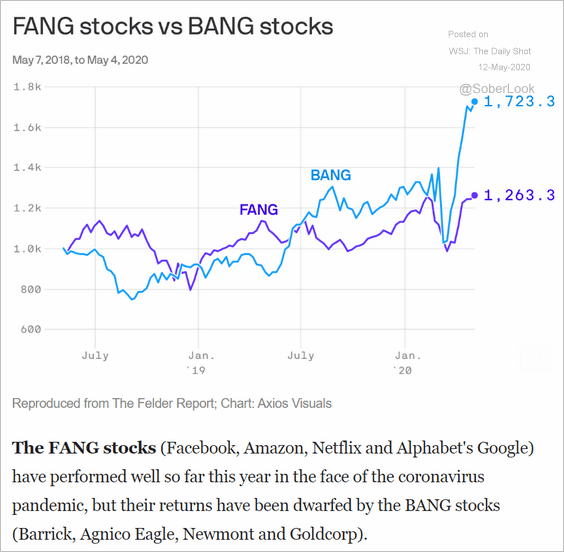
1. Gold miners are outperforming FANG stocks.
 Source: @axios Read full article
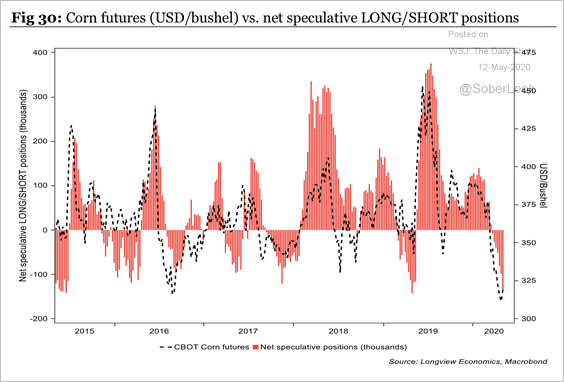
2. Speculative net short positioning in corn futures is at an extreme.
 Source: Longview Economics
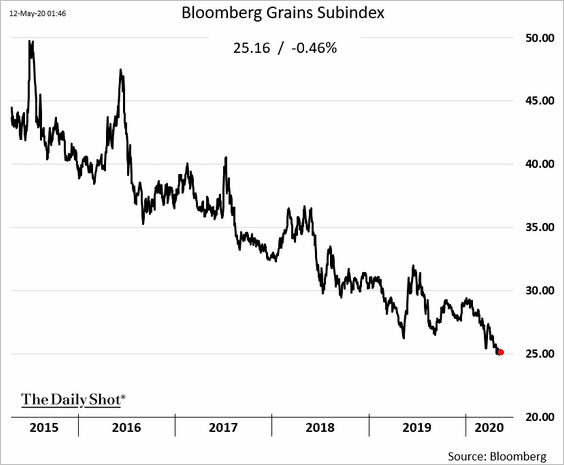
3. Bloomberg’s grains index is hovering near multi-decade lows.
Energy
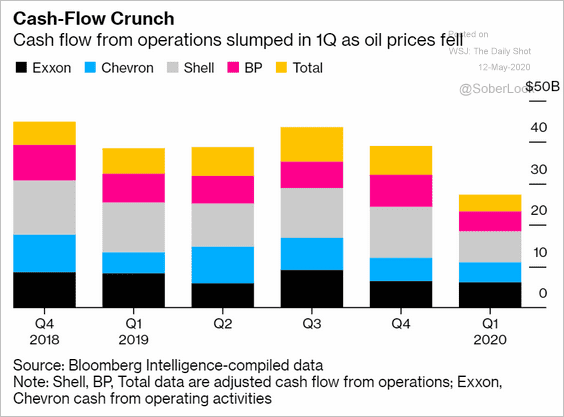
1. The largest energy firms saw substantial declines in operating cash flow in the first quarter.
 Source: @markets Read full article
2. LNG imports have been slowing in key Asian markets over the past few years…
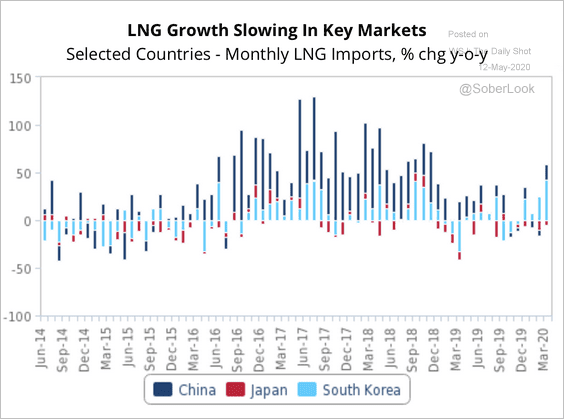 Source: Fitch Solutions Macro Research
…which has kept prices depressed. But a bottom is likely in, according to Fitch.
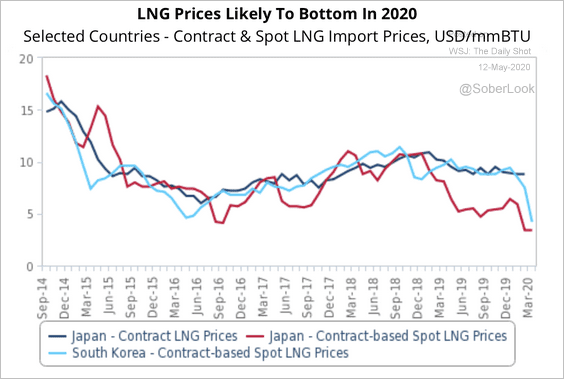 Source: Fitch Solutions Macro Research
——————–
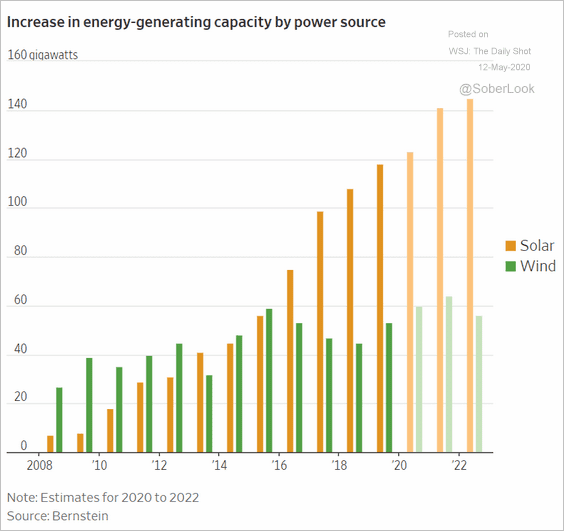
3. Renewable energy continues to increase market share.
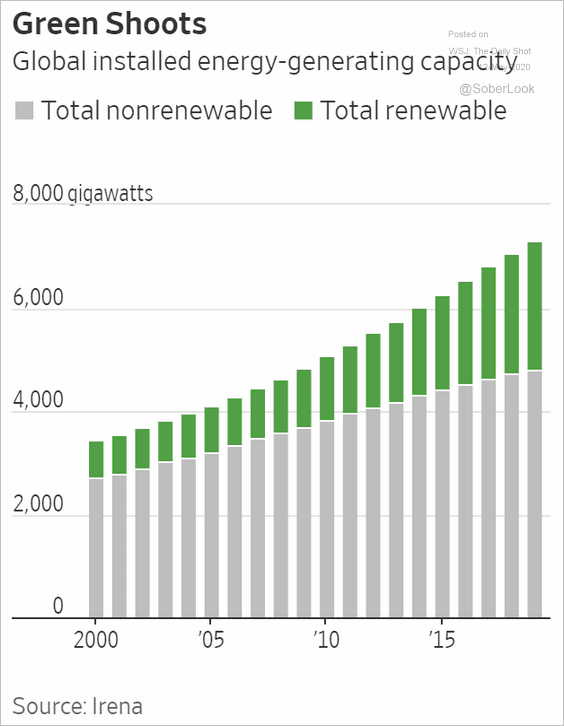 Source: @WSJ Read full article
 Source: @WSJ Read full article
Equities
1. What are investors’ biggest concerns?
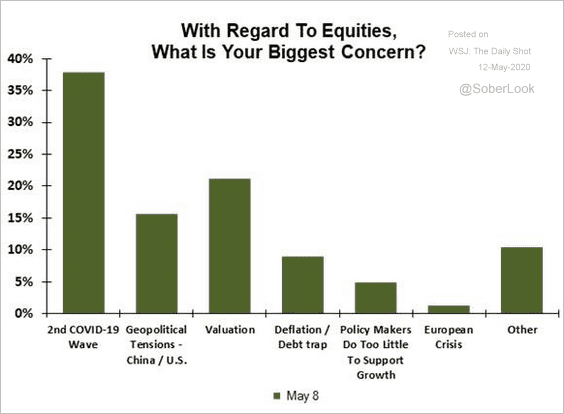 Source: Evercore ISI, @LizAnnSonders
2. Companies that source most of their revenues from outside of the US proved to be more resilient this past quarter.
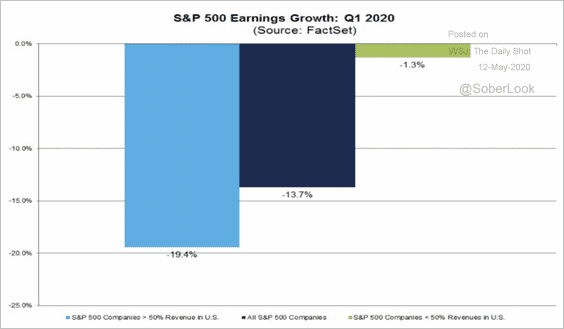 Source: @FactSet
3. This chart shows the S&P 500 performance in different inflation regimes.
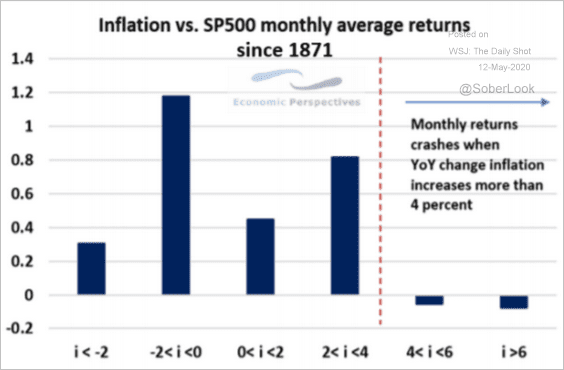 Source: Economic Perspectives
4. Here is the performance by sector since the start of the crisis.
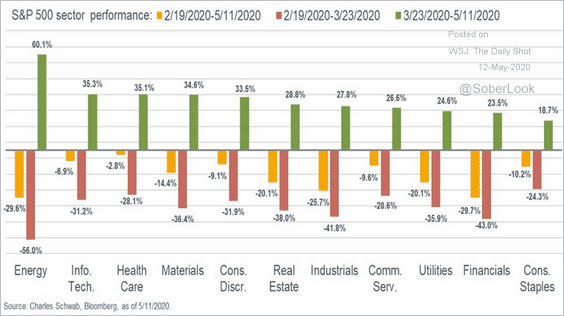 Source: @LizAnnSonders
5. Healthcare funds see record inflows.
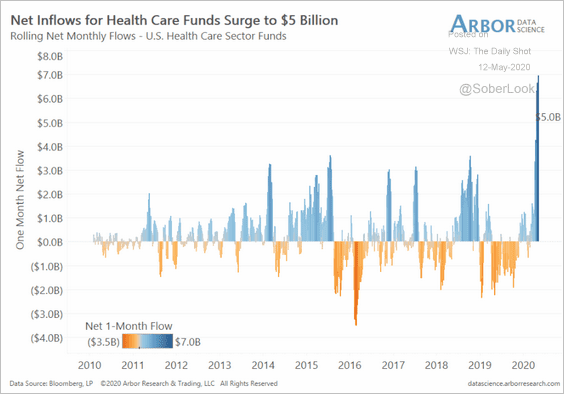 Source: Arbor Research & Trading
6. The market is starting to focus on the 2020 election. Below is the S&P 500 implied volatility curve on May 4th and May 11th.
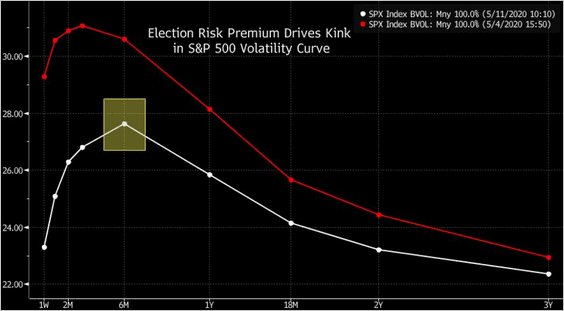 Source: @markets Read full article
Credit
1. Analysts are anticipating a wave of bankruptcies.
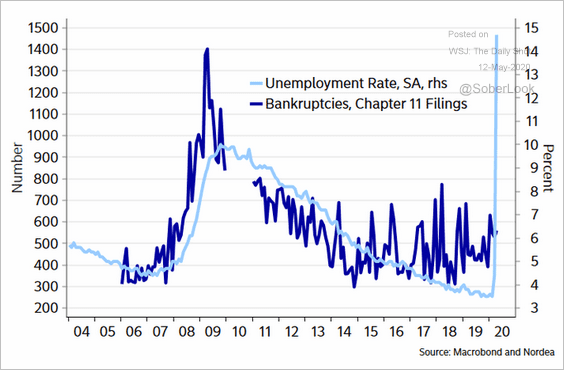 Source: @AndreasSteno
2. EBITDA adjustments have artificially depressed corporate leverage estimates.
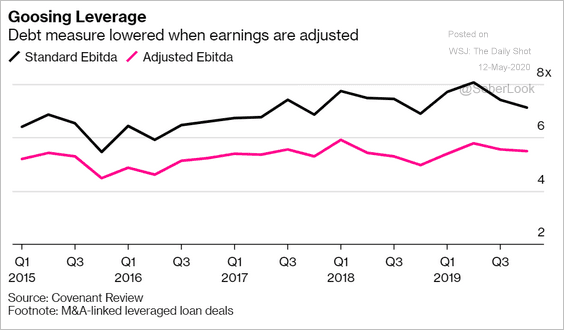 Source: @business Read full article
This chart shows various leverage ratio projections if EBITDA is cut by 25% to 75% this year.
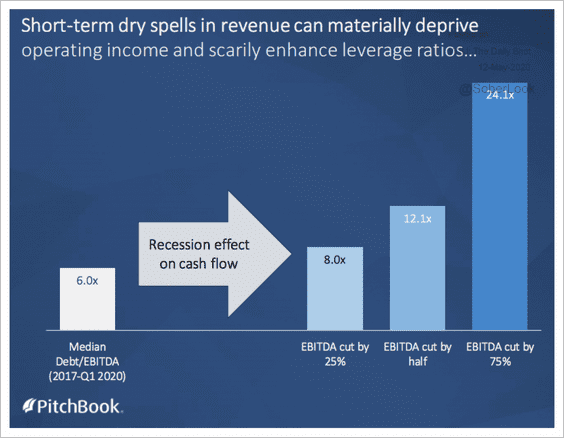 Source: PitchBook
——————–
3. Here is the rating distribution of European companies.
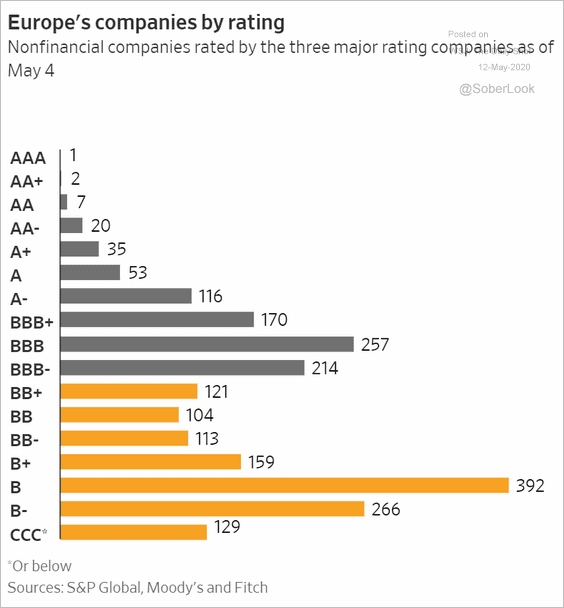 Source: @WSJ Read full article
4. Next, we have an update on leveraged loans from S&P.
• The March sell-off did not have a significant impact on the gap between CCC+ and B- issuers.
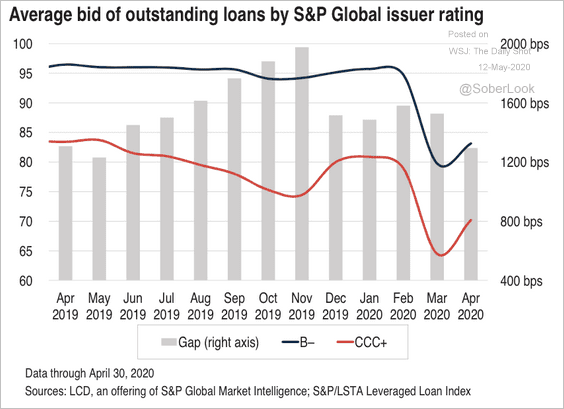 Source: S&P Global Market Intelligence
• Prices on BB-rated loans have outpaced B-rated debt since March,
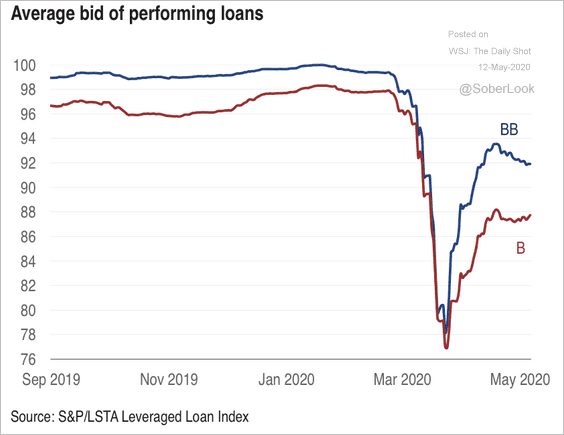 Source: S&P Global Market Intelligence
• Here is the monthly primary CLO volume.
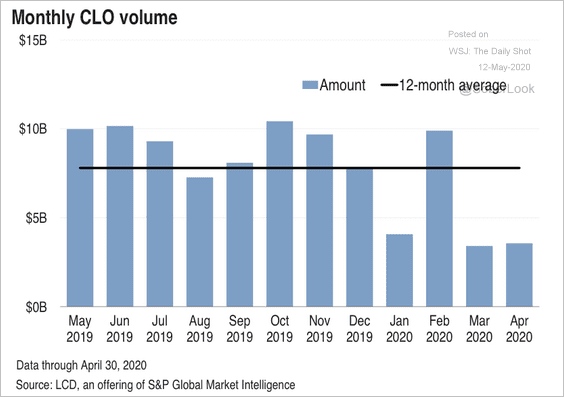 Source: S&P Global Market Intelligence
Rates
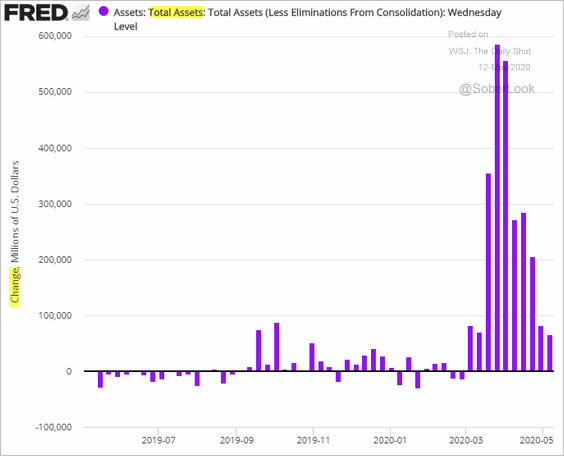
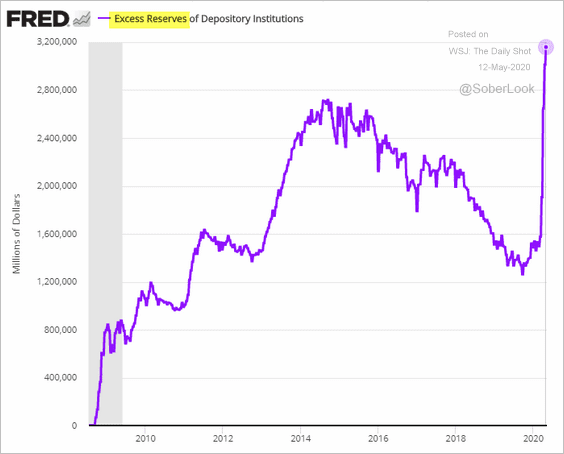
1. Let’s start with some updates on the Fed’s stimulus operations.
• The balance sheet expansion has slowed.
• Excess reserves hit a new record.
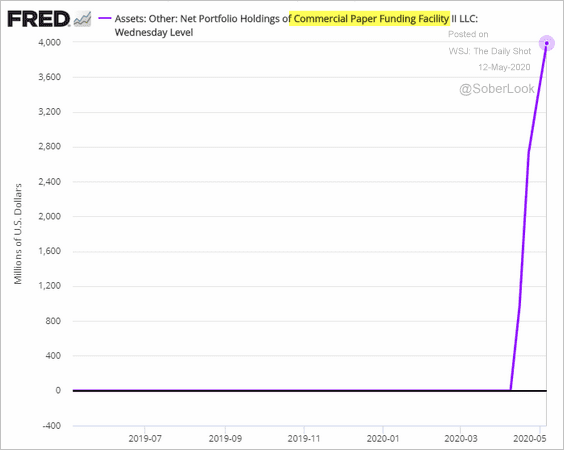
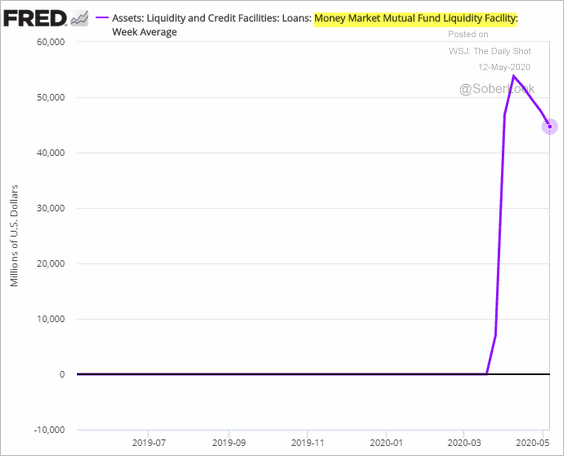
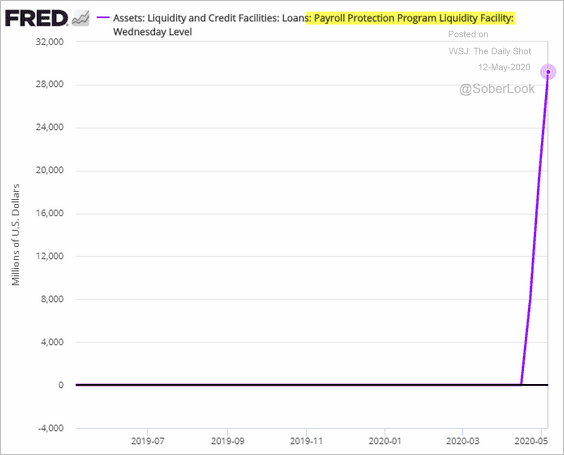
• Below are some trends in the Fed’s liquidity and credit facilities.
– Commercial Paper Facility:
– Money Market Mutual Fund Facility:
– The PPP Facility (small business lending):
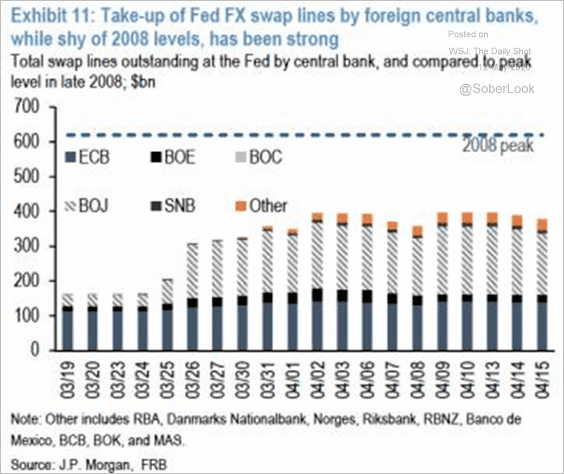
– FX swap lines (3 charts):
 Source: JP Morgan, {ht} Adam Kneller
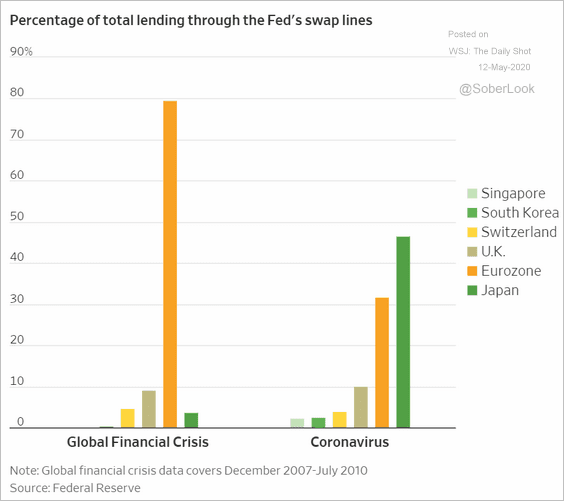 Source: @WSJ Read full article
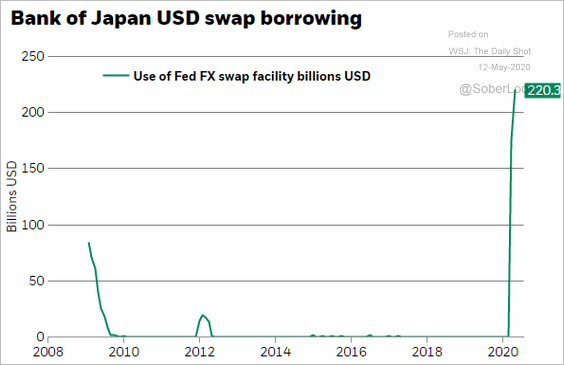 Source: @ericbeebo, @Brad_Setser
——————–
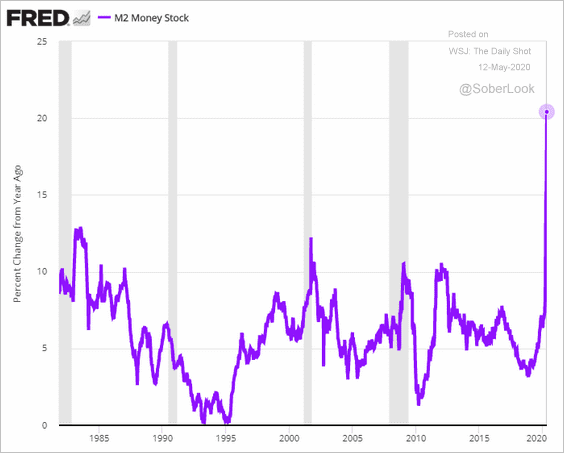
2. Growth in the US broad money supply (M2) has now exceeded 20%.
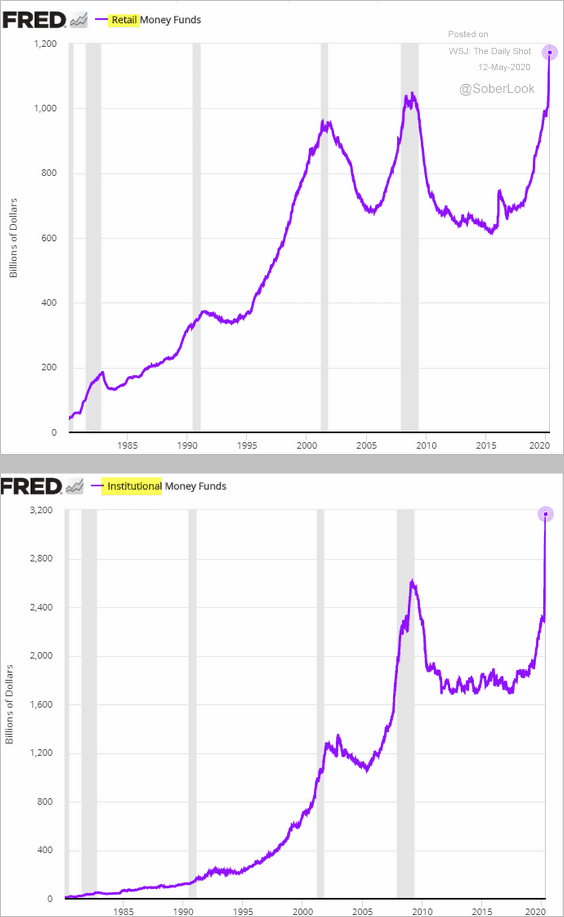
3. Money market funds’ assets keep hitting record highs.
4. Treasury market liquidity is stabilizing as bid/ask spreads tighten.
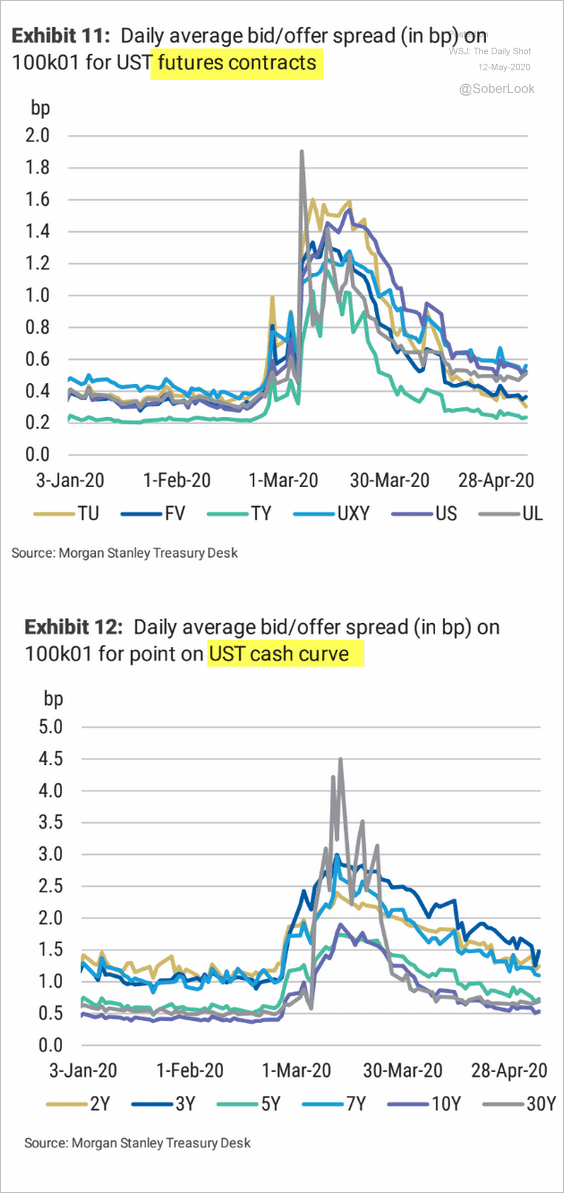 Source: Morgan Stanley Research
5. The cyclical/defensive equities ratio is signaling higher Treasury yields.
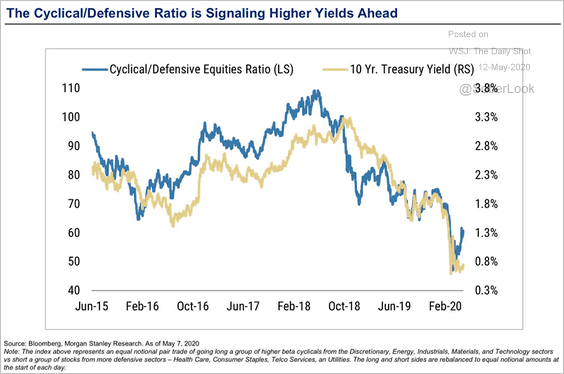 Source: @ISABELNET_SA, @MorganStanley
Global Developments
1. Implied volatility has been tumbling across global markets, helped by the Fed’s massive stimulus measures.
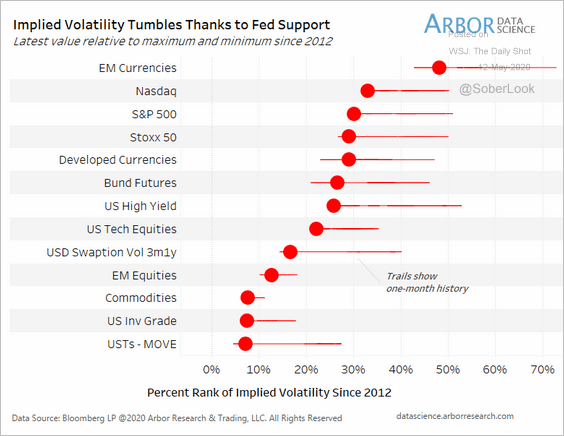 Source: Arbor Research & Trading
2. This chart shows bond purchases by central banks.
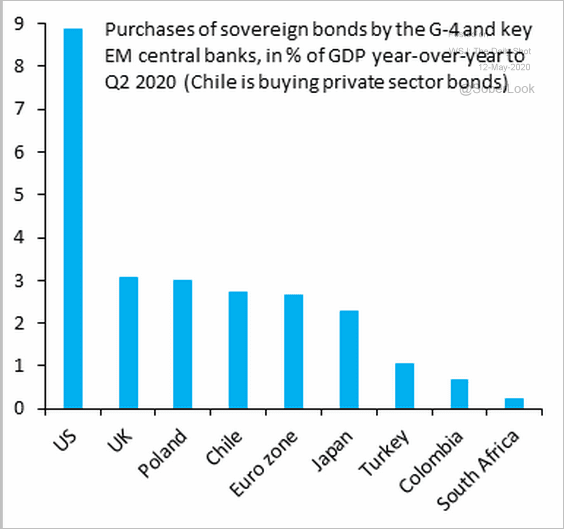 Source: @RobinBrooksIIF, @UgrasUlkuIIF, @mcastellano44, @IifPaola
3. 2019 brought a cooldown for some of the most overheated housing markets.
 Source: Oxford Economics
4. Here are the contributions to world GDP growth.
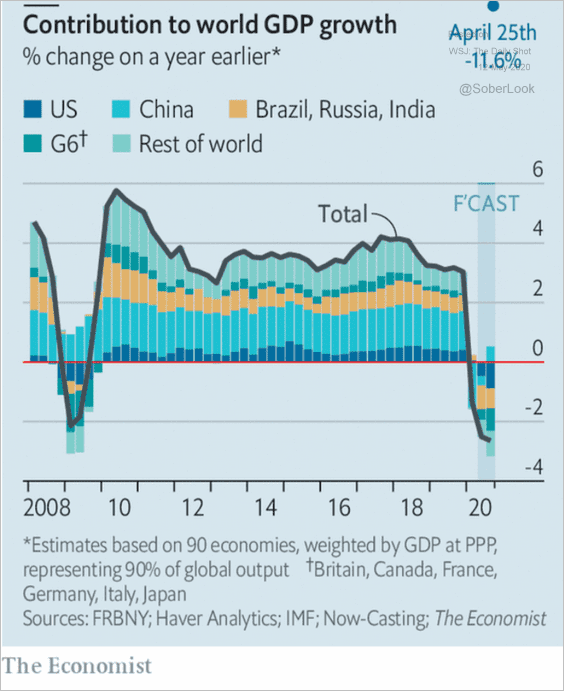 Source: The Economist, @adam_tooze Read full article
5. Assets at state-owned enterprises keep climbing.
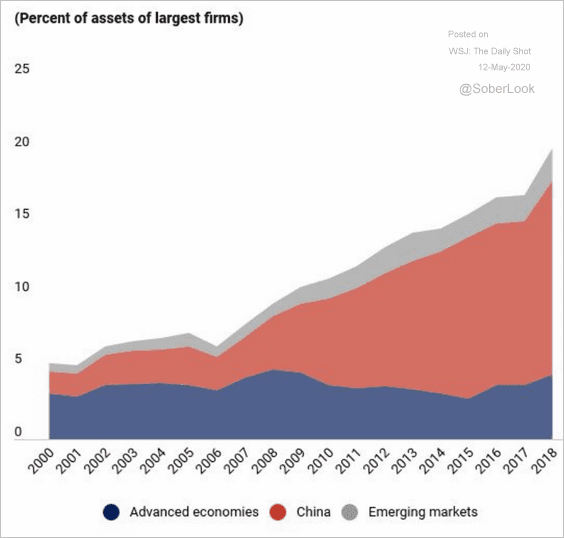 Source: IMF Read full article
——————–
Food for Thought
1. Changes in consumer purchasing behaviors:
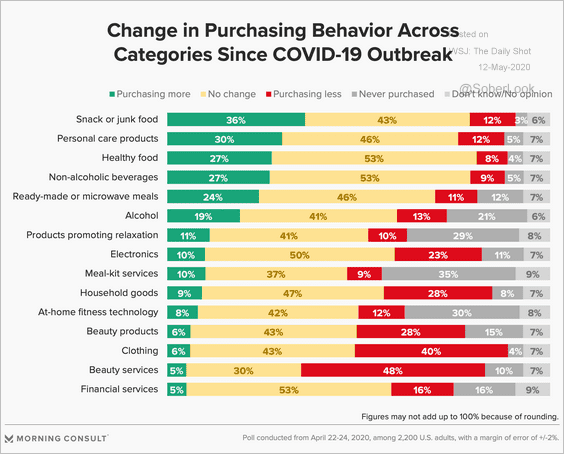 Source: Morning Consult Read full article
2. Layoffs at startups:
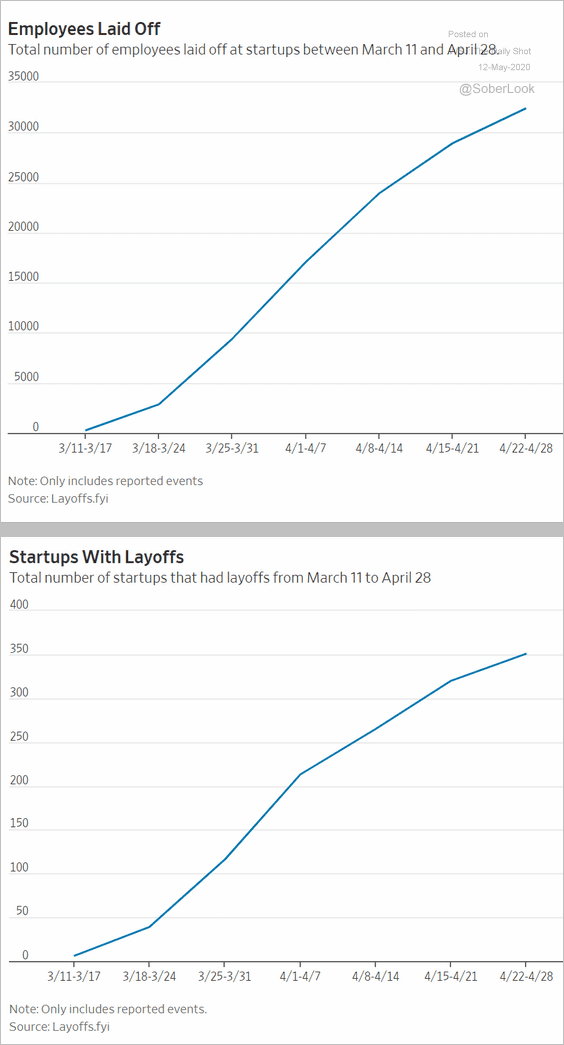 Source: @WSJ Read full article
3. Homeowners aged 65+ with a mortgage:
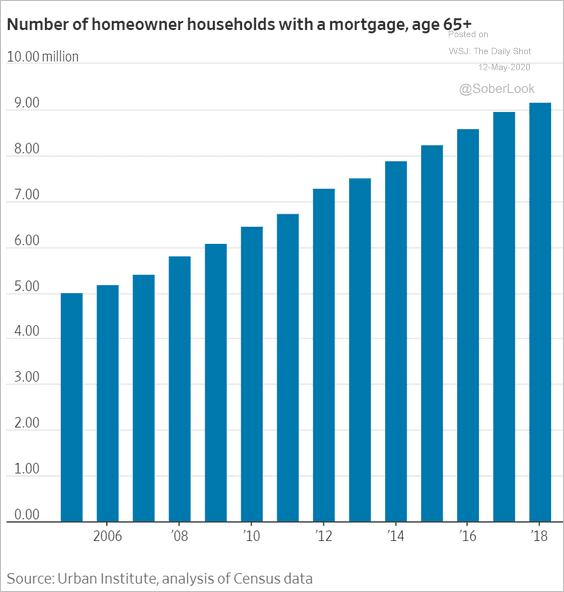 Source: @WSJ Read full article
4. Asian and Latino immigrants arriving in the US:
 Source: Pew Research Center Read full article
5. Approval ratings for world leaders:
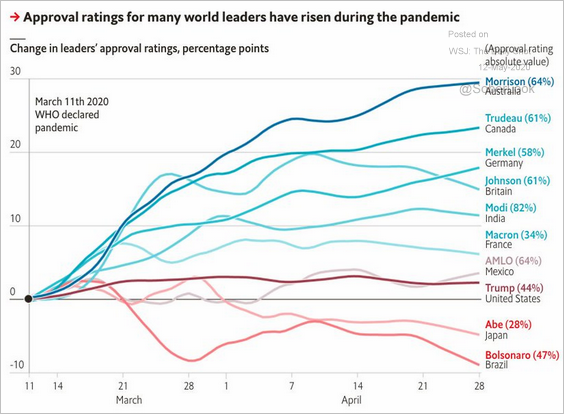 Source: The Economist, @adam_tooze Read full article
6. Earnings from outpatient care:
 Source: @WSJ Read full article
7. US reliance on China for key medical supplies:
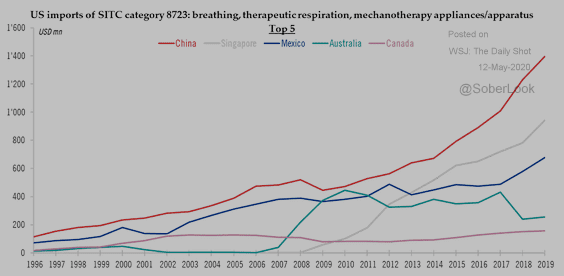 Source: @fwred
8. Leisure time in the US:
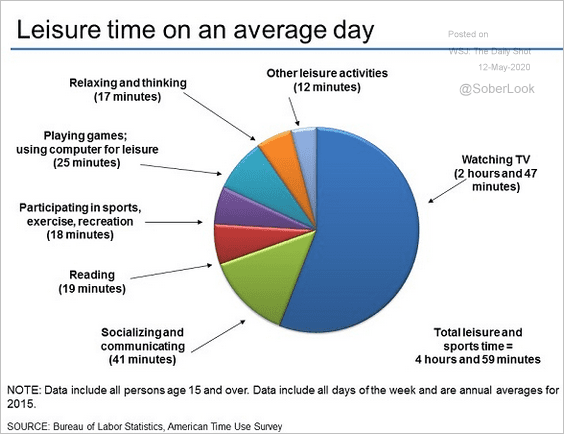 Source: U.S. Bureau of Labor Statistics Read full article
9. Proposed MLB regional divisions for 2020:
 Source: @WSJ Read full article
——————–