
The Daily Shot: 13-May-20
• The United States
• Europe
• Asia – Pacific
• China
• Emerging Markets
• Commodities
• Energy
• Equities
• Credit
• Rates
• Globa Developments
• Food for Thought
The United States
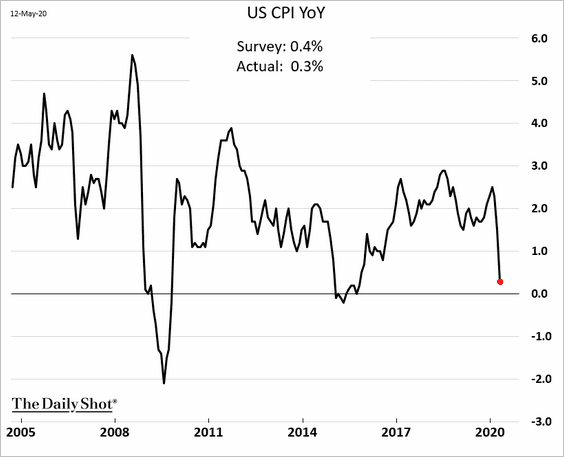
1. Let’s begin with the April CPI report, which is signaling a pickup in disinflationary pressures.
• The headline CPI (approaching zero):
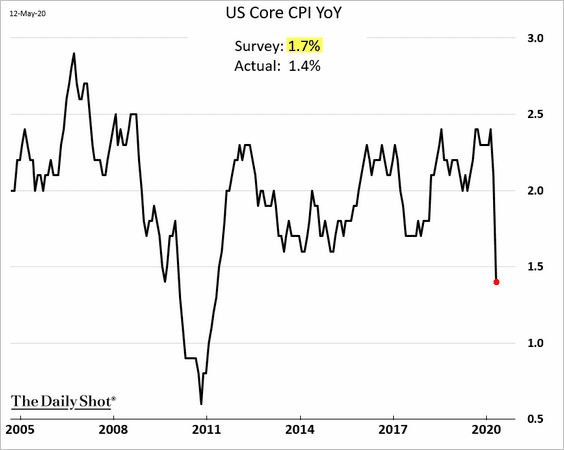
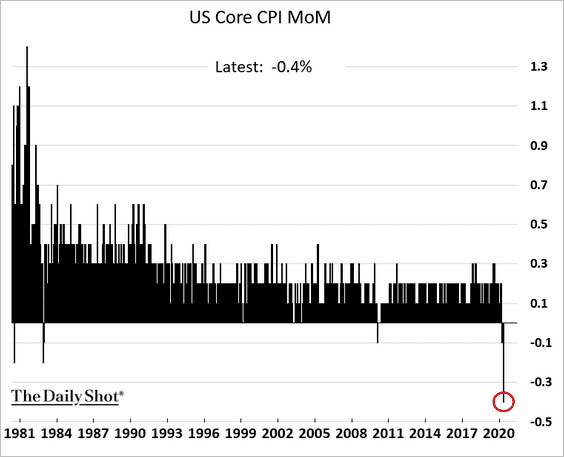
• The core CPI:
The monthly decline in the core CPI was the largest on record.
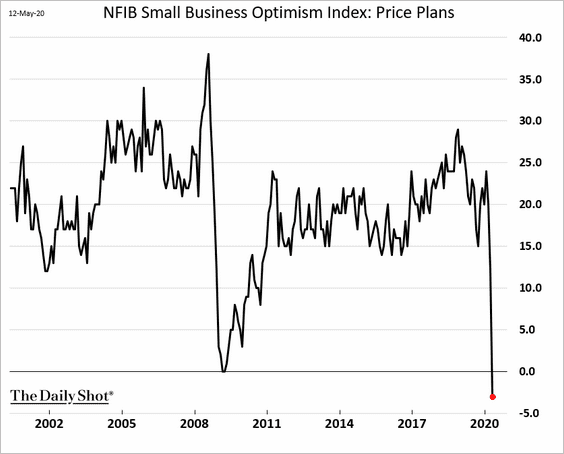
The NFIB small business “price plans” index is a good illustration of downward pressures on prices (more on the NFIB index below).
——————–
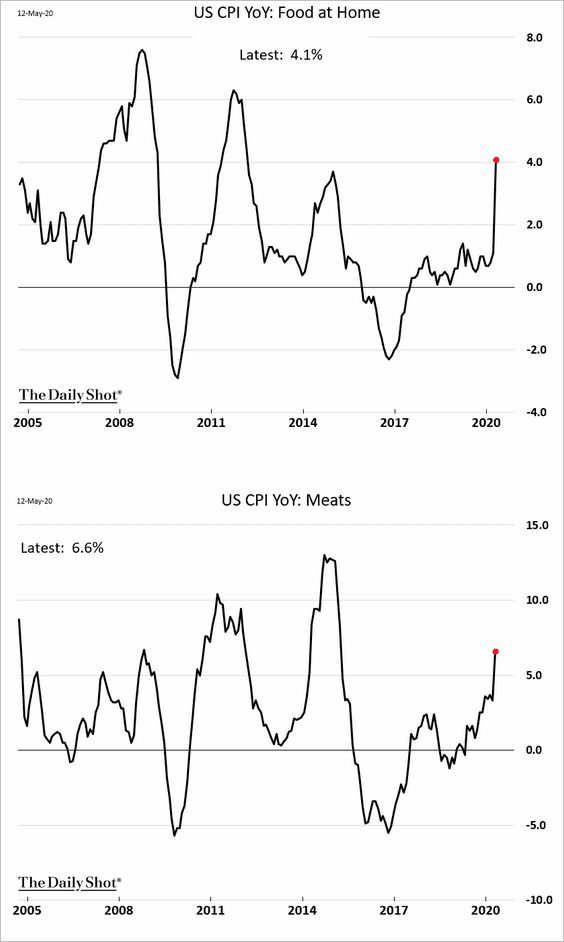
The April changes in consumer prices reflected the lockdown and disrupted food supply chains.
• Food at home CPI:
– Food at home monthly changes:
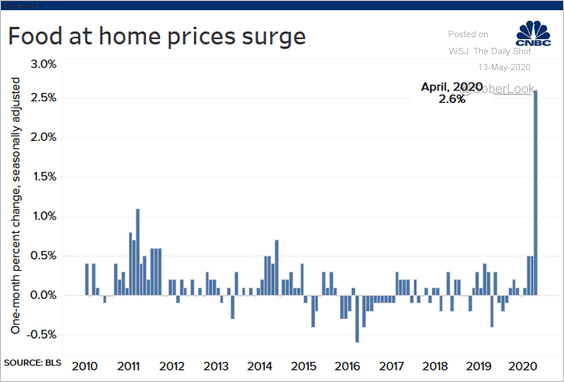 Source: @CNBC Read full article
– April price changes on specific food items:
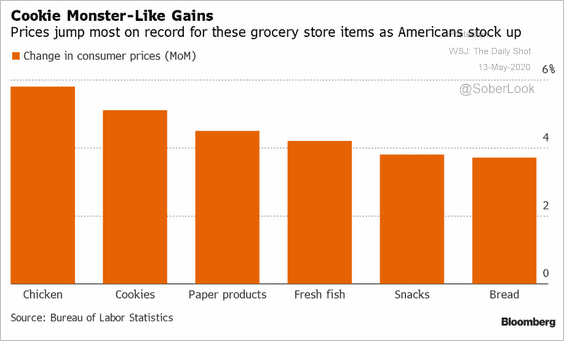 Source: @markets Read full article
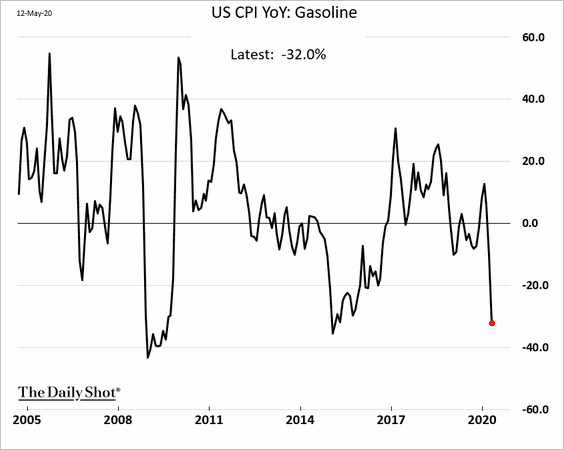
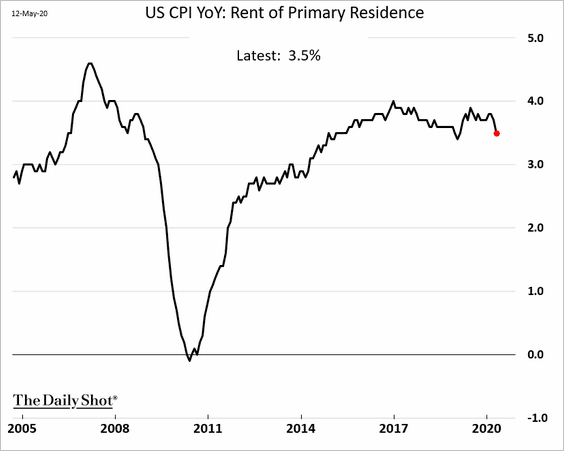
• The next set of charts illustrates the lockdown impact.
– Gasoline:
– Rent (year-over-year):
Month-over-month changes in rent and owners-equivalent rent:
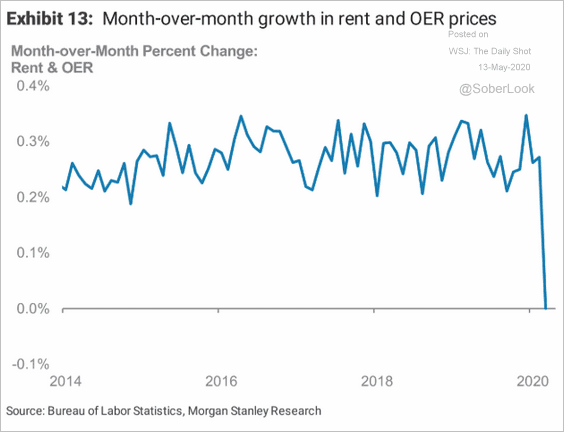 Source: Morgan Stanley Research
– Apparel (month-over-month):
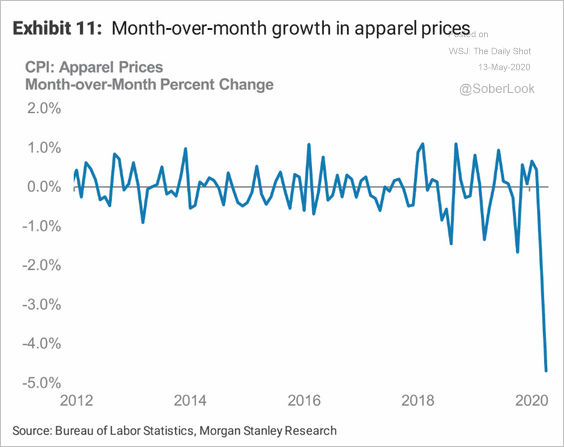 Source: Morgan Stanley Research
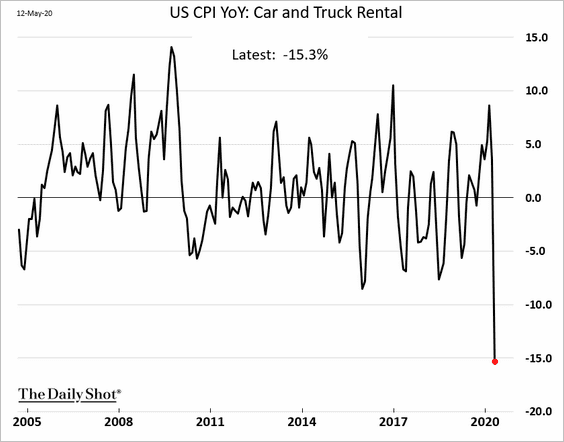
– Car rental:
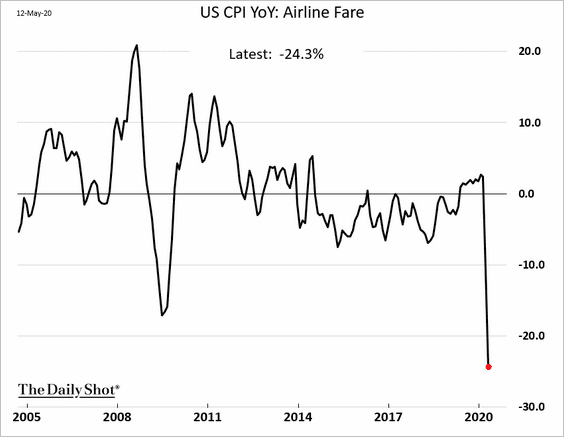
– Airline fare:
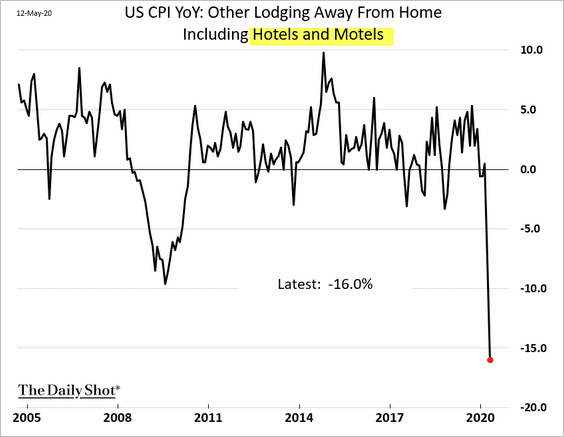
– Hotels:
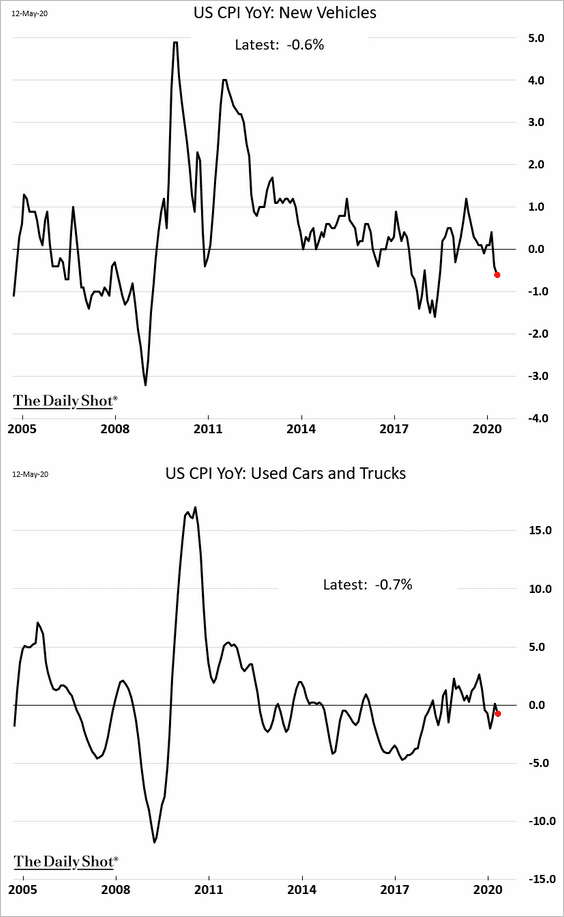
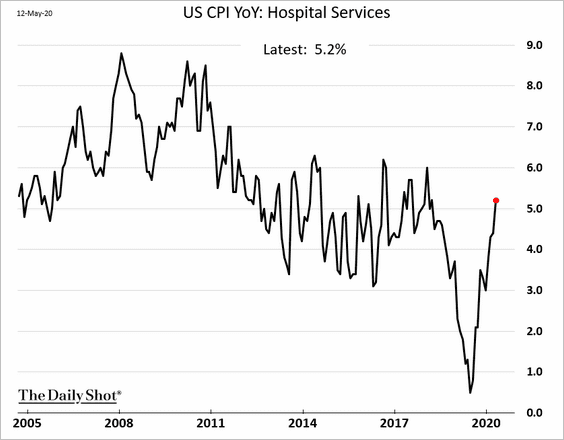
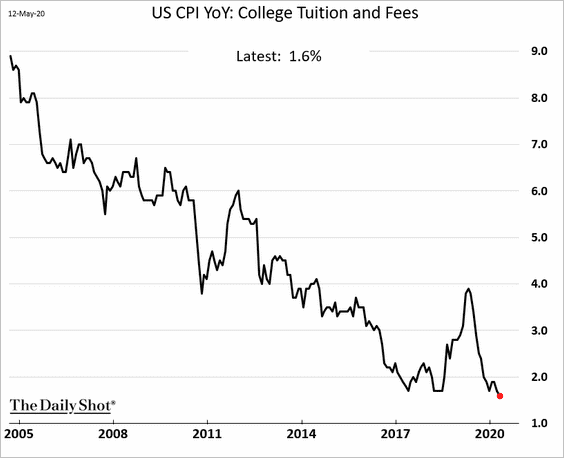
• Here are some additional inflation trends by sector.
– Automobiles:
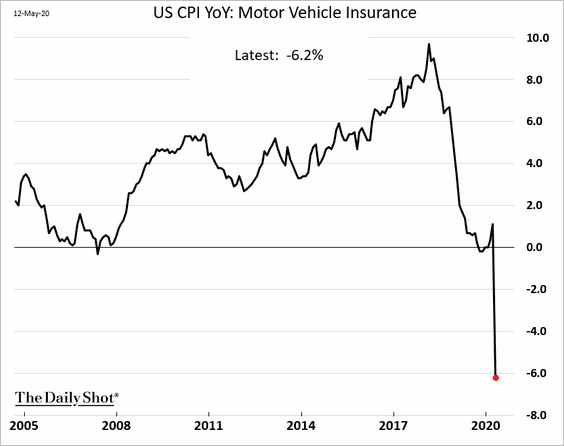
– Car insurance:
– Hospital services:
– College tuition:
——————–
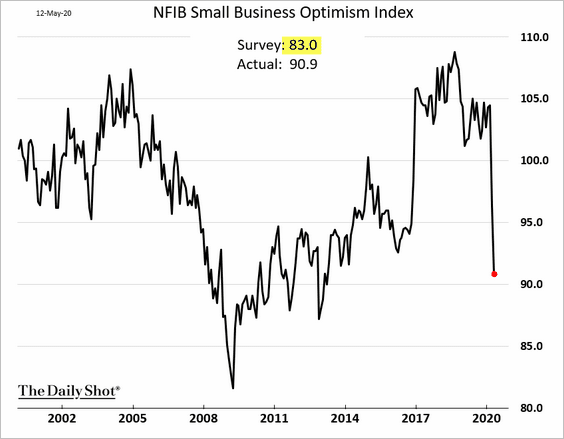
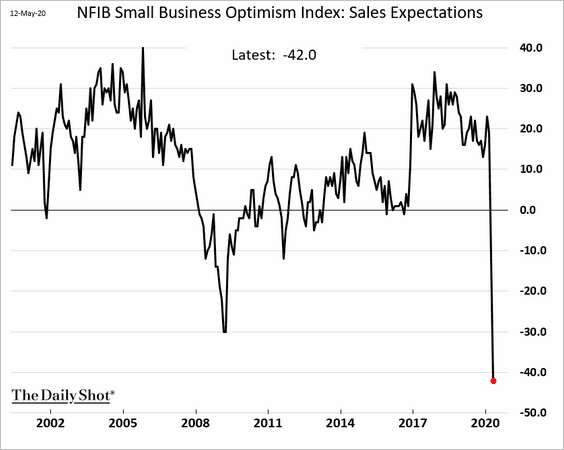
2. Next, let’s take a look at the NFIB small business sentiment report. While the headline index declined sharply, the correction wasn’t nearly as severe as economists feared.
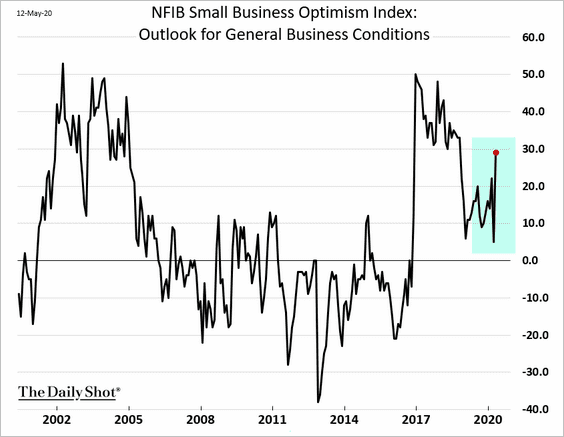
The surprise was in the NFIB’s business outlook sub-index, which jumped. Hopes for “reopening,” massive government support, and the stock market rebound were likely the causes of this improvement.
The reality on the ground, however, was much less upbeat. Here is the sales expectations index.
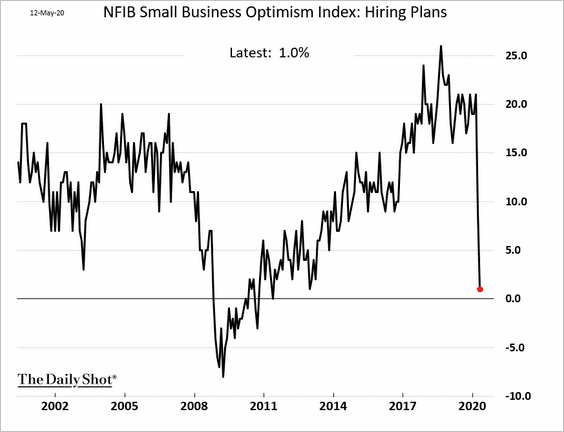
Here are several other key NFIB index components.
– Hiring plans:
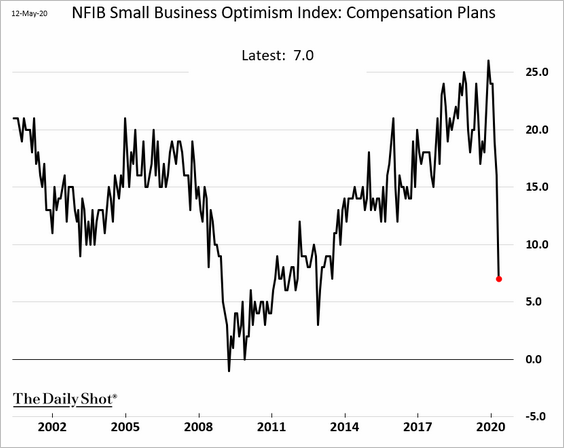
– Compensation plans:
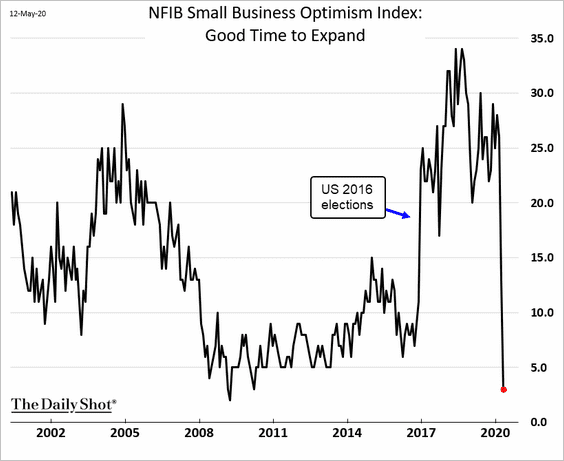
– “Good time to expand”:
– CapEx expectations:
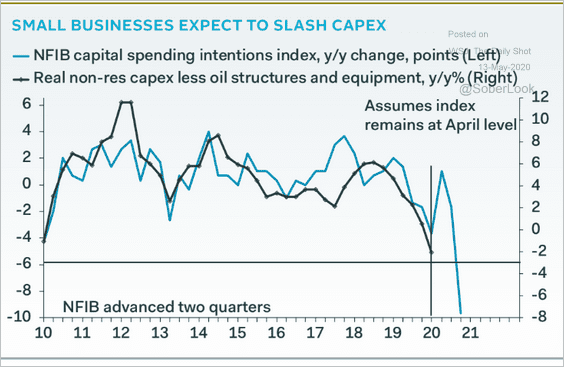 Source: Pantheon Macroeconomics
By the way, here is Goldman’s CapEx tracker.
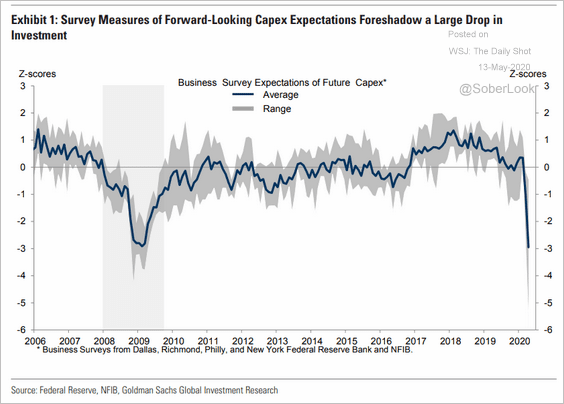 Source: Goldman Sachs
——————–
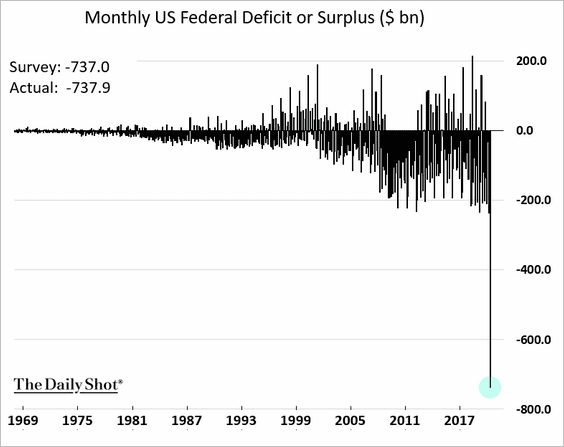
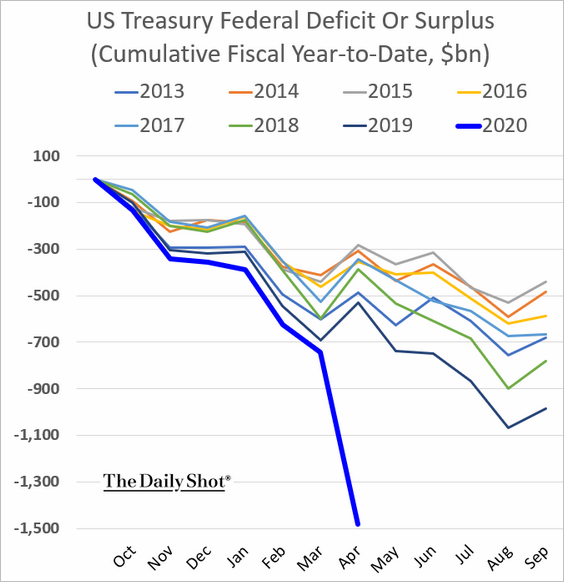
3. The US budget deficit widened by most on record.
Here is the (fiscal) year-to-date chart.
According to ING, the 2020 US federal deficit, as a percentage of the GDP, will far exceed budget gaps in other large economies.
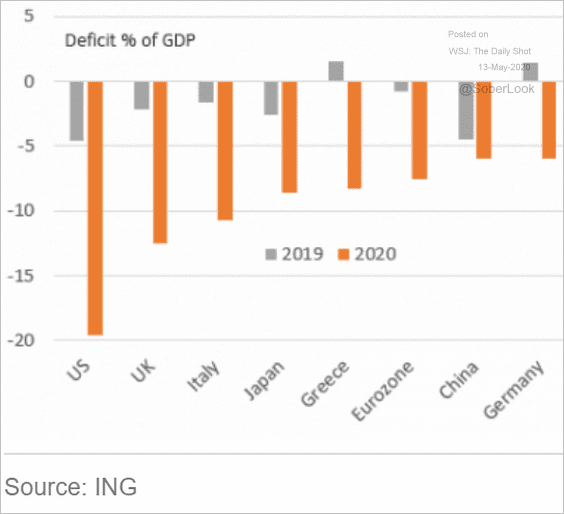 Source: ING
The US budget deficit was already widening before the pandemic hit, even as growth remained robust.
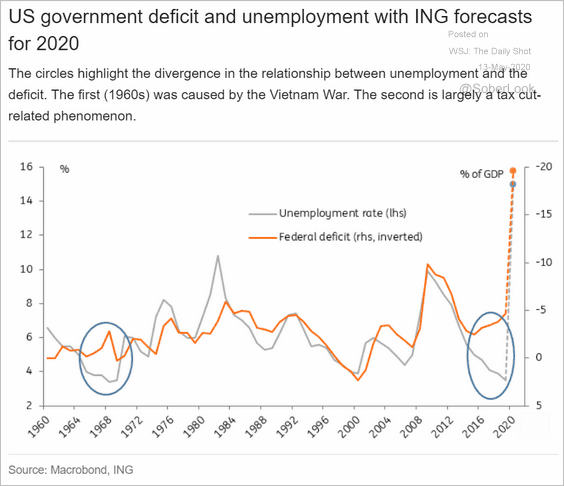 Source: ING
——————–
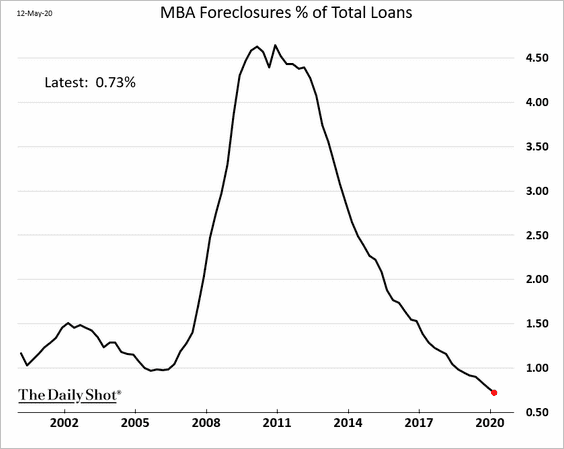
4. Mortgage foreclosures hit a multi-decade low in the first quarter.
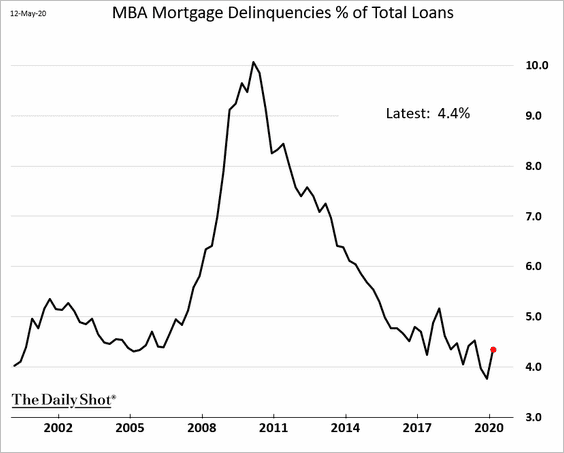
But delinquencies ticked up.
Mortgage credit has been tightening as the economy tanks.
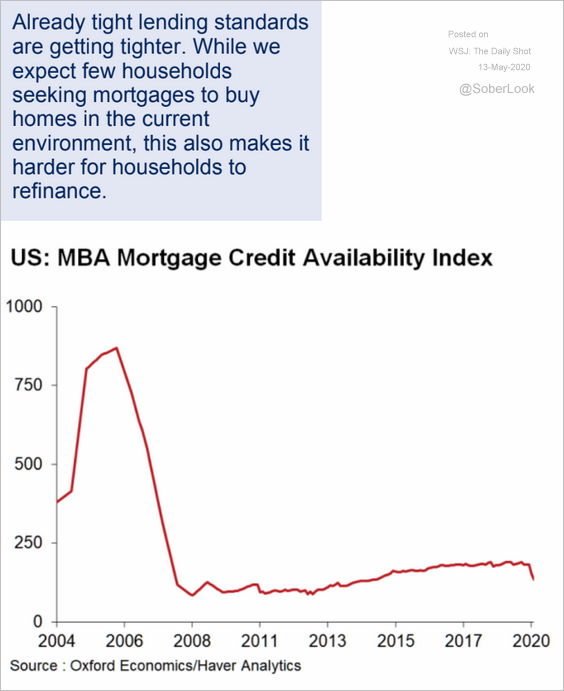 Source: Oxford Economics
The extraordinary increase in unemployment is signaling a spike in delinquencies ahead.
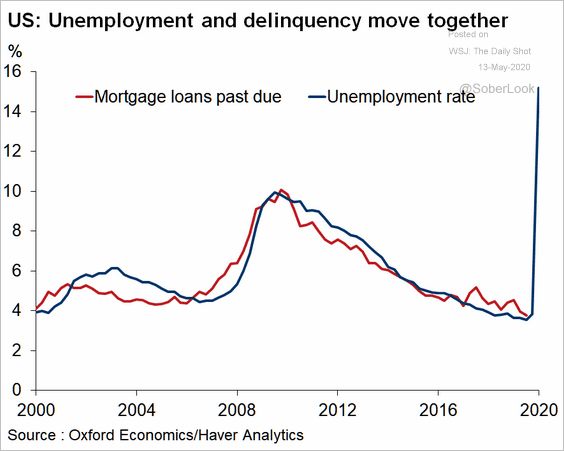 Source: Oxford Economics
——————–
5. This map shows the year-over-year changes in rate lock activity (borrowers locking in mortgage rates).
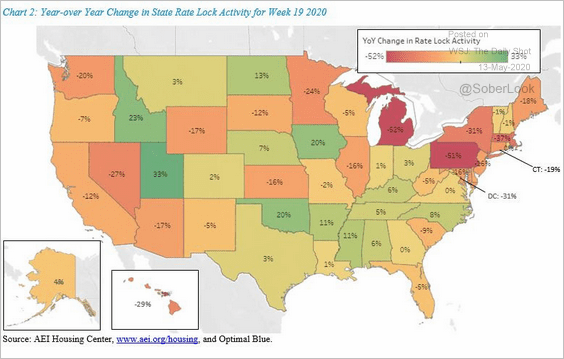 Source: Edward Pinto, AEI Housing Center
Real estate listings declined by 70% vs. 2019, keeping a lid on inventories.
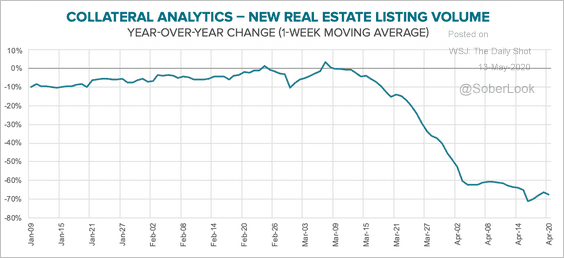 Source: Black Knight
——————–
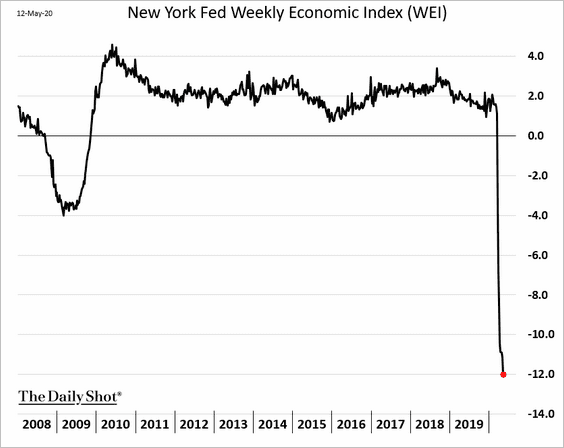
6. The NY Fed’s weekly economic activity index continues to deteriorate, but we are likely near the bottom.
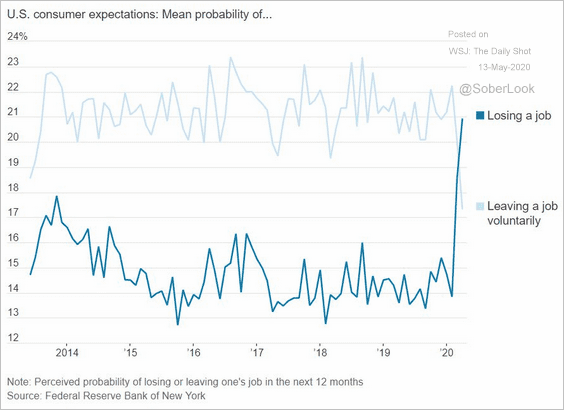
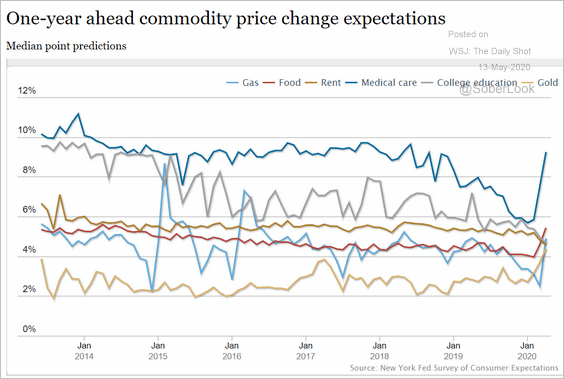
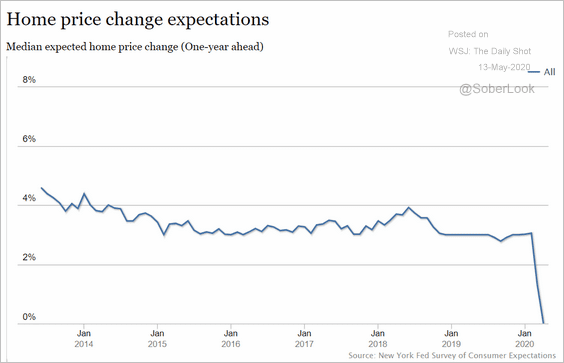
7. Finally, here are some results from the NY Fed’s latest consumer survey.
• Expectations of losing one’s job vs. leaving voluntarily:
 Source: @WSJ Read full article
• Price expectations:
 Source: NY Fed
• Home price expectations:
 Source: NY Fed
Europe
1. The Eurozone monetary base is approaching €3.5 trillion as the ECB boosts quantitative easing.
 Source: BlackRock
2. The spike in credit flows was driven by companies tapping their credit lines.
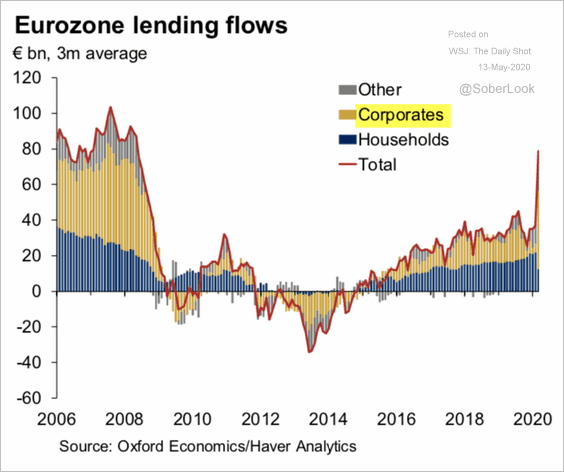 Source: Oxford Economics
3. Norway makes a record withdrawal from its massive wealth fund.
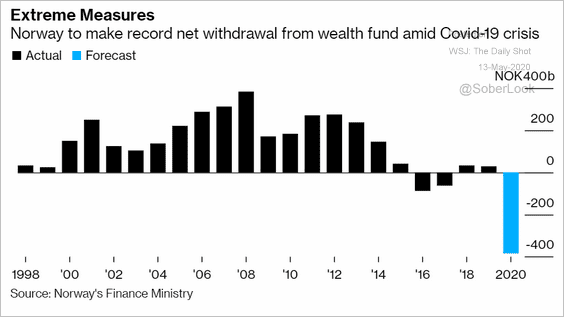 Source: @markets Read full article
4. UK saving rate is about to spike.
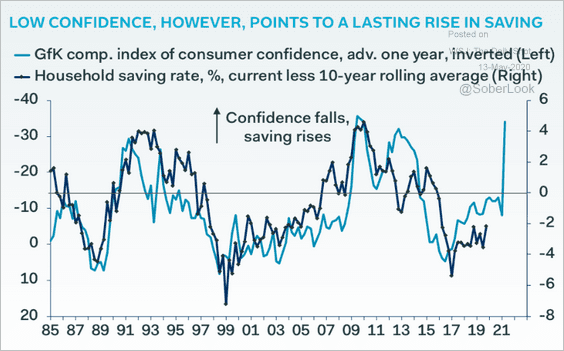 Source: Pantheon Macroeconomics
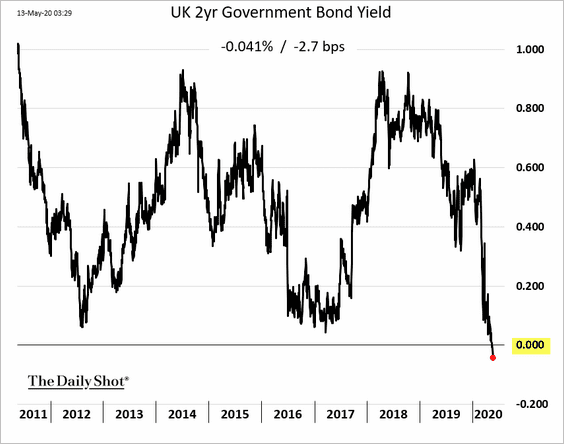
5. The UK 2-year yield dipped into negative territory (record low).
Asia – Pacific
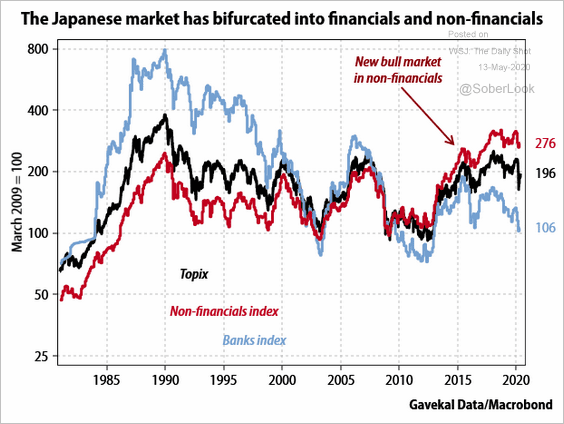
1. Japan’s banking sector underperformance continues to widen.
 Source: Gavekal
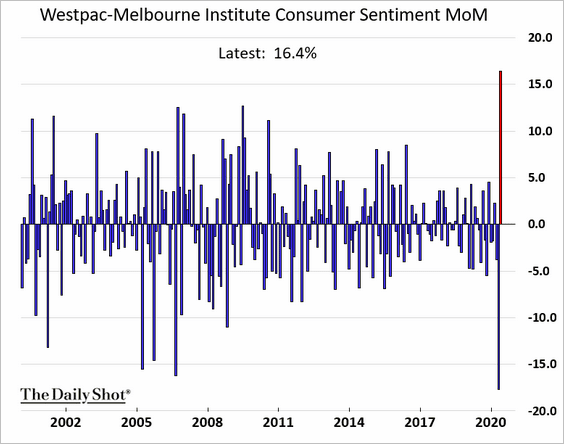
2. As we saw yesterday (#4 here), Australia’s consumer sentiment is rebounding.
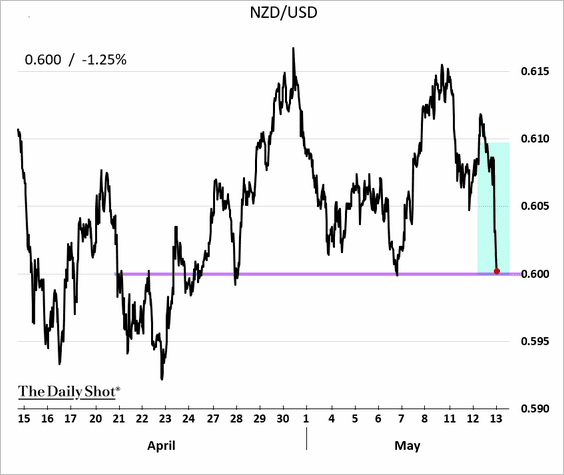
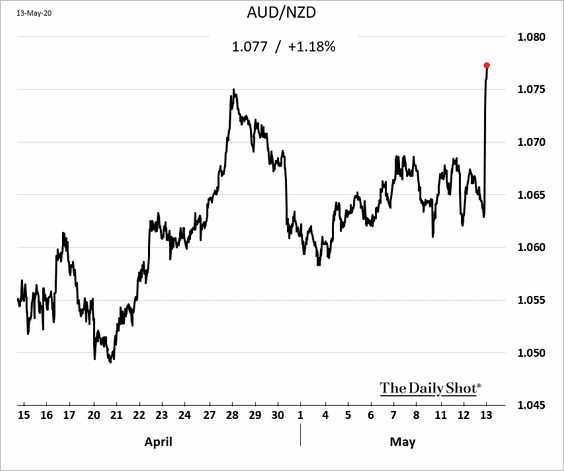
3. The Kiwi dollar tumbled after RBNZ expanded its QE program and announced that it might consider negative rates.
 Source: Reuters Read full article
 Source:
Here is AUD/NZD.
Bond yields fell.
• The 2yr yield (approaching zero):
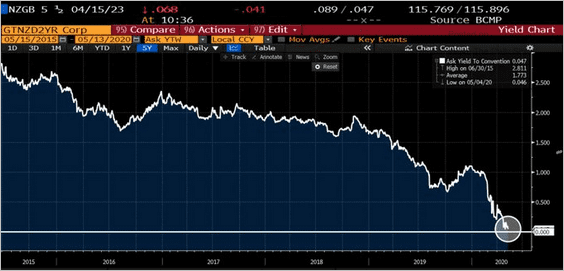 Source: @DavidInglesTV
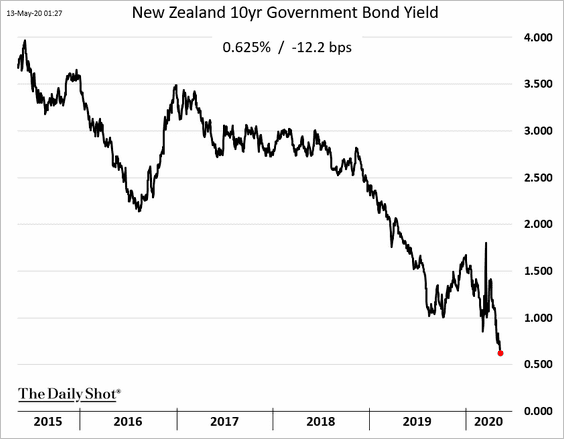
• The 10yr yield:
China
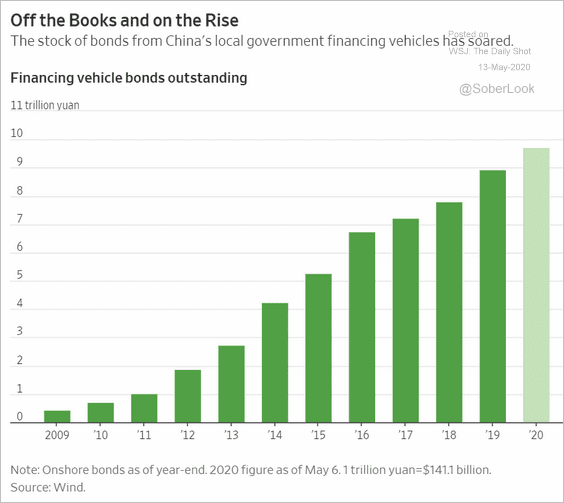
1. The 10yr bond yield has been rising in recent days.
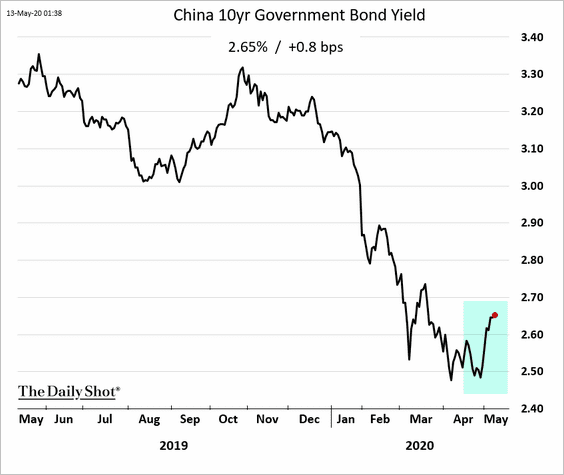
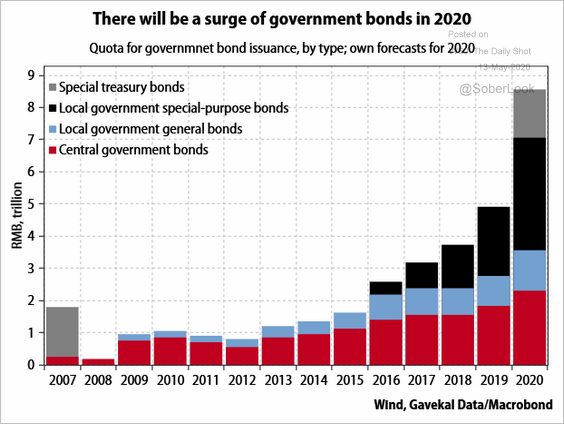
Investors are concerned about the deluge of off-balance-sheet bonds from local governments.
 Source: @WSJ Read full article
 Source: Gavekal
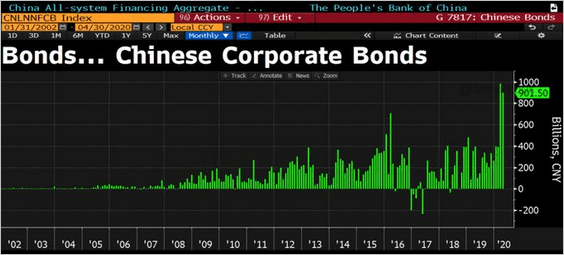
And corporate bond issuance spiked as well.
 Source: @DavidInglesTV
——————–
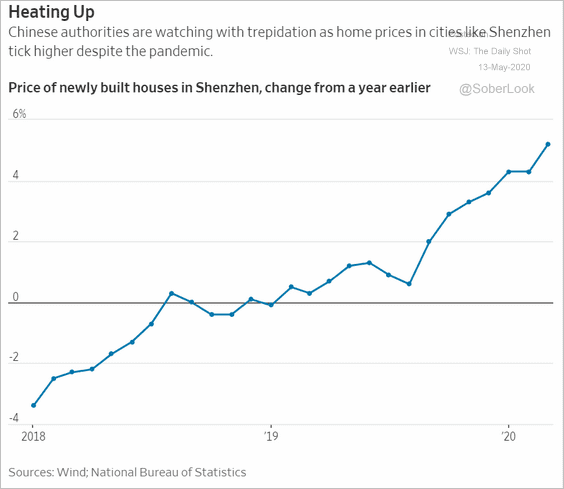
2. Beijing has been cautious about increasing stimulus too much, fearing that fresh liquidity will exacerbate the housing bubble.
 Source: @WSJ Read full article
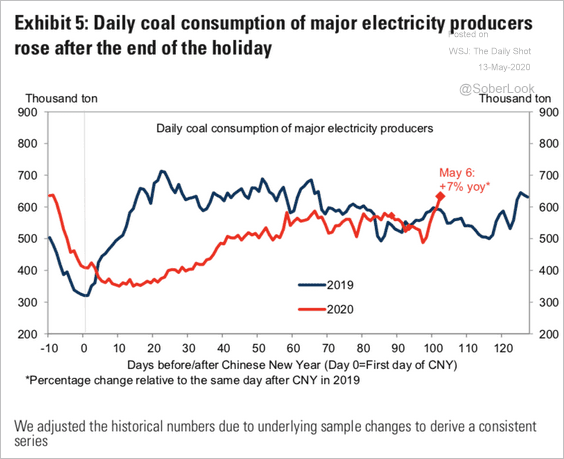
3. Coal consumption is now above last year’s levels.
 Source: Goldman Sachs
Emerging Markets
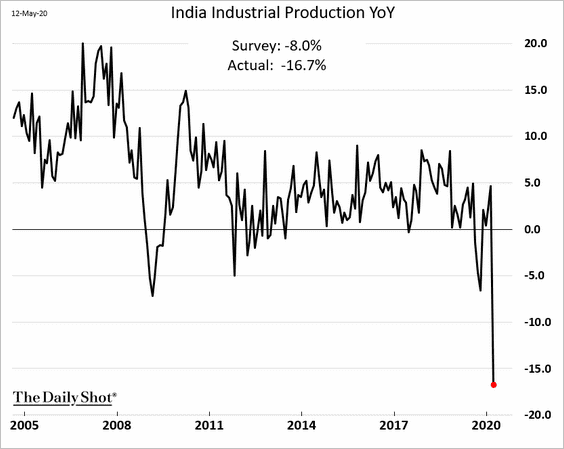
1. Let’s begin with India.
• March industrial production plummetted.
• Rating agencies are downgrading Indian firms’ credit.
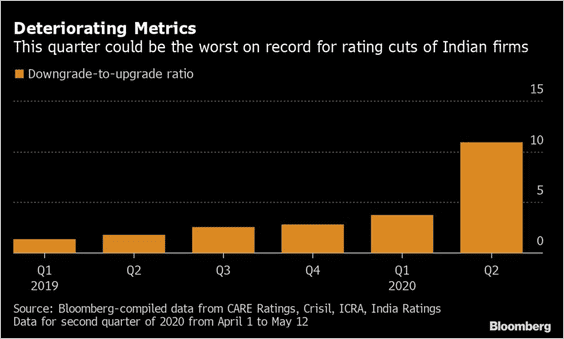 Source: @markets Read full article
• Unemployment has spiked.
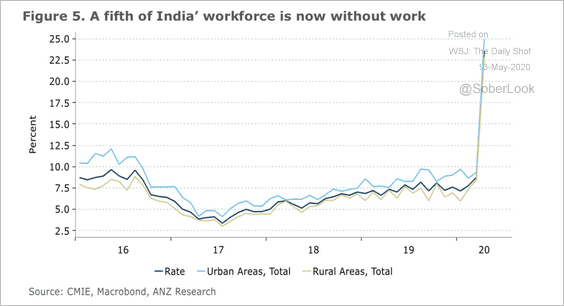 Source: ANZ Research
• But Modi’s stimulus announcement gave the stock market a boost today.
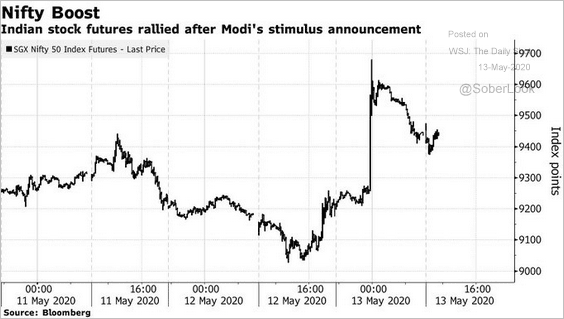 Source: @markets Read full article
——————–
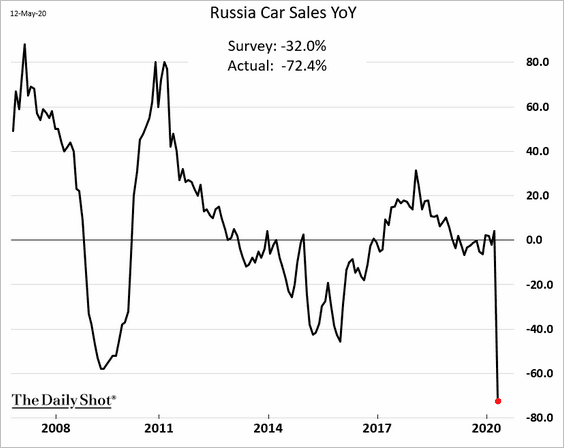
2. Russia’s car sales are down 72% from the same time a year ago.
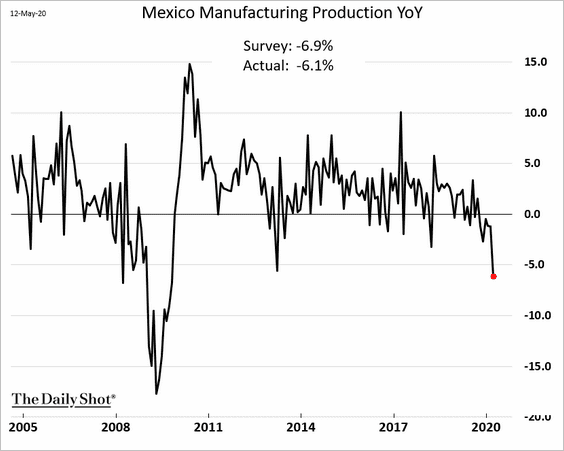
3. Mexico’s manufacturing output decreased sharply in March, and further declines are likely in April.
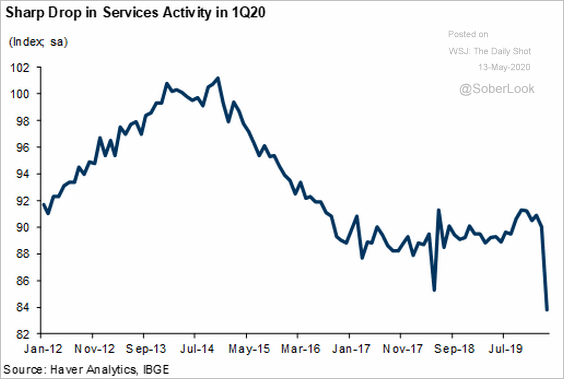
4. Brazil’s service activity has deteriorated.
 Source: Goldman Sachs
The nation’s assets have been underperforming (the real hit another record low yesterday).
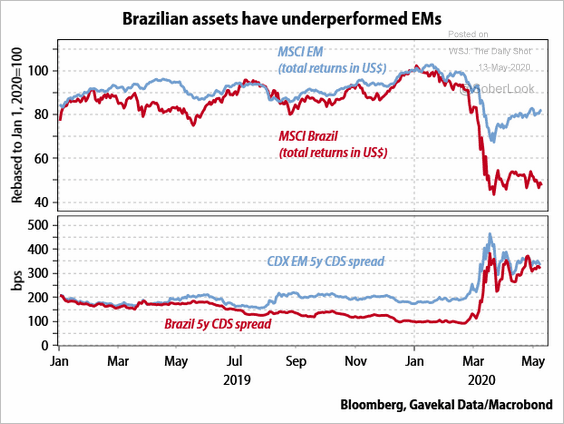 Source: Gavekal
——————–
5. Only a few nations eligible for the G20 Debt Service Suspension Initiative (DSSI) have outstanding Eurobonds. DSSI aims to provide temporary debt relief to fragile countries during the crisis.
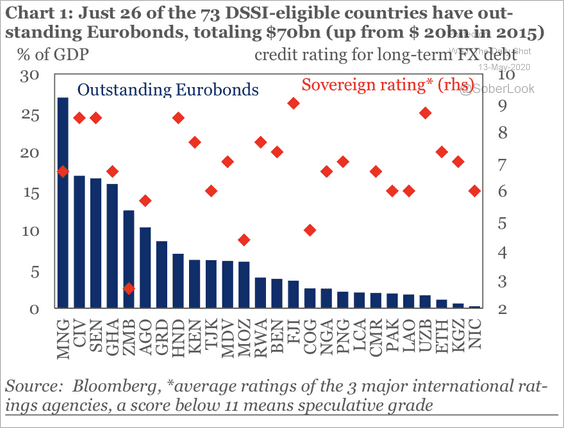 Source: IIF
However, countries like Ghana and Angola face substantial Eurobond repayments.
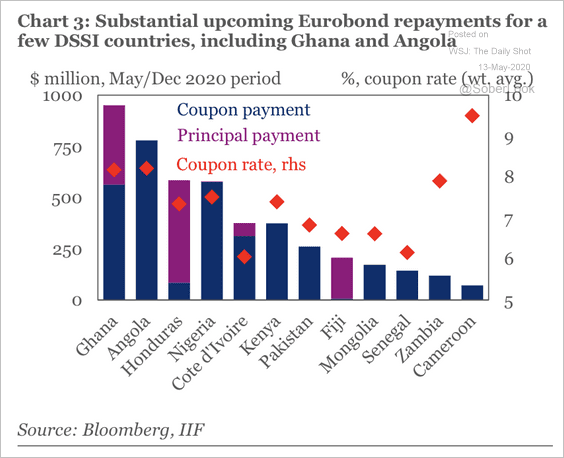 Source: IIF
Commodities
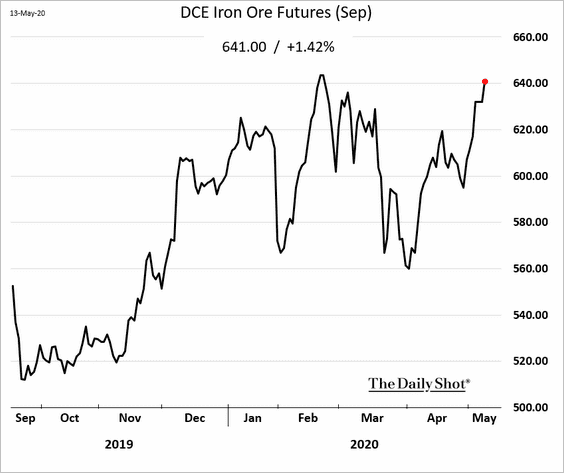
1. China’s iron ore futures are rallying.
 Source: Reuters Read full article
——————–
2. Gold fund flows have accelerated this year.
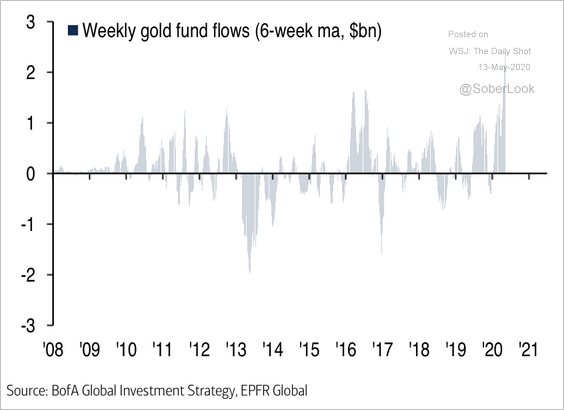 Source: BofA Merrill Lynch Global Research
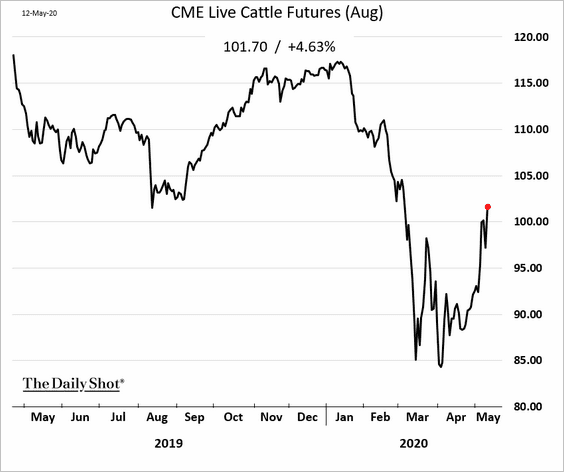
3. US cattle futures are rebounding.
 Source: Reuters Read full article
4. US corn stocks-to-use is on track to reach the highest level since the early 1990s.
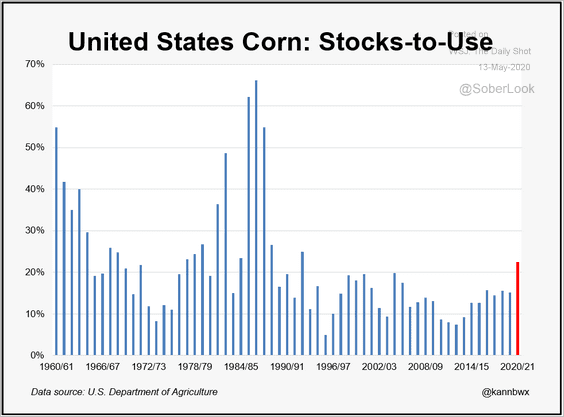 Source: @kannbwx
The USDA’s 2020/21 forecast for soybeans stocks-to-use at 9% would mark a 4-year low.
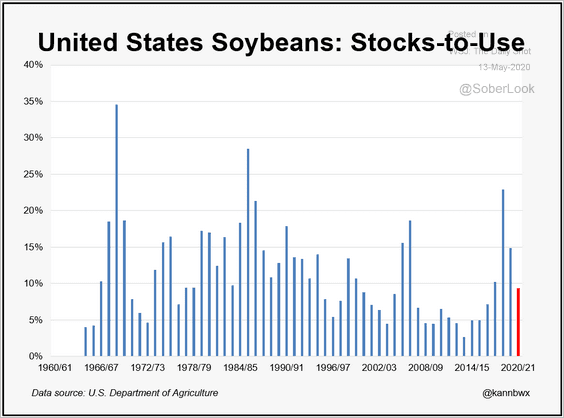 Source: @kannbwx
Energy
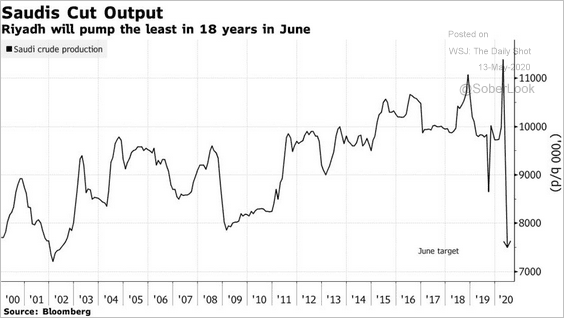
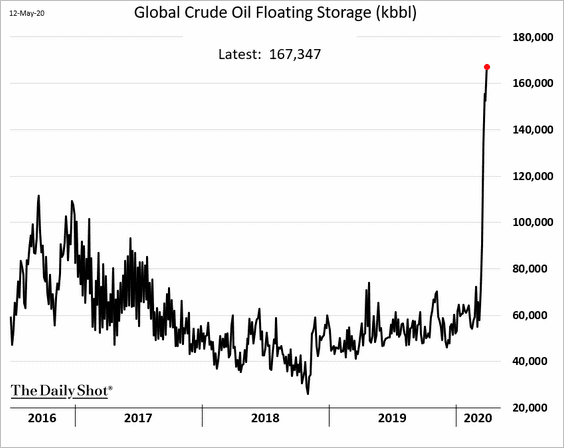
1. The Saudis are cutting oil output again and “encouraging” other producers to do so as well.
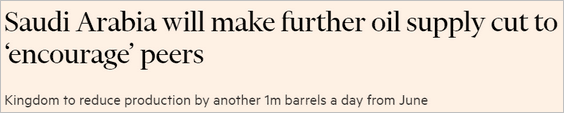 Source: @financialtimes Read full article
 Source: @markets Read full article
The demand loss this year has been much larger than the OPEC+ cuts.
 Source: @markets Read full article
——————–
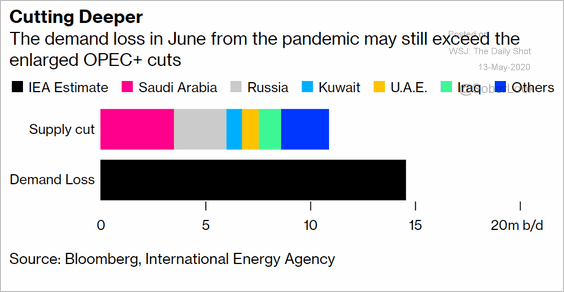
2. Floating storage of crude oil spiked in recent weeks.
 h/t Sophie Caronello
3. The growth in US crude oil stockpiles is slowing.
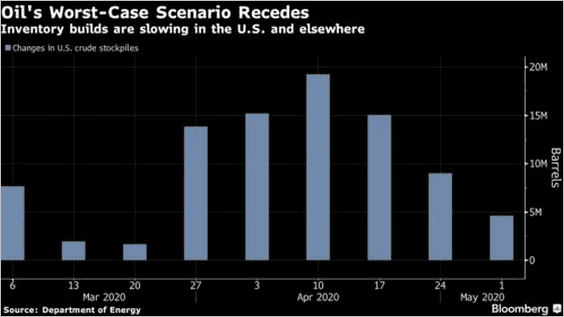 Source: @markets Read full article
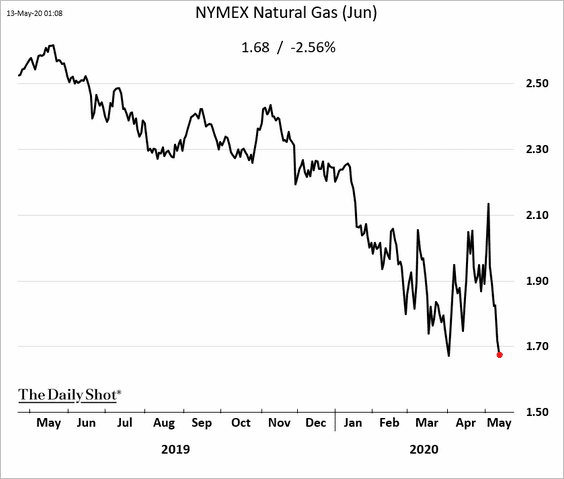
4. The rebound in US natural gas futures has been reversed.
Equities
1. There is a great deal of cash on the sidelines, according to BofA’s global wealth and investment management (GWIM) flow data.
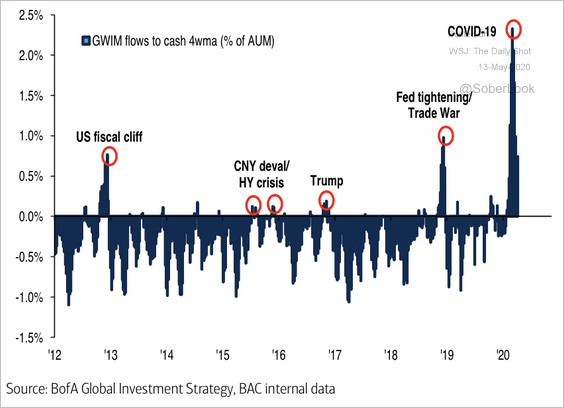 Source: BofA Merrill Lynch Global Research
2. Will accommodative monetary conditions continue to be a tailwind for stocks?
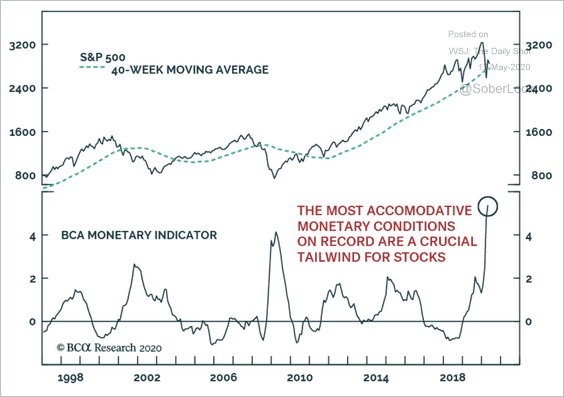 Source: BCA Research
3. Here is the spread between the 10yr Treasury yield and the S&P 500 dividend yield.
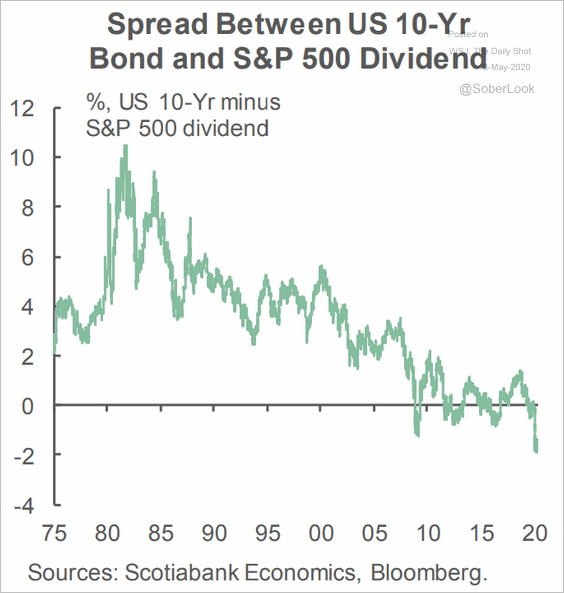 Source: Scotiabank Economics
4. This chart shows the Nasdaq Composite market value ratio to the S&P 500.
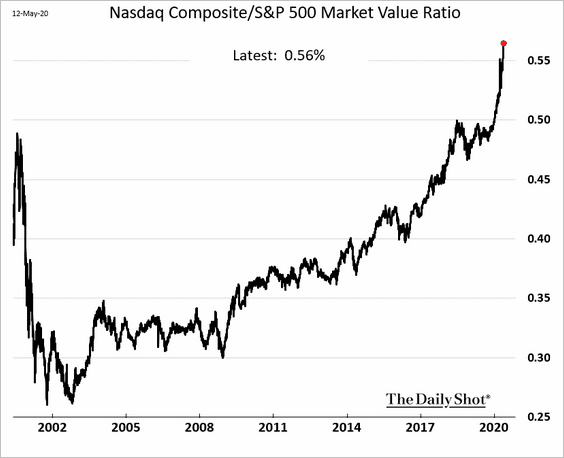 h/t Brandon Kochkodin
And here is the relative performance of the global information technology index vs. the overall market.
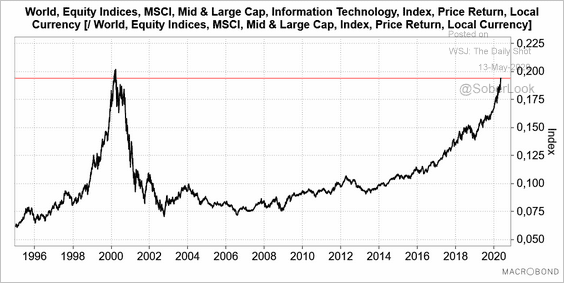 Source: @wb_kNOw_FUTURE
——————–
5. US financials’ relative performance is approaching 2009 lows.
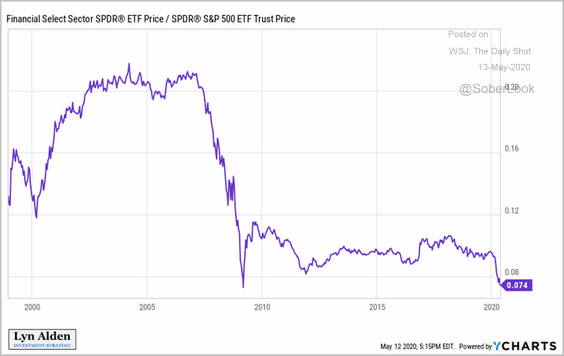 Source: @LynAldenContact
Credit
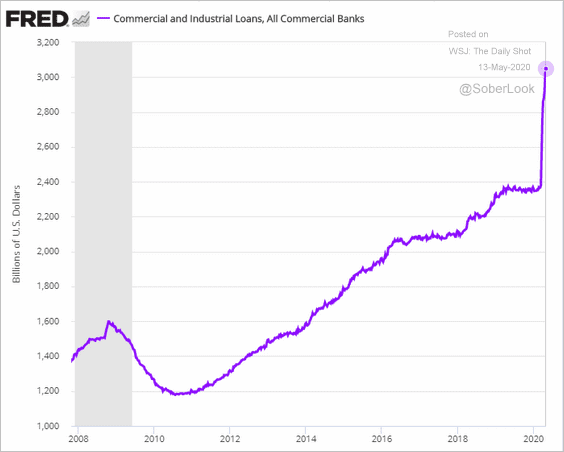
1. US firms continue to tap credit lines, while a few have been able to obtain new loans.
2. Many leveraged loan borrowers have blown through their covenants as earnings collapse. A good percentage of them have been able to get a reprieve from their lenders, often in return for more favorable terms (such as a higher spread).
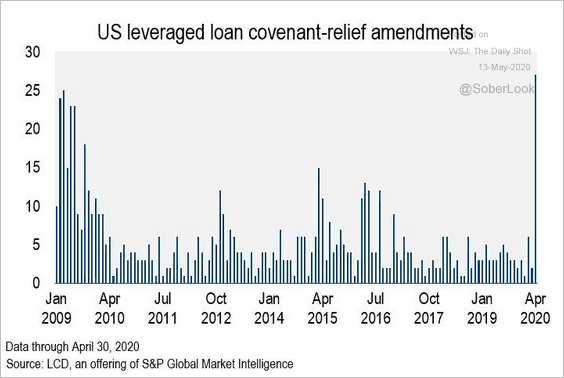 Source: @lcdnews Read full article
3. Tightening bank supply of business credit indicates a much higher speculative-grade corporate default rate.
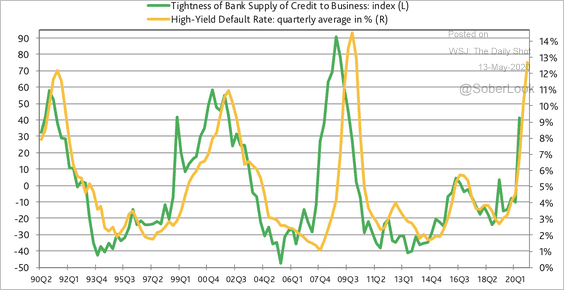 Source: Moody’s Analytics
4. The spike in US regional bank loan-loss provisions could signal wider investment-grade spreads to come.
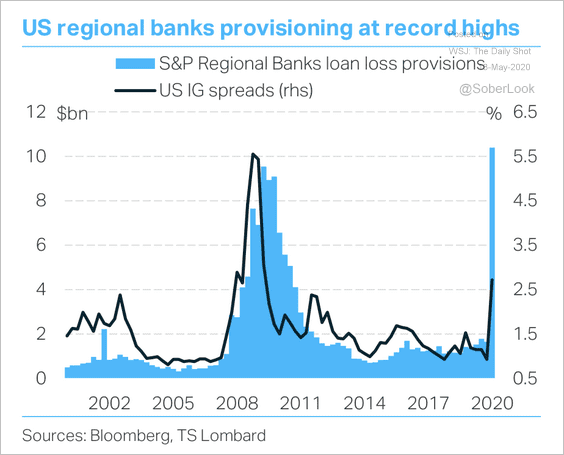 Source: TS Lombard
5. The credit conditions sub-component of the US NACM credit managers’ index reached a record low. The decline reflects a surge in corporate sector late payments.
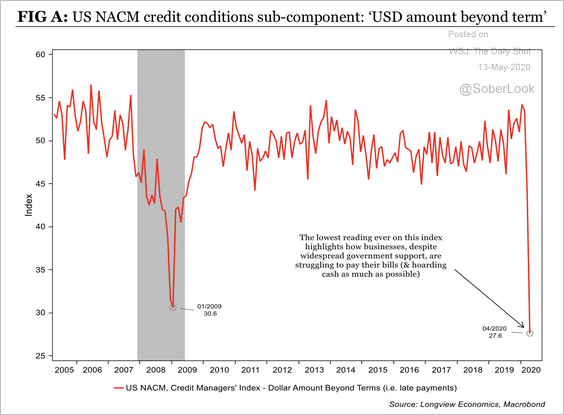 Source: Longview Economics
6. Next, we have some updates on the muni market.
• The muni fund market is dominated by a few large players.
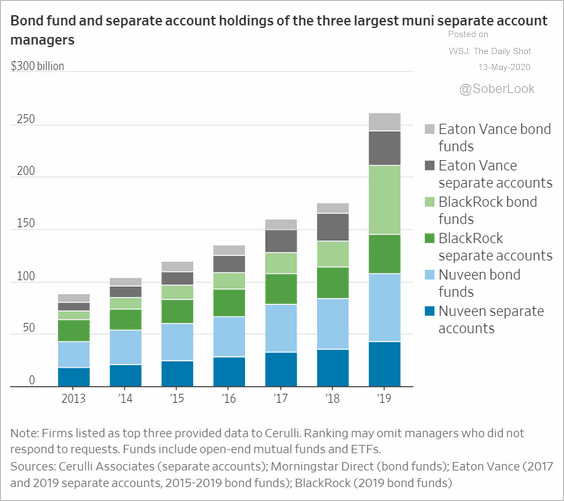 Source: @WSJ Read full article
• Retail investors went on a buying spree as the muni market plunged.
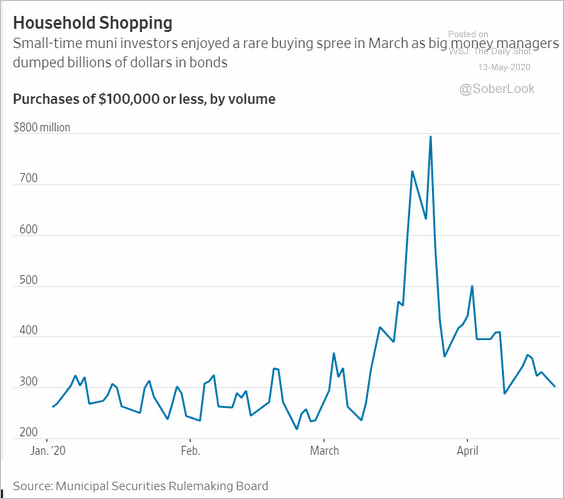 Source: @WSJ Read full article
• The declines in state tax revenues have been enormous.
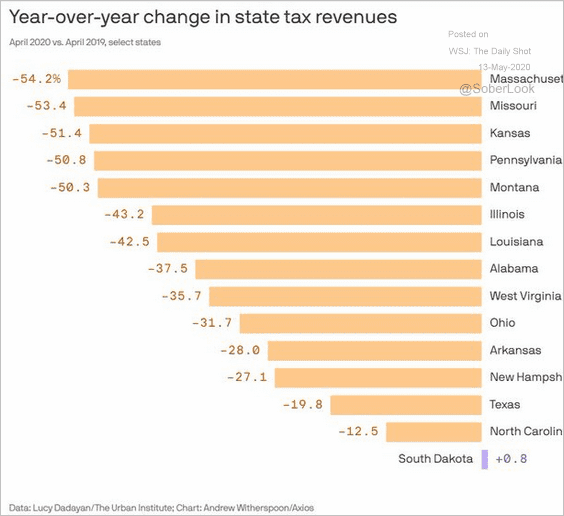 Source: @urbaninstitute, @StefWKight Read full article
Rates
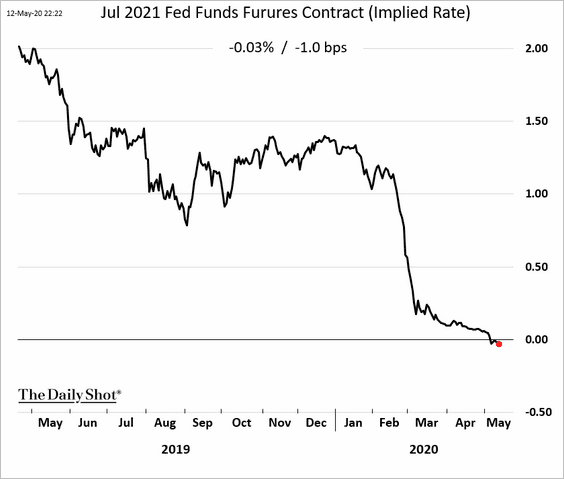
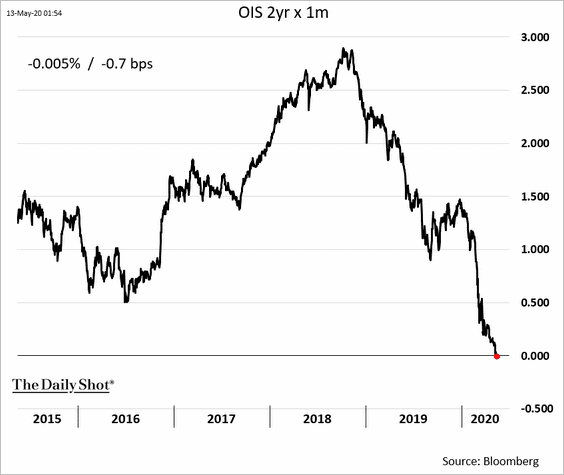
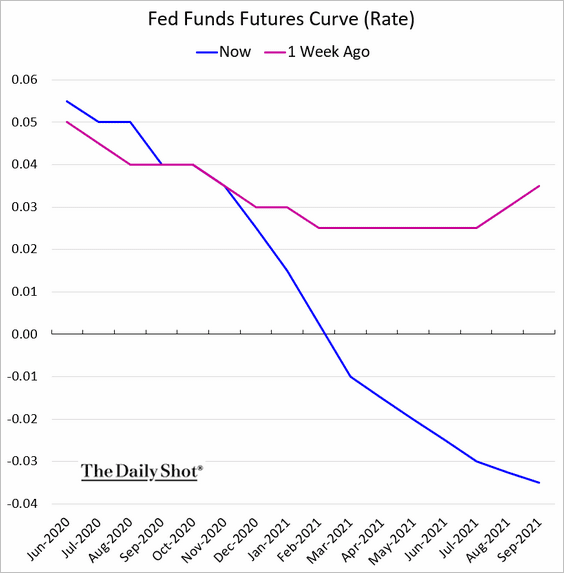
1. The market continues to price in a non-negligible probability of the Fed taking rates into negative territory.
• The July 2021 fed funds futures contract (rate):
• The implied overnight rate two years out (based on overnight index waps).
• The fed funds rate trajectory implied by the futures market:
——————–
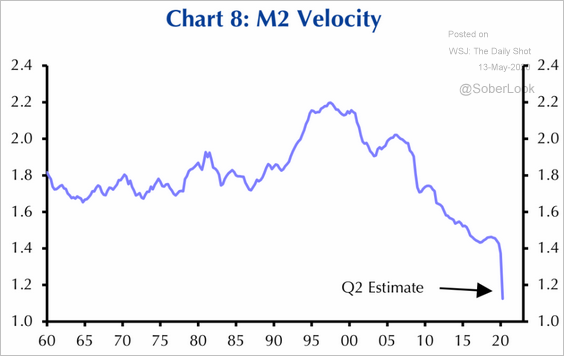
2. The velocity of money is hitting record lows (massive amounts of liquidity but not much economic growth).
 Source: Capital Economics
Globa Developments
1. Let’s start with Bloomberg’s global GDP tracker.
![]() Source: @markets Read full article
Source: @markets Read full article
2. This scatterplot shows quarterly economic growth vs. social distancing measures.
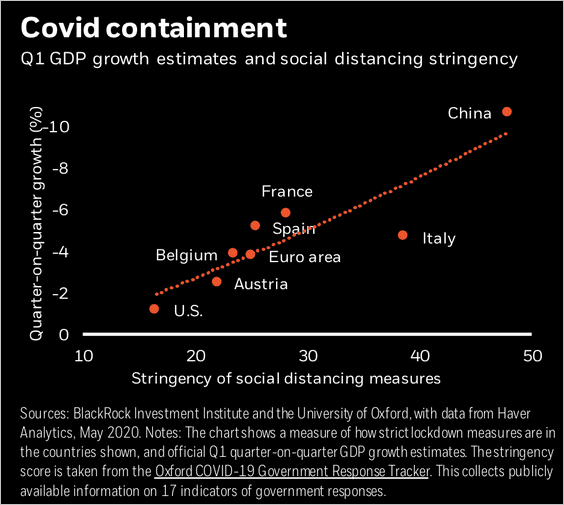 Source: BlackRock
3. Will global inflation expectations rebound from extreme lows?
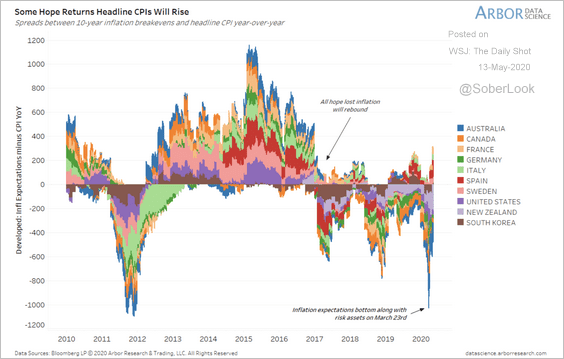 Source: Arbor Research & Trading
——————–
Food for Thought
1. Working from home permanently:
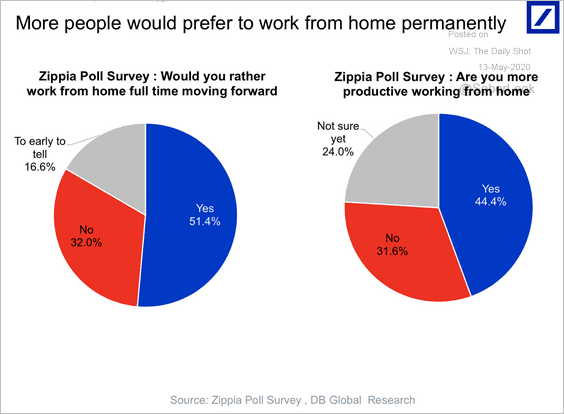 Source: Deutsche Bank Research
2. The pandemic’s uneven impact on …
• death rates:
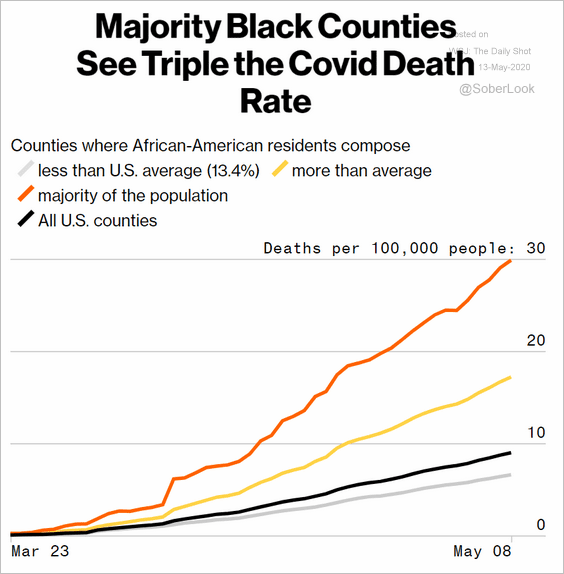 Source: @bbgvisualdata Read full article
• .the labor market:
 Source: Statista
——————–
3. Cannabis use and stress:
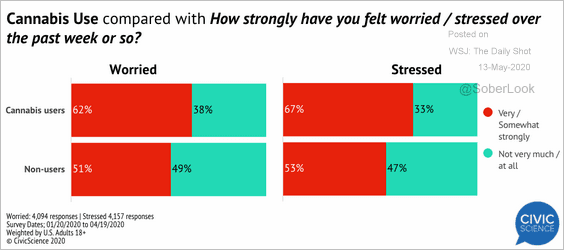 Source: @CivicScience Read full article
4. Who is to blame?
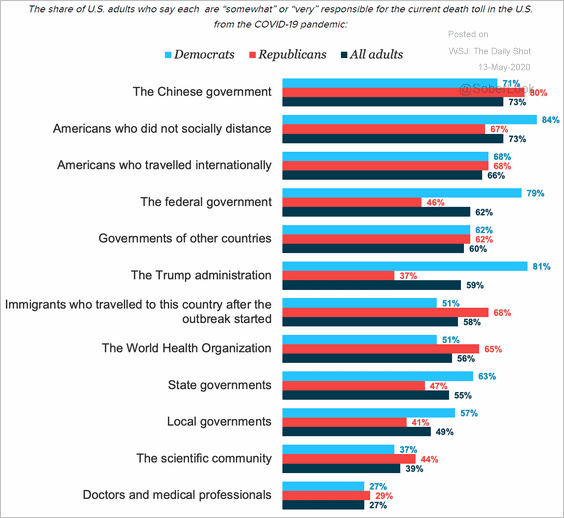 Source: Morning Consult Read full article
5. Remote learning:
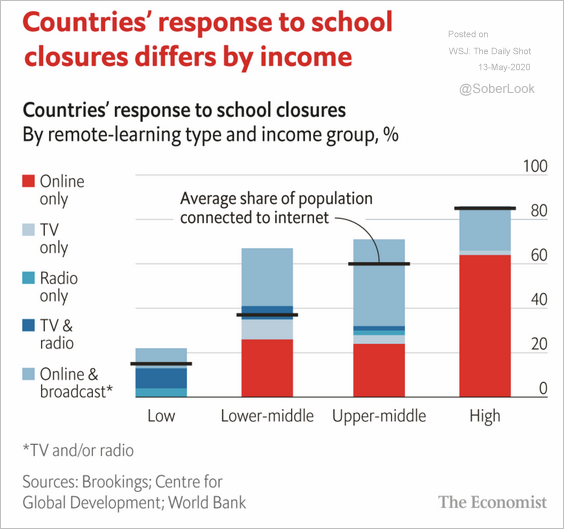 Source: The Economist Read full article
6. North Korea’s missile tests:
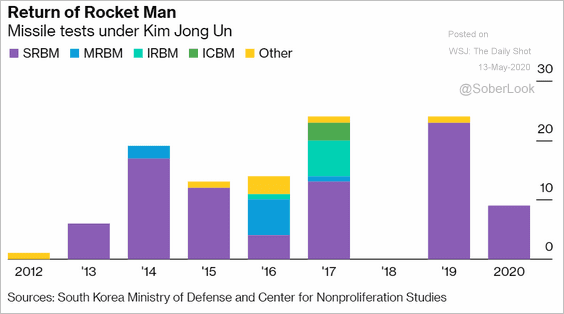 Source: @bpolitics Read full article
7. Nuclear warheads:
![]() Source: Nikkei Asian Review Read full article
Source: Nikkei Asian Review Read full article
![]() Source: @WSJ Read full article
Source: @WSJ Read full article
——————–
8. The use of the word “unprecedented”:
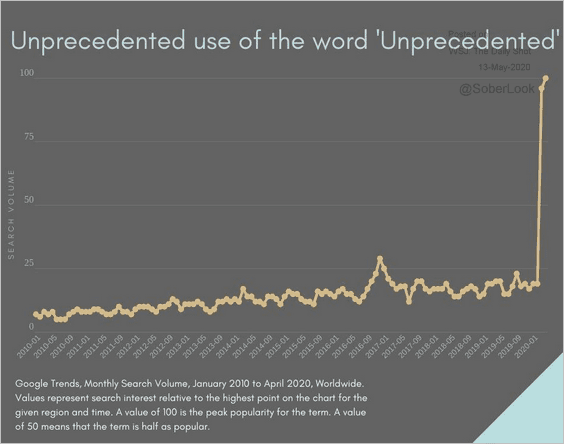 Source: @jayvanbavel
——————–