
The Daily Shot: 15-May-20
• The United States
• Canada
• Europe
• Asia – Pacific
• China
• Emerging Markets
• Cryptocurrency
• Commodities
• Equities
• Credit
• Rates
• Global Developments
• Food for Thought
The United States
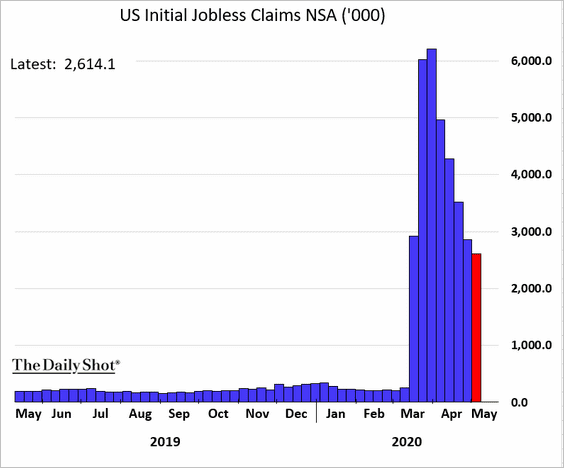
1. Weekly initial unemployment claims remain in the millions.
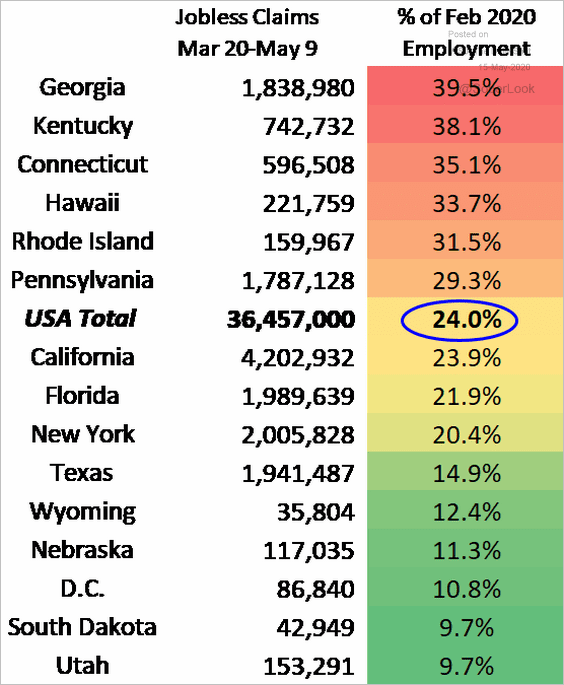
24% of Americans who were employed in February applied for unemployment benefits since March 20th. Note that many did not qualify.
 Source: @jc_econ
——————–
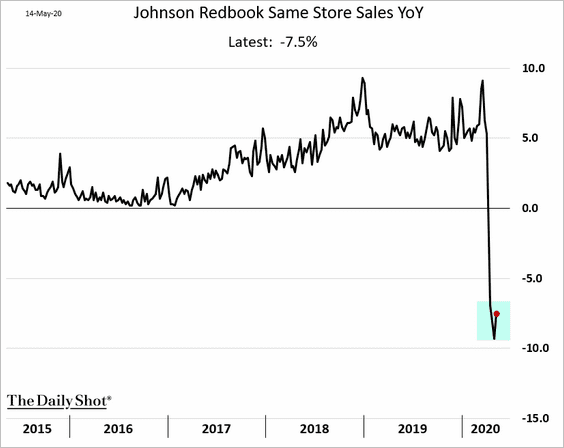
2. Same-store sales seem to have stabilized, albeit significantly below last year’s levels.
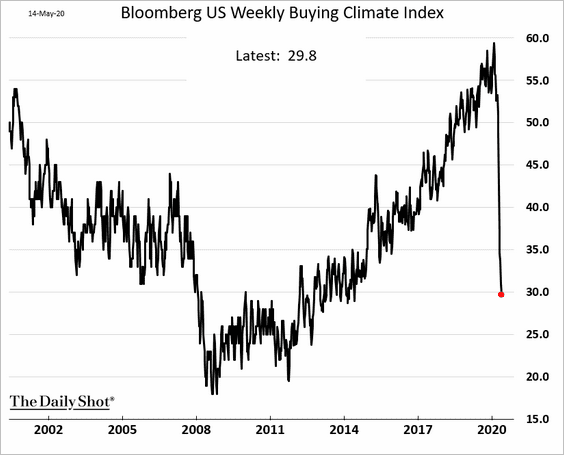
3. Bloomberg’s weekly consumer sentiment index has not yet bottomed.
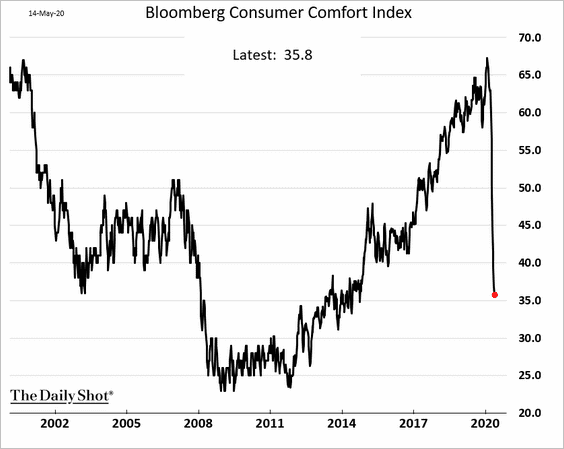
Below is the Buying Climate Index. It may be a while before we see much of a recovery in retail sales.
——————–
4. The NY Fed’s economic activity index (WEI) has not bottomed either.
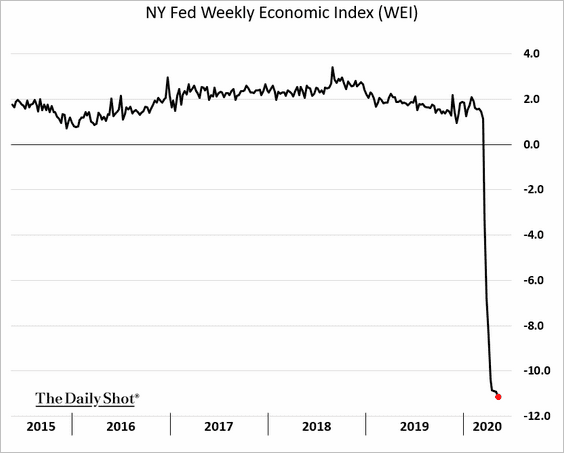
Here is what it tells us about the year-over-year GDP growth.
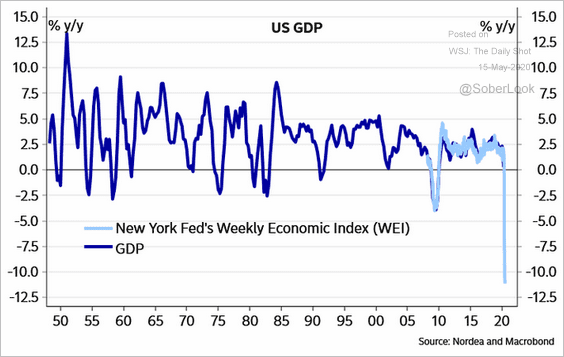 Source: @SvendsenAnders
——————–
5. Import prices have been declining in recent months.
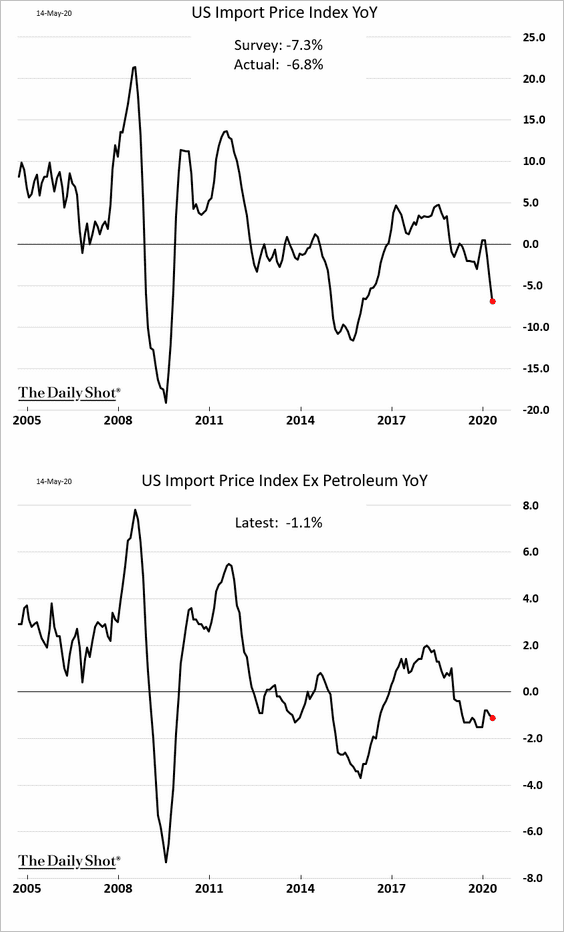
Separately, this year’s oil market crash points to further downside risks for the CPI.
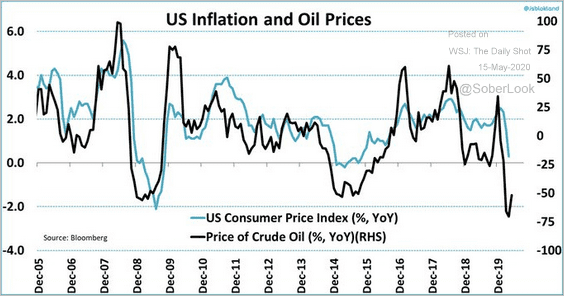 Source: @jsblokland
——————–
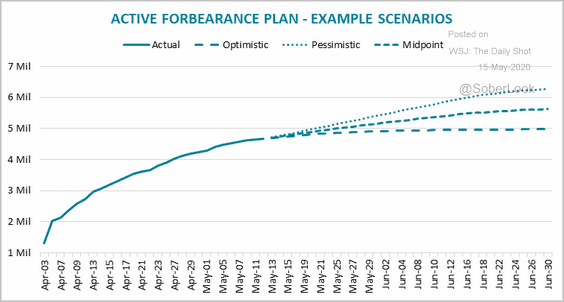
6. Will mortgage forbearance rates keep climbing?
 Source: Black Knight
7. Next, we have some business-sector trends.
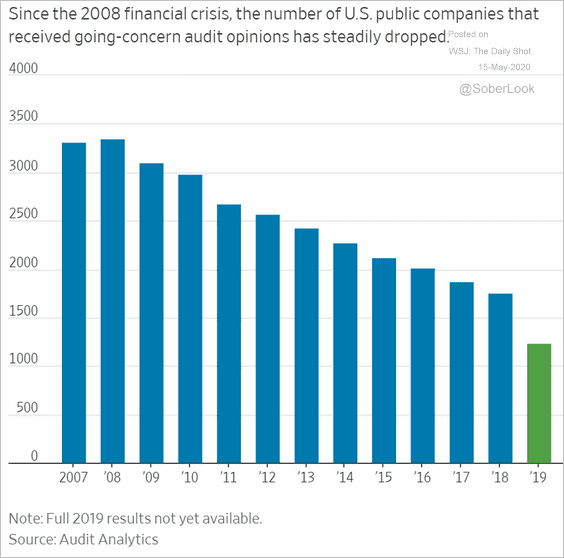
• Fewer public companies have been receiving going-concern audit opinions. Obtaining this qualification will be more challenging this year.
 Source: @WSJ Read full article
• CFOs are extending their timelines to get back to business as usual (2 charts).
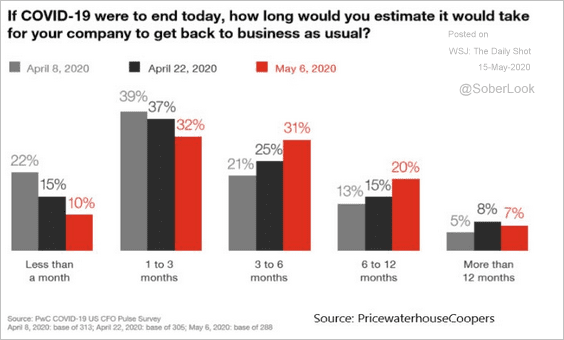 Source: @LizAnnSonders, @PwC
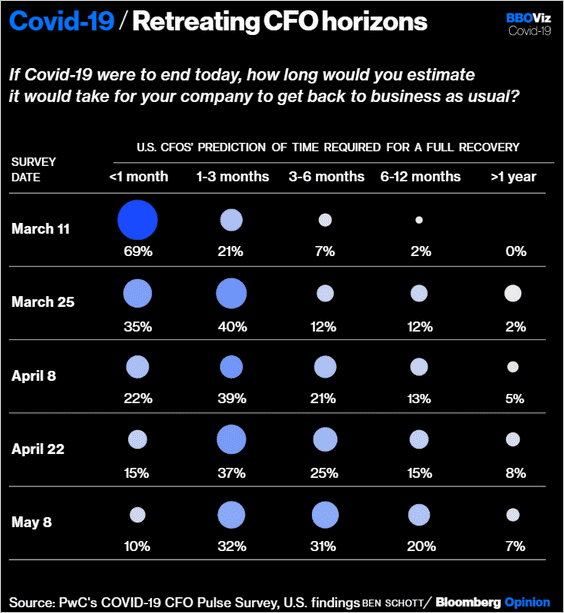 Source: @bopinion Read full article
• The number of CEO departures tumbled this year.
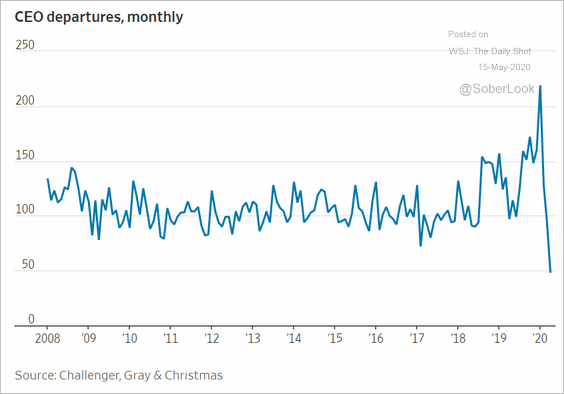 Source: @WSJ Read full article
Canada
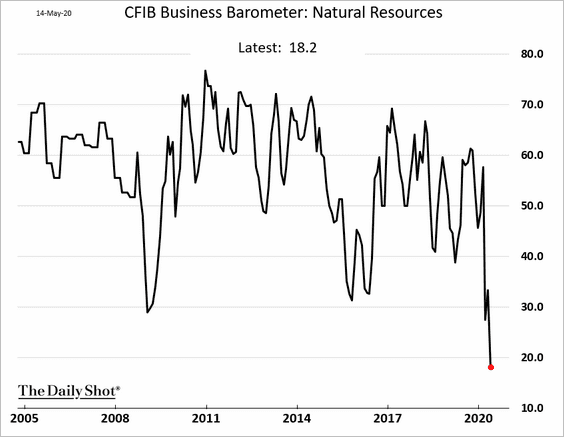
1. Canada’s small business sentiment indicator, CFIB, has rebounded sharply this month.
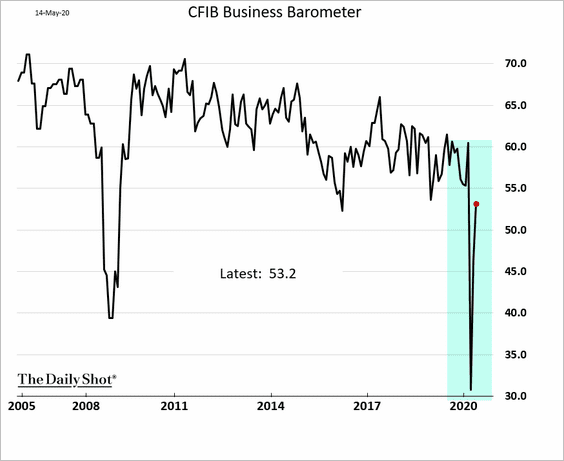
The construction index has fully recovered.
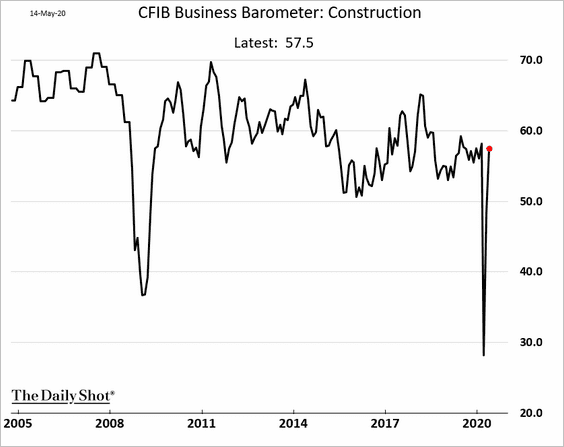
The natural resources sector remains an outlier.
——————–
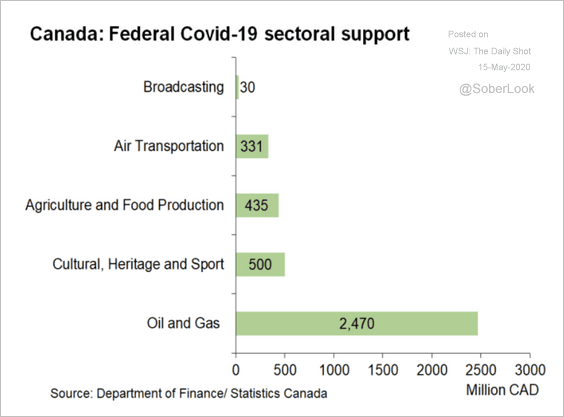
2. Given the trend in the chart above, federal sectoral support has been focused on the oil and gas sector.
 Source: Oxford Economics
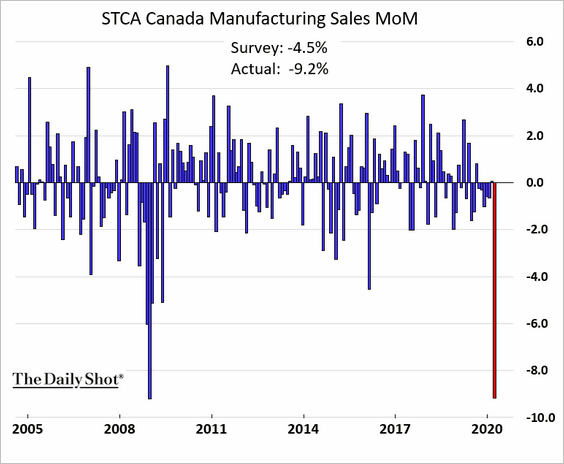
3. Manufacturing sales tumbled in March.
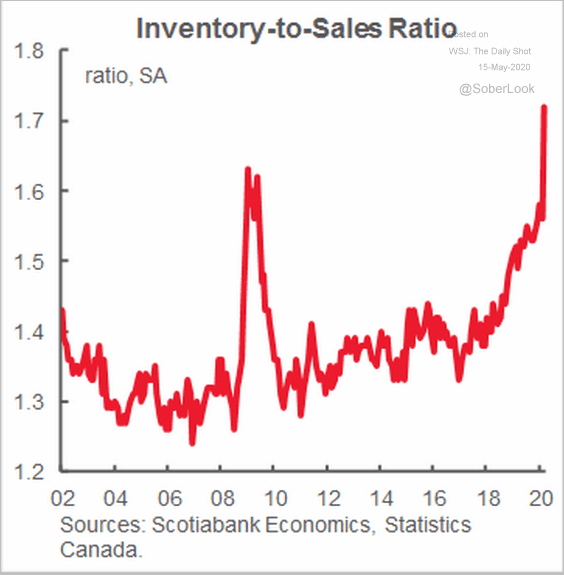
4. Here is Canada’s inventory-to-sales ratio.
 Source: Scotiabank Economics
Europe
1. Eurozone household balance sheets appeared healthy going into this crisis.
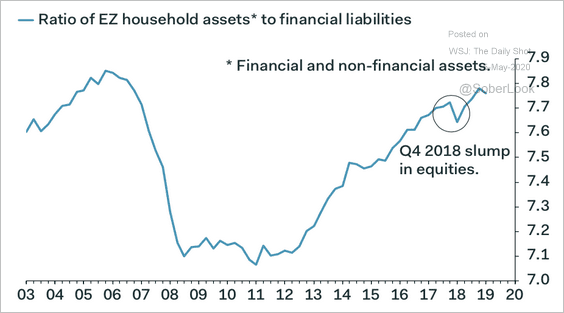 Source: Pantheon Macroeconomics
2. Swiss consumer confidence hit the lowest level in recent history.
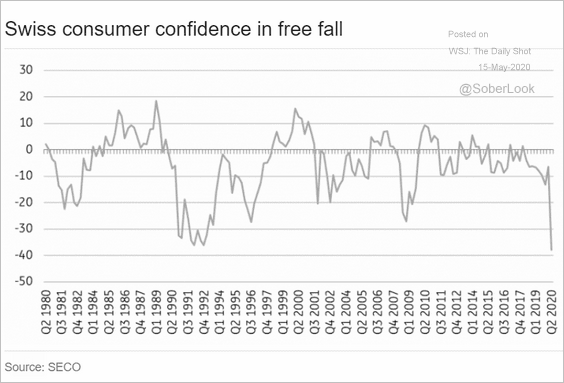 Source: ING
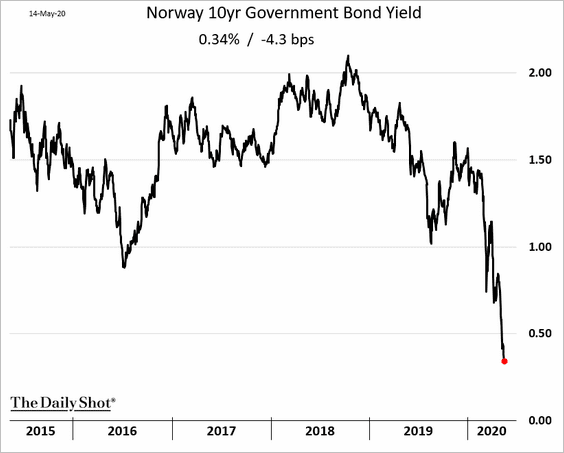
3. Next, we have some updates on Norway.
• Norges Bank has been the biggest buyer of the Norwegian krone (NOK) this year.
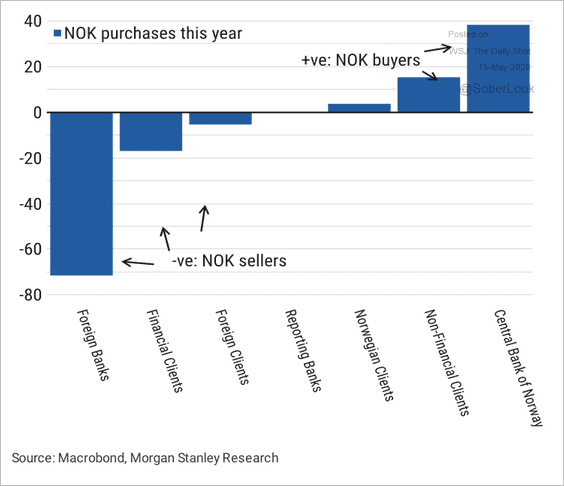 Source: Morgan Stanley Research
• NOK’s sensitivity to Eurozone equities has increased over the past year.
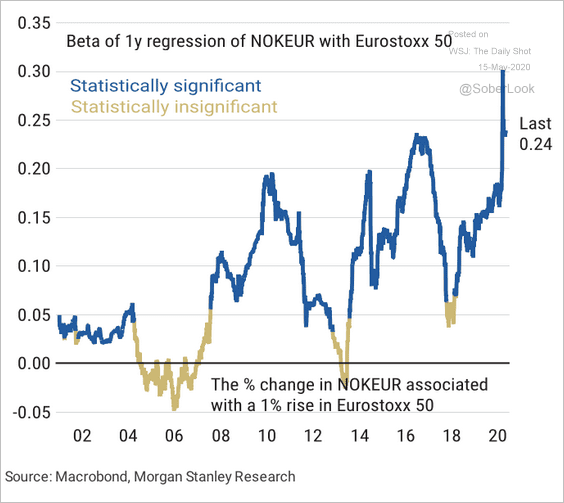 Source: Morgan Stanley Research
• Government bond yields are tumbling.
——————–
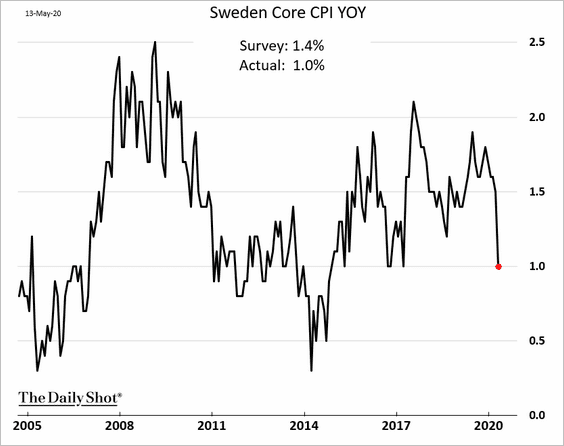
4. Sweden’s CPI is has been moderating.
5. Below, we have some data on the small business share of employment in the EU.
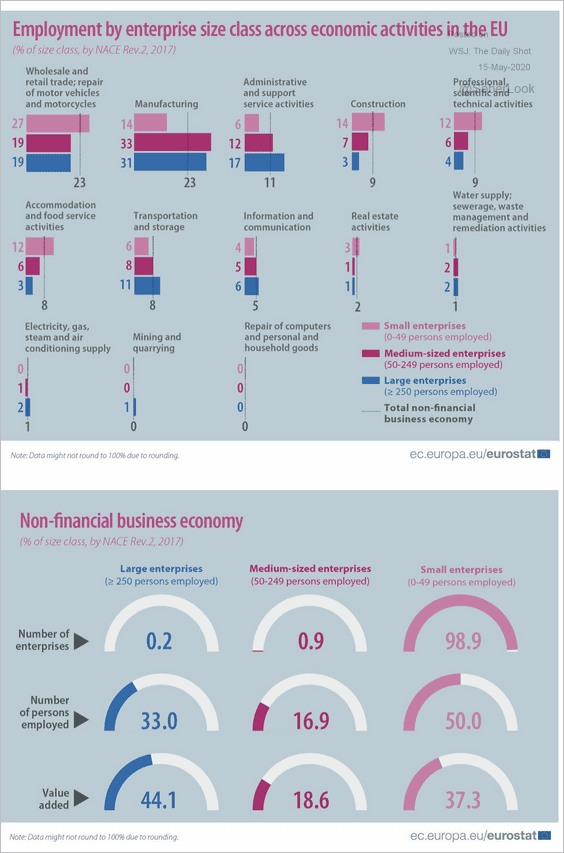 Source: Eurostat Read full article
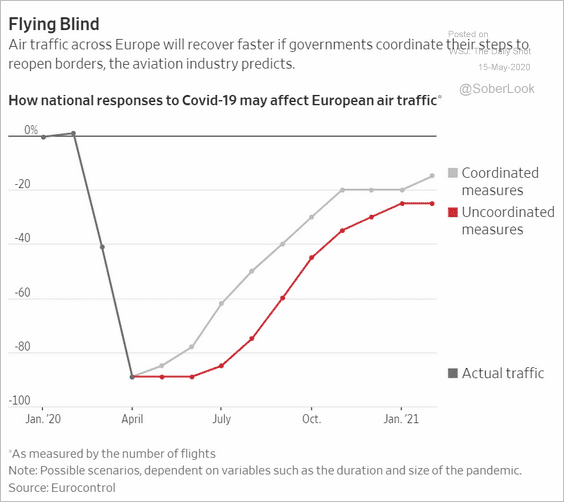
6. Given the phase of the epidemic, Europe is reopening earlier than Asia.
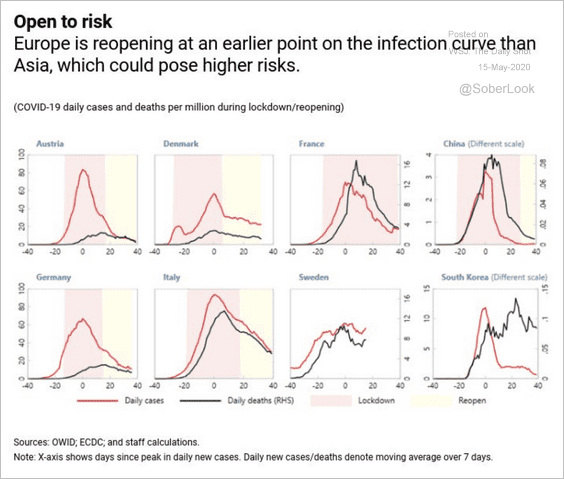 Source: IMF Read full article
Coordination will be critical.
 Source: @WSJ Read full article
Asia – Pacific
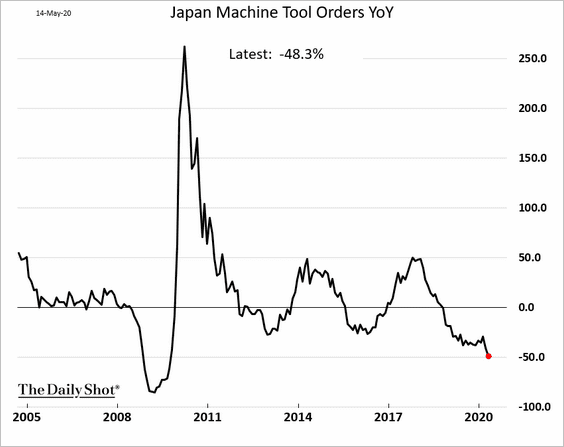
1. Japan’s machine tool orders are nearly half what they were a year ago.
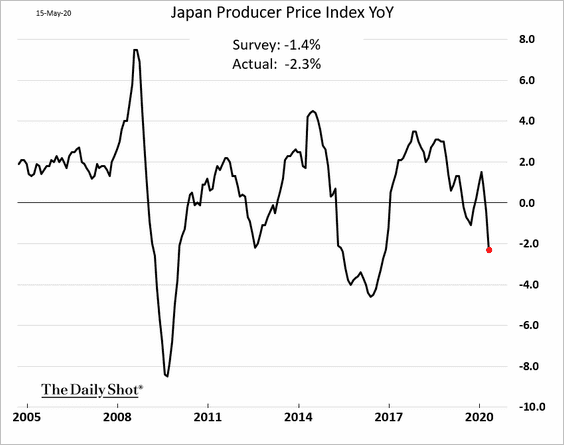
The nation’s PPI is back in deflation.
——————–
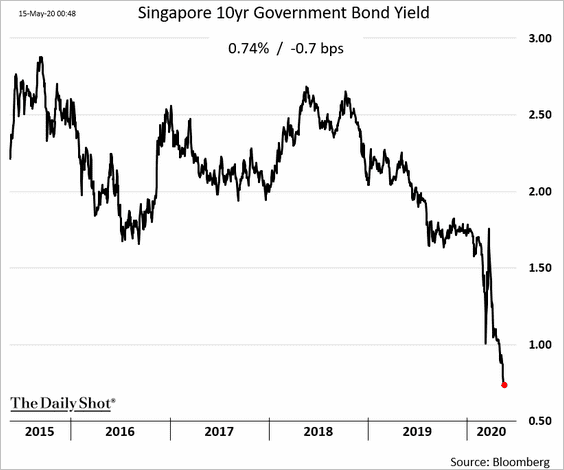
2. Singapore’s bond yields are tumbling.
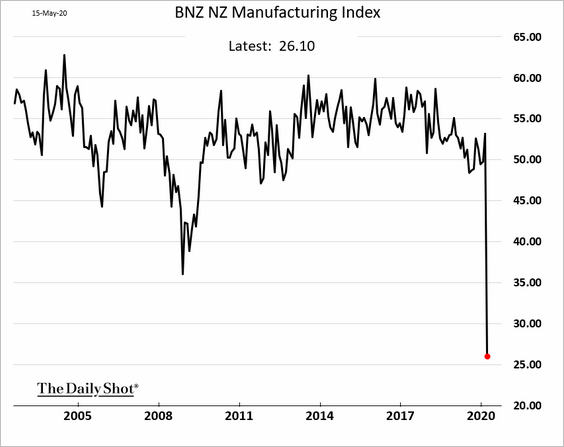
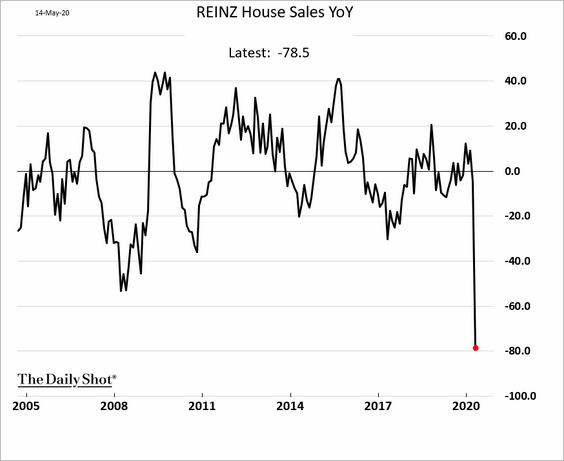
3. New Zealand’s manufacturing activity and home sales crashed in April (2 charts).
——————–
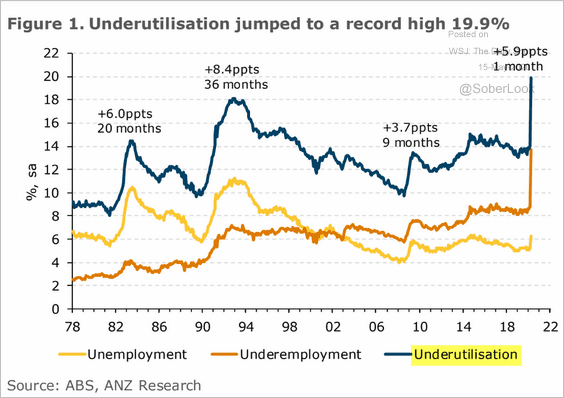
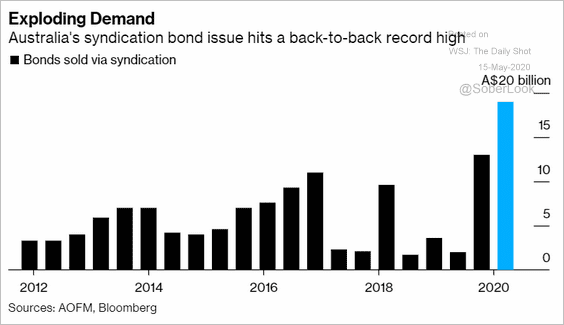
4. Next, we have some updates on Australia.
• Labor underutilization:
 Source: ANZ Research
• Government bond sales:
 Source: @markets Read full article
• Dependence on China:
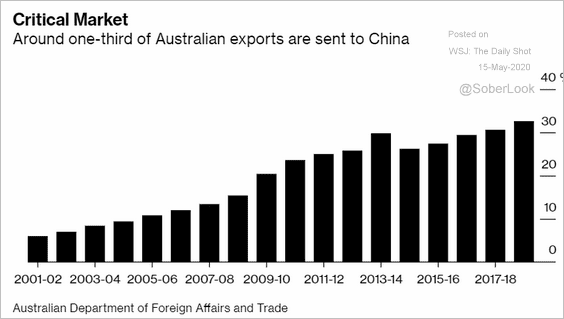 Source: @markets Read full article
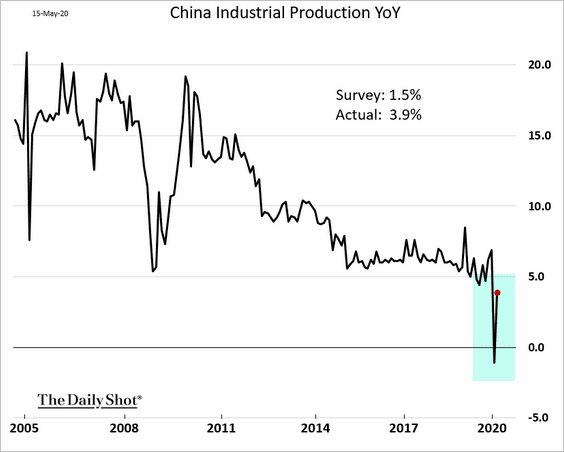
China
1. Industrial production rebounded last month.
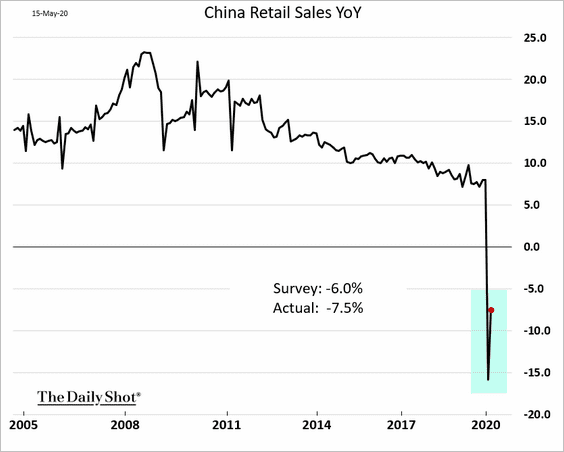
2. Retail sales remain weak.
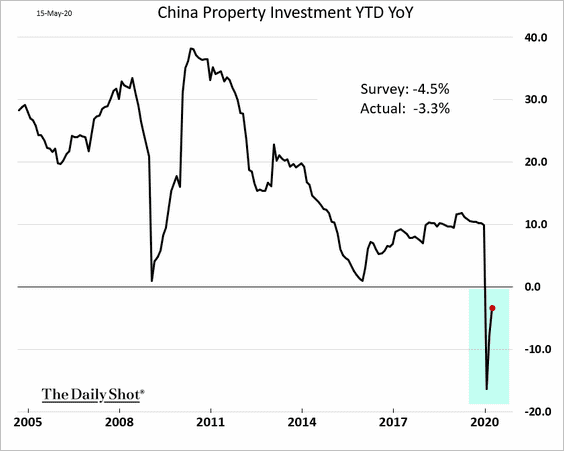
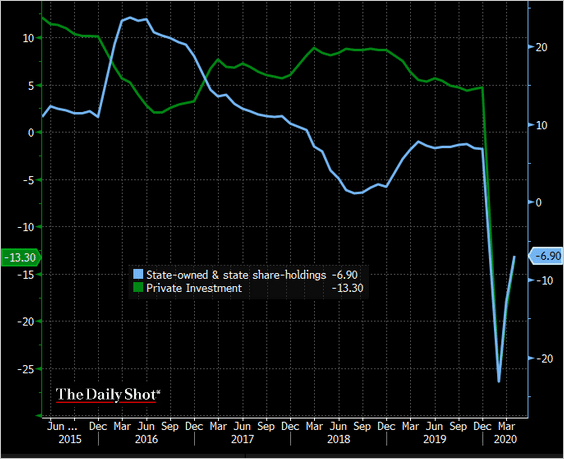
3. Fixed asset investment is recovering.
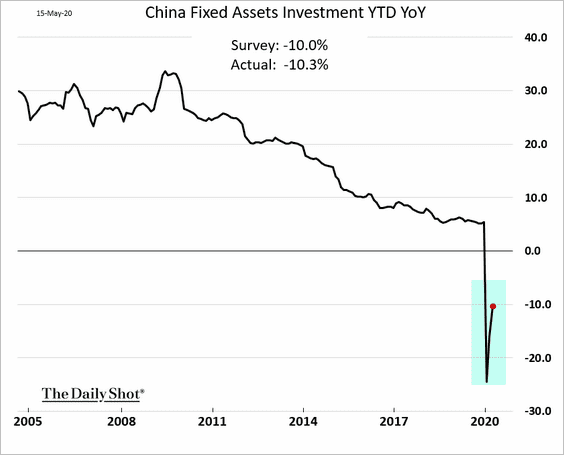
This chart shows state vs. private-sector investment.
 Source: @TheTerminal
——————–
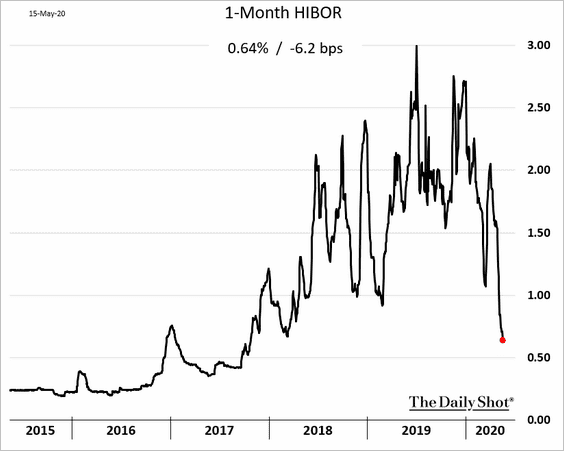
4. Hong Kong’s interbank rates plunged in recent weeks.
Emerging Markets
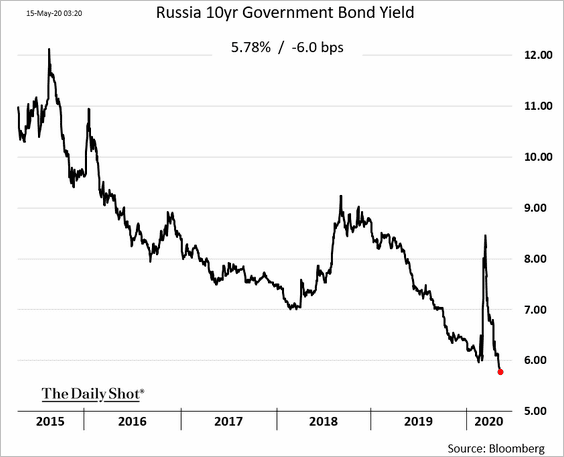
1. Russia’s domestic bond yields are hitting multi-year lows.
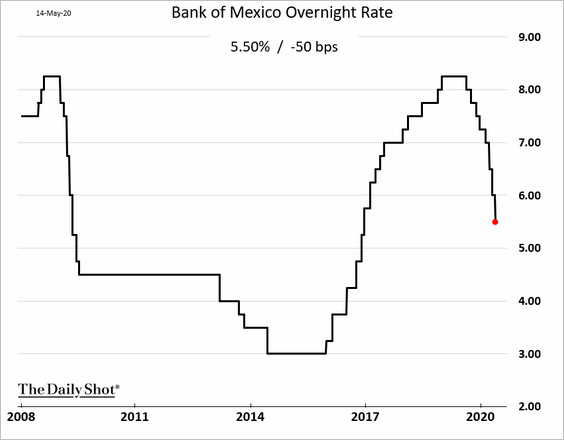
2. Mexico’s central bank cut rates again, and there is room for more easing.
3. India’s labor market took a severe blow in recent weeks.
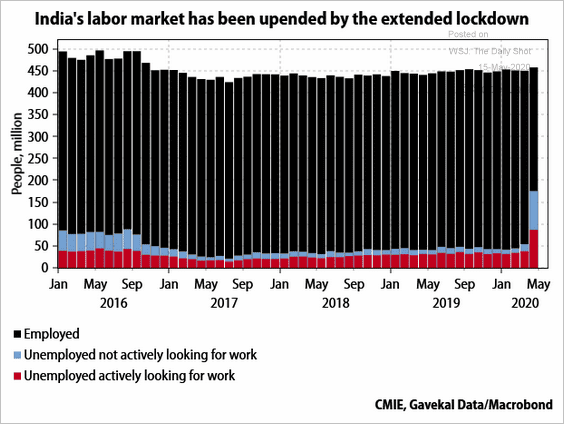 Source: Gavekal
4. Currency vulnerability is correlated with dollar-denominated sovereign spreads.
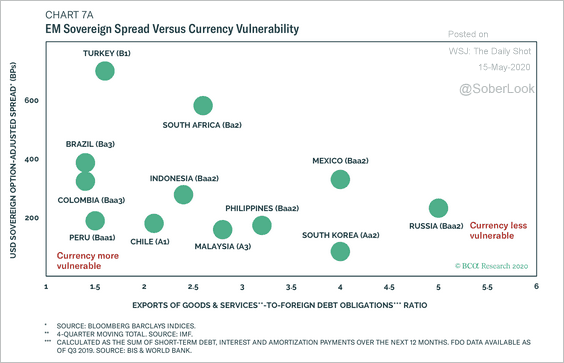 Source: BCA Research
Cryptocurrency
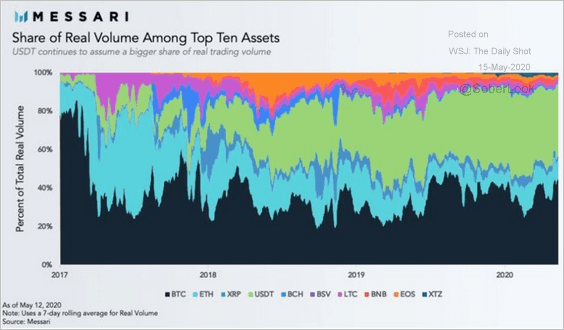
1. The cryptocurrency market is becoming more concentrated, with volumes dominated by Bitcoin and Tether (stablecoin).
 Source: @markets Read full article
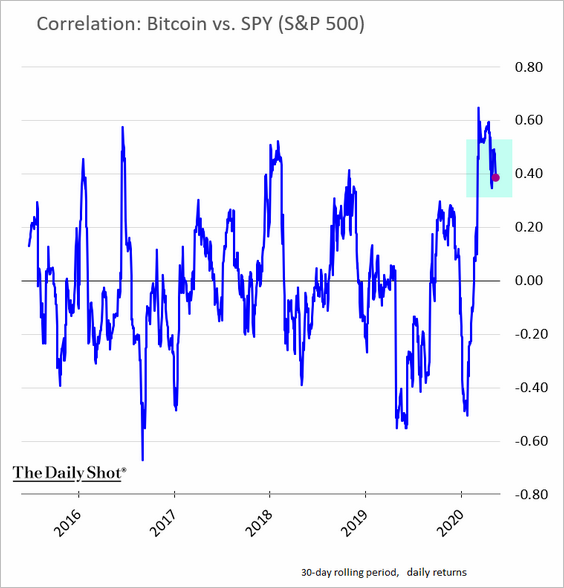
2. Bitcoin’s correlation with stocks seems to be easing.
Commodities
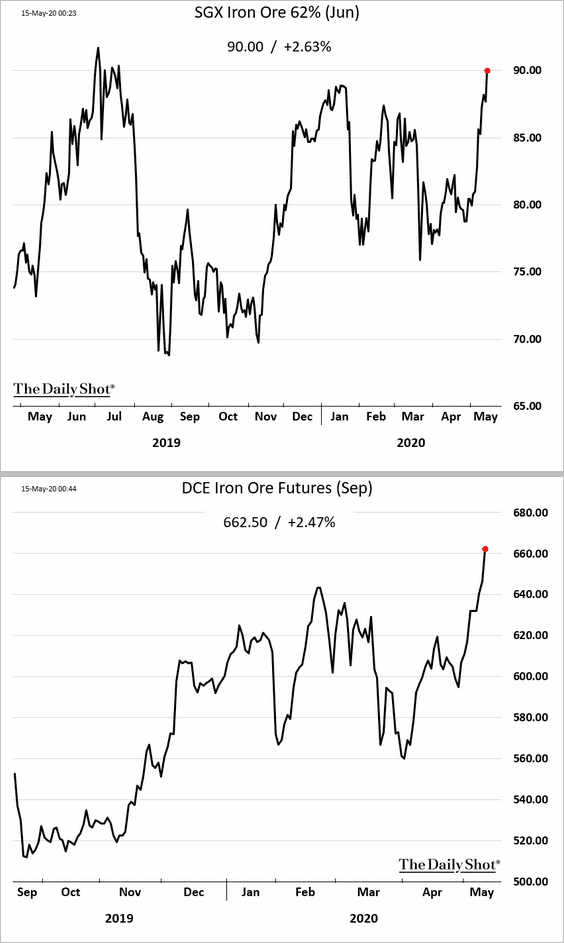
1. Iron ore futures continue to rally (charts show prices in Singapore and Dalian, China).
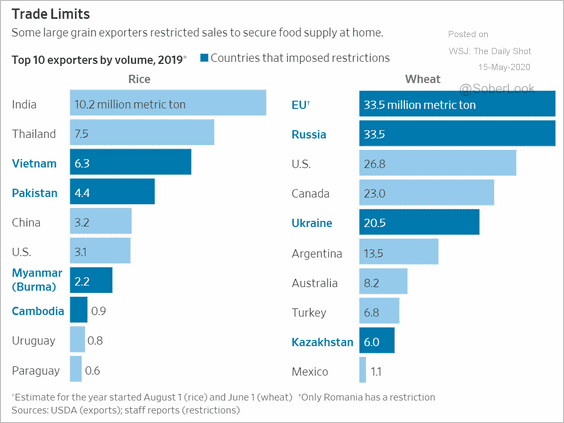
2. This year, a number of major rice and wheat exporters imposed restrictions on foreign sales.
 Source: @WSJ Read full article
Equities
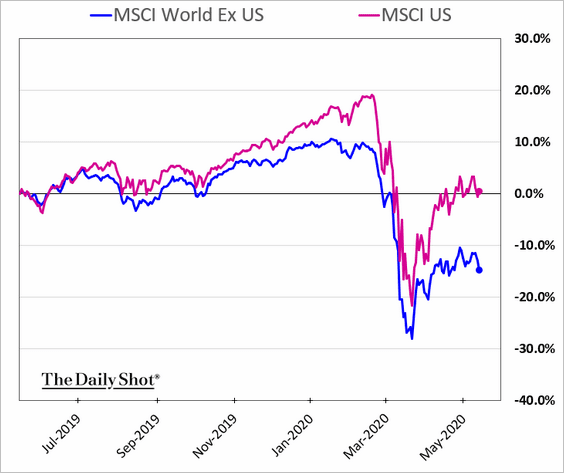
1. US stock market outperformance vs. the rest of the world continues to widen (see reasons in #4 here).
2. Here is the number of companies discussing the suspension of buybacks and/or dividends (by sector).
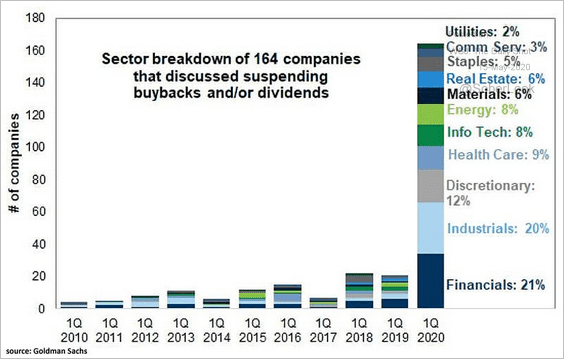 Source: @ISABELNET_SA, @GoldmanSachs
3. Perma-bulls are back in charge on Twitter.
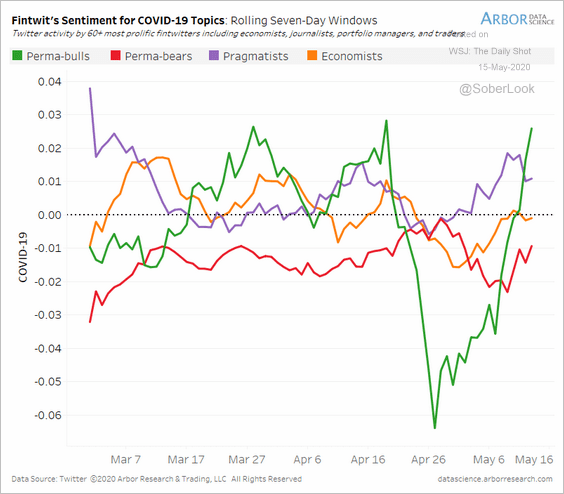 Source: Arbor Research & Trading
4. Next, we have bullish and bearish investors by generation.
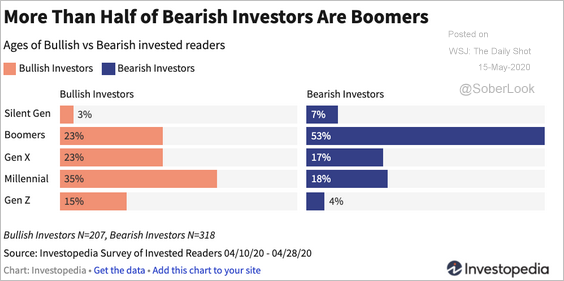 Source: Investopedia
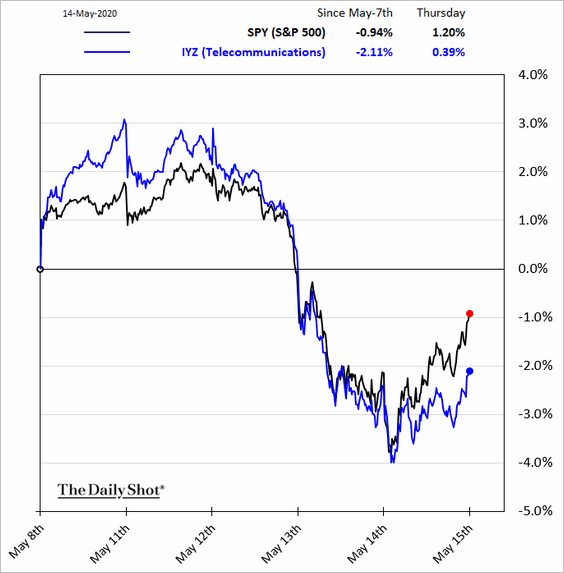
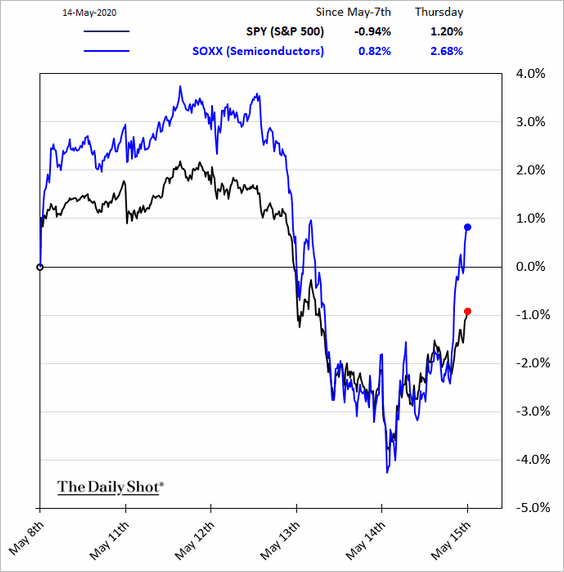
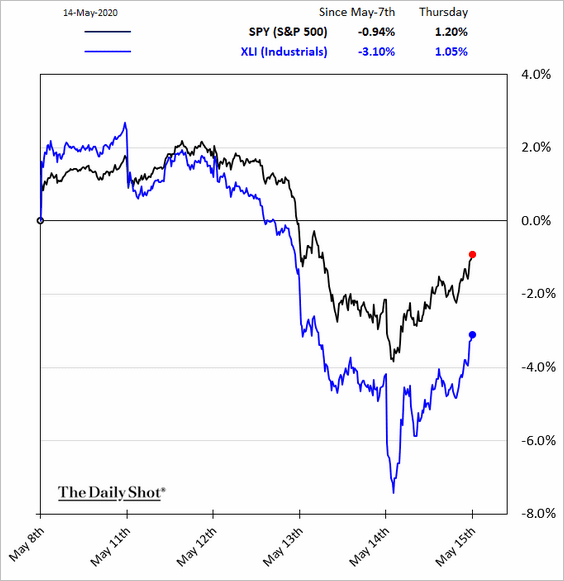
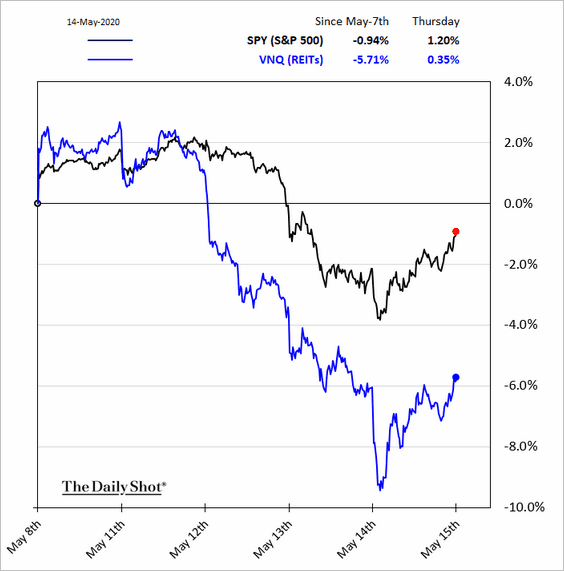
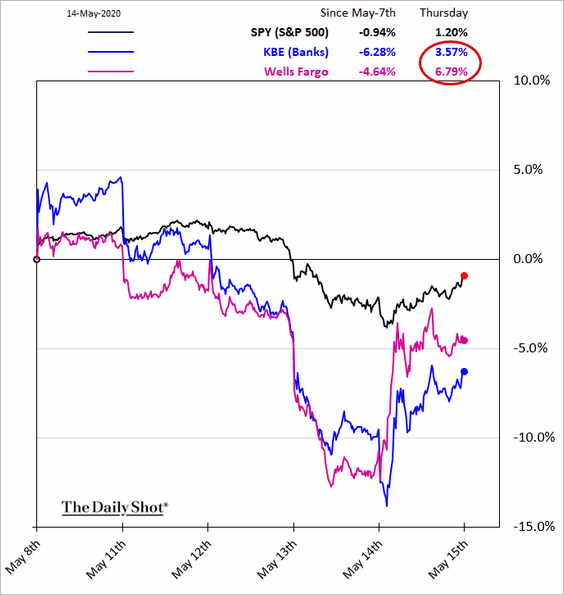
5. Finally, here are some sector performance charts.
• Telecoms:
• Semiconductors:
• Industrials:
• REITs:
• Banks:
 Source: Fox Business Read full article
Credit
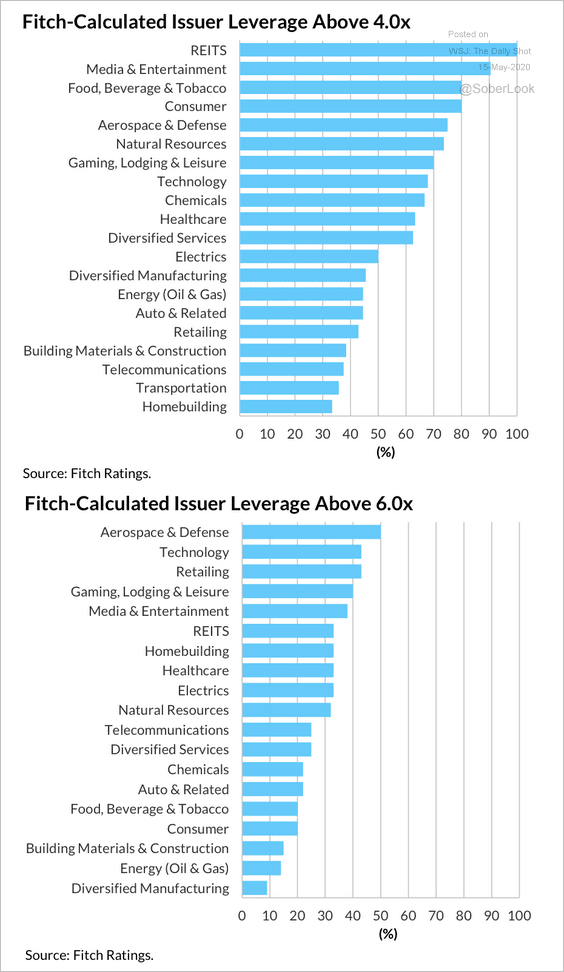
1. Here’s a sector ranking of issuer leverage (debt/EBITDA) above 4x and 6x (from Fitch Ratings).
 Source: Fitch Ratings
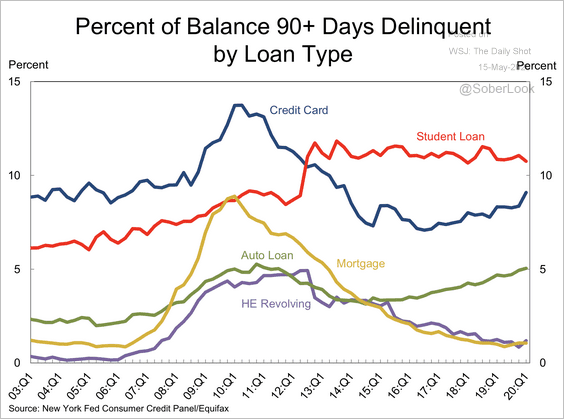
2. In the first quarter, student loans still had the highest delinquency rates, but credit cards were not far behind (and will likely overtake student debt this year).
 Source: Federal Reserve Bank of New York
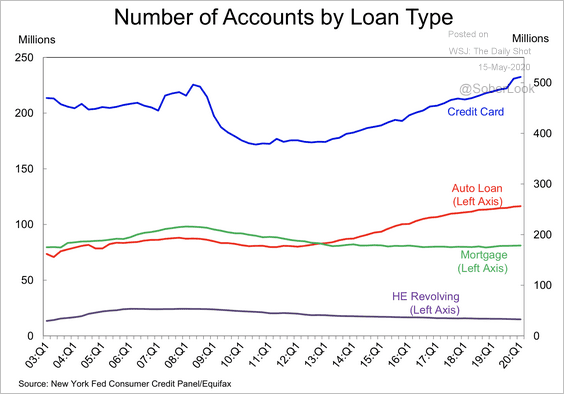
3. Below is the number of consumer accounts by loan type.
 Source: Federal Reserve Bank of New York
——————–
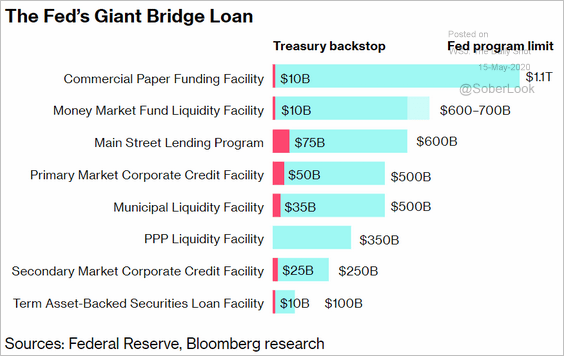
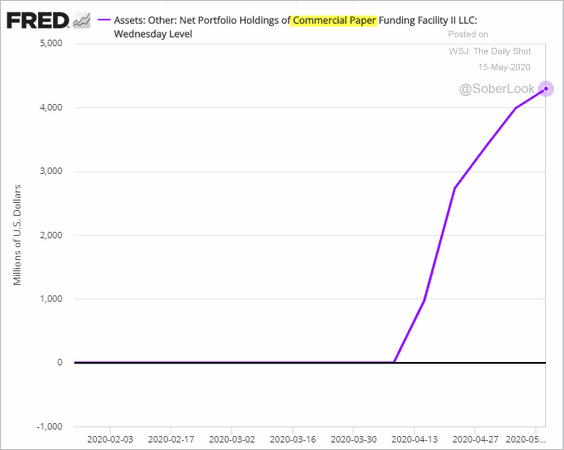
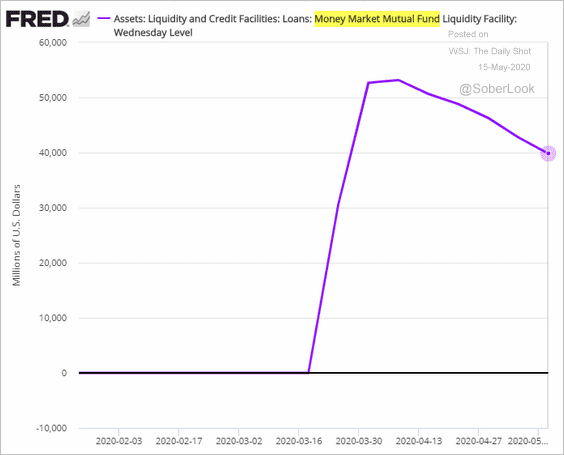
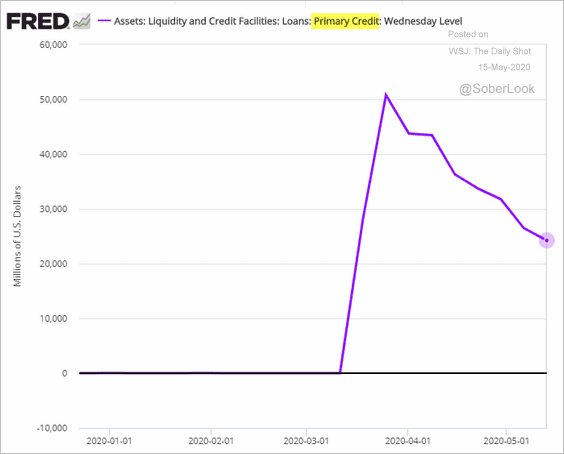
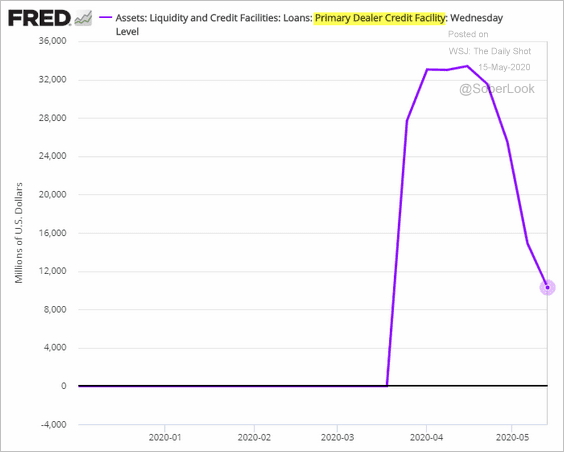
4. Next, we have some updates on the Fed’s crisis-related liquidity and credit initiatives.
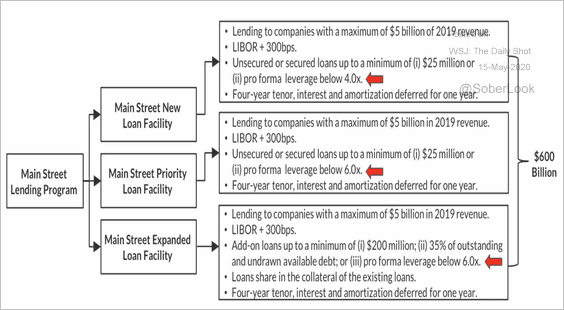
• Program summary:
 Source: @bpolitics Read full article
• Commercial Paper Funding Facility:
• Money Market Mutual Fund Liquidity Facility:
• Primary Market Facility:
• Primary Dealer Credit Facility:
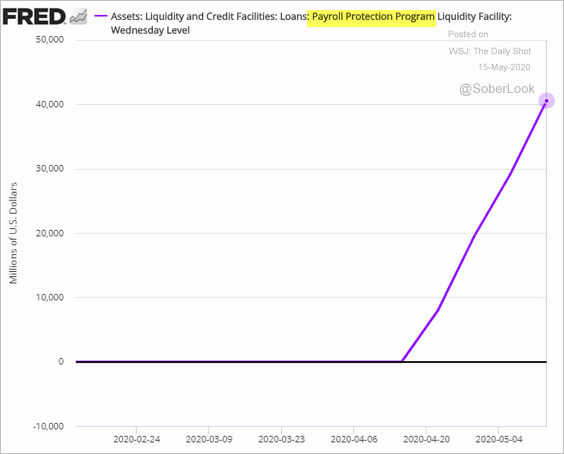
• Payroll Protection Program (small business):
• Roughly a third of speculative-grade issuers monitored by Fitch have leverage ratios between 4x and 6x. This could leave some firms unqualified to receive financing from the Main Street New Loan Facility (MSLPF), which caps leverage ratios at 4x (add-on loans at 6x). Unlike PPP, MSLPF loans are not forgivable.
 Source: Fitch Ratings
Rates
1. Let’s continue with the Fed’s unprecedented measures.
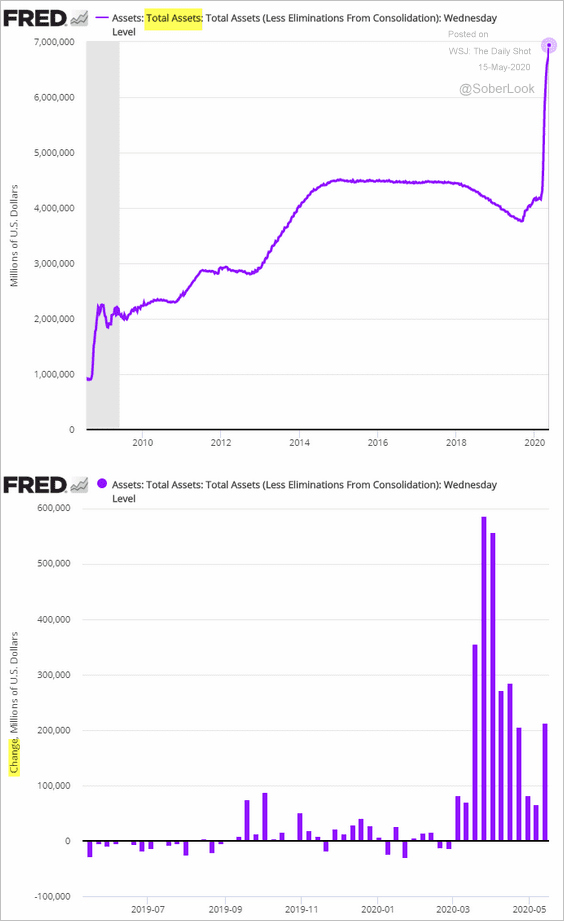
• Total balance sheet (approaching $7 trillion) and weekly changes:
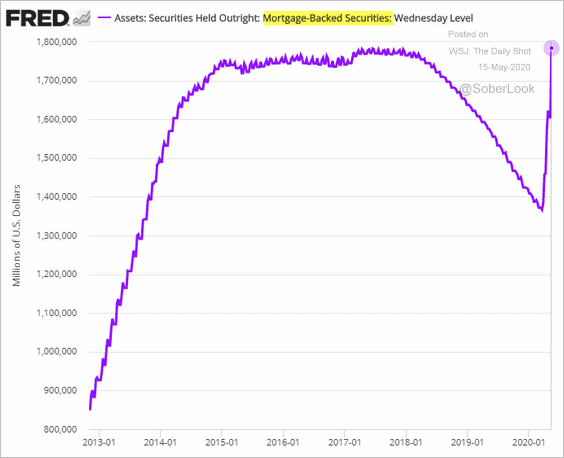
• The Fed’s holdings of mortgage-backed securities (record high):
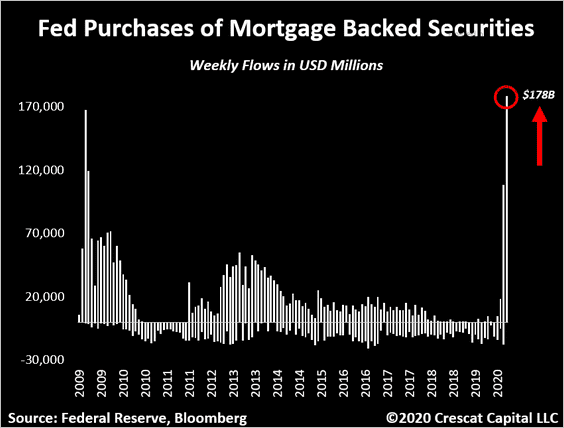 Source: @Crescat_Capital, @TaviCosta
——————–
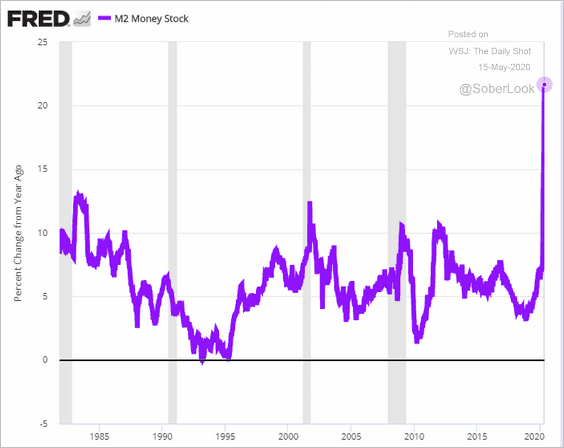
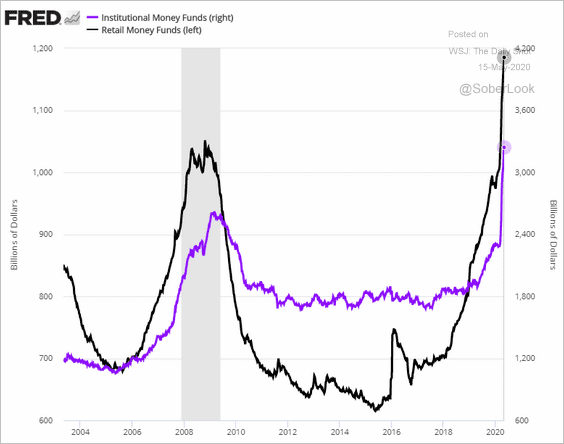
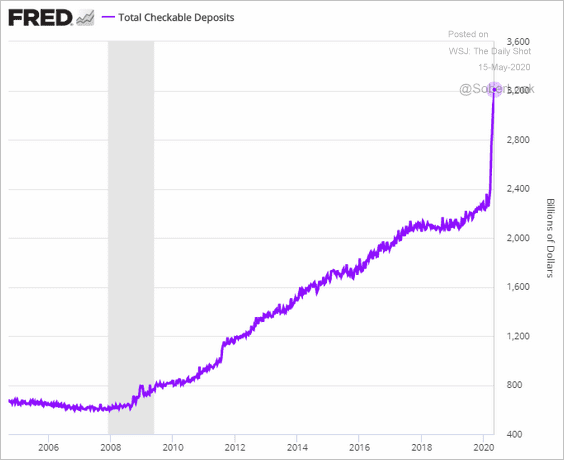
2. The US money supply is exploding, driven mostly by the Fed’s securities purchases.
• M2 Money supply (year-over-year):
• Money market funds:
• Checkable deposits:
——————–
3. Inflows into TIPS ETFs (inflation-linked Treasuries) have accelerated over the past month, nearly reversing sharp outflows during the broader market selloff.
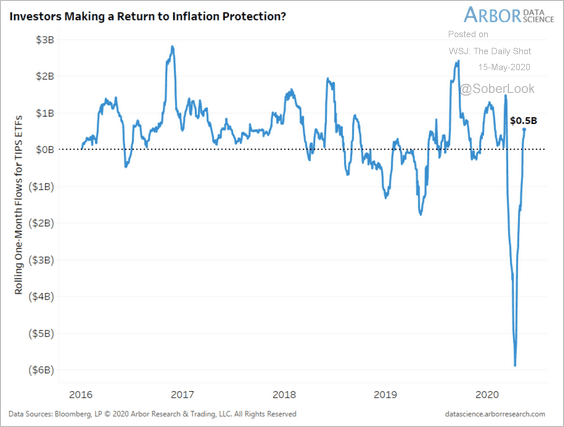 Source: Arbor Research & Trading
Global Developments
1. Let’s start with central bank balance sheets as a percentage of GDP (2 charts).
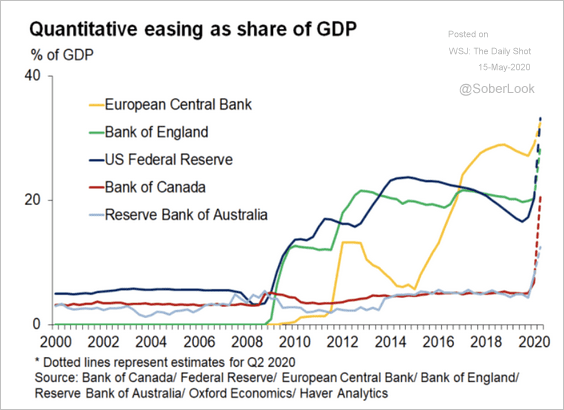 Source: Oxford Economics
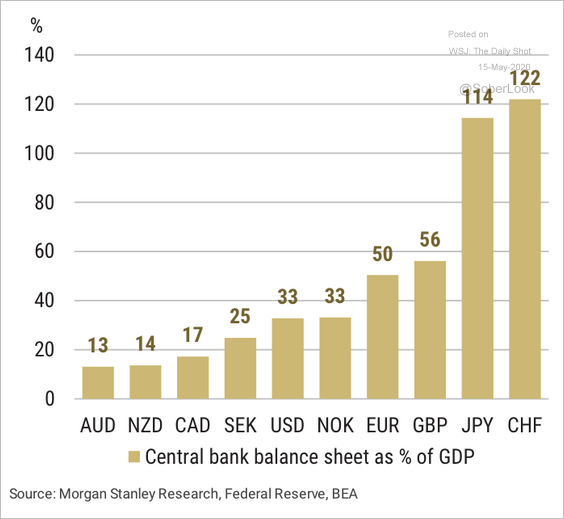 Source: Morgan Stanley Research
——————–
2. Here is the online search activity for consumer goods …
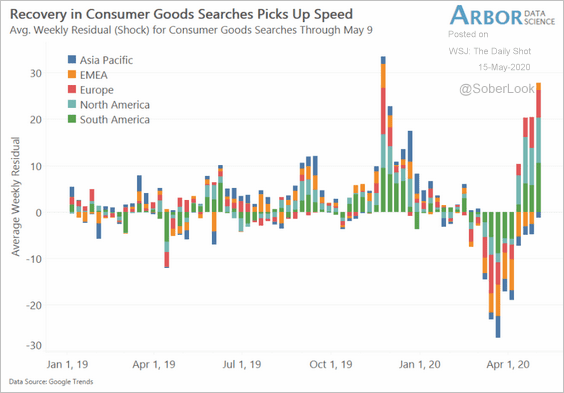 Source: Arbor Research & Trading
… and industrial products and services.
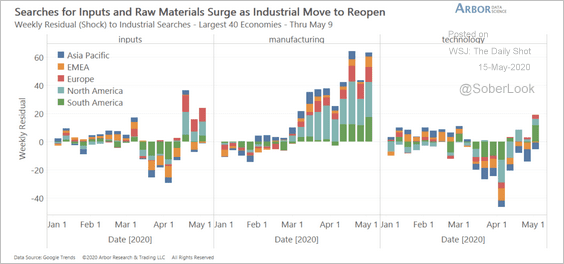 Source: Arbor Research & Trading
——————–
3. This scatterplot shows supply-chain strength vs. macro-political stability.
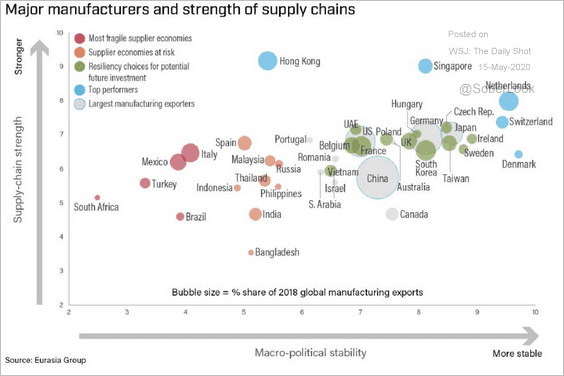 Source: @luisfemarin, @p_ceretti, @EurasiaGroup
——————–
Food for Thought
1. Urban slum populations:
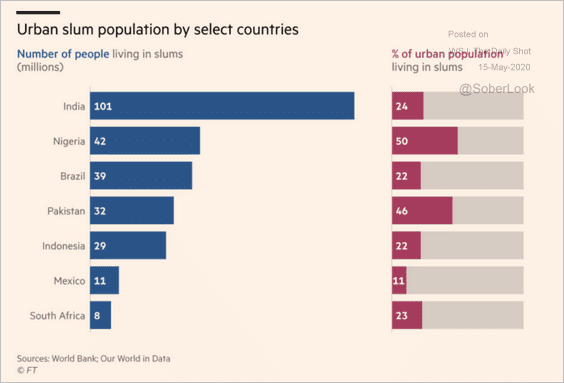 Source: @financialtimes Read full article
2. US support for an independent Palestinian state:
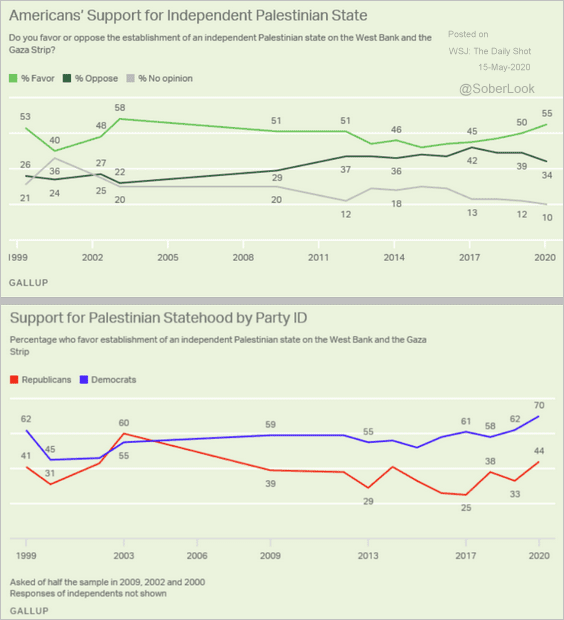 Source: Gallup Read full article
3. Unemployment changes vs. incumbent’s margin in US presidential elections:
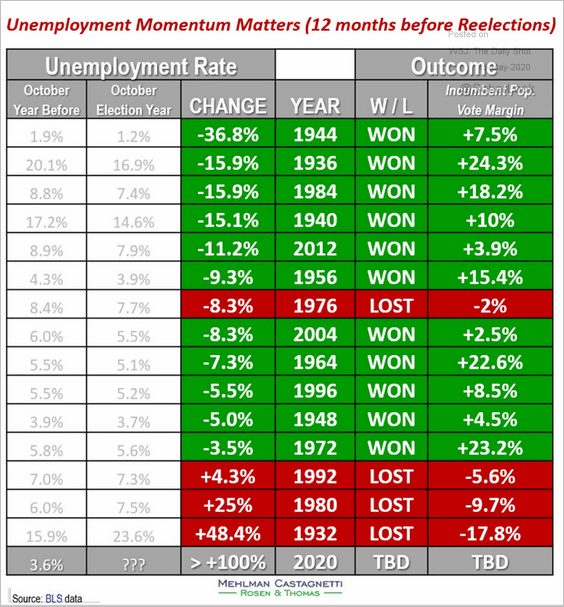 Source: Mehlman Castagnetti Rosen & Thomas
4. News media credibility:
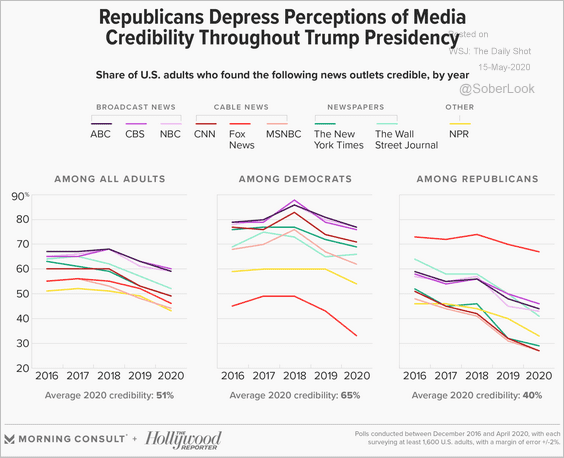 Source: Morning Consult Read full article
5. Spending patterns of US consumers above and below 65 years of age:
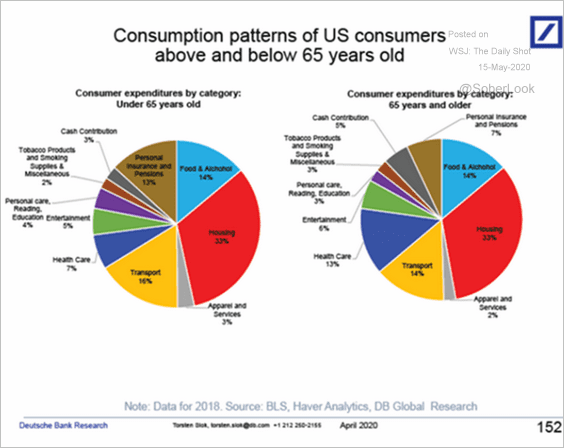 Source: Deutsche Bank Research
6. Cashless spending:
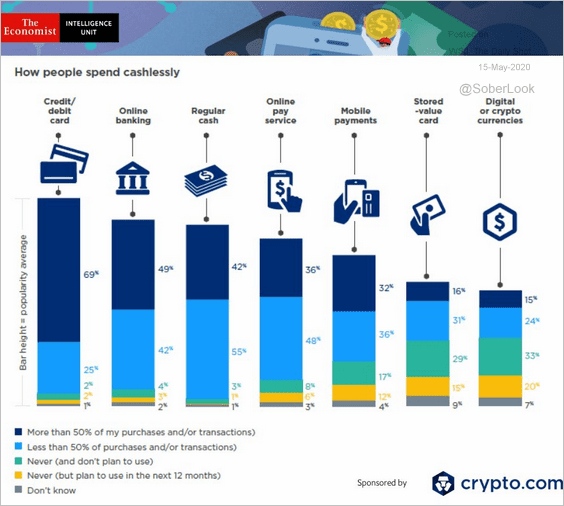 Source: @TheEIU, @cryptocom Read full article
7. TV add spending:
 Source: @WSJ Read full article
8. Grocery delivery, restaurant food delivery, and pizza:
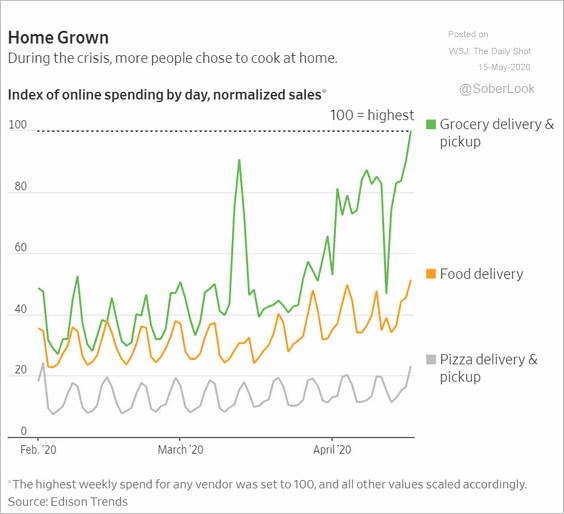 Source: @WSJ Read full article
9. Favorite sports movies:
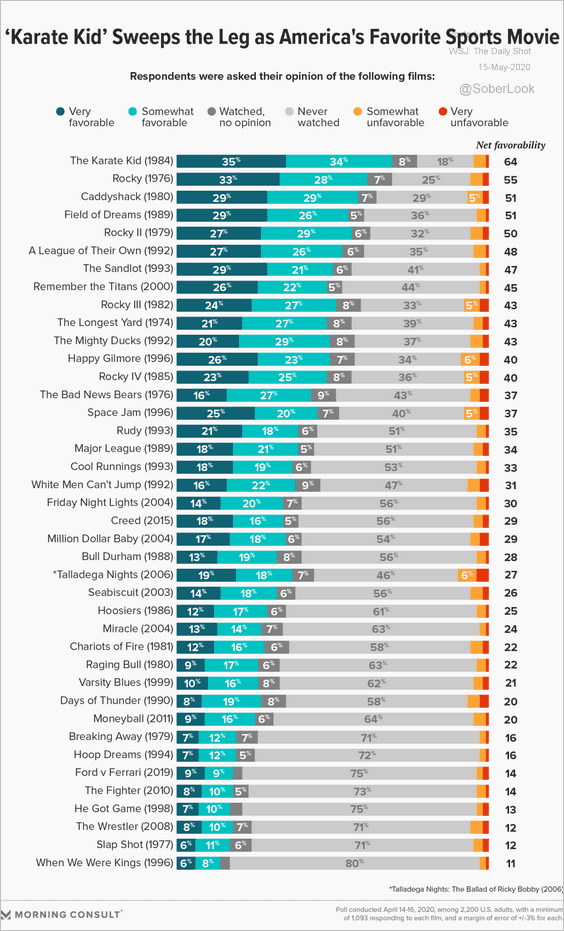 Source: Morning Consult Read full article
——————–
Have a great weekend!