
The Daily Shot: 26-May-20
• Credit
• Equities
• Energy
• Commodities
• Emerging Markets
• China
• Asia – Pacific
• The Eurozone
• Europe
• The United Kingdom
• Canada
• The United States
• Global Developments
• Food for Thought
Credit
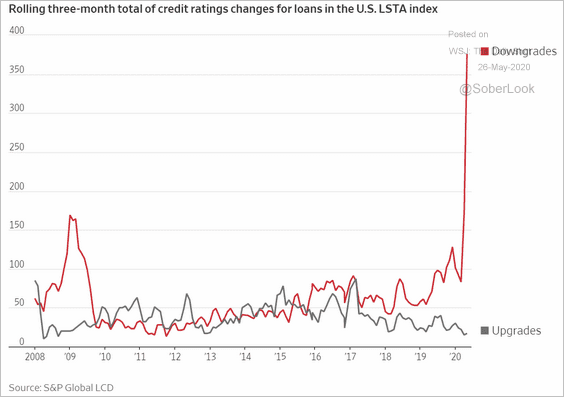
1. The speed of corporate sub-investment-grade ratings downgrades has been unprecedented.
 Source: @WSJ Read full article
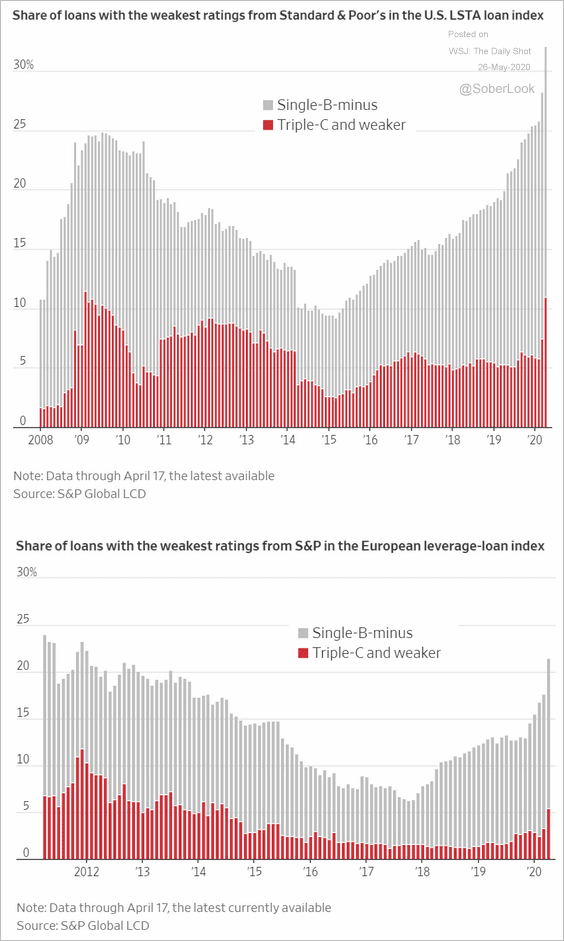
Here is the percentage of leveraged loans with the weakest ratings.
 Source: @WSJ Read full article
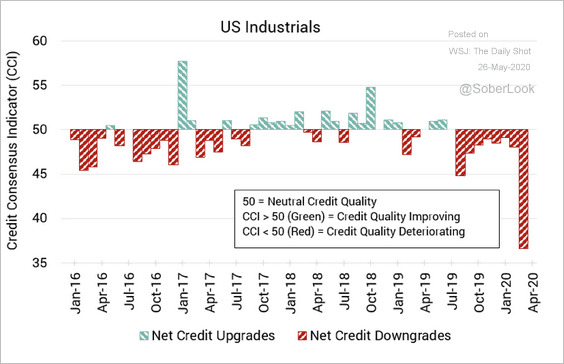
US industrials’ credit quality has deteriorated rapidly.
 Source: Credit Benchmark
——————–
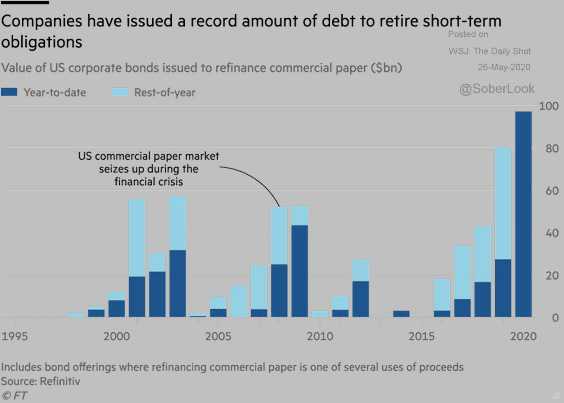
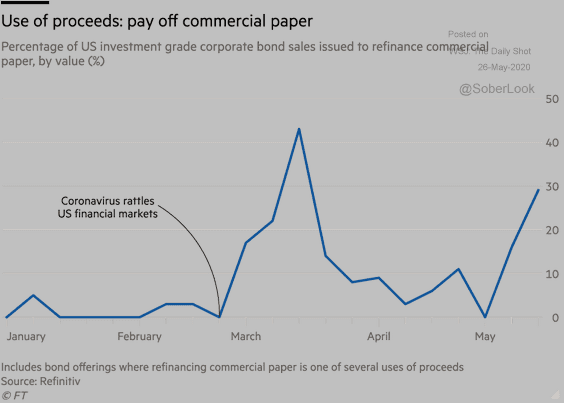
2. US companies have issued a record amount of debt, in part to refinance commercial paper (two charts).
 Source: @financialtimes Read full article
 Source: @financialtimes Read full article
——————–
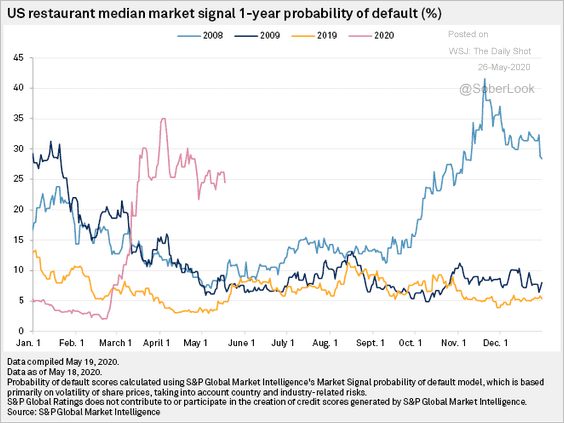
3. US restaurant chains’ default probability has spiked this year.
 Source: S&P Global Market Intelligence
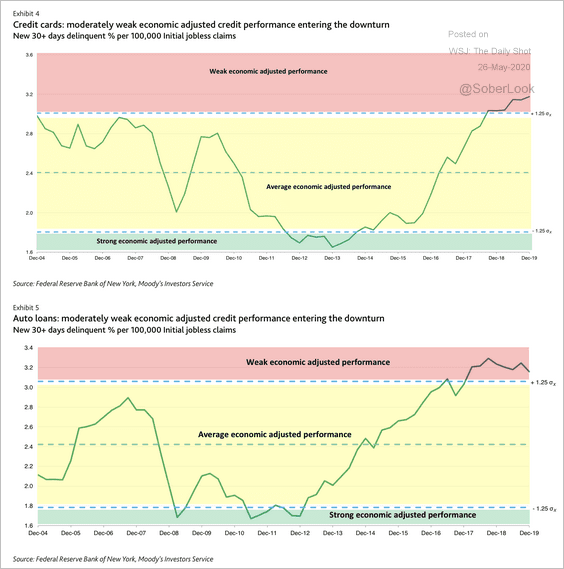
4. Next, we have some updates on household credit.
• The charts below show the percentage of US newly delinquent consumer loans relative to jobless claims. Credit cards and auto loans were already exhibiting weakness heading into this crisis, …
 Source: Moody’s Investors Service
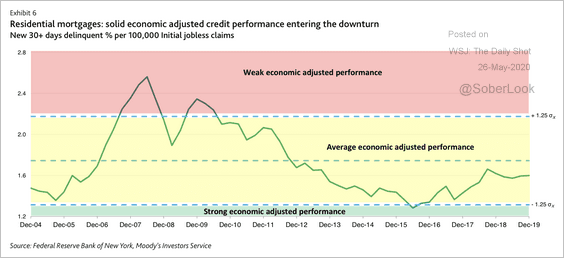
… but residential mortgages were in good shape entering the downturn.
 Source: Moody’s Investors Service
——————–
• US consumer financial obligation and debt service ratios were well below historical averages going into the crisis.
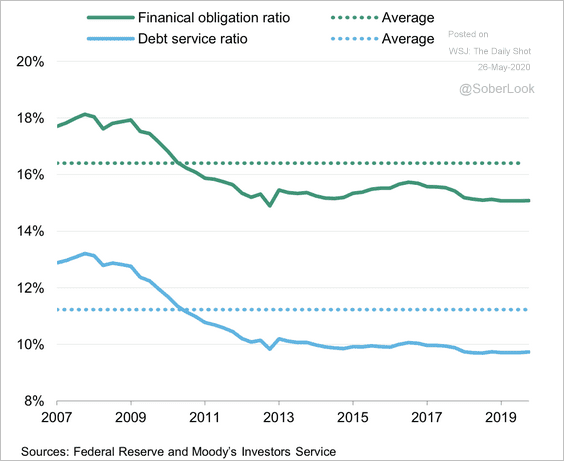 Source: Moody’s Investors Service
• Ginnie Mae has the highest percentage of its mortgage servicing portfolio in forbearance.
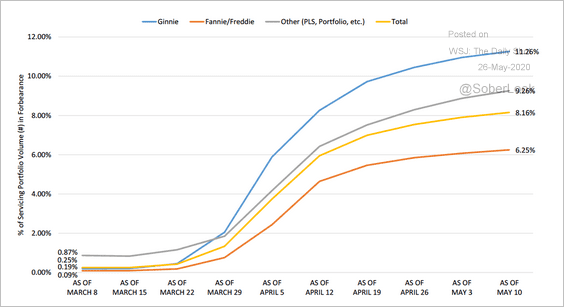 Source: Mortgage Bankers Association
• A meaningful portion of loan portfolios at some large regional banks is in forbearance.
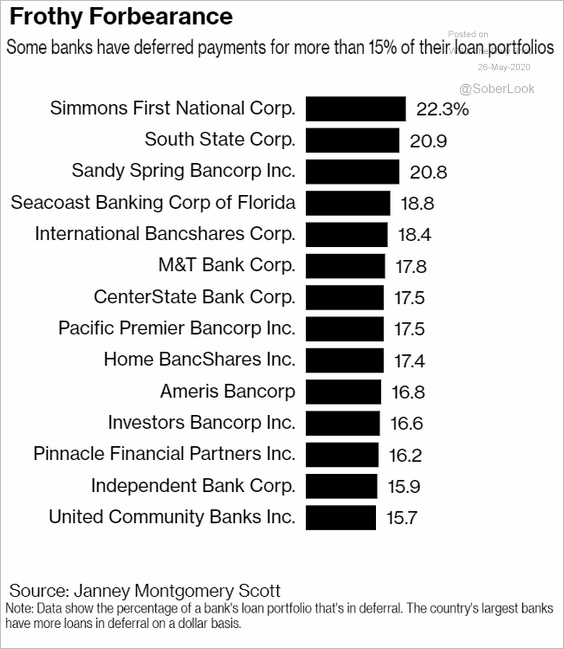 Source: @markets Read full article
• According to Moody’s, US banks will further tighten underwriting standards for consumer credit.
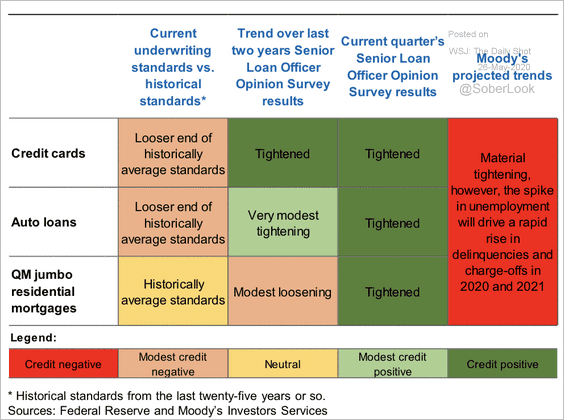 Source: Moody’s Investors Service
——————–
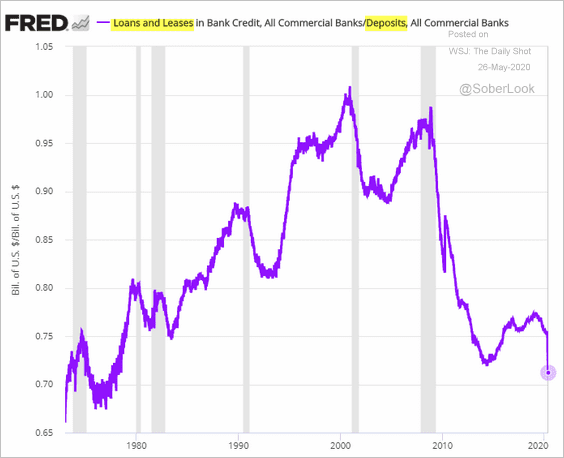
5. US banks’ loan-to-deposit ratio hit the lowest level since the 1970s. The Fed’s securities purchases have been driving up deposits (see #3 here for an illustration of the process).
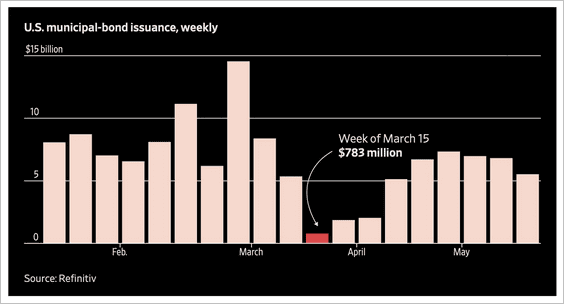
6. Finally, the chart below shows the weekly issuance of municipal bonds.
 Source: @WSJ Read full article
Equities
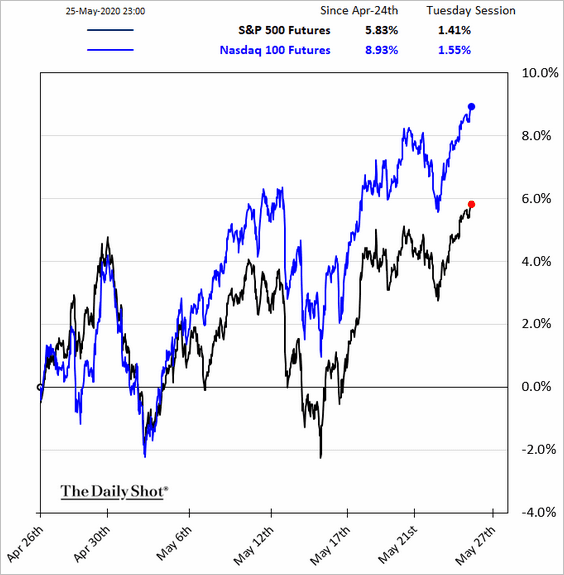
1. US stock futures are up sharply as the rally continues.
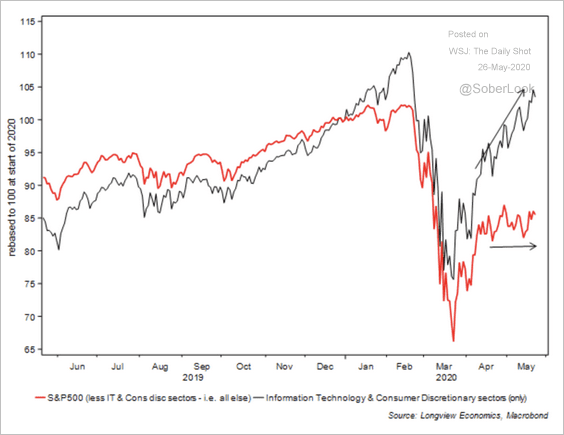
2. Tech and consumer discretionary have led the market rally.
 Source: Longview Economics
3. The next chart shows when the public expects the stock market to fully recover from the pandemic selloff.
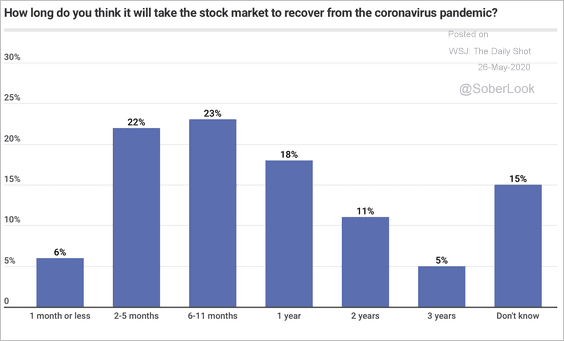 Source: MagnifyMoney Read full article
4. Speculative futures positions in the S&P 500 are extremely short, …
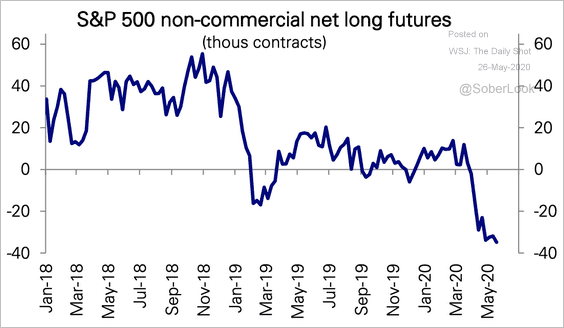 Source: Deutsche Bank Research
… but only modestly so in the Nasdaq 100. Note that many speculative traders use S&P 500 futures to offset their long positions.
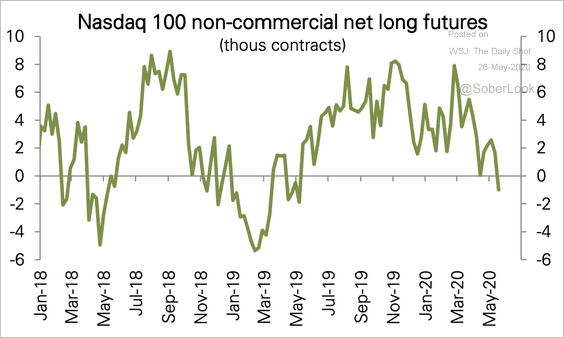 Source: Deutsche Bank Research
——————–
5. Historically, the US stock market treads water during summer months.
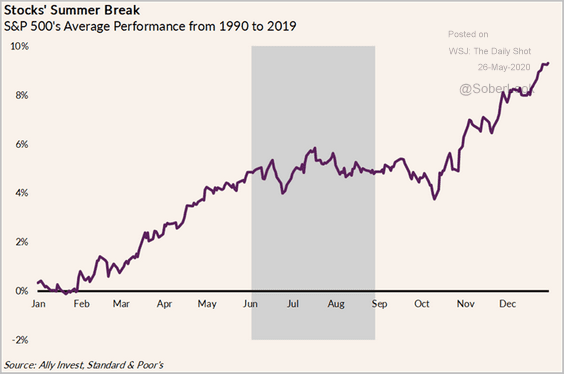 Source: Lindsey Bell (Ally Invest)
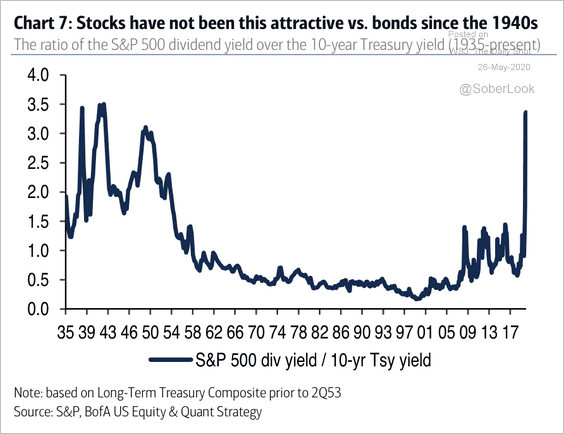
6. The ratio of the S&P 500 dividend yield over the 10-year Treasury yield is at its highest level since the 1940s. However, this assumes that companies will maintain their dividend.
 Source: BofA Merrill Lynch Global Research
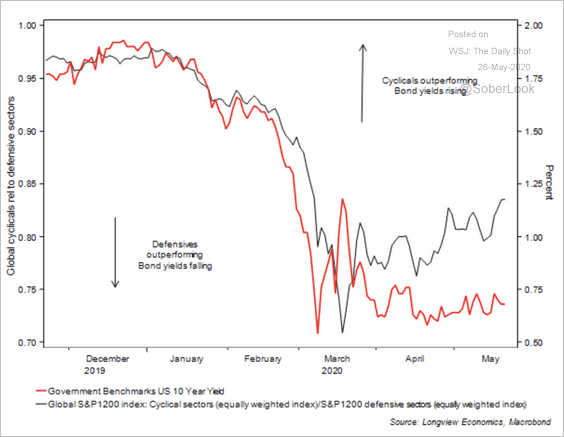
7. The cyclicals/defensives ratio has diverged from bond yields.
 Source: Longview Economics
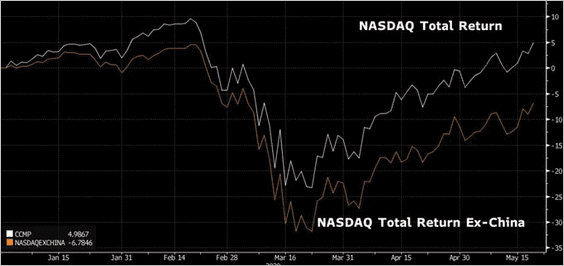
8. The Nasdaq year-to-date performance would have been substantially worse without its China-based companies.
 Source: @LizAnnSonders, @bloomberg
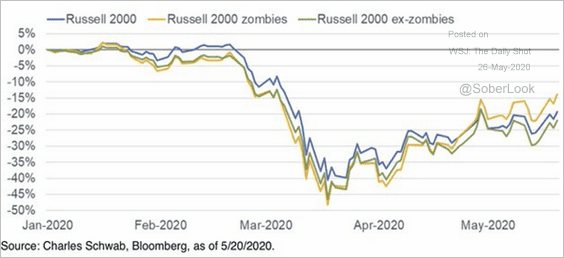
9. “Zombie” small-cap shares have been outperforming.
 Source: @LizAnnSonders
10. Global equity flows have been declining over the past few years as investors pile into bonds.
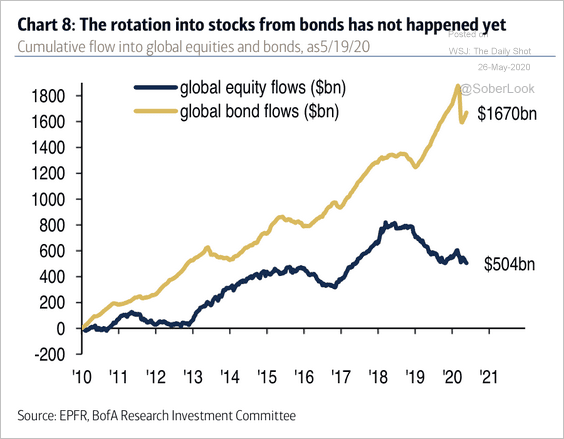 Source: BofA Merrill Lynch Global Research
11. There has been a rotation from value and cyclicals into secular growth funds.
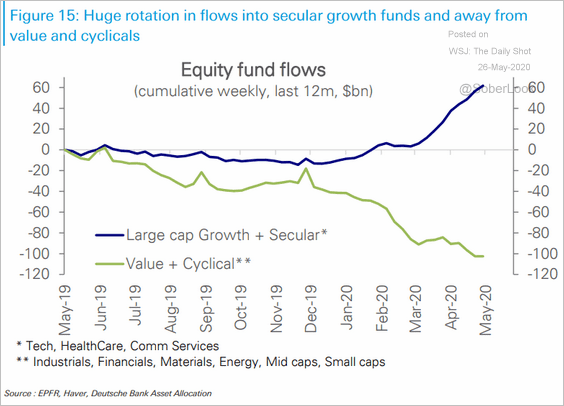 Source: Deutsche Bank Research
12. Retail investors have increasingly been trading equity options.
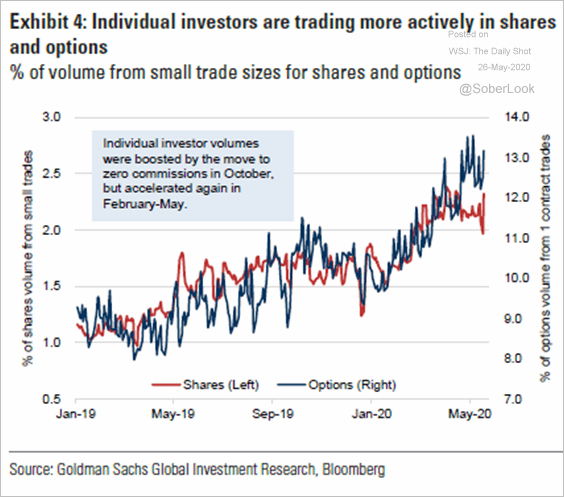 Source: Goldman Sachs, @markets Read full article
Energy
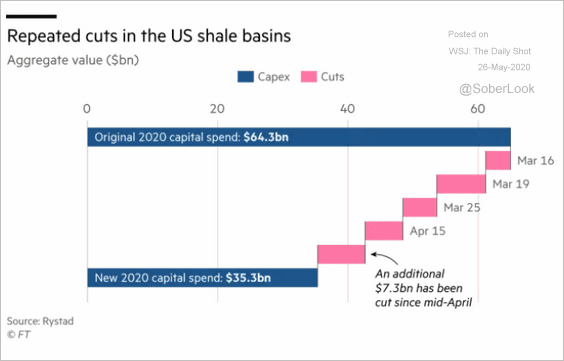
1. The number of US oil rigs keeps shrinking, but the declines have slowed (2nd chart).
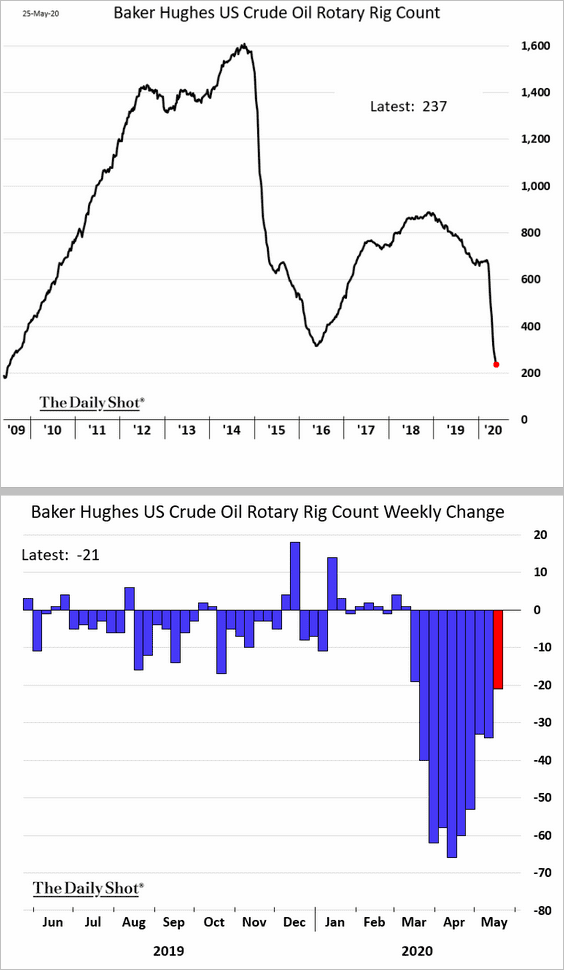
Shale CapEx expectations continue to contract.
 Source: @financialtimes Read full article
——————–
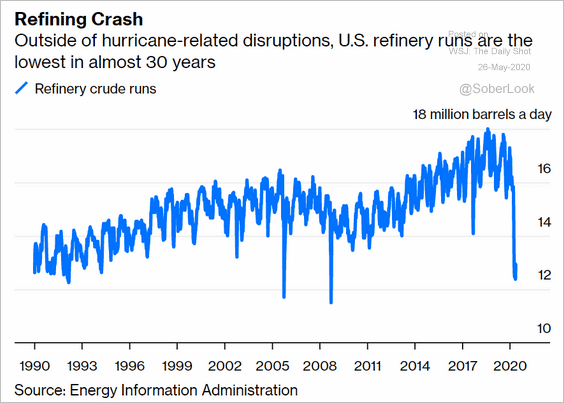
2. Except for the hurricane disruptions, US refinery inputs are the lowest in nearly 30 years.
 Source: @bopinion Read full article
Commodities
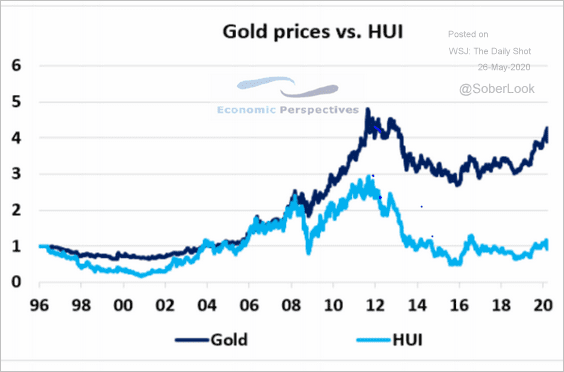
1. Gold has substantially outperformed gold mining shares over the past decade.
 Source: Economic Perspectives
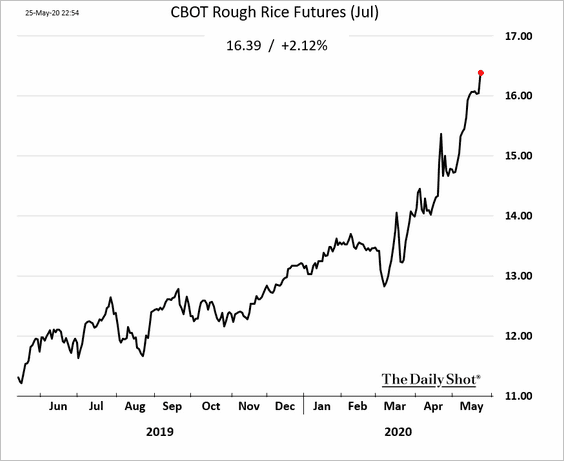
2. Rice futures keep climbing.
Emerging Markets
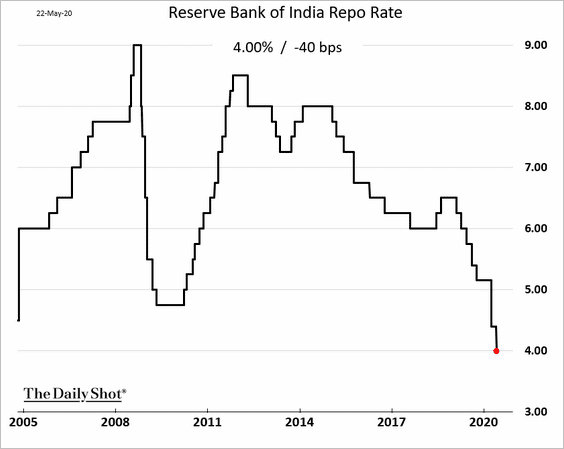
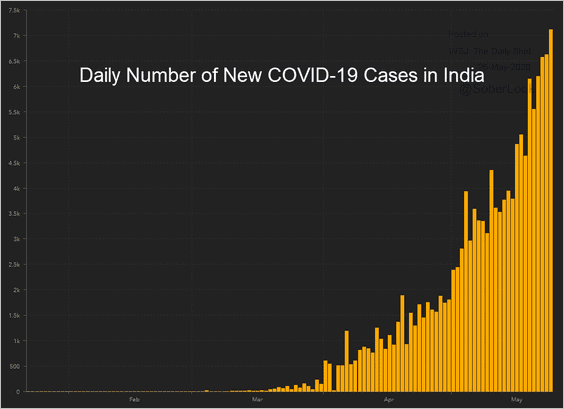
1. India’s central bank cut rates again, as the daily number of new COVID-19 cases soars.
 Source: JHU CSSE
——————–
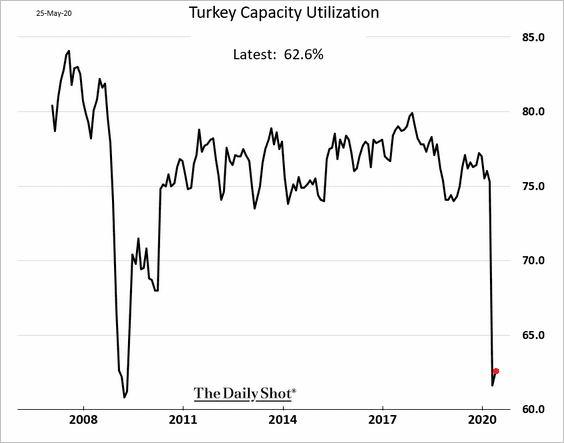
2. Turkey’s manufacturing capacity utilization remained near extreme lows in May.
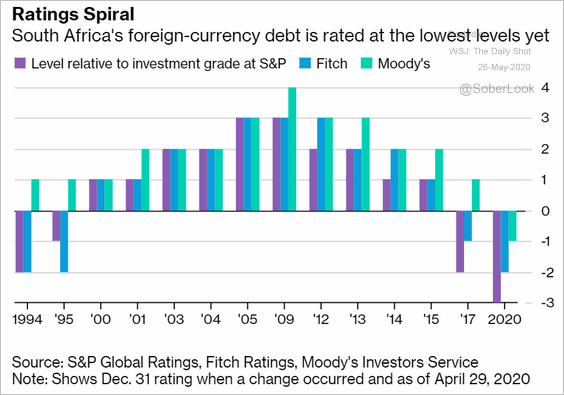
3. This chart illustrates the trajectory of South Africa’s hard-currency sovereign debt downgrades.
 Source: @business Read full article
South Africa’s new coronavirus infections keep climbing.
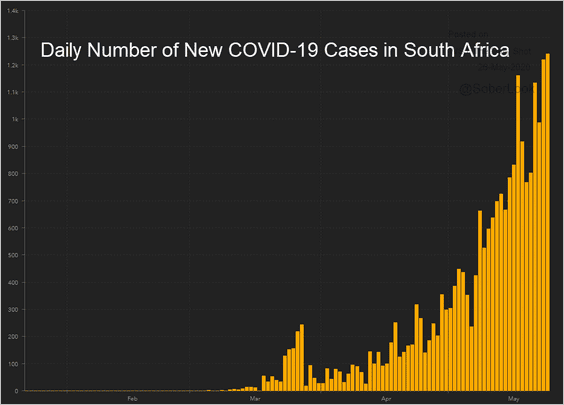 Source: JHU CSSE
——————–
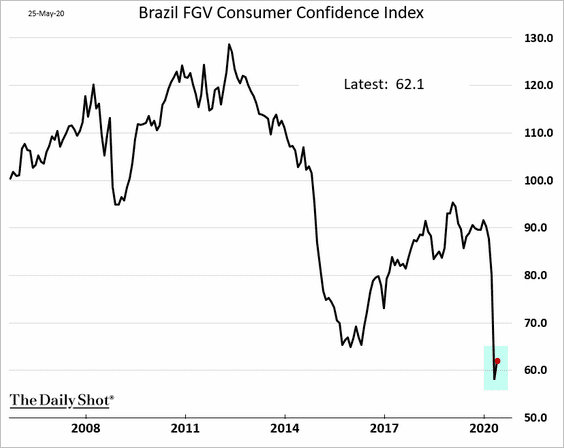
4. Brazil’s consumer confidence showed only minimal improvement in May.
5. LatAm financial conditions have eased from mid-March levels.
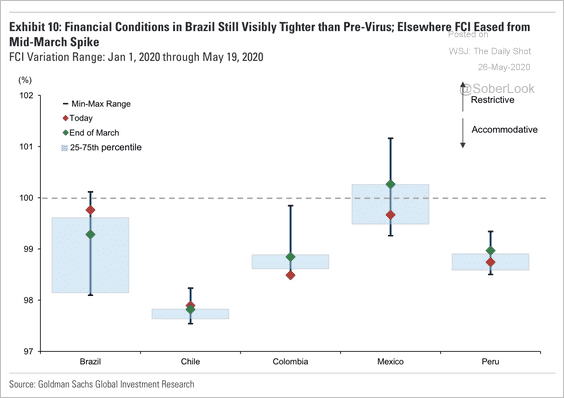 Source: Goldman Sachs
China
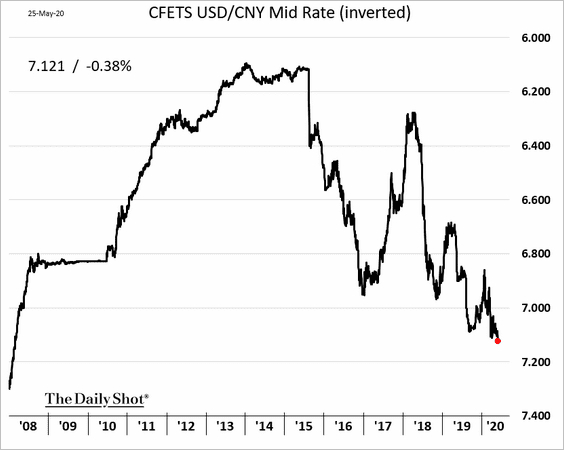
1. The PBoC has been guiding the renminbi lower to support the export sector.
2. According to Goldman Sachs, Beijing’s fiscal stimulus has been more forceful than the headline figures suggest.
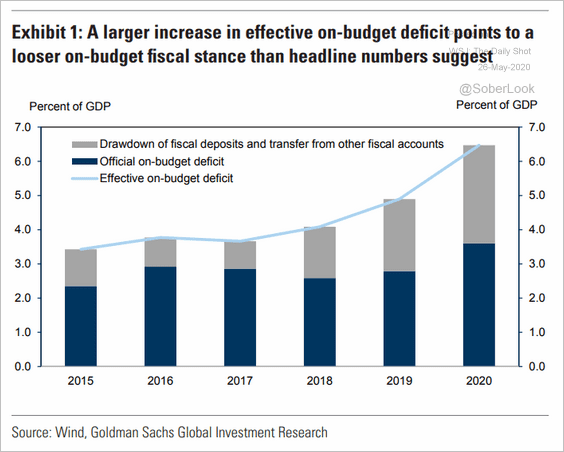 Source: Goldman Sachs
3. Large manufacturing firms have bounced back faster than small firms.
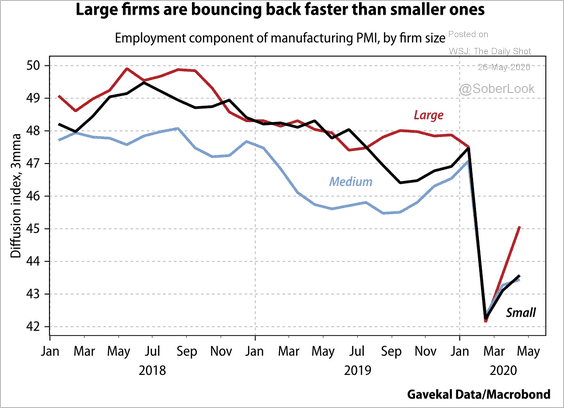 Source: Gavekal
4. Young adults in China want to buy a car.
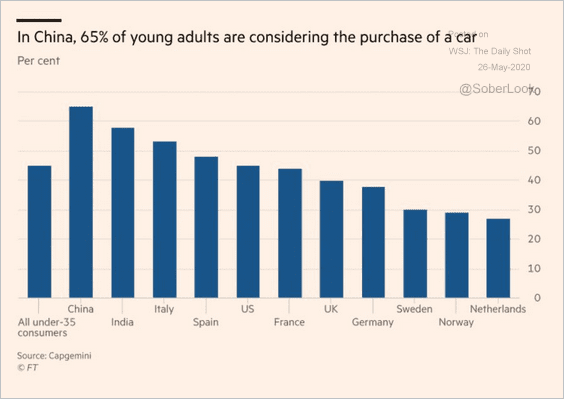 Source: @FT, @adam_tooze Read full article
5. China’s defense spending keeps rising, although the pace of increases has slowed.
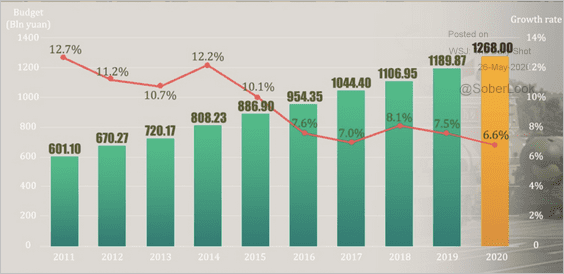 Source: Global Times Read full article
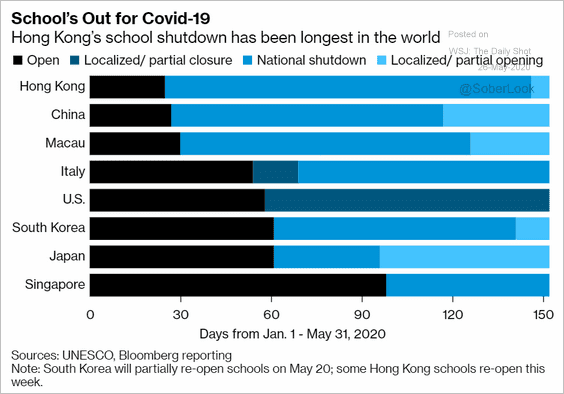
6. Hong Kong’s school shutdowns have been the longest in the world.
 Source: @technology Read full article
Asia – Pacific
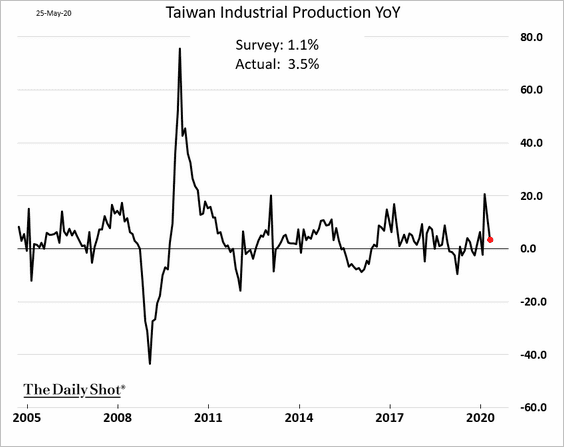
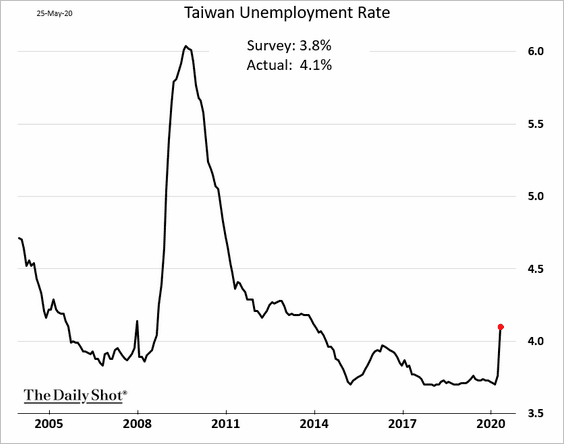
1. Taiwan’s industrial output held up well in April.
The unemployment rate climbed above 4% for the first time since 2014.
——————–
2. South Korea’s consumer confidence bounced from the lows but remains depressed.
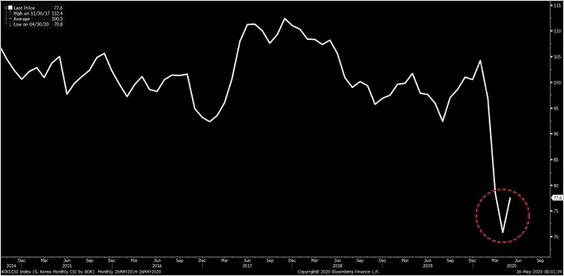 Source: @tracyalloway, @samkimasia Read full article
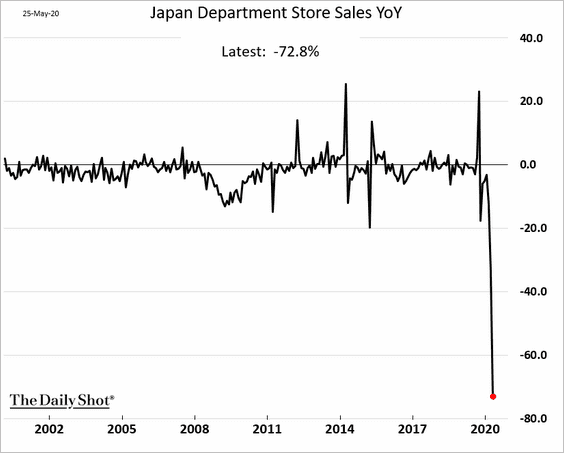
3. Department store sales in Japan collapsed last month.
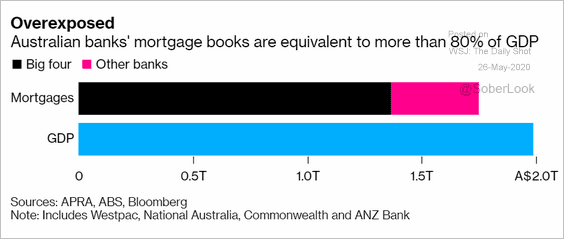
4. Next, we have some updates on Australia.
• Australia’s banks are heavily exposed to mortgage debt.
 Source: @markets Read full article
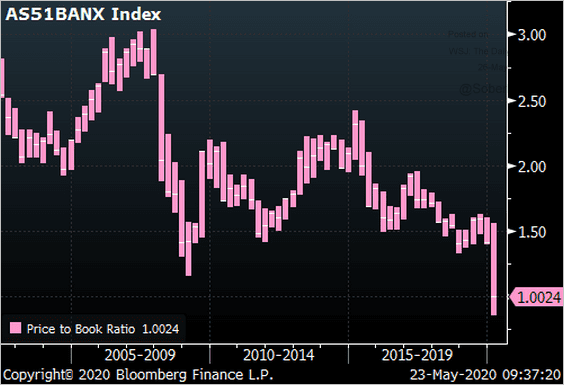
Here is the banking sector’s price-to-book ratio.
 Source: @ThePainReport
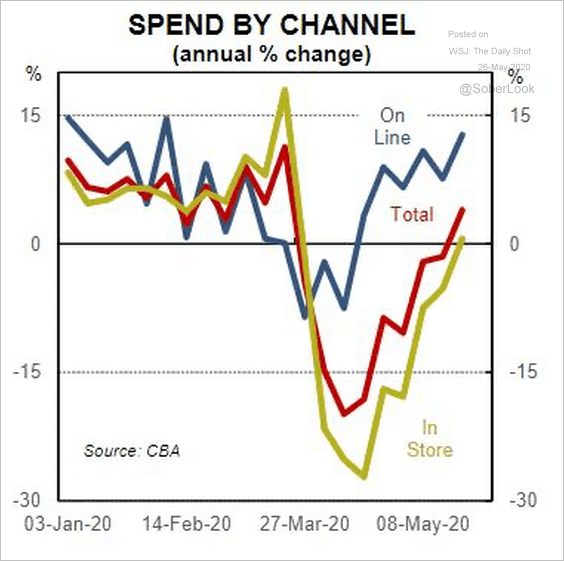
• Household credit card spending has been on the rise in recent weeks.
 Source: @CommSec
• Australia’s official figures understate the nation’s unemployment.
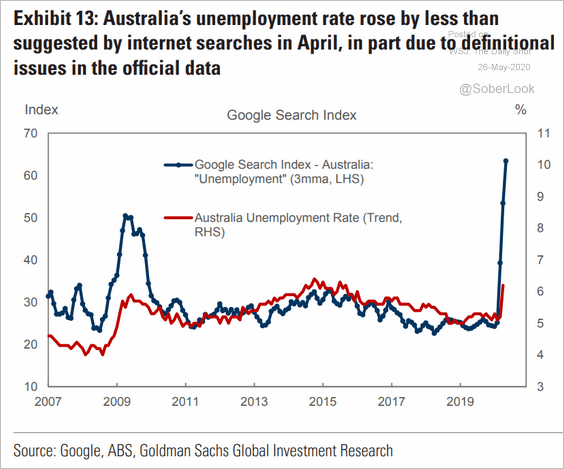 Source: Goldman Sachs
The Eurozone
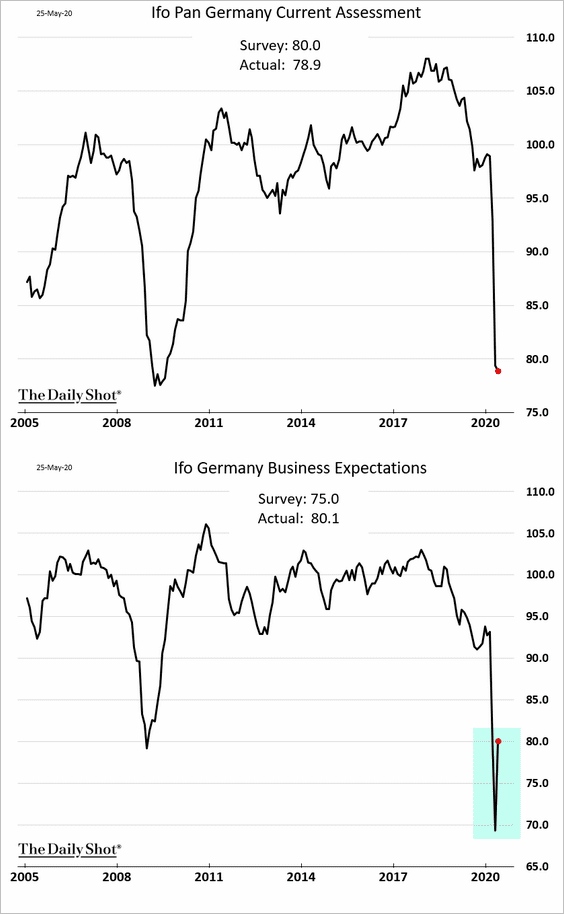
1. Germany’s Ifo business expectations index surprised to the upside as the country eased lockdown measures.
 Source: MarketWatch Read full article
Customers are gradually returning to retail stores.
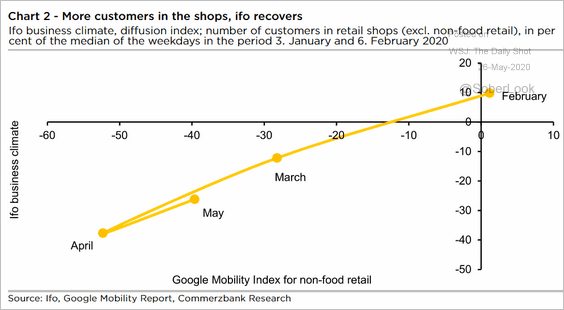 Source: Commerzbank Research
Here is the Ifo index breakdown by sector.
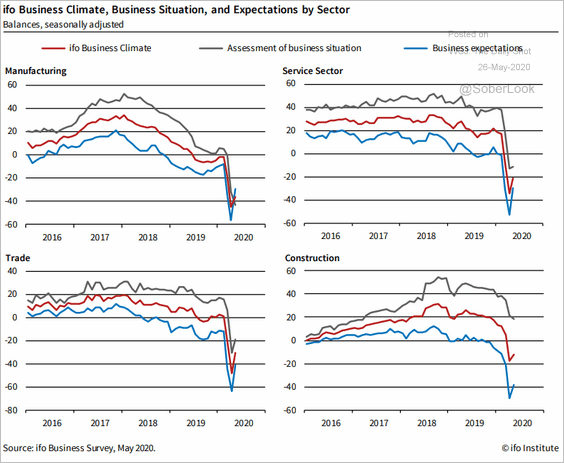 Source: ifo Institut
——————–
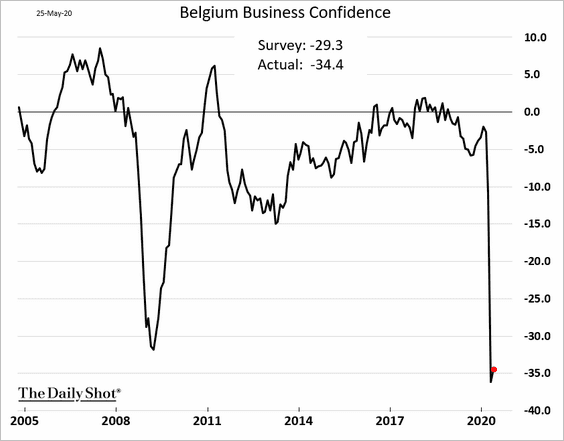
2. The expected consumer sentiment rebound in Belgium didn’t materialize this month.
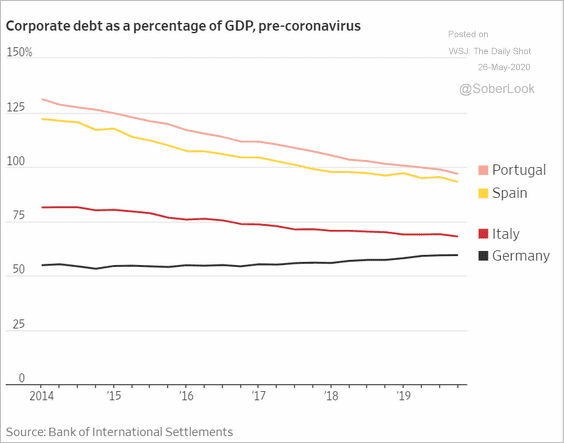
3. This chart shows the euro-area corporate debt trends before the crisis.
 Source: @WSJ Read full article
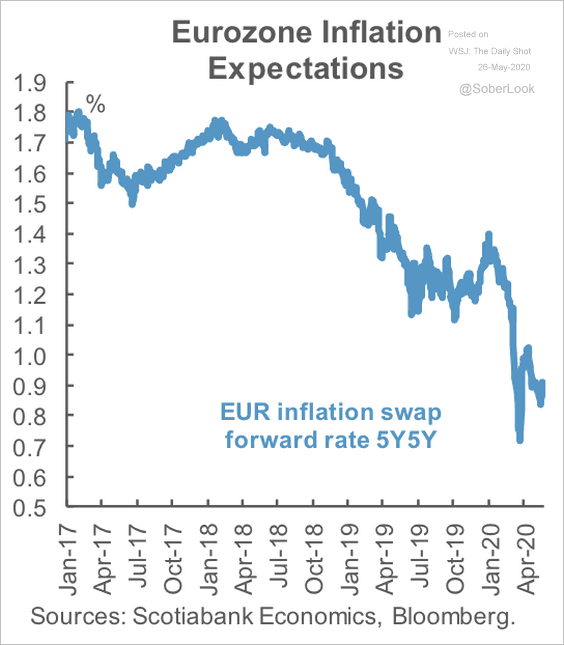
4. Inflation expectations continue to trend lower.
 Source: Scotiabank Economics
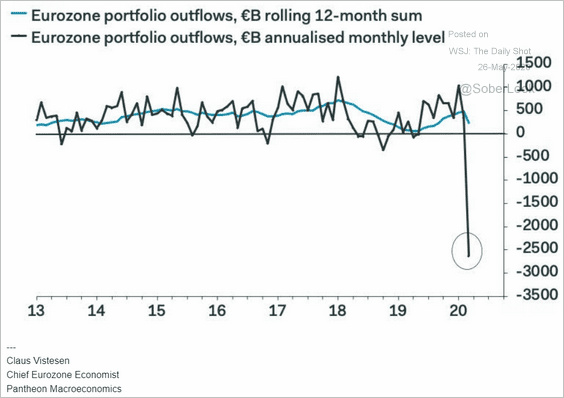
5. The Eurozone has experienced substantial portfolio outflows.
 Source: Pantheon Macroeconomics
Europe
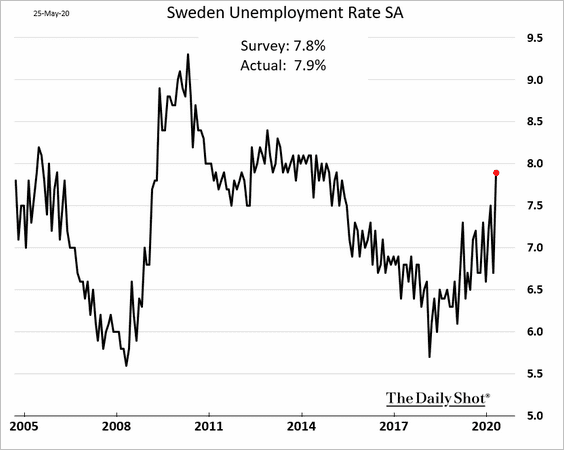
1. Sweden’s unemployment rate rose further last month but remains well below the 2009 highs.
2. Sweden’s and Norway’s nominal GDP growth has held above the Eurozone’s over the past decade.
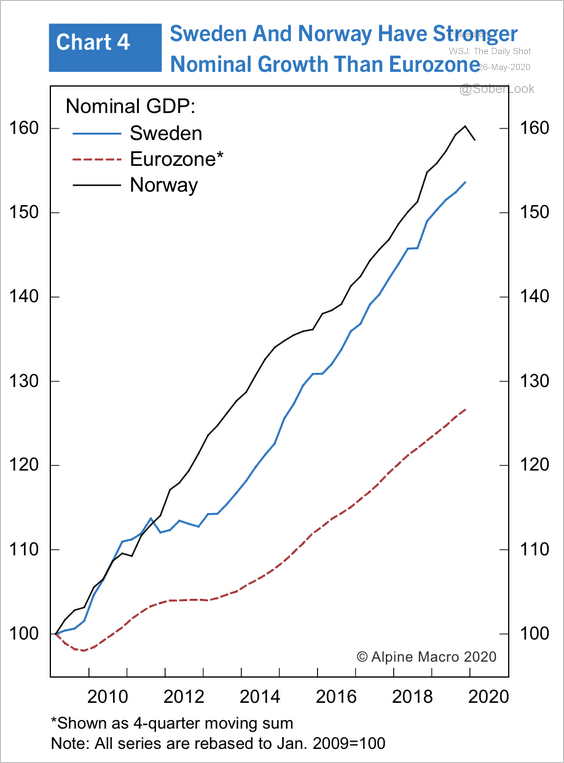 Source: Alpine Macro
3. Nordic countries have a higher household debt to disposable income ratio than other major economies.
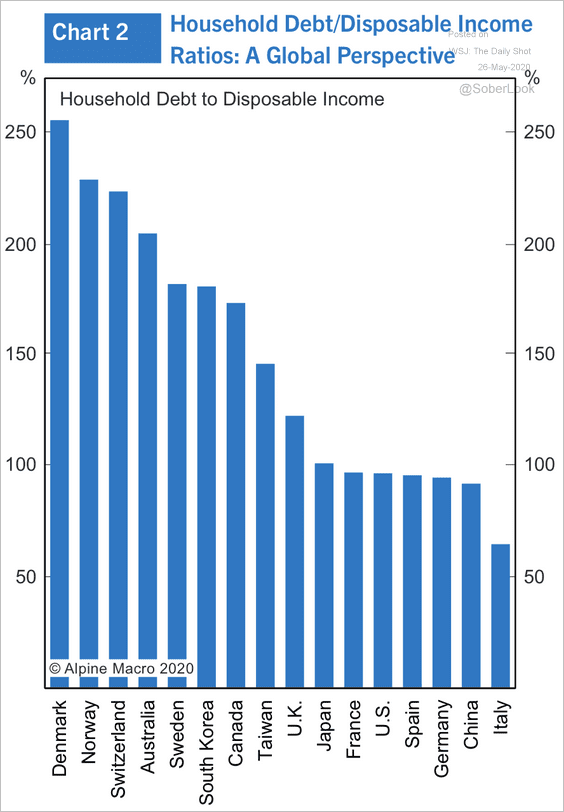 Source: Alpine Macro
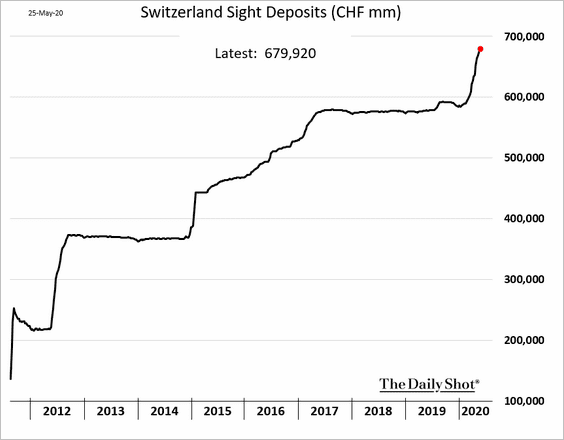
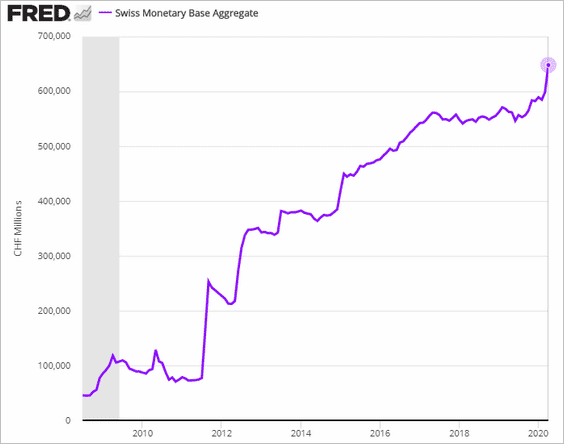
4. Switzerland’s central bank (SNB) continues to intervene in the currency markets.
• Sight deposits:
• The monetary base:
——————–
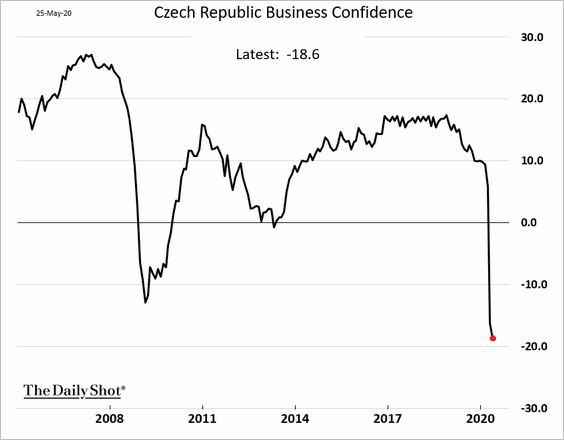
5. Czech consumer sentiment recovered partially from the April lows.
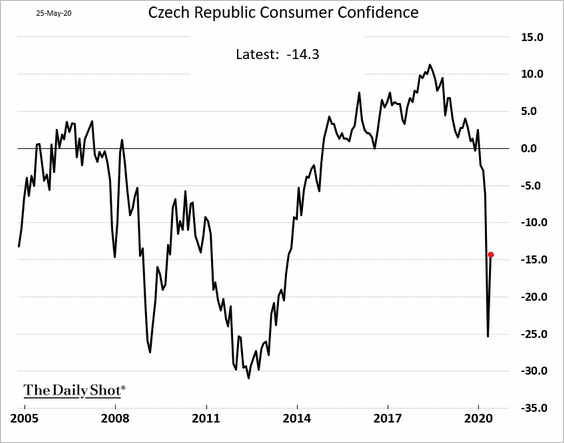
But business confidence continued to deteriorate.
——————–
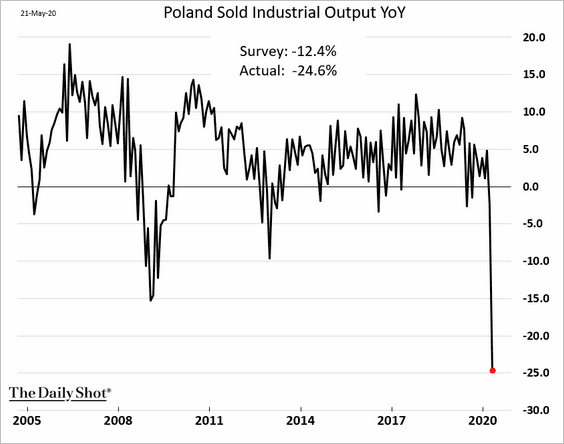
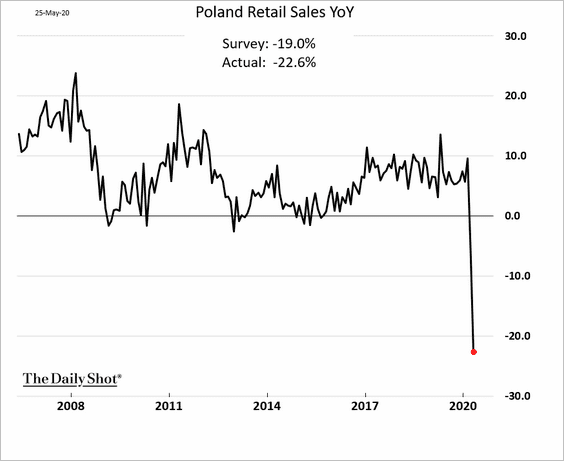
6. Poland’s industrial production and retail sales plummetted in April.
——————–
7. Southern Europe will benefit the most from the EU Recovery Fund.
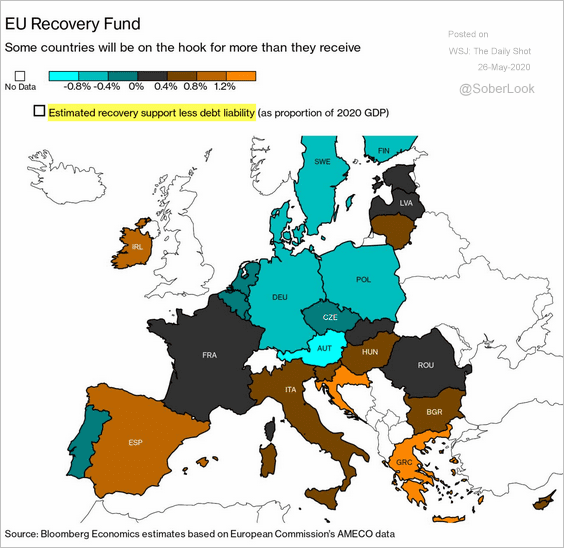 Source: @markets Read full article
The United Kingdom
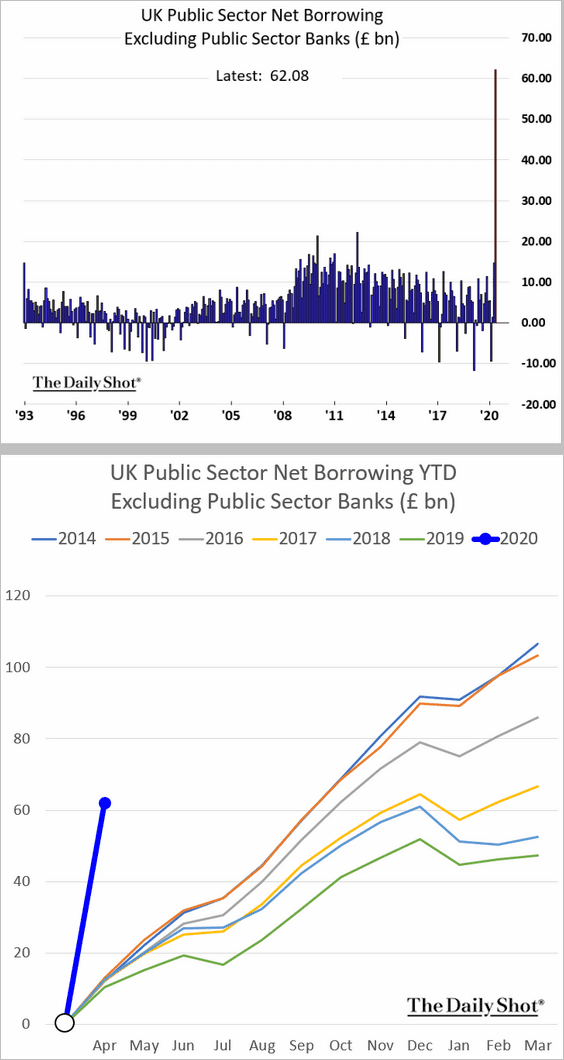
1. The UK government borrowing spiked in April. The second chart shows (fiscal) year-to-date borrowing trends by year.
The divergence between government spending and receipts was unprecedented.
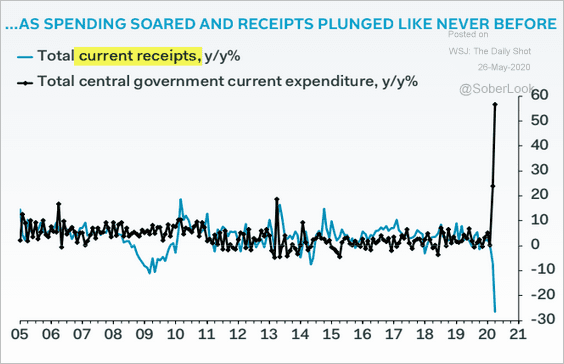 Source: Pantheon Macroeconomics
——————–
2. Retail sales plunged last month, pointing to a nearly 10% year-over-year decline in consumption.
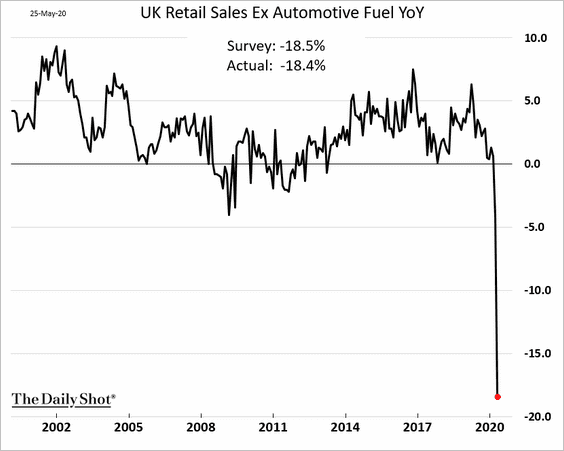
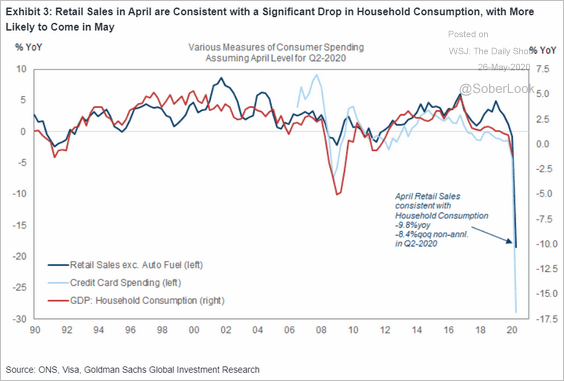 Source: Goldman Sachs
Here are some of the components of UK retail sales.
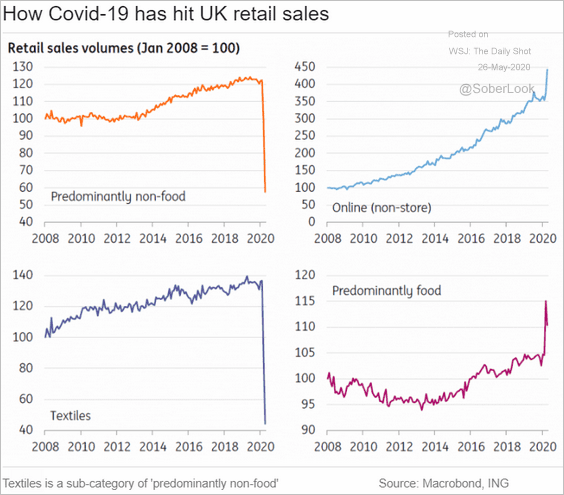 Source: ING
Canada
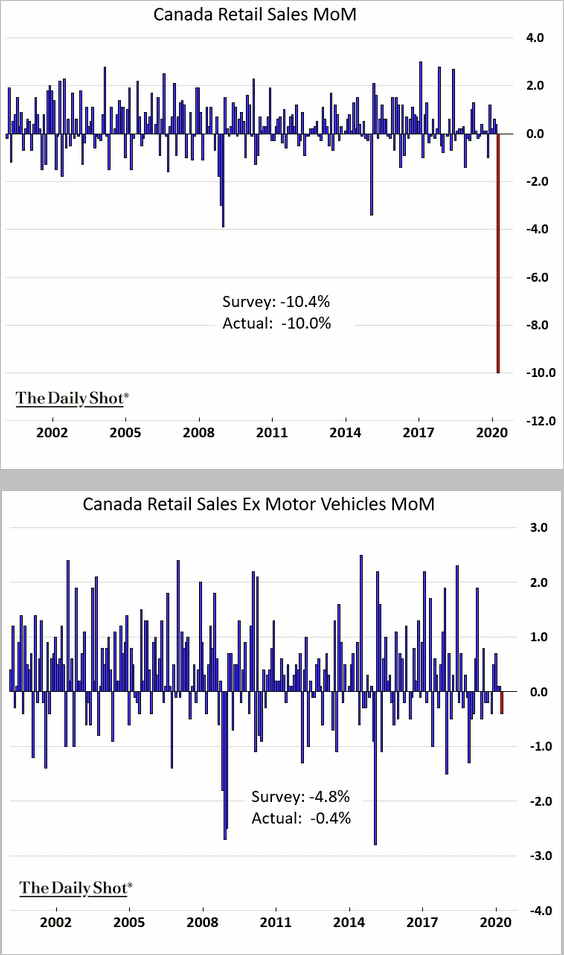
1. Canada’s March retail sales tumbled, driven by automobiles. April figures will be far worse.
2. Banks are expected to boost loan loss provisions in Q2.
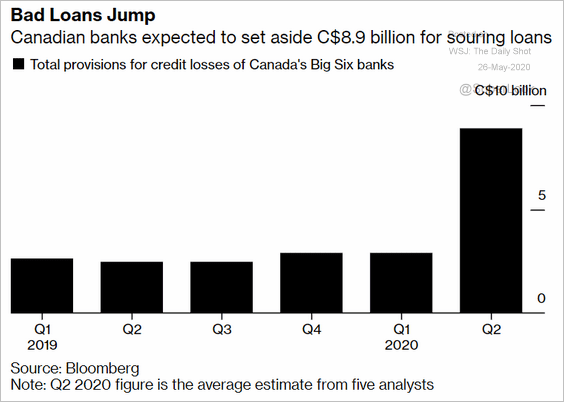 Source: @markets Read full article
3. Retail and diversified REITs (property operators) continue to underperform year-to-date.
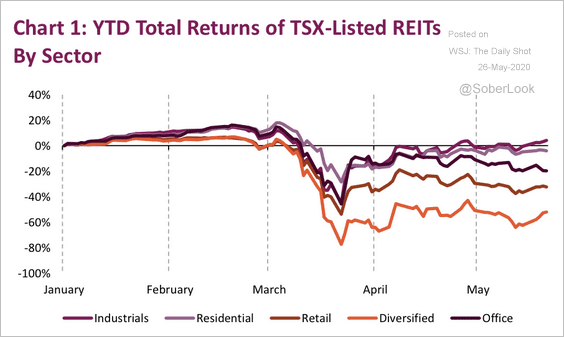 Source: Market Ethos, Richardson GMP
The United States
1. Mall owners received just a quarter of expected rent payments.
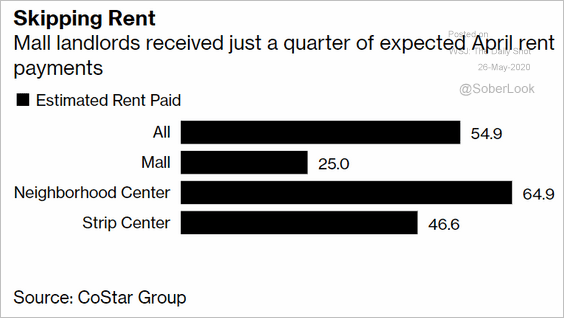 Source: @business Read full article
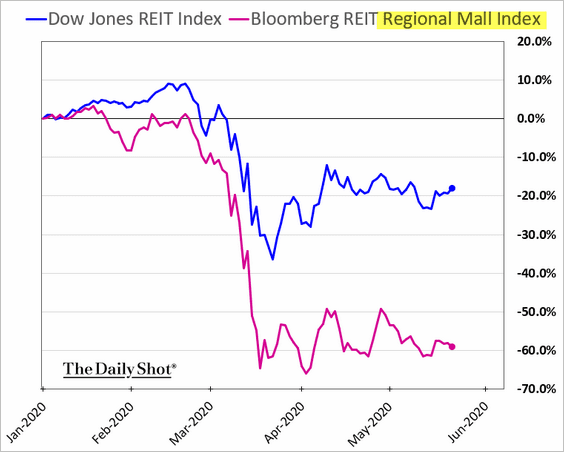
That’s why shares of malls have massively underperformed other property operators.
——————–
2. This chart shows the unemployment rate by state.
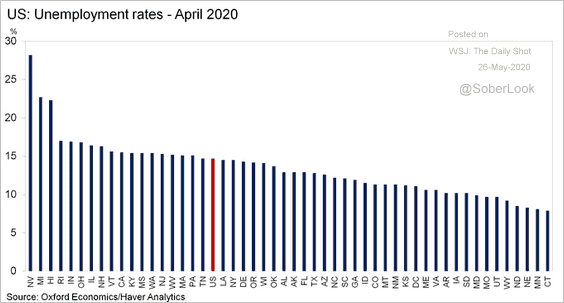 Source: @GregDaco, @OxfordEconomics, @OrenKlachkin Read full article
3. “Reopening” doesn’t mean a return to “normal.”
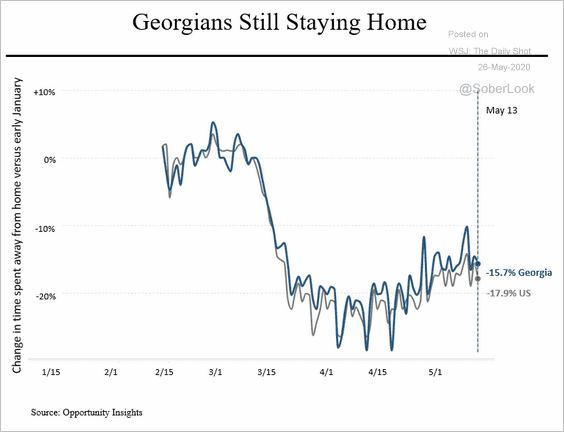 Source: @SteveRattner
Global Developments
1. Let’s begin with some year-to-date performance charts.
• Currencies and stocks:
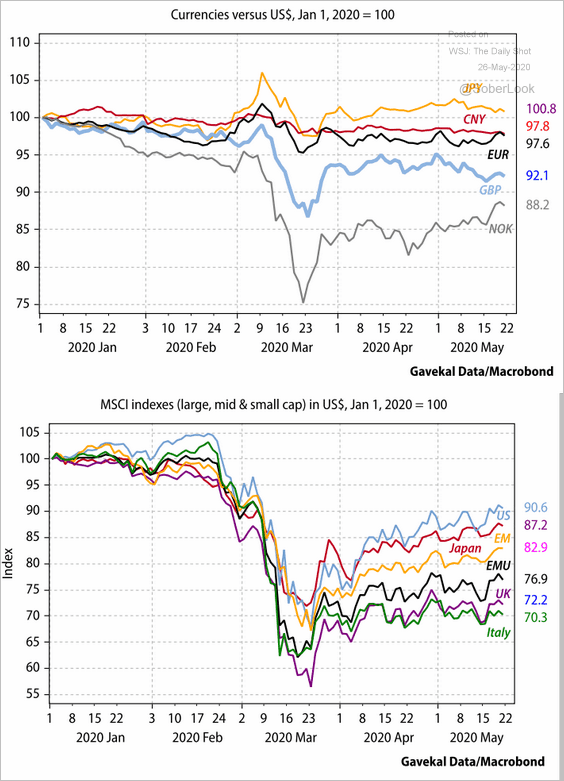 Source: Gavekal
• Credit, equities, currencies, and commodities:
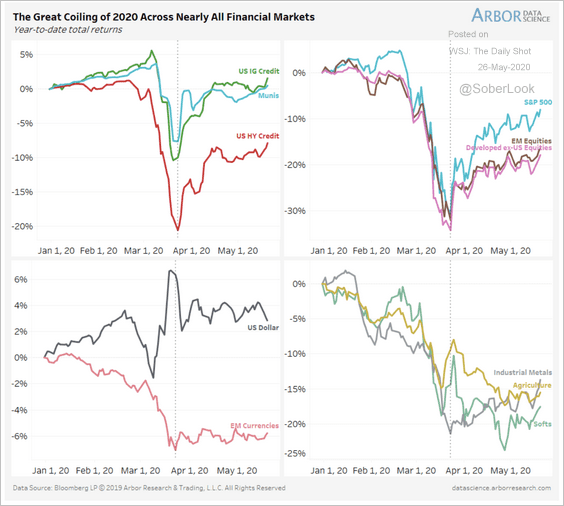 Source: Arbor Research & Trading
——————–
2. Trade has plummetted this year.
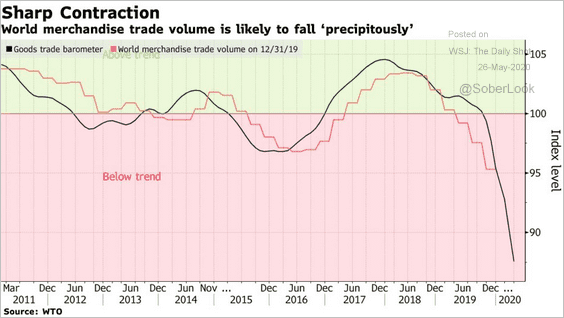 Source: @business Read full article
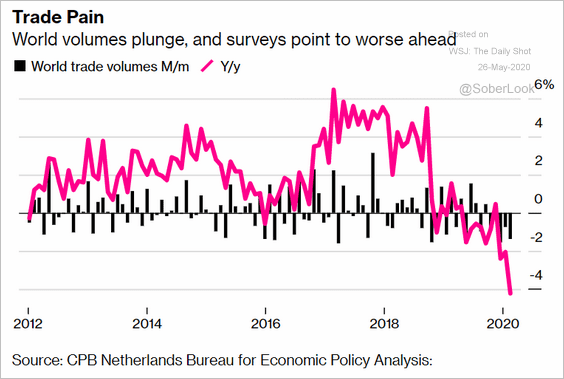 Source: @markets Read full article
——————–
3. Budget deficits are widening globally.
 Source: IIF
——————–
Food for Thought
1. US mortgage originations by age:
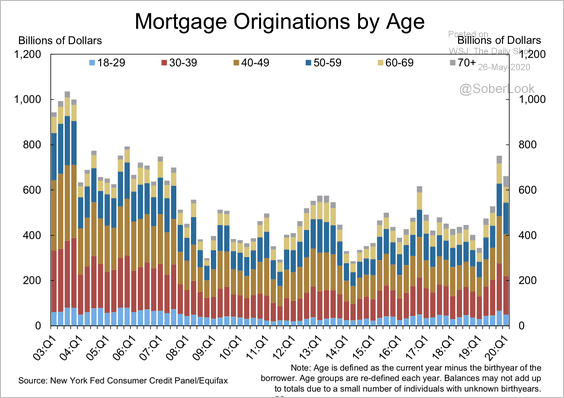 Source: New York Fed
2. The world’s wealthiest women:
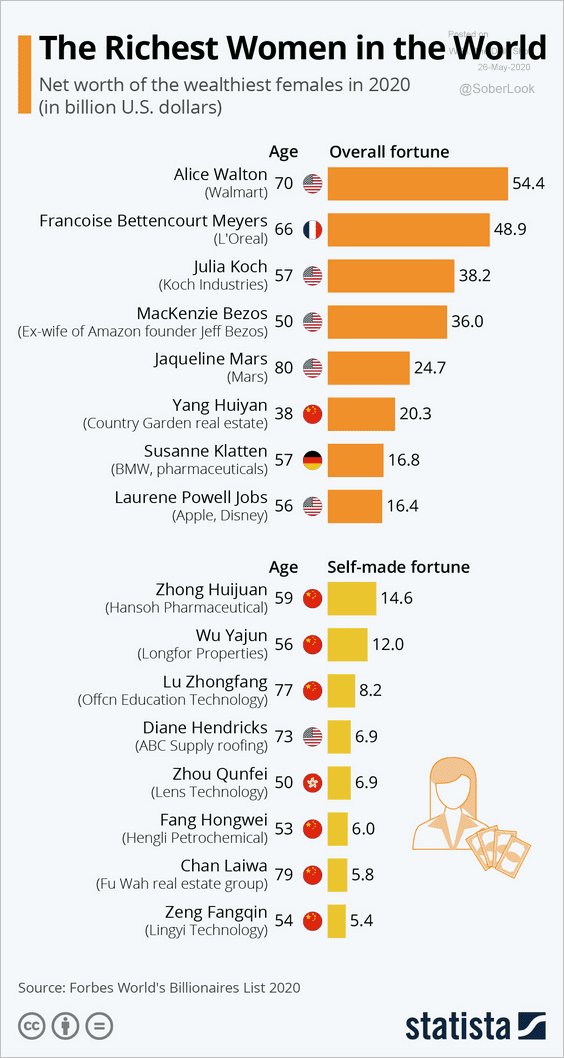 Source: Statista
3. Americans living alone:
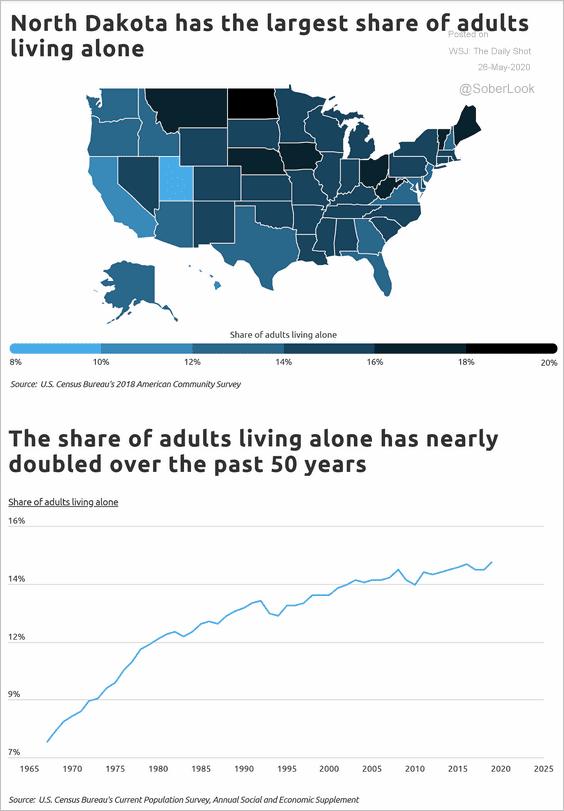 Source: Self Read full article
4. COVID-related legal complaints:
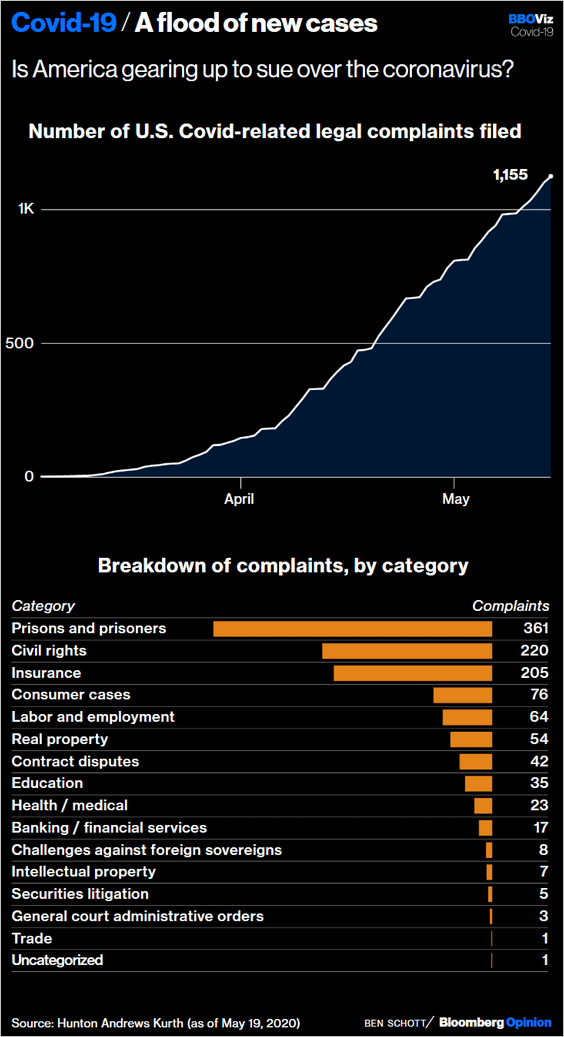 Source: @bopinion Read full article
5. Who is doing an “outstanding job”?
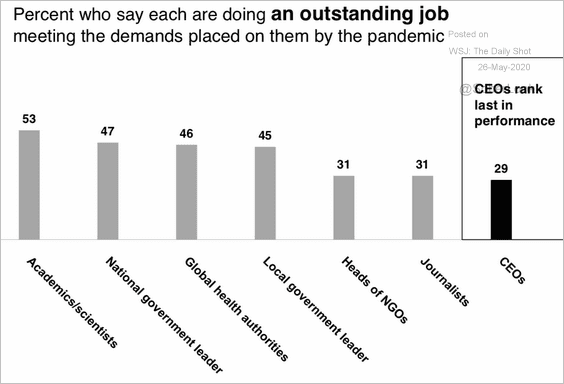 Source: Edelman Trust Barometer Read full article
6. COVID-related online search activity in select countries:
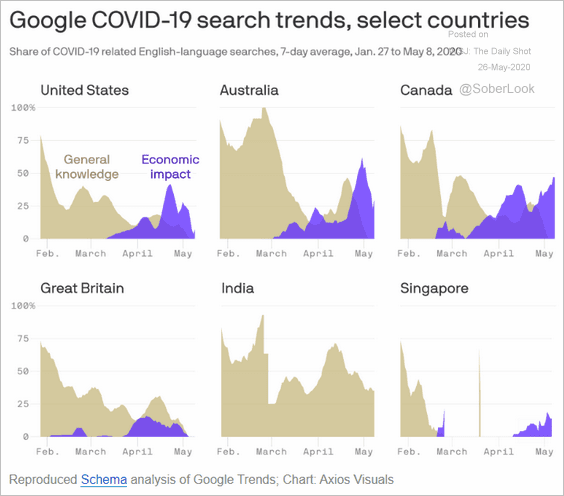 Source: @axios Read full article
7. Who is comfortable sending children back to school?
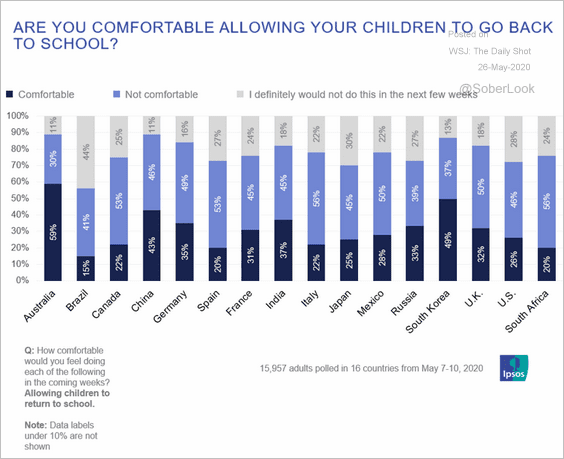 Source: Ipsos
8. Presidential job approval ratings:
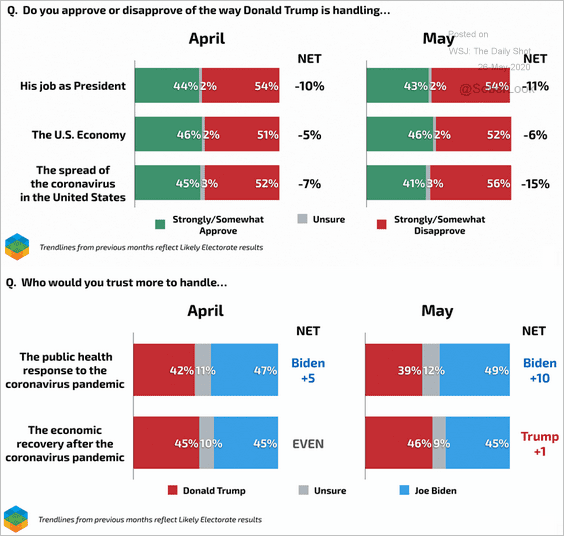 Source: Echelon Insights
9. Celebrating Memorial Day:
 Source: @CivicScience Read full article
——————–