
The Daily Shot: 28-May-20
• The United States
• Canada
• Europe
• Asia – Pacific
• China
• Emerging Markets
• Commodities
• Energy
• Equities
• Credit
• Rates
• Global Developments
• Food for Thought
The United States
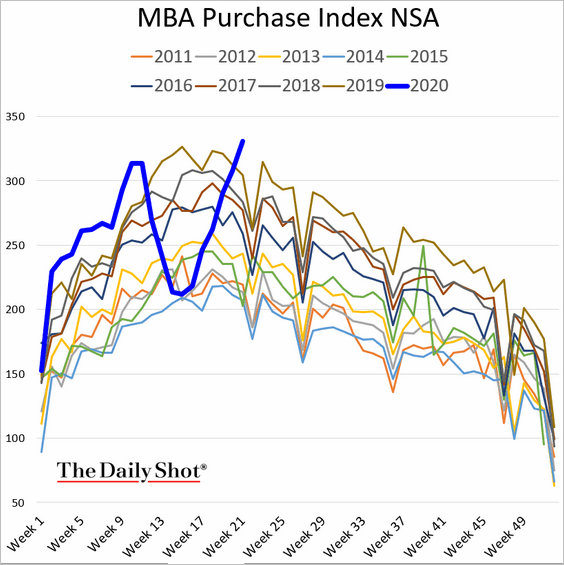
1. Mortgage applications for house purchase have fully recovered, hitting a multi-year high.
2. The rebound in consumer sentiment is stalling as layoffs continue.
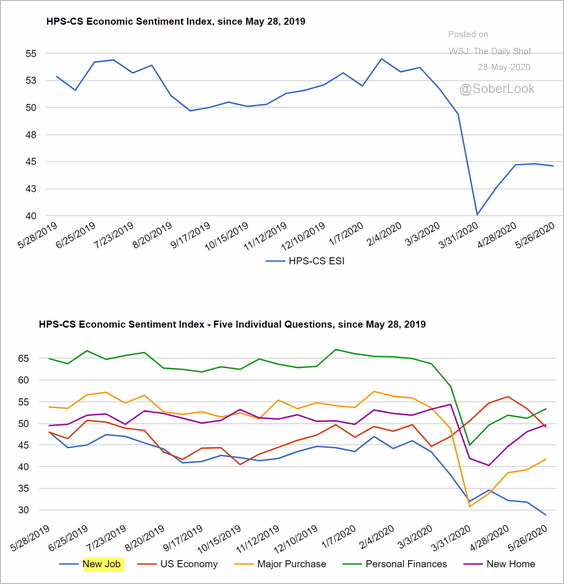 Source: @CivicScience, @HPS_CS
3. The latest surveys still suggest that many Americans are delaying paying their bills.
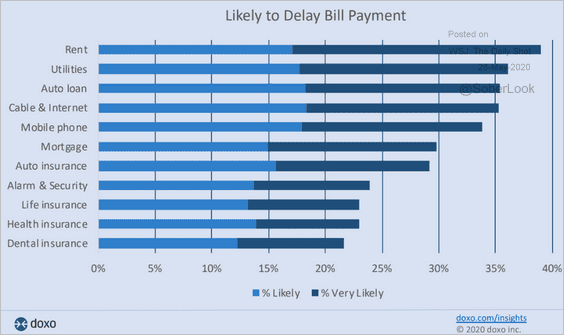 Source: doxo.com
4. Below are some updates on the labor market.
• Income loss for hourly employees:
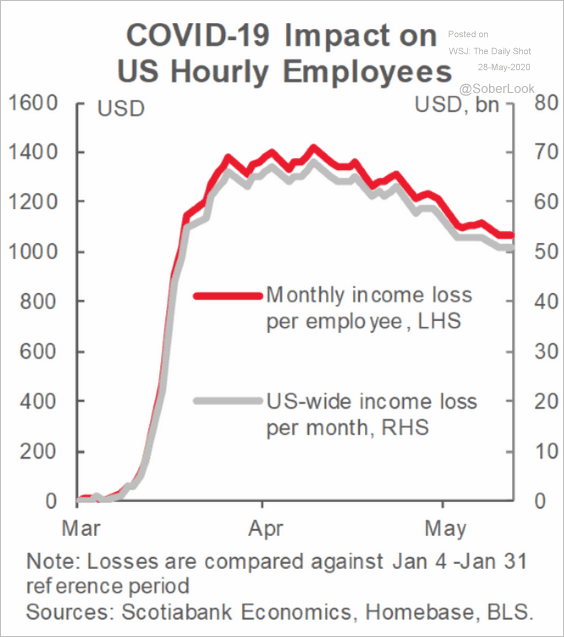 Source: Scotiabank Economics
• The employment cost index (secular downtrend):
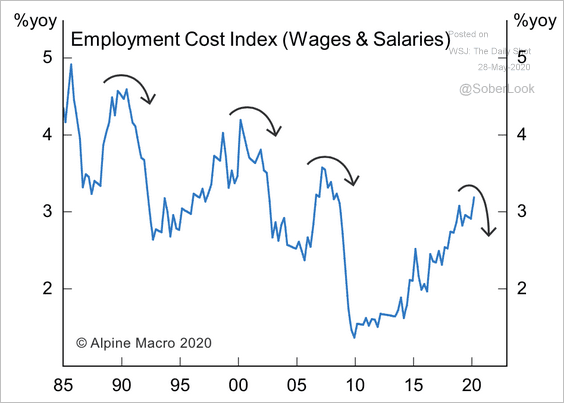 Source: Alpine Macro
• US unemployment vs. other advanced economies (from Goldman):
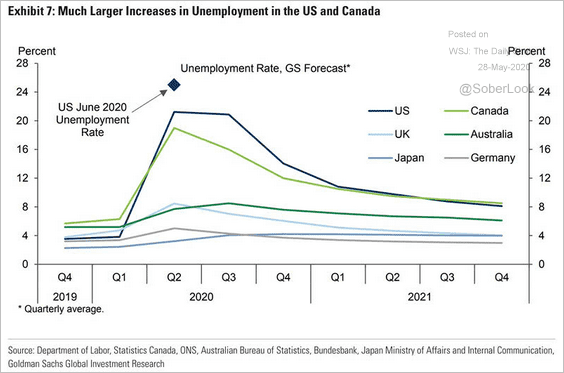 Source: @ISABELNET_SA, @GoldmanSachs
——————–
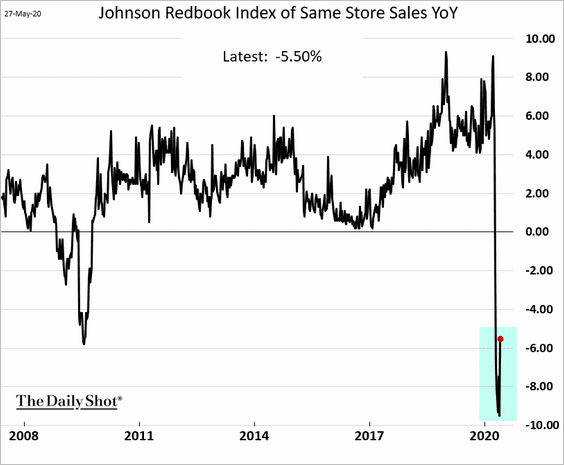
5. The Johnson Redbook Same-Store Sales Index finally bounced from extreme lows.
6. The nation’s hotel occupancy is gradually recovering.
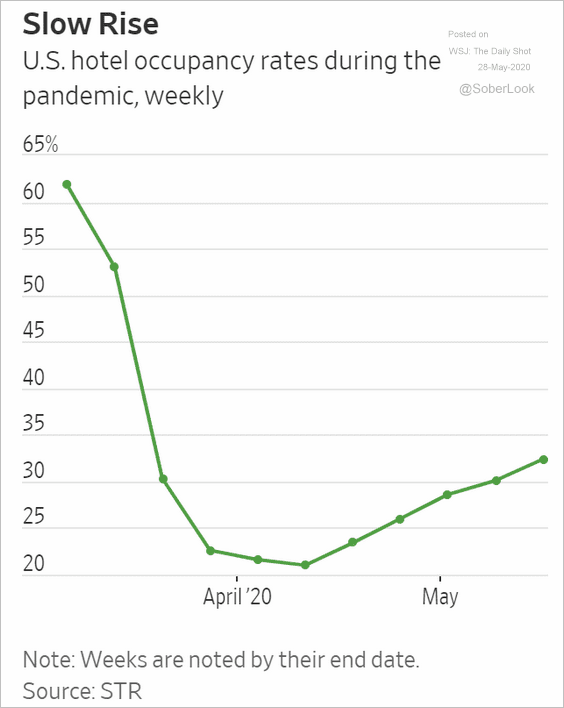 Source: @WSJ Read full article
7. Next, we have some data on the government’s small-business lending program (PPP). The charts show loan status over time as well as by business owner type, and by business age. Older businesses have been much more successful in securing government funding.
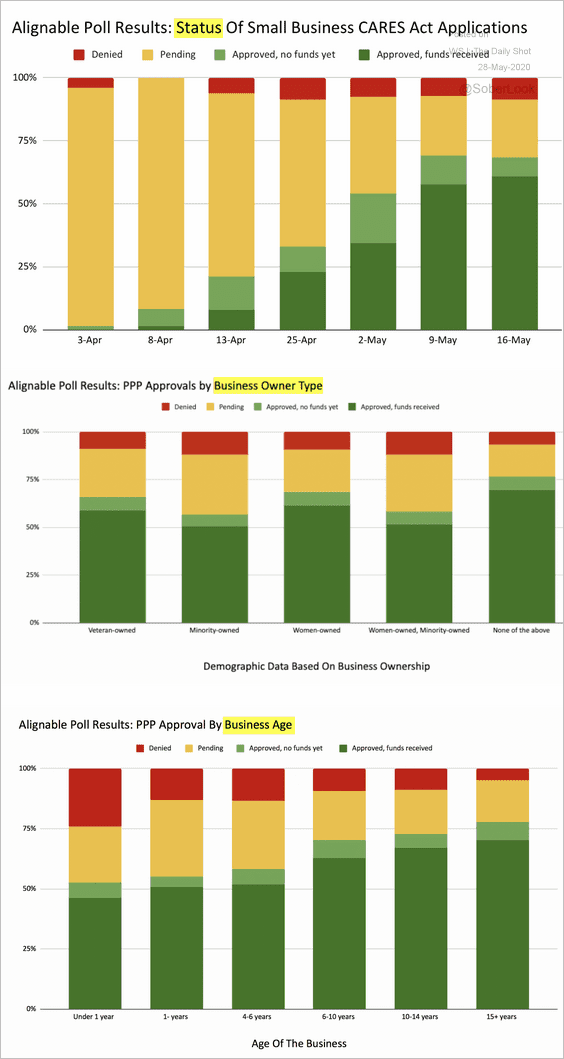 Source: Alignable.com
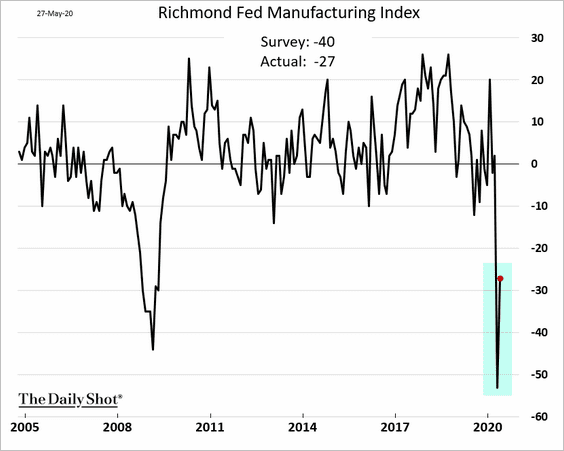
8. The Richmond Fed’s regional manufacturing index rebounded sharply from the April lows.
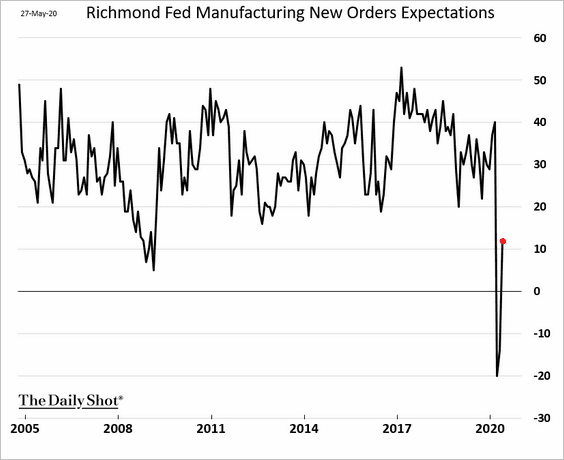
Businesses are more upbeat about future orders.
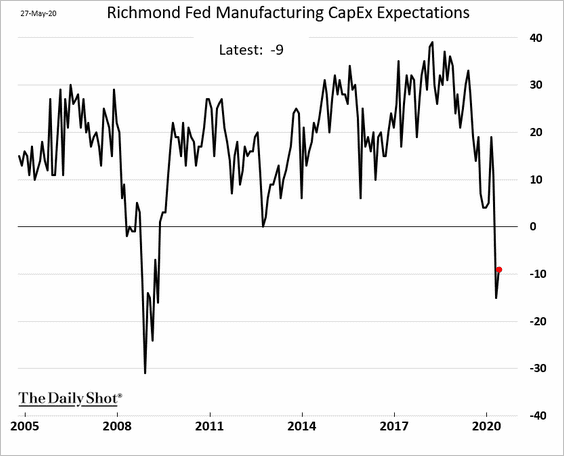
However, there were areas of persistent weakness in the report.
• CapEx expectations:
• Hiring:
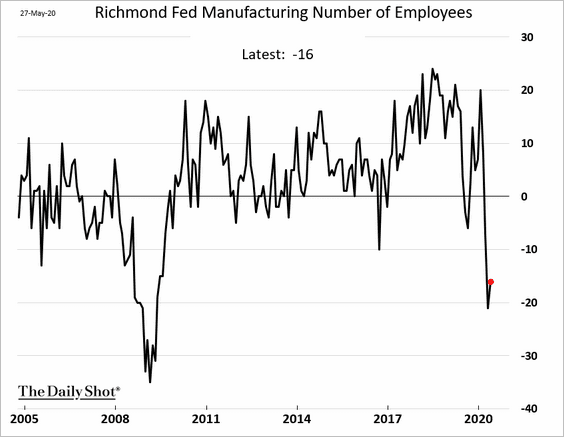
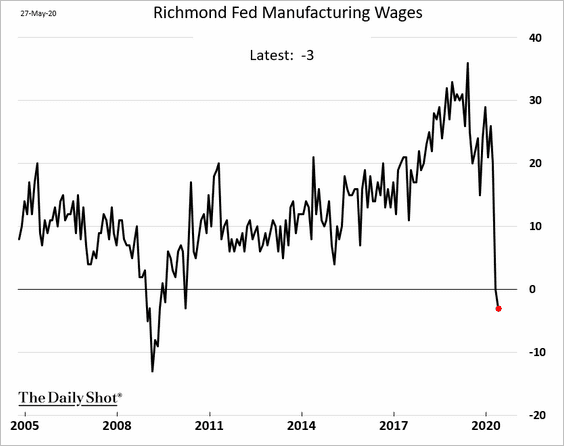
• Wages:
——————–
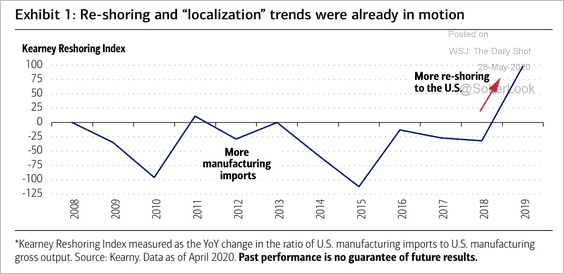
9. Re-shoring trends and the localization of supply chains were already in motion before the crisis, according to BofA.
 Source: BofA Merrill Lynch Global Research
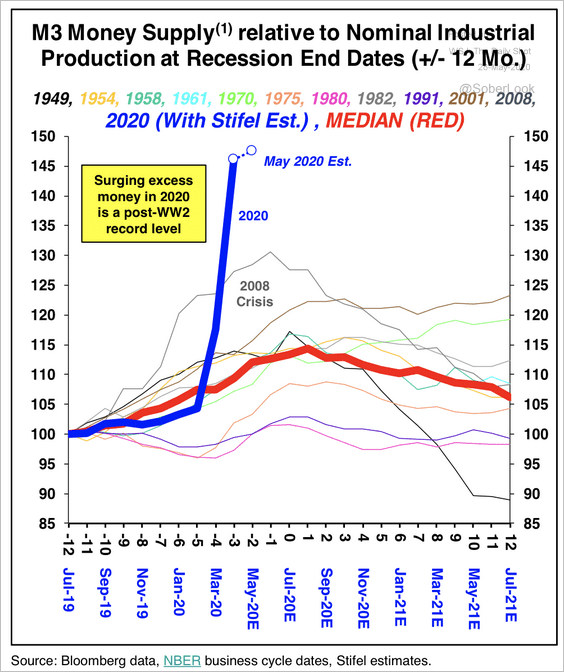
10. There has been an unprecedented surge in the broad money supply (M3) relative to industrial production (far more liquidity than the economy can deploy).
 Source: Stifel
11. Some experts have been remarkably upbeat about the recovery. Is the enthusiasm premature?
 Source: @Noahpinion, @paulkrugman, @bopinion Read full article
 Source: Markets Insider Read full article
Canada
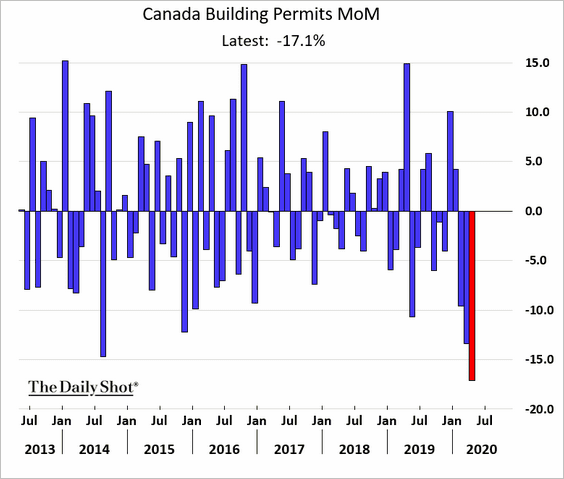
1. Building permits declined sharply last month.
2. This chart shows the share of mortgage holders deferring payments.
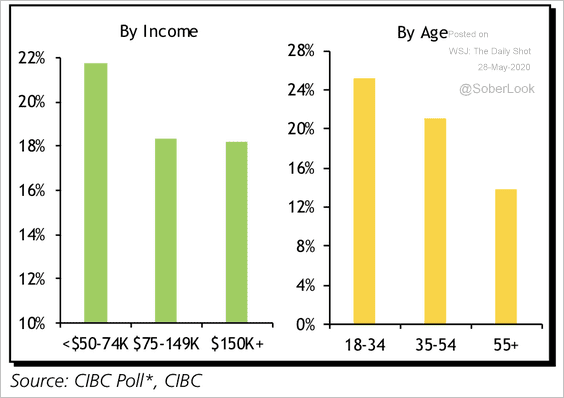 Source: CIBC Capital Markets
And here is the composition of renters unable to pay rent.
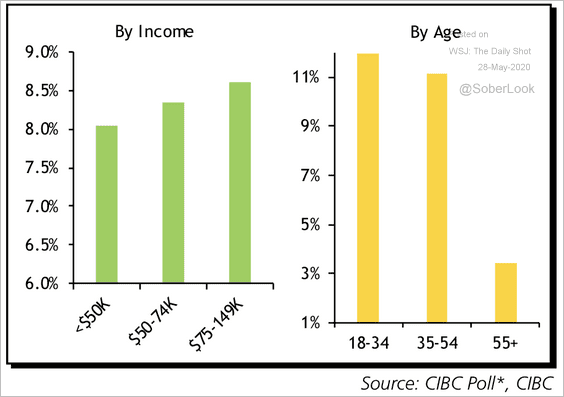 Source: CIBC Capital Markets
Europe
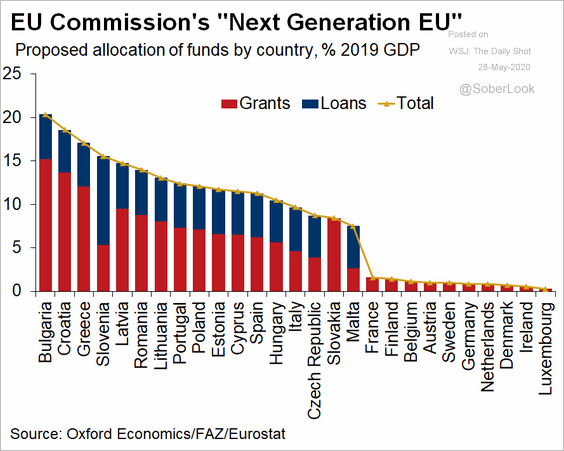
1. The EU announced a substantial fiscal measure targeting post-pandemic recovery. Who will benefit the most from the Next Generation EU fund of €750 billion?
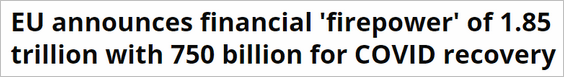 Source: euronews Read full article
 Source: @OliverRakau
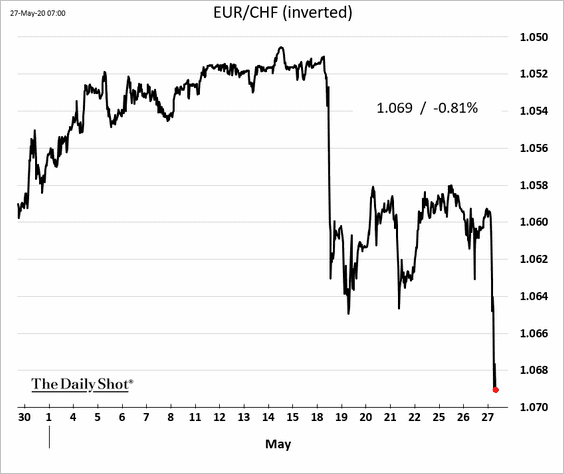
2. The Swiss franc tumbled in response to the EU stimulus measure.
3. The German 10-year government bond yield is holding support.
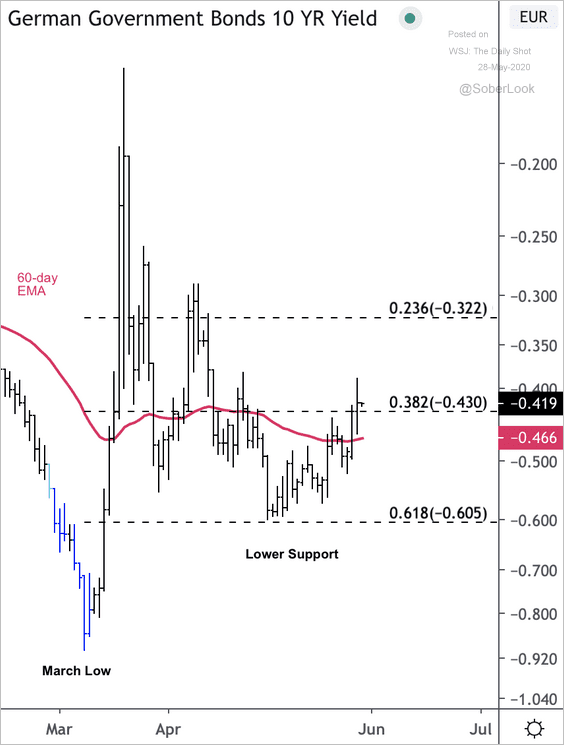 Source: @DantesOutlook
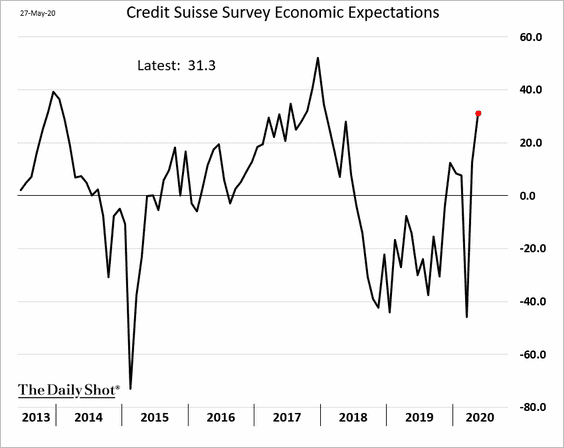
4. Swiss economic expectations rebounded.
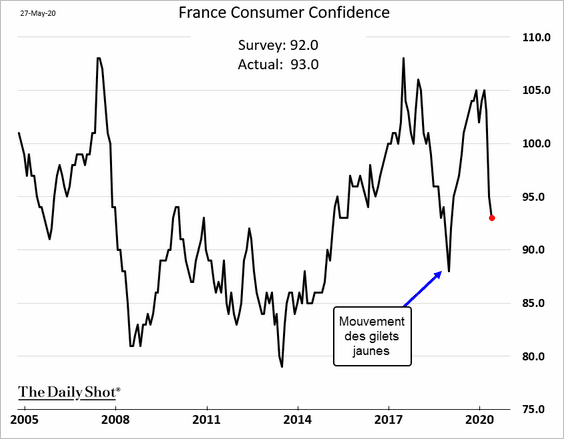
5. French consumer sentiment has been resilient.
6. The US has substantially reduced imports from Europe over the past couple of months.
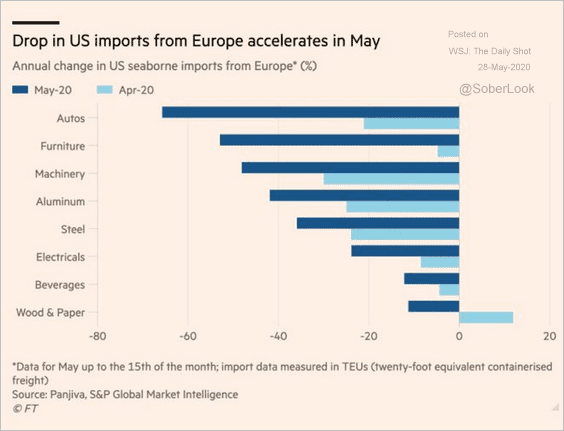 Source: @adam_tooze, @FT Read full article
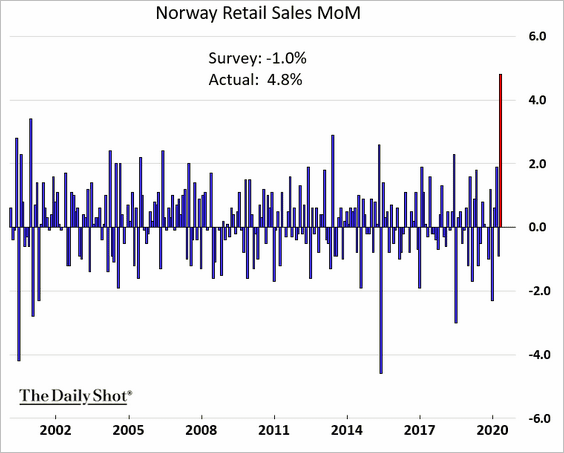
7. Norway’s retail sales were remarkably strong last month.
Asia – Pacific
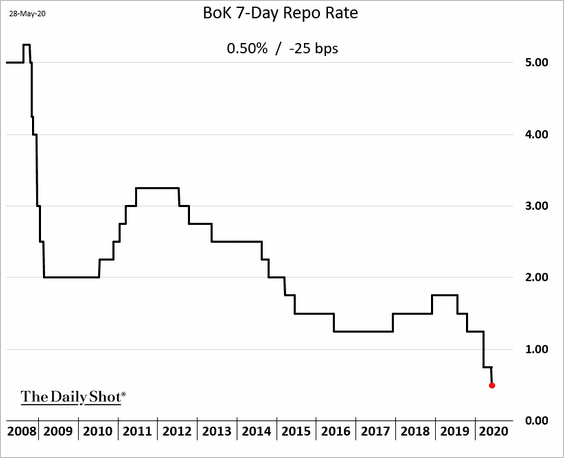
1. The Bank of Korea cut rates again.
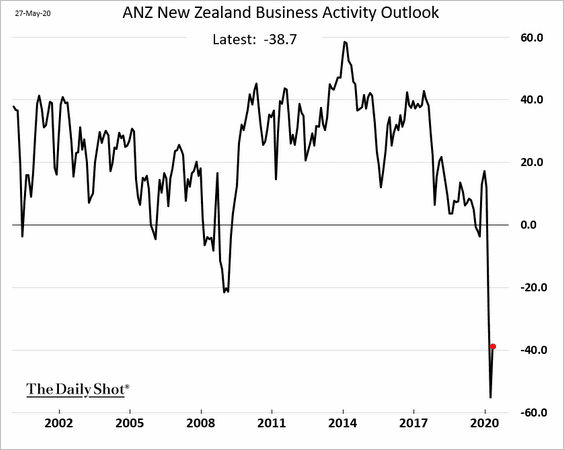
2. New Zealand’s business outlook remains well below the worst levels of 2008/09.
China
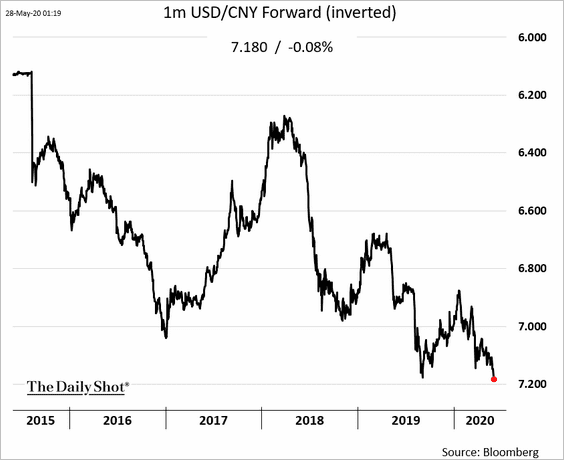
1. The 1-month renminbi F/X forward hit the lowest level in years amid concerns about devaluation.
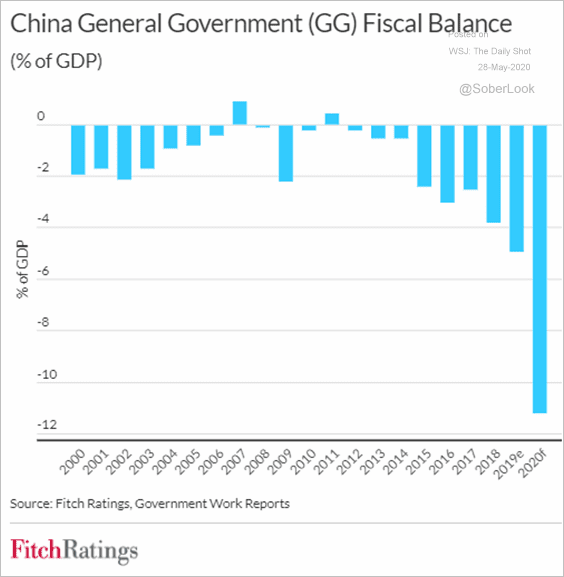
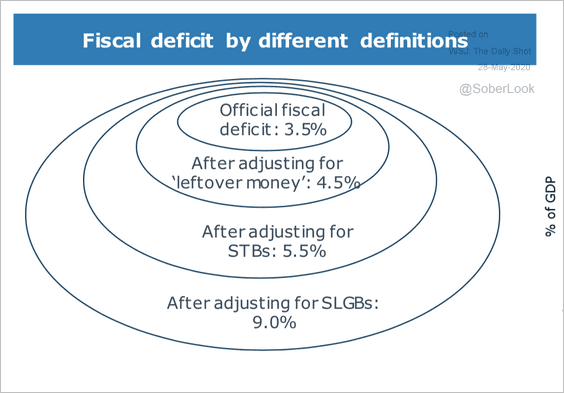
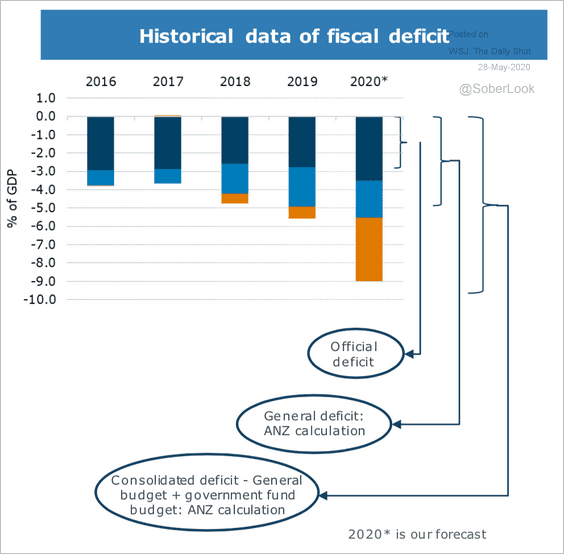
2. As we mentioned earlier (#2 here), Beijing’s official fiscal gap figures understate the full extent of China’s government deficit (3 charts).
 Source: Fitch Ratings
 Source: ANZ Research
 Source: ANZ Research
——————–
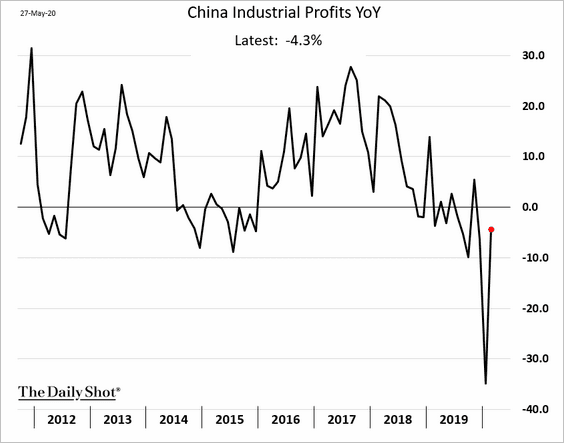
3. Industrial profits rebounded last month.
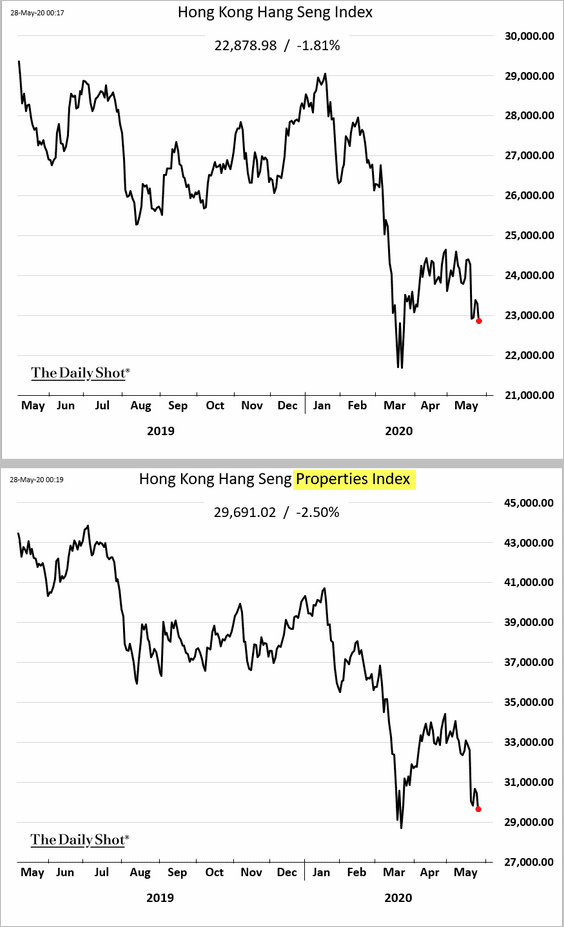
4. Hong Kong’s stock market remains under pressure.
Emerging Markets
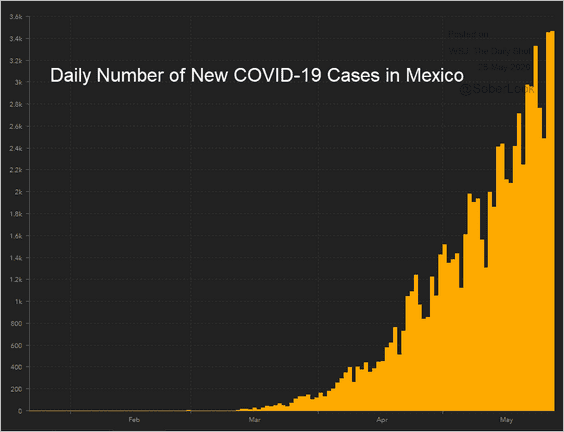
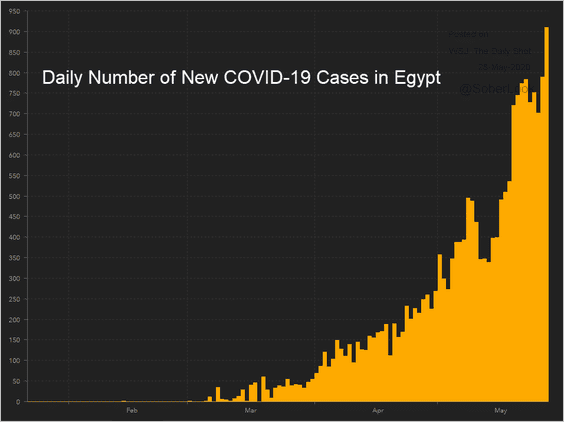
1. Many EM economies (especially in Latin America) are struggling to get the pandemic under control, with the daily number of new cases continuing to climb. Here are some examples.
• Mexico:
 Source: JHU CSSE
• Colombia:
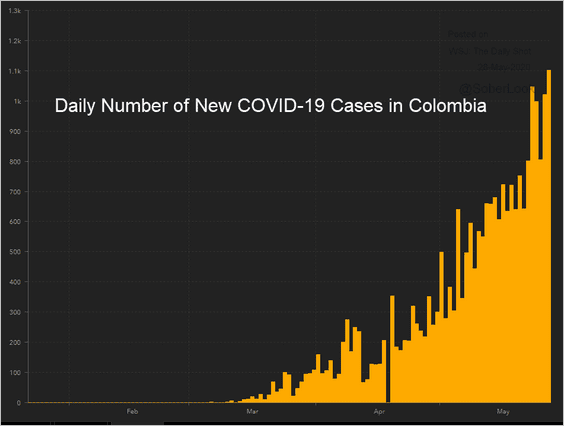 Source: JHU CSSE
• Peru:
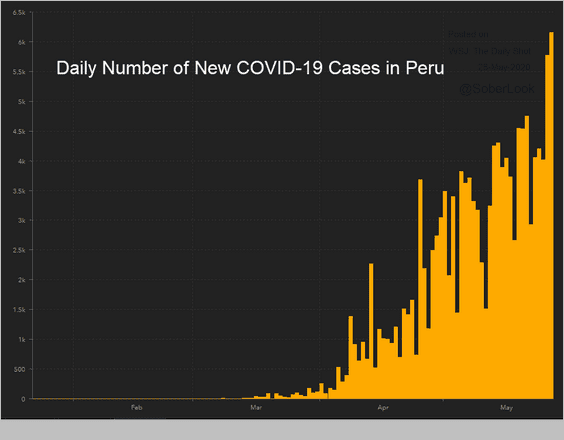 Source: JHU CSSE
• South Africa:
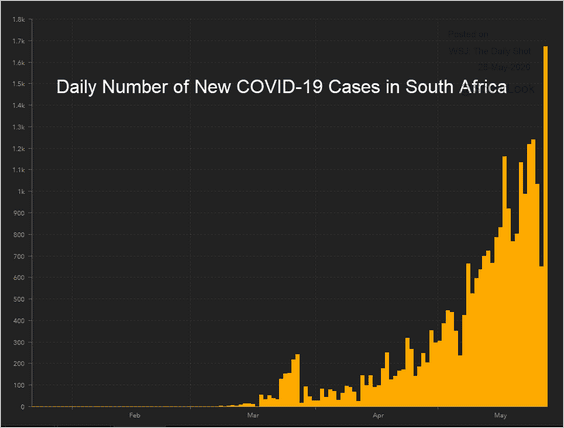 Source: JHU CSSE
• India:
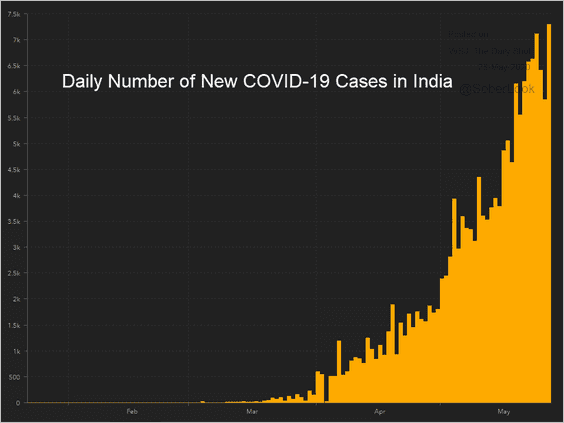 Source: JHU CSSE
• Egypt:
 Source: JHU CSSE
——————–
2. Brazil’s formal labor market deteriorated last month.
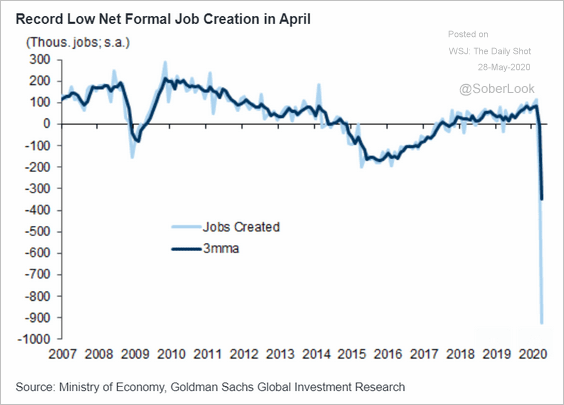 Source: Goldman Sachs
Separately, Brazil’s stock market is starting to recover (in dollar terms).
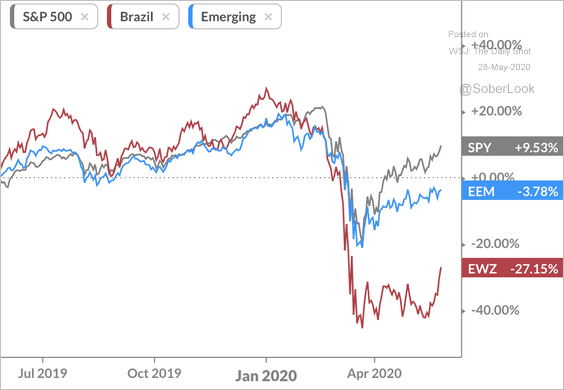 Source: Koyfin
——————–
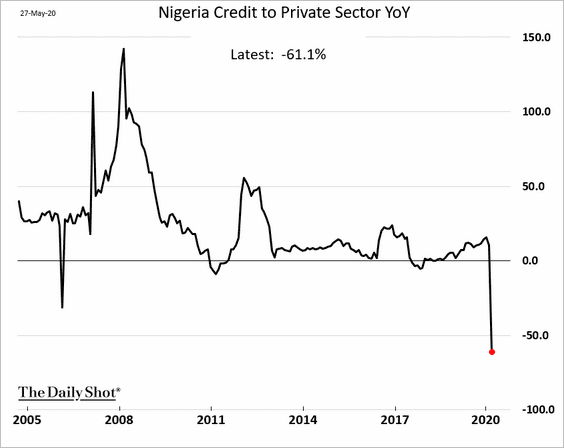
3. Nigeria’s private-sector credit collapsed.
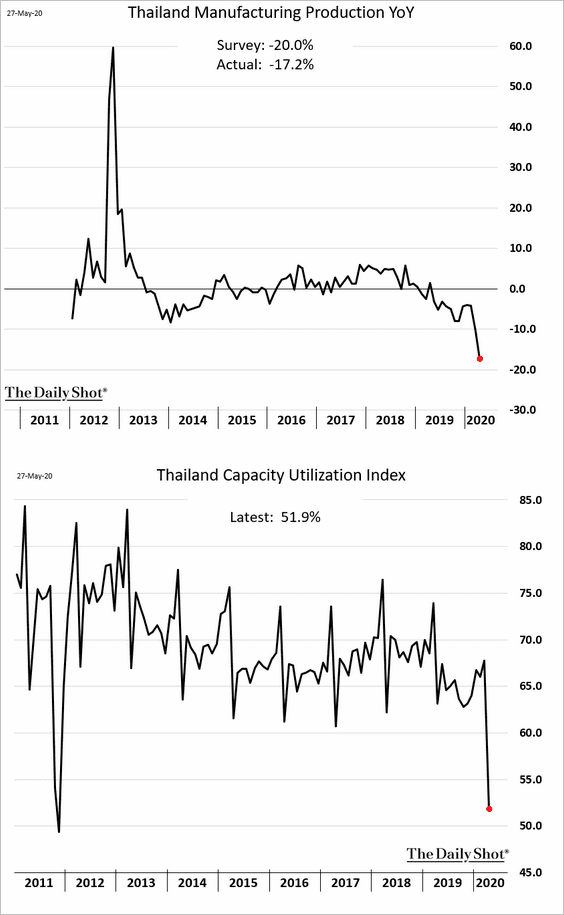
4. Thailand’s industrial output has deteriorated sharply.
5. This chart shows foreign investor holdings of EM stocks and bonds (as % of GDP).
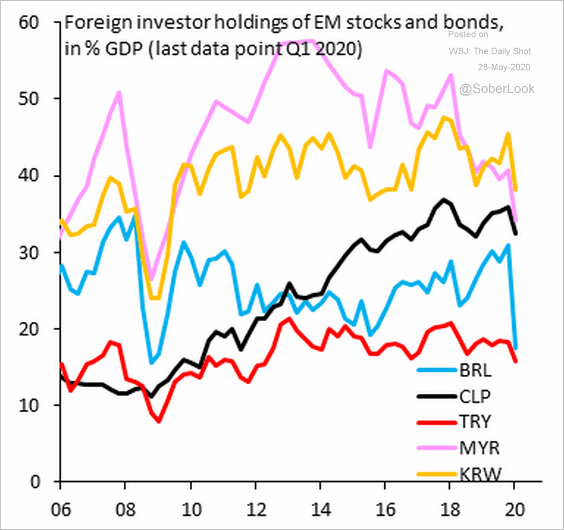 Source: @RobinBrooksIIF
Commodities
1. Some analysts continue to predict a return of the commodities supercycle.
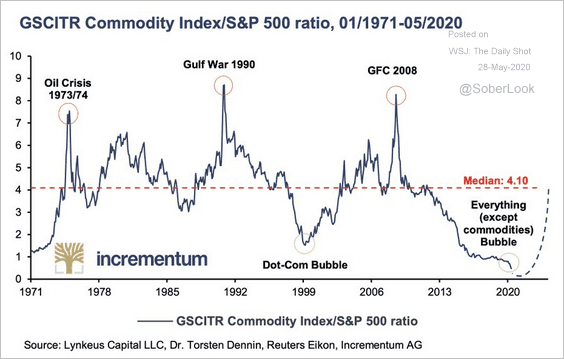 Source: @jessefelder Read full article
2. Gold ETF inflows remain robust.
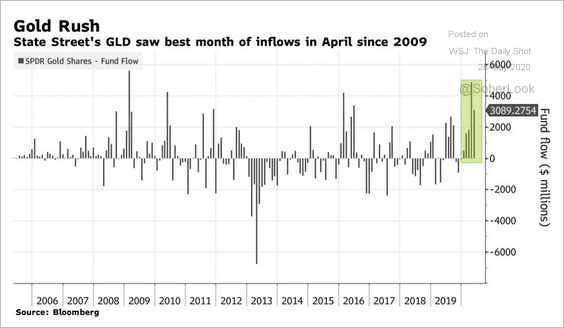 Source: @jessefelder, @markets Read full article
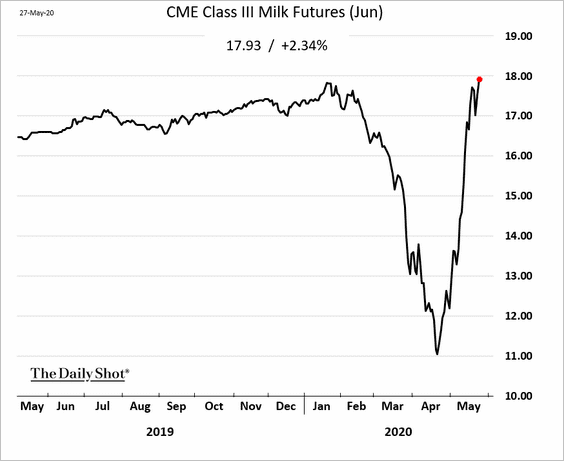
3. US milk futures have fully recovered from the April lows. Farmers dumping milk as well as new federal government programs supporting farm product drove the rebound.
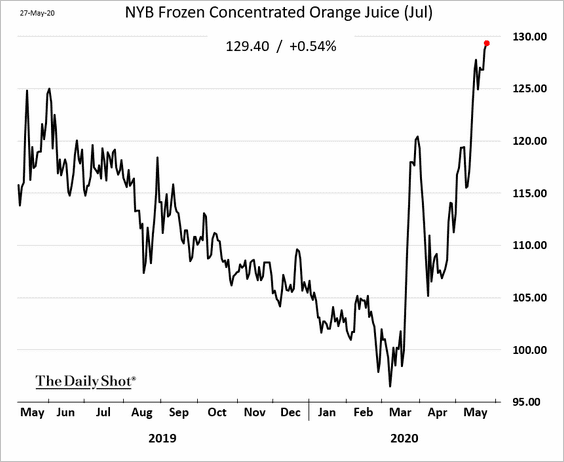
4. The rally in orange juice futures continues.
 Source: @axios Read full article
Energy
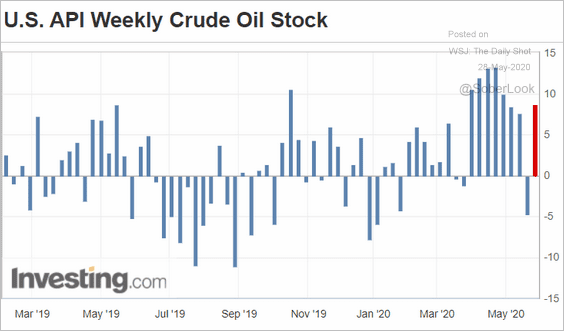
1. Oil traders will be closely watching the government’s data on inventories later today after the API reported a sharp weekly increase.
2. OPEC’s surplus crude oil production capacity is expected to be well above its 10-year average.
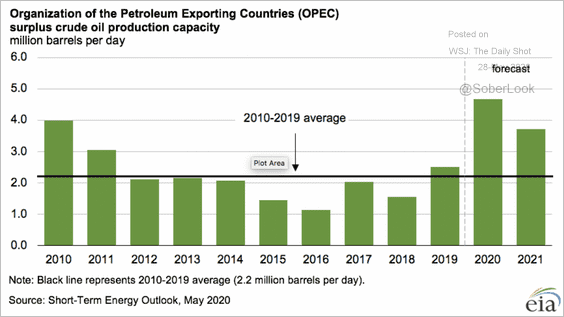 Source: @EIAgov
3. At the beginning of the crisis, demand factors drove oil lower, then supply factors quickly kicked in around April.
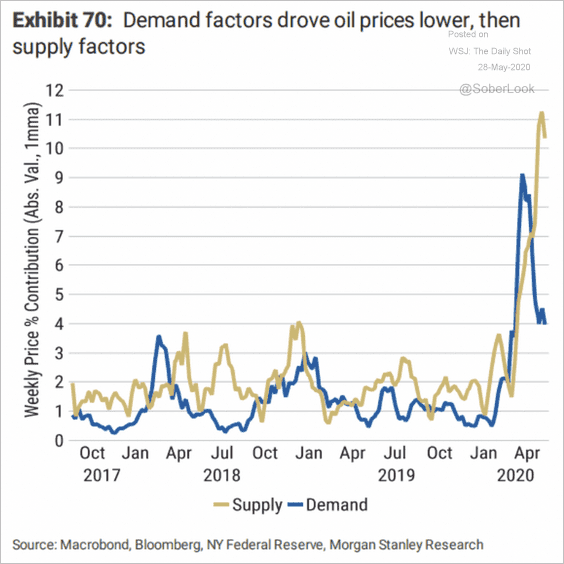 Source: Morgan Stanley Research
4. European refinery margins remain depressed, which may force consolidation in the industry.
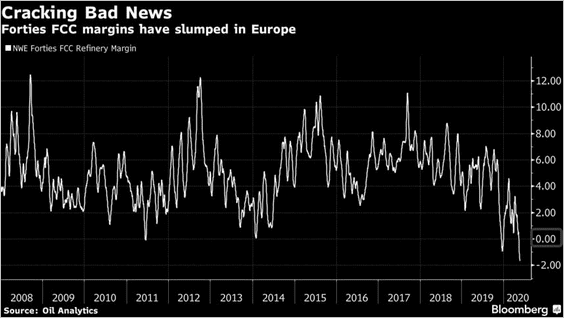 Source: @business Read full article
5. The upper bound price of NYMEX natural gas futures is fairly volatile, with some expecting extreme demand this coming winter, according to the EIA.
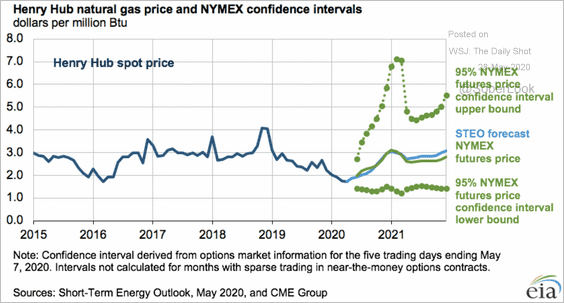 Source: @EIAgov
For now, natural gas futures have fully reversed the April rally.
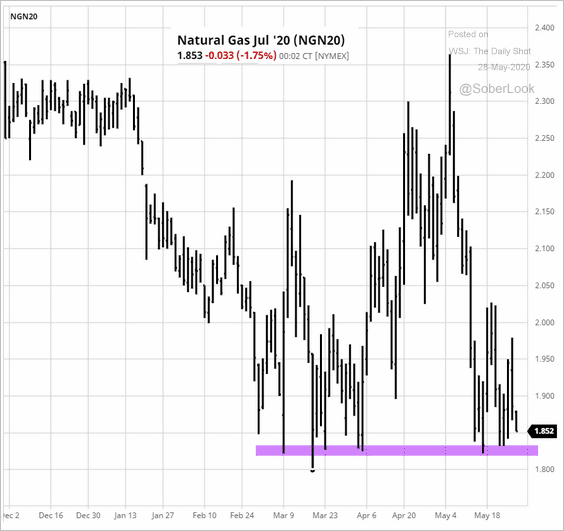 Source: barchart.com
Equities
1. Let’s start with some sentiment indicators.
• Morgan Stanley’s equity risk indicator is back at “neutral” level.
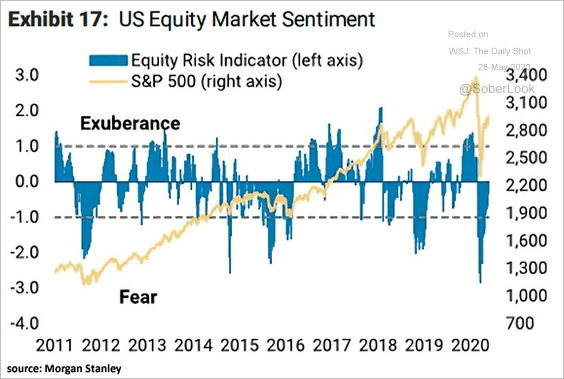 Source: @ISABELNET_SA, @MorganStanley
• Financial Twitter sentiment is nearly there as well.
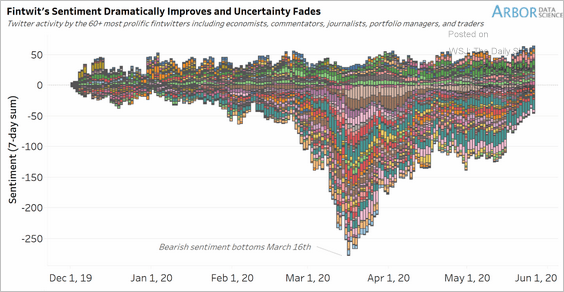 Source: Arbor Research & Trading
• Put/call ratios show market optimism.
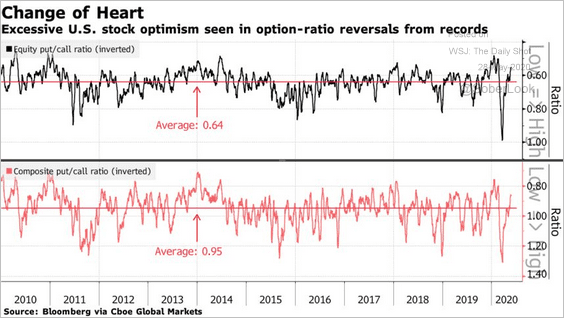 Source: @markets Read full article
• Retail investors are increasingly interested in the mega-cap tech shares.
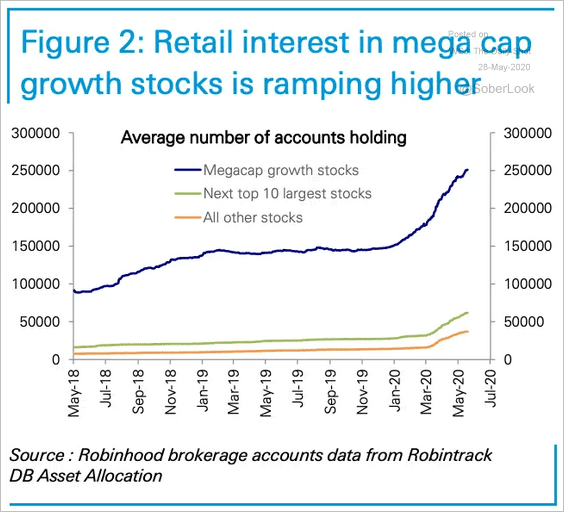 Source: @DeutscheBank, @ISABELNET_SA
——————–
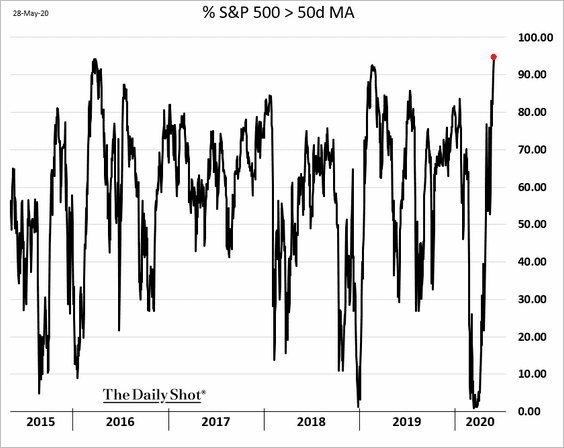
2. The speed of this recovery has been remarkable.
• The percentage of S&P 500 members above their 50-day moving averages is the highest in over a decade.
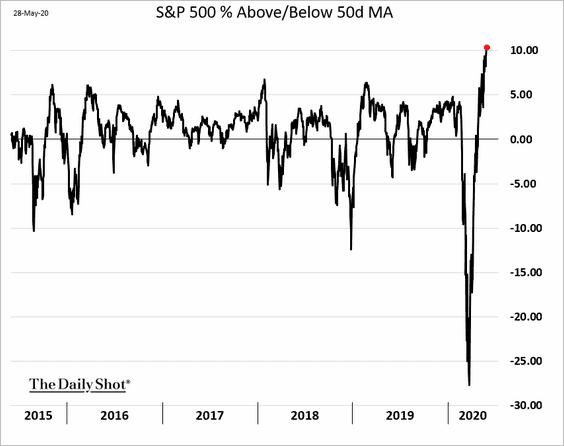
• Here is the S&P 500 index relative to its 50-day moving average.
——————–
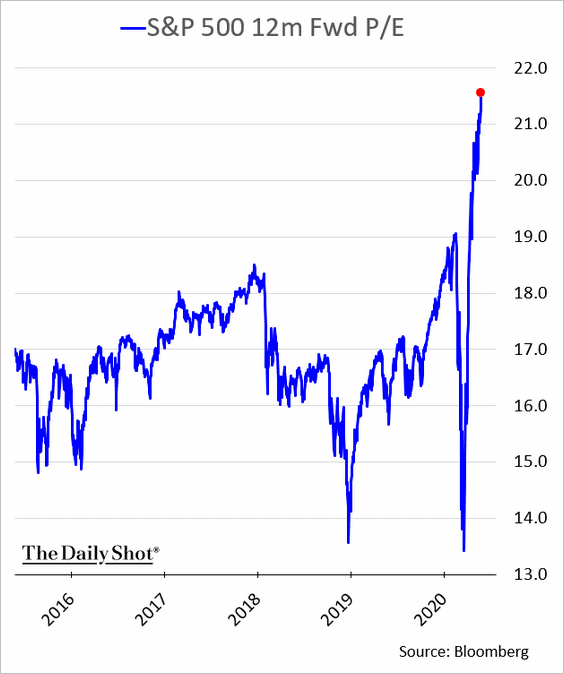
3. The S&P 500 12-month forward P/E ratio keeps climbing. The market is betting on a massive recovery in earnings after the near-term slump.
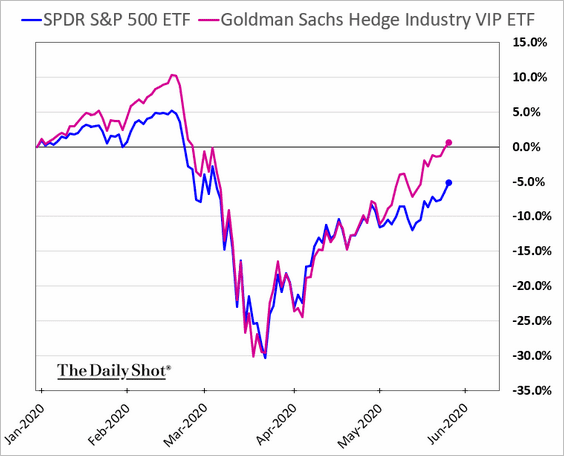
4. Shares commonly held by hedge funds have been outperforming.
5. It’s been a good couple of days for value shares.
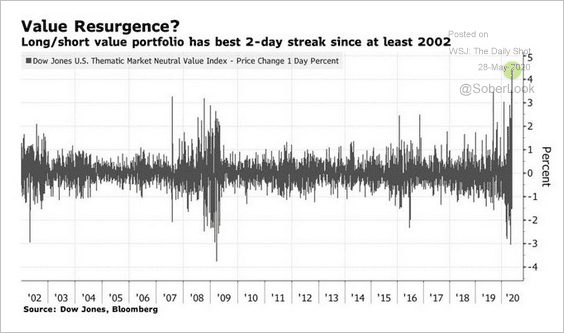 Source: @TheStalwart, @SarahPonczek Read full article
6. The median move of stocks in the equally weighted value line index has significantly diverged from the S&P 500 rally.
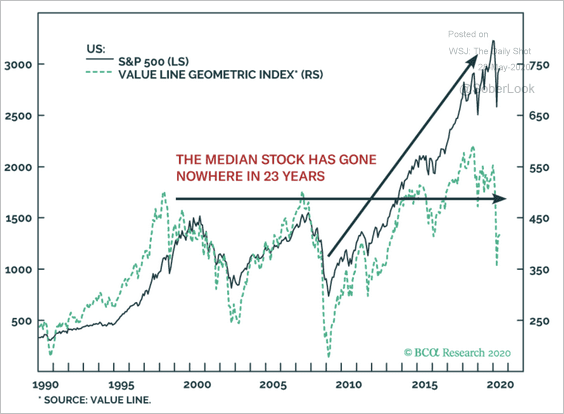 Source: BCA Research
7. The defensive/cyclical ratio appears to have peaked in March.
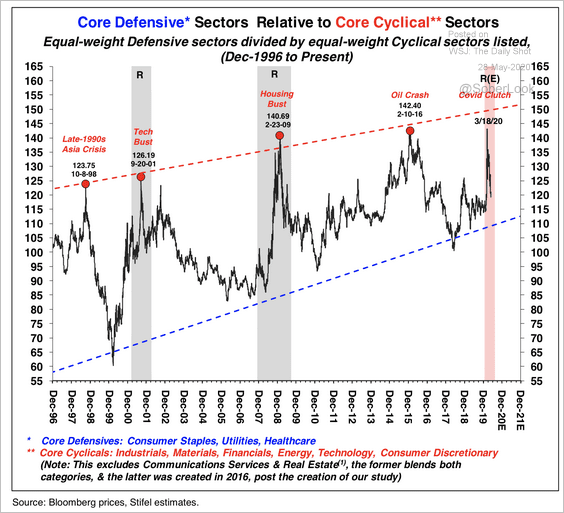 Source: Stifel
8. Hedge funds have been net sellers since late April.
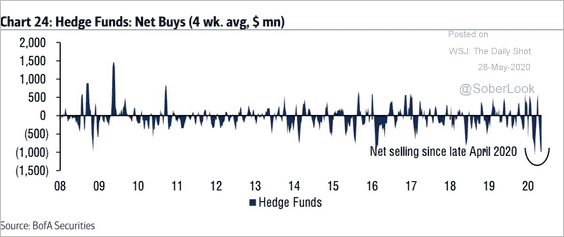 Source: BofA Securities
9. Investors are chasing healthcare stocks.
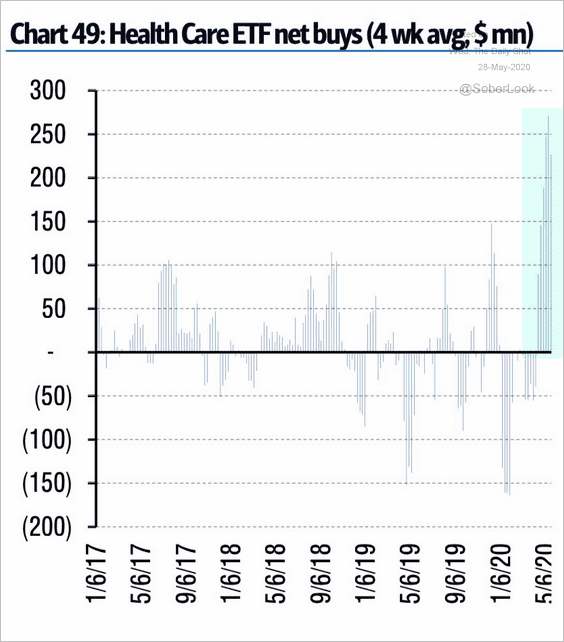 Source: BofA Merrill Lynch Global Research, @WallStJesus
Credit
1. Here is a breakdown of US high-yield defaults by sector.
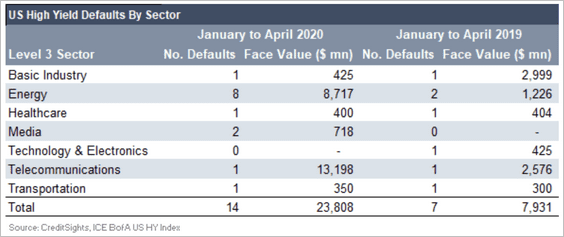 Source: CreditSights
The market-implied US high-yield default rate through February 2021 is 6.6%.
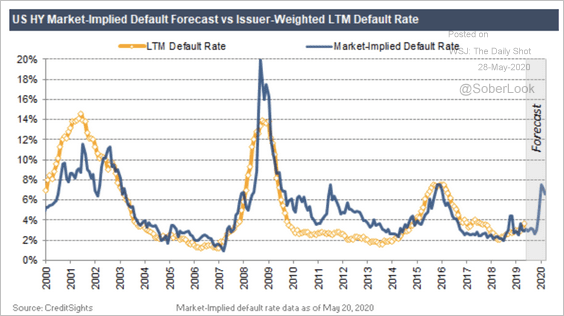 Source: CreditSights
——————–
2. Japan’s Norinchukin stepping away from CLOs is terrible news for that market. The bank has been one of the primary buyers of AAA tranches, which will be increasingly difficult to place going forward.
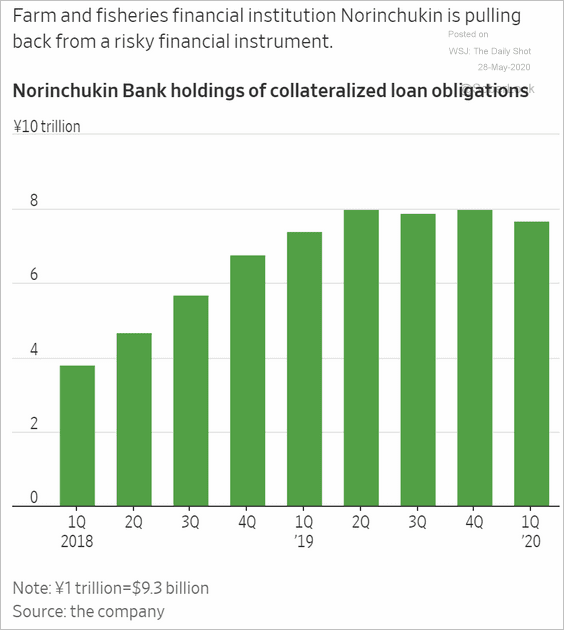 Source: @WSJ Read full article
3. Short-term muni yields continue to decline.
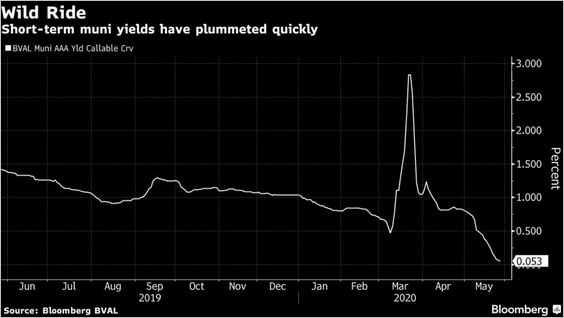 Source: @markets Read full article
Rates
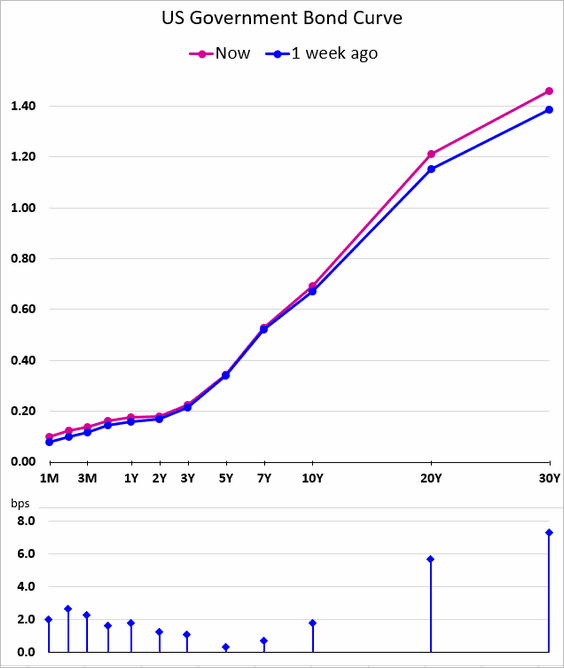
1. The long end of the Treasury curve keeps steepening.
2. Technicals suggest that Treasuries are overbought.
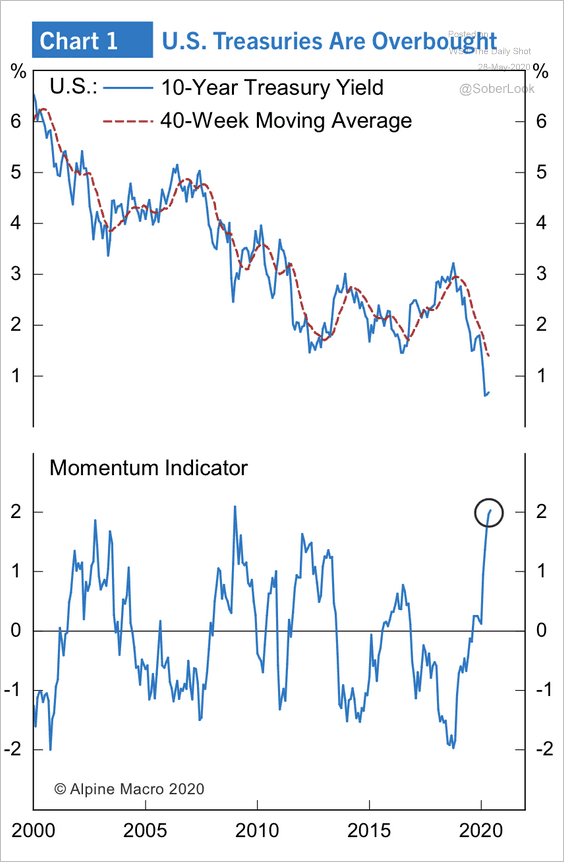 Source: Alpine Macro
Global Developments
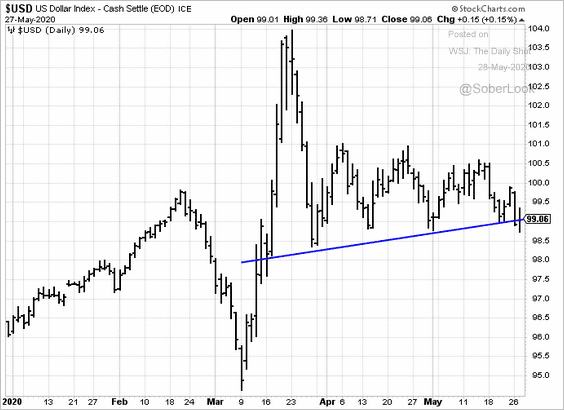
1. The US dollar is testing support.
2. EM FX volatility is at extreme highs relative to developed markets.
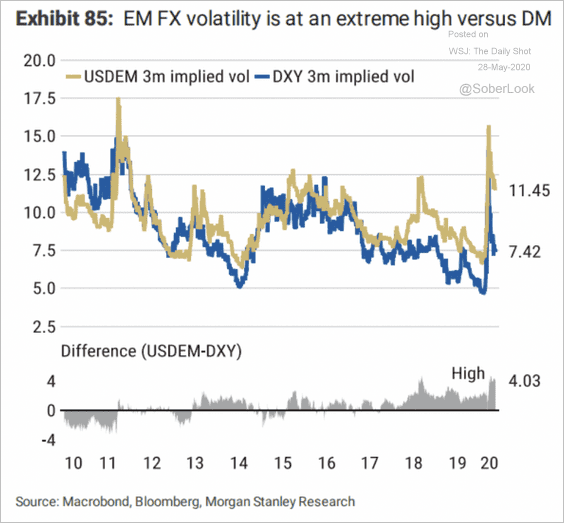 Source: Morgan Stanley Research
3. This chart shows BlackRock’s estimated 5-year annualized returns and uncertainty bands by asset class.
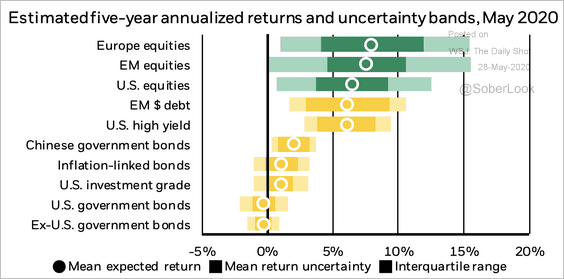 Source: BlackRock Read full article
4. Trade indicators continue to deteriorate (3 charts).
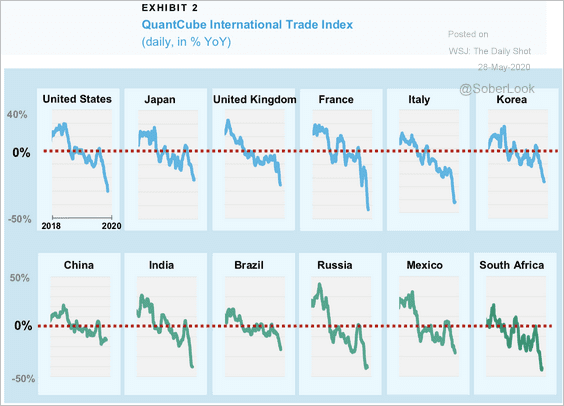 Source: Moody’s Investors Service
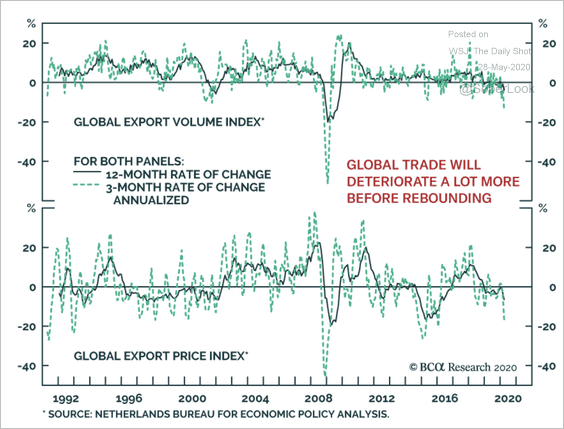 Source: BCA Research
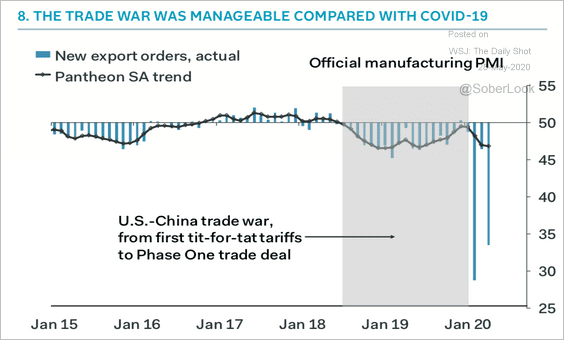 Source: Pantheon Macroeconomics
——————–
Food for Thought
1. Total US consumer debt by borrowers’ age:
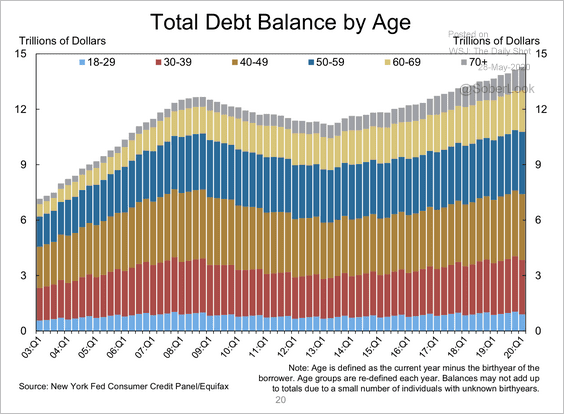 Source: New York Fed
2. Healthcare employment:
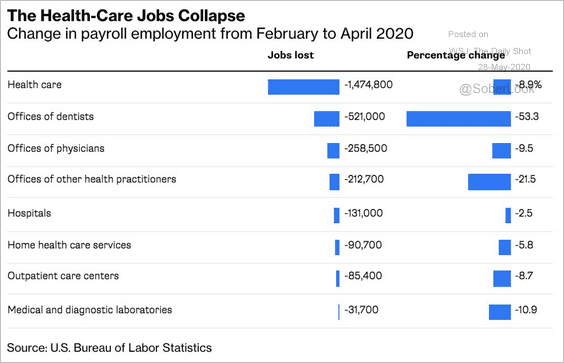 Source: @bopinion Read full article
3. New drug prescriptions:
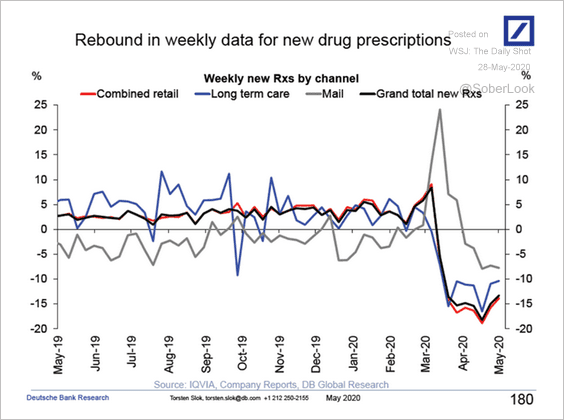 Source: Deutsche Bank Research
4. Tracking the pandemic by measuring virus levels in New Haven’s sewage:
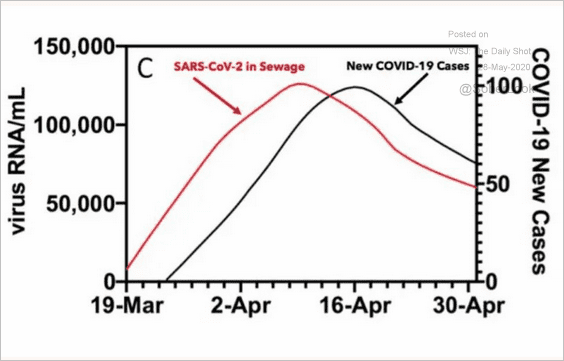 Source: @adam_tooze, @FT Read full article
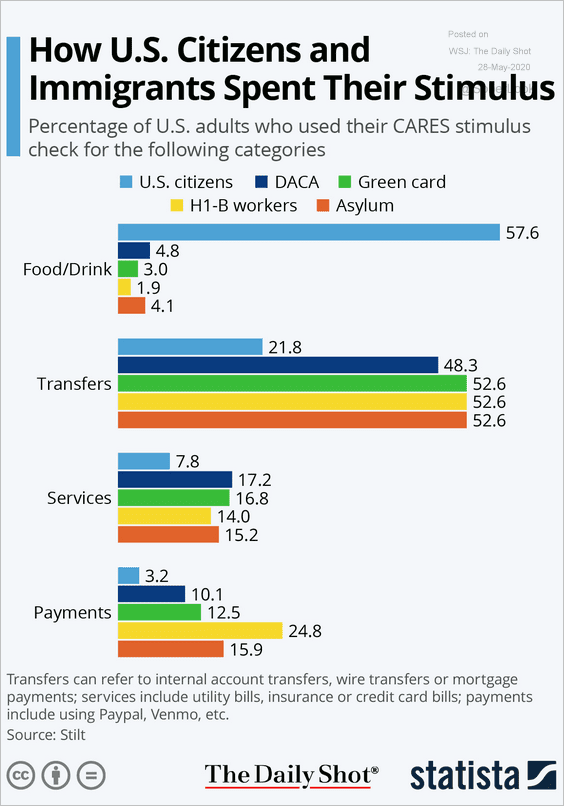
5. How US citizens and immigrants spent their stimulus (data from Stilt):
 Source: Statista
6. US polls on how different institutions handled the pandemic:
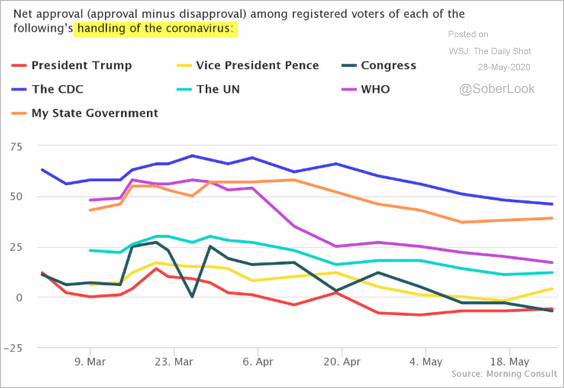 Source: Morning Consult Read full article
7. Investors’ confidence by party affiliation:
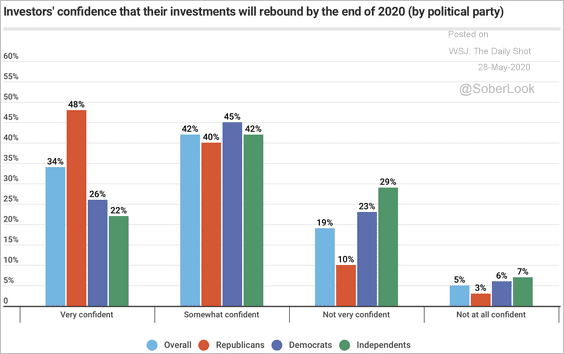 Source: MagnifyMoney Read full article
8. Face mask enforcement:
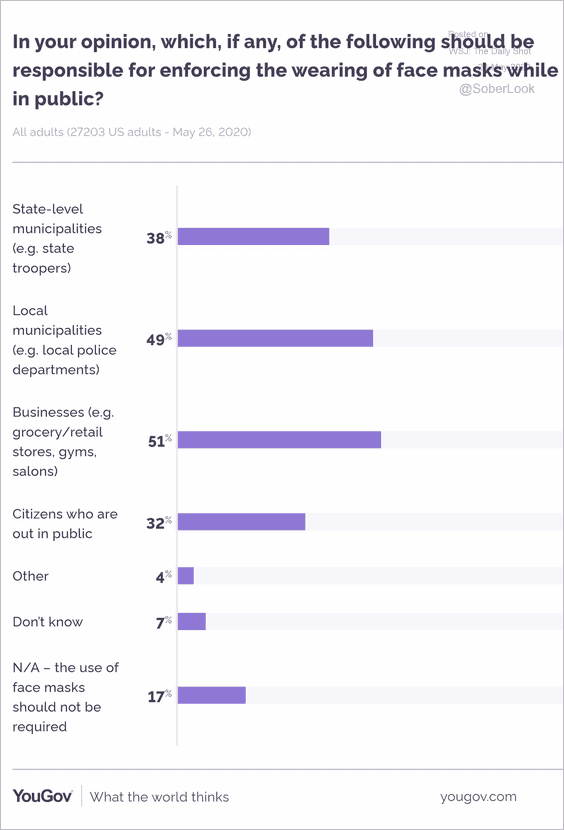 Source: YouGov Read full article
9. Podcasts:
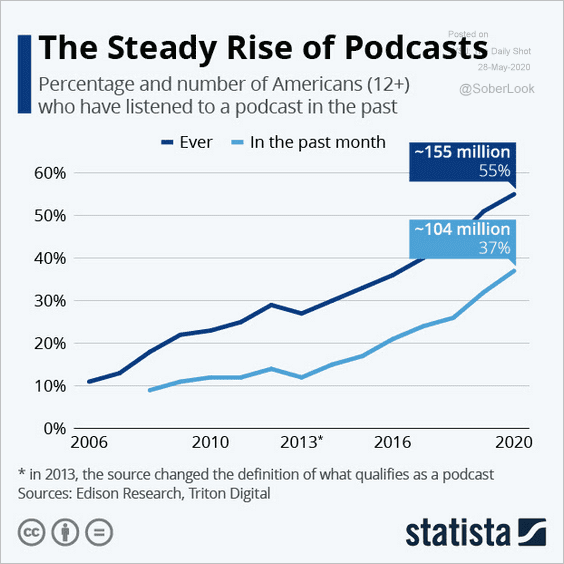 Source: Statista
——————–