
The Daily Shot: 02-Jun-20
• The United States
• Canada
• The United Kingdom
• The Eurozone
• Europe
• Asia – Pacific
• China
• Emerging Markets
• Cryptocurrency
• Commodities
• Equities
• Credit
• Rates
• Global Developments
• Food for Thought
The United States
1. The ISM Manufacturing PMI report showed a modest improvement in May, but factory activity remains in contraction territory (PMI < 50).
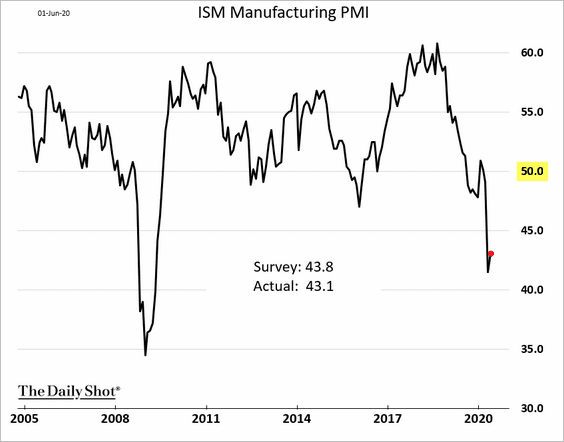
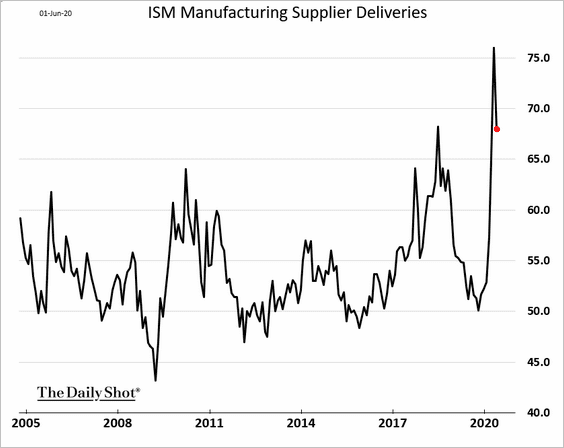
Moreover, the headline index (above) is still understating the manufacturing sector’s weakness by treating supply chain disruptions (chart below) as an indicator of strong demand.
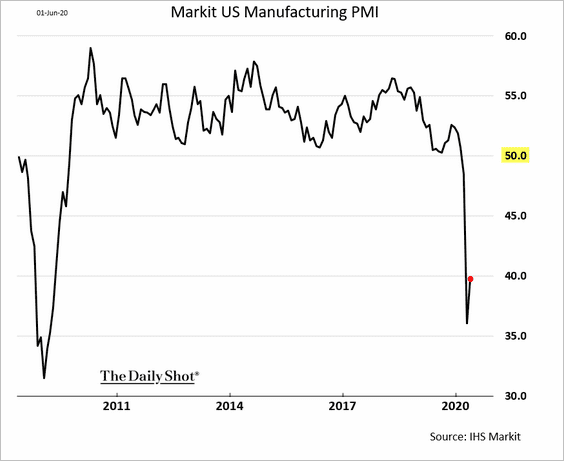
The updated Markit Manufacturing PMI confirmed the extreme weakness in the ISM report.
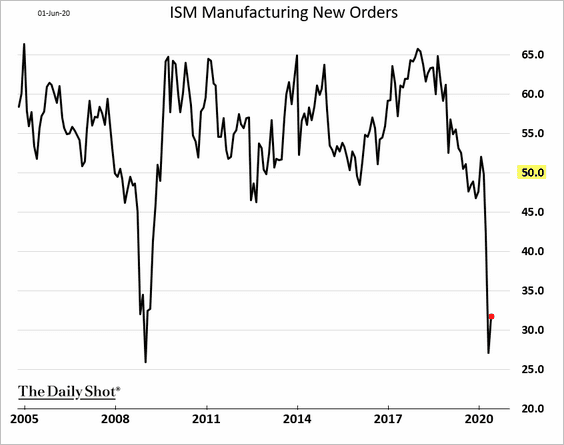
Below are several components of the ISM index.
• New orders:
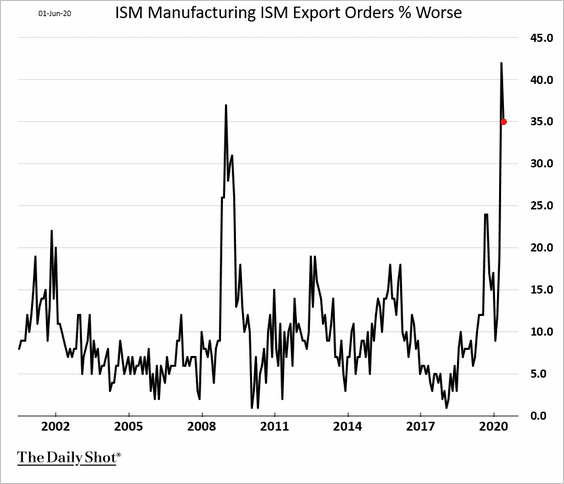
• Percentage of factories experiencing deteriorating export orders:
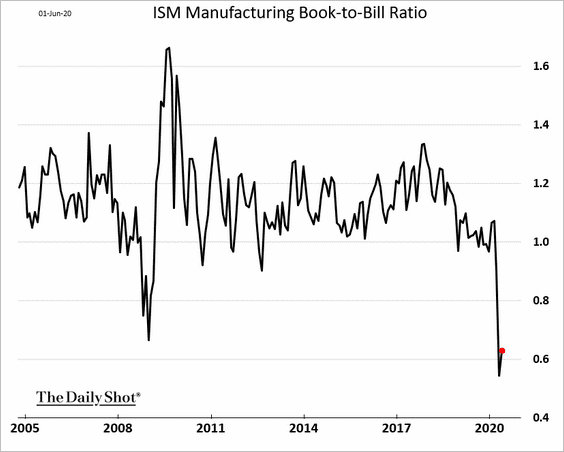
• Book-to-bill ratio:
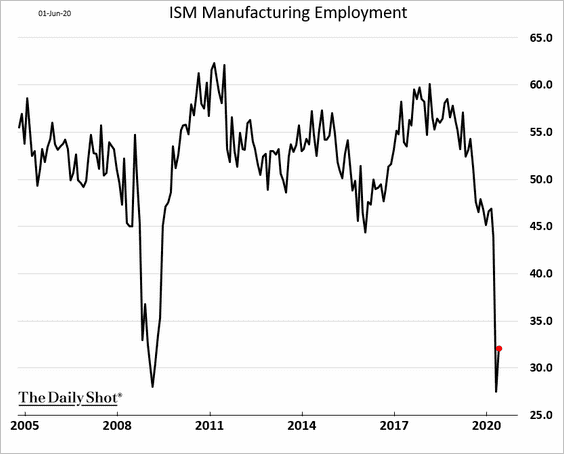
• Employment:
——————–
2. The collapse in manufacturing orders (above) points to a sharp deterioration in investment.
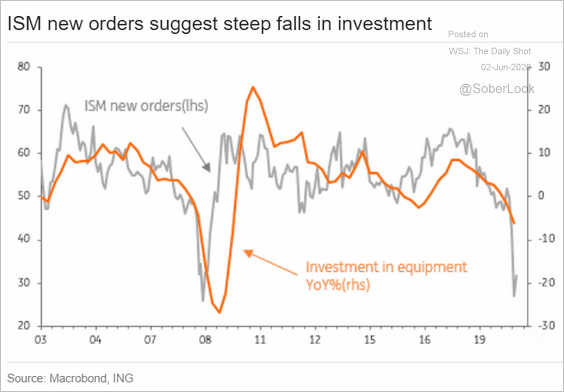 Source: ING
Here is Goldman’s CapEx tracker.
![]() Source: Goldman Sachs
Source: Goldman Sachs
——————–
3. The April construction spending decline wasn’t nearly as severe as economists expected.
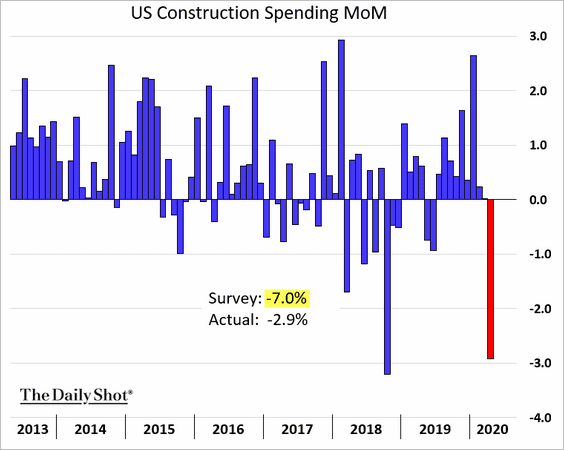
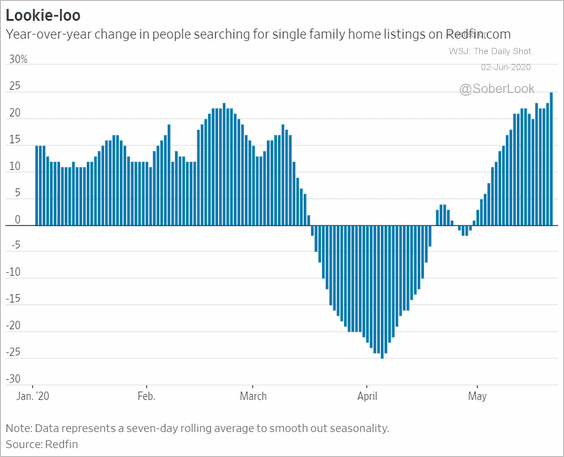
Housing demand has rebounded. Spooked by COVID-19, households are moving out of multifamily housing in cities into single-family homes in the suburbs. Near-record-low mortgage rates have also been a tailwind for the housing market.
 Source: @WSJ Read full article
——————–
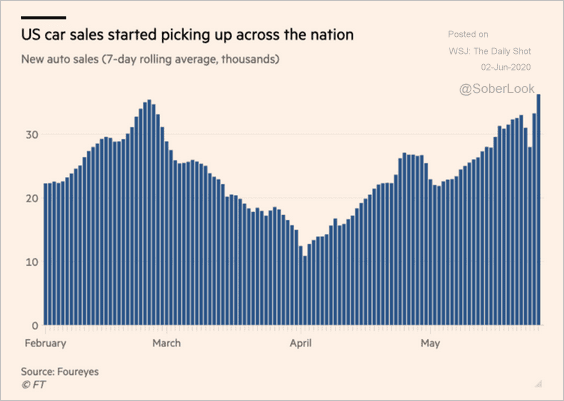
4. Auto sales have rebounded.
 Source: @financialtimes Read full article
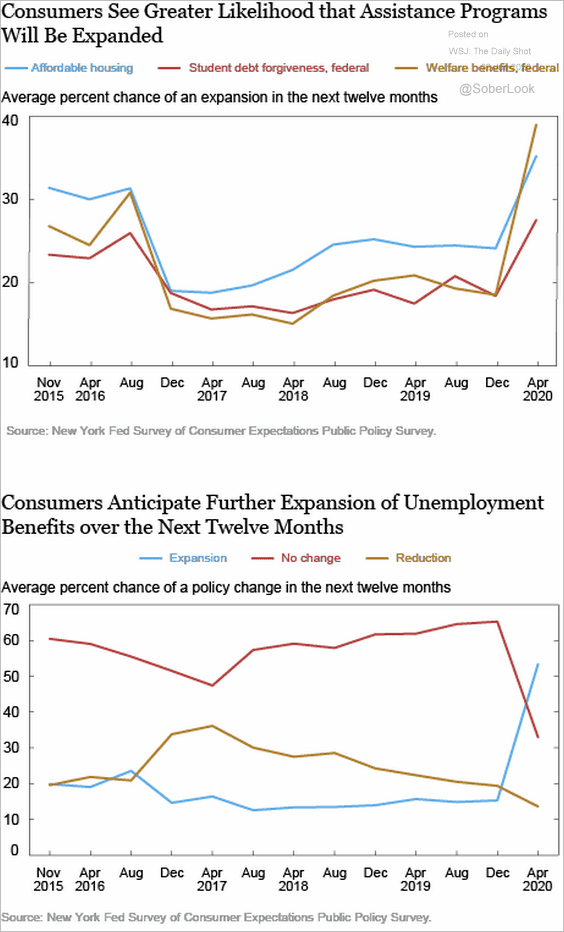
5. Americans expect additional government support in the months ahead.
 Source: Liberty Street Economics Read full article
6. In some regions/industries, it is more lucrative to keep the expanded unemployment benefits than to return to work.
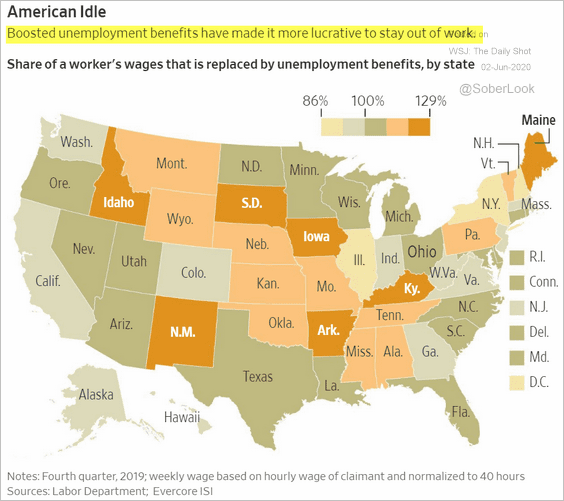 Source: @WSJ Read full article
7. Despite the government checks, many households have been tapping their savings to pay bills.
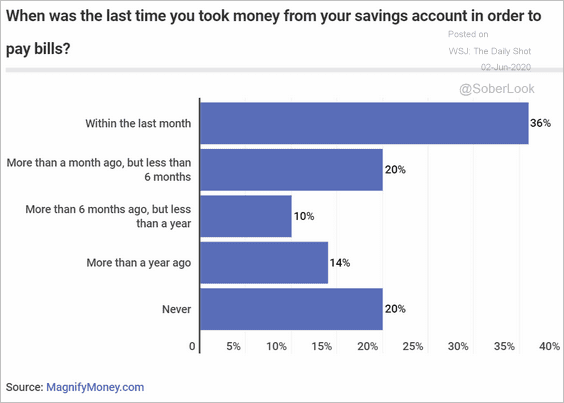 Source: MagnifyMoney Read full article
8. When will consumers feel comfortable resuming the following activities?
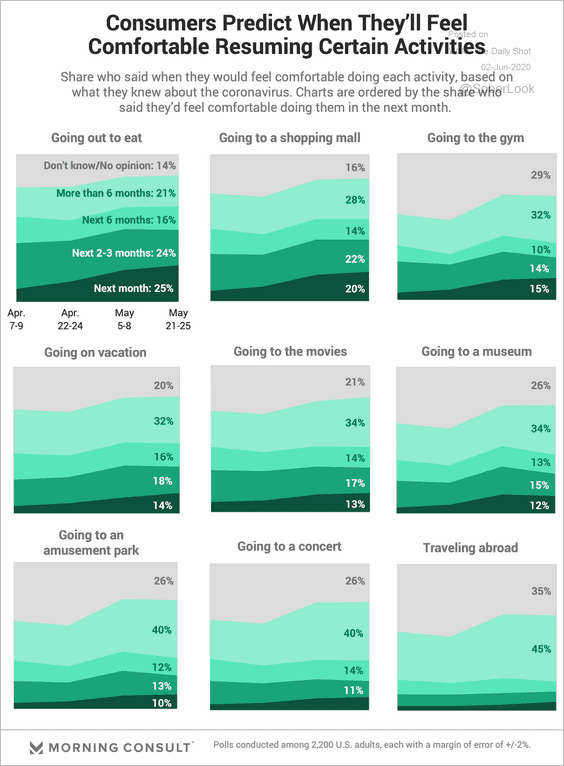 Source: Morning Consult Read full article
9. Many small businesses are not paying the full rent.
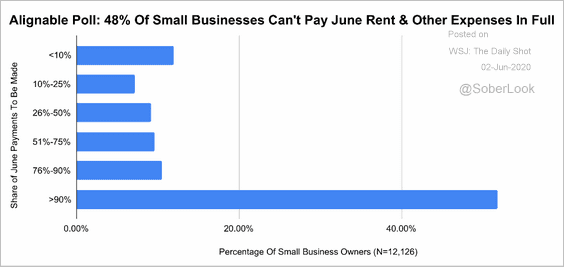 Source: Alignable.com
10. Below is a forecast for the GDP trajectory from Yardeni Research. It may be a while before we see the 2019 highs again.
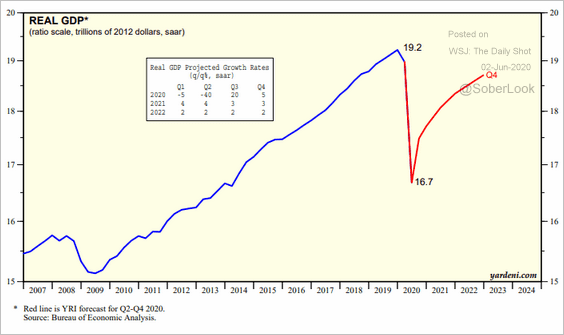 Source: Yardeni Research
Here is the cumulative adjustment to the CBO’s ten-year GDP projections between January and May of this year.
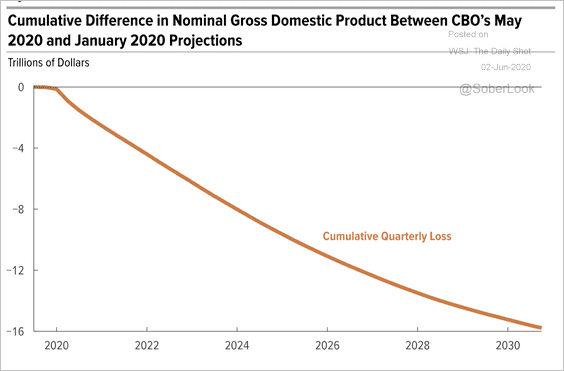 Source: CBO Read full article
——————–
11. This chart shows the US COVID-19 progress increasingly falling behind Italy for this phase in the cycle (discussed here).
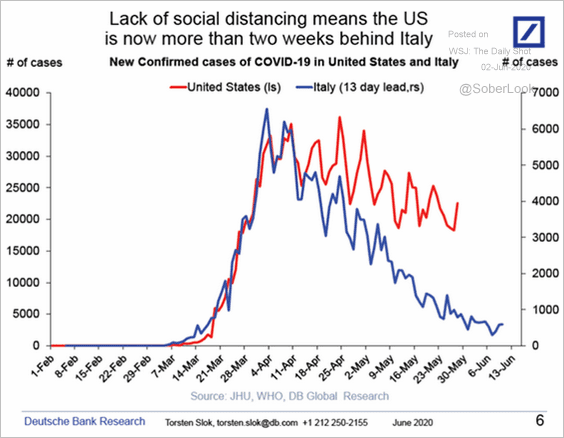 Source: Deutsche Bank Research
Canada
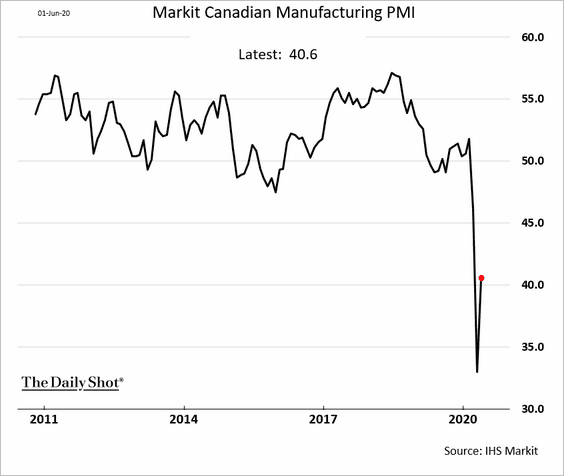
1. The Markit Manufacturing PMI showed some improvement in May.
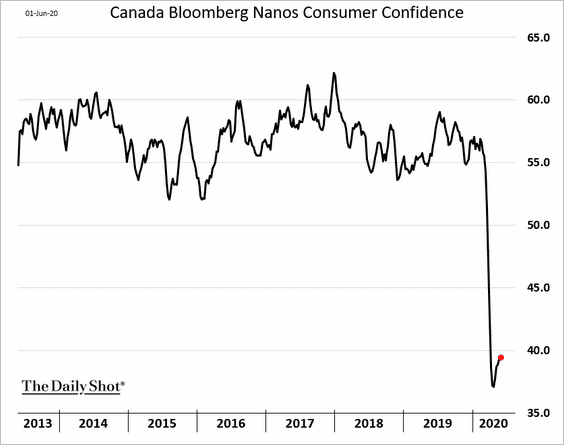
2. The rebound in consumer confidence is stalling.
3. According to Scotiabank, government stimulus has more than offset households’ loss of employment income.
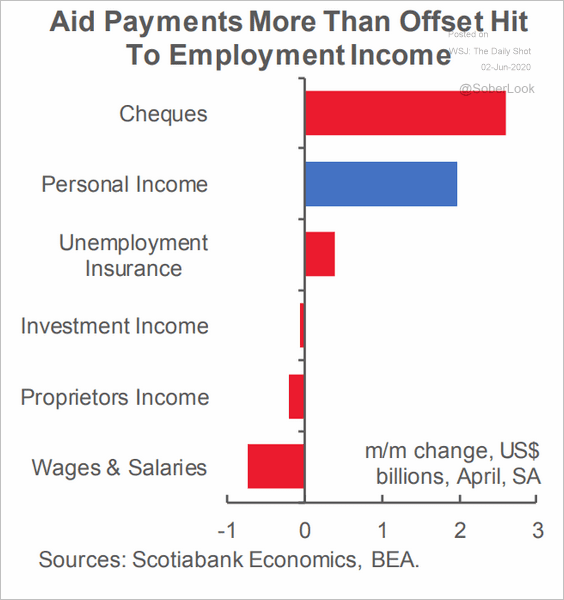 Source: Scotiabank Economics
The United Kingdom
1. Unlike the Fed, the BoE’s policy accommodation has been similar to previous cycles. Analysts expect the central bank to unveil more stimulus.
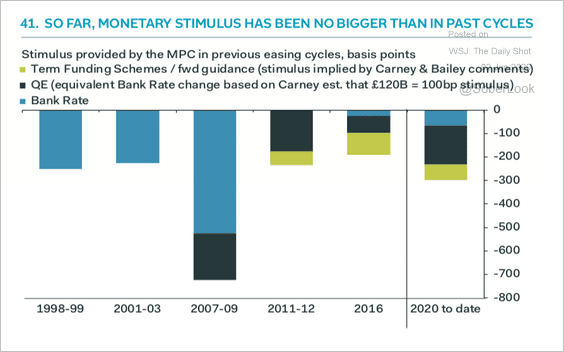 Source: Pantheon Macroeconomics
2. The UK is phasing out coal.
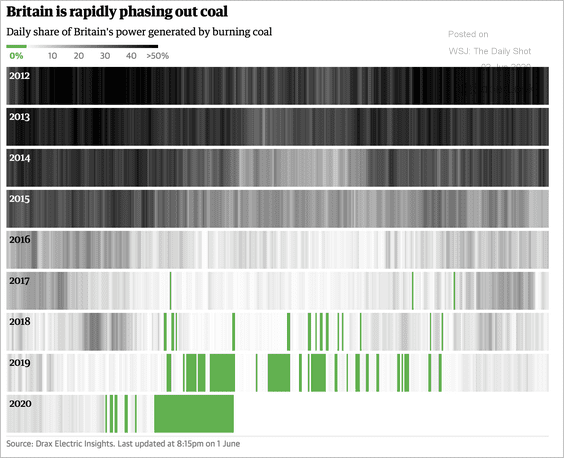 Source: The Guardian Read full article
The Eurozone
1. Italian and Spanish manufacturing PMI improvements in May topped economists’ forecasts.
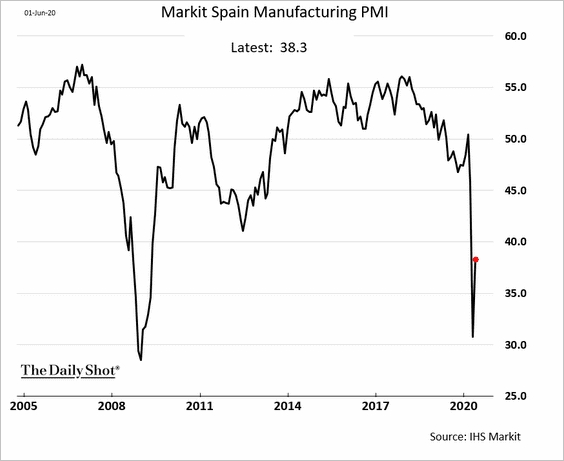
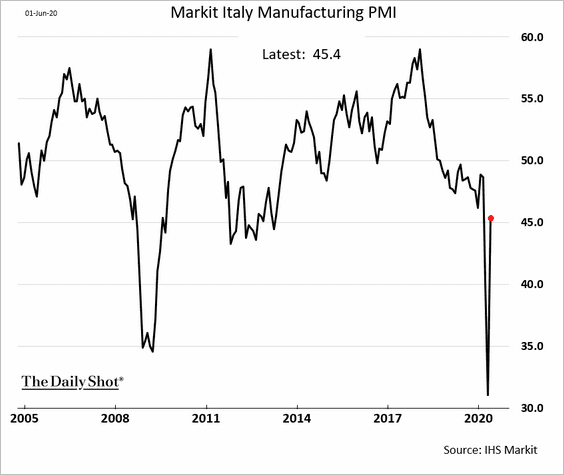
However, the updated May PMI for Germany showed little improvement since April.
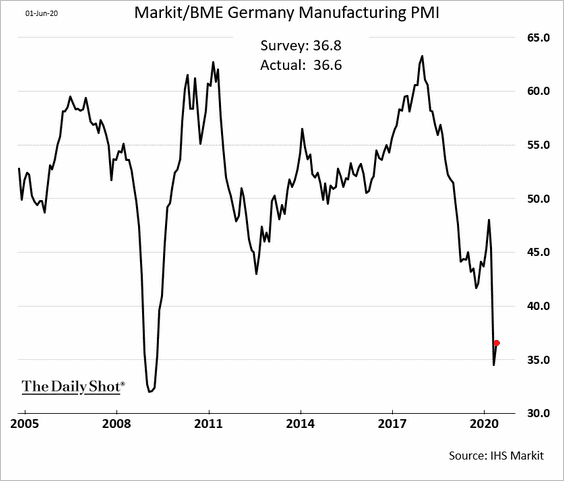
The gains in European PMIs relative to the US bode well for EUR/USD.
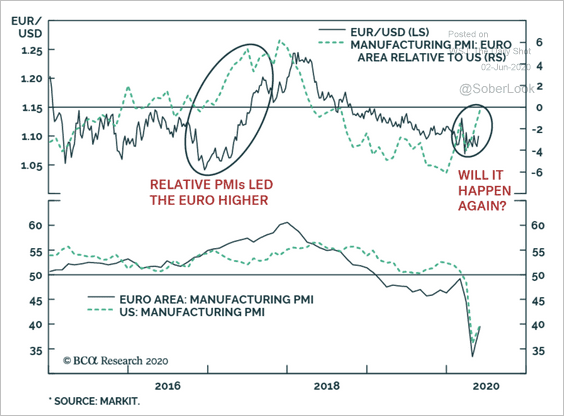 Source: BCA Research
——————–
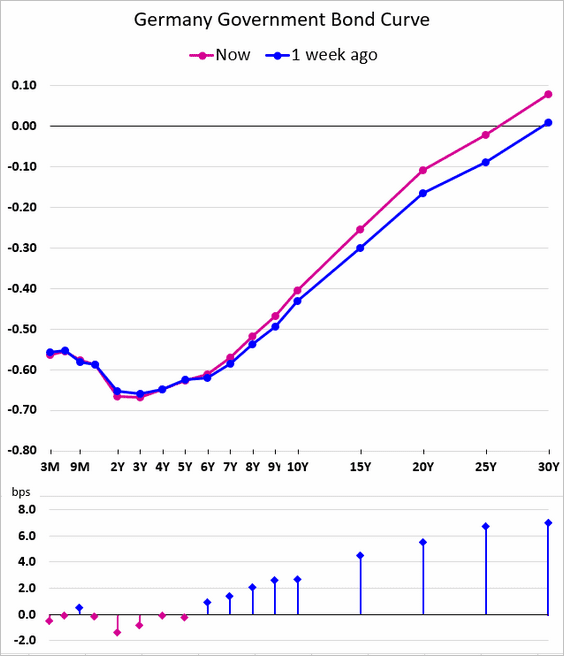
2. Germany’s yield curve has steepened in recent days as the government readies substantial fiscal stimulus.
 Source: Reuters Read full article
——————–
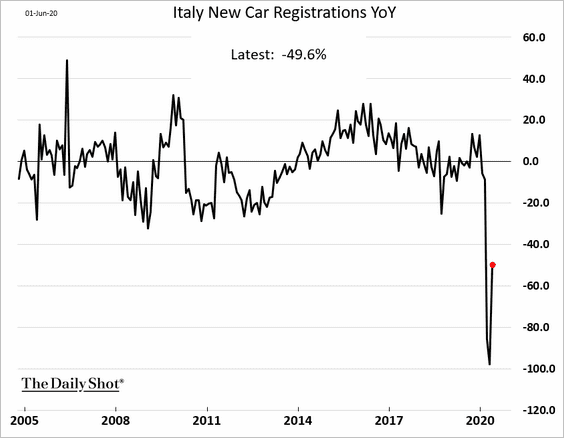
3. Italian new car registrations rose sharply in May but remain 50% below last year’s levels.
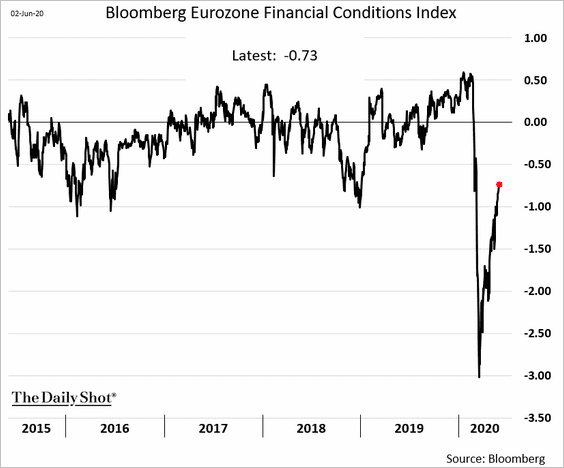
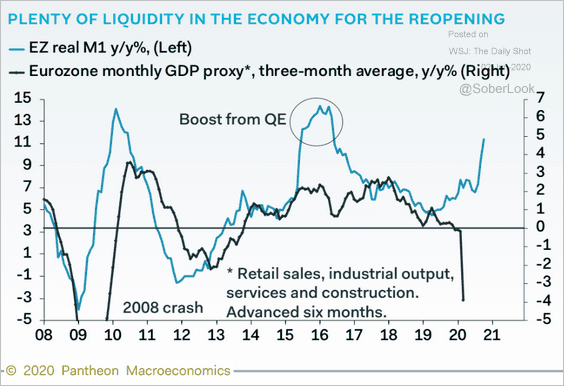
4. The Eurozone’s financial conditions continue to improve as the economy is flooded with liquidity (2nd chart).
 Source: Pantheon Macroeconomics
——————–
5. The probability of a euro break-up has fallen, signifying a drop in peripheral bond spreads.
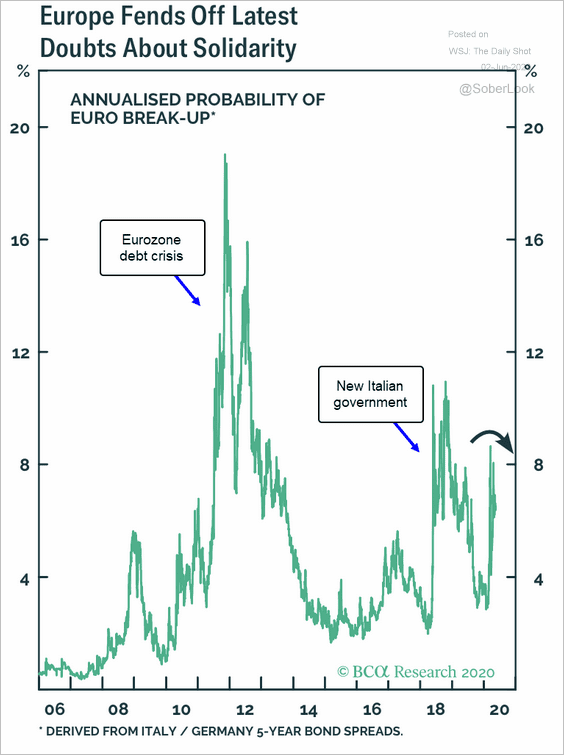 Source: BCA Research
6. The ECB has been aggressive.
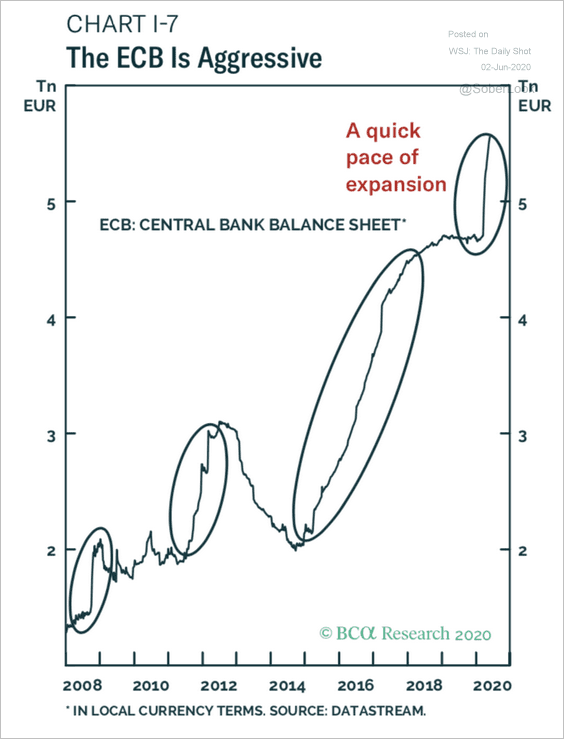 Source: BCA Research
And economists think there is more stimulus on the way.
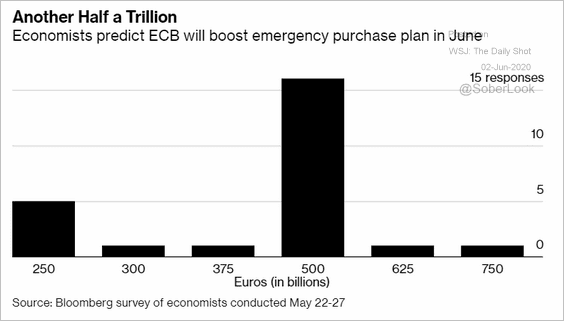 Source: @markets Read full article
Europe
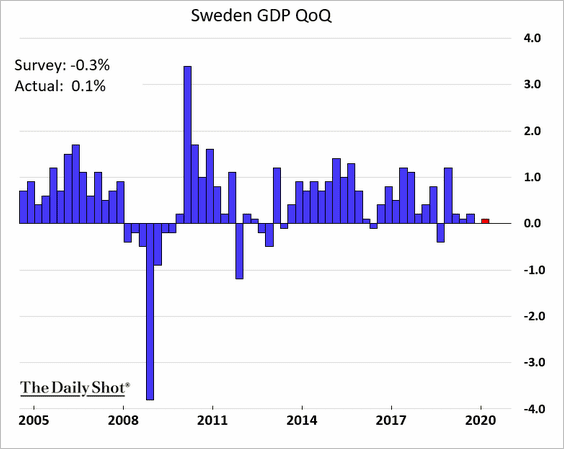
1. Let’s begin with Sweden.
• The Q1 GDP growth was substantially better than forecasts.
• The May uptick in manufacturing activity was disappointing, as factories continue to struggle.
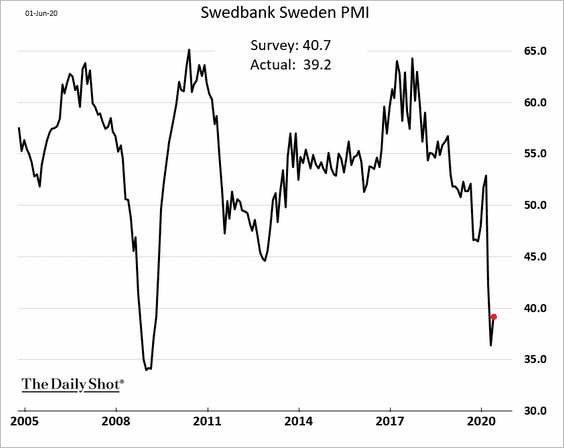
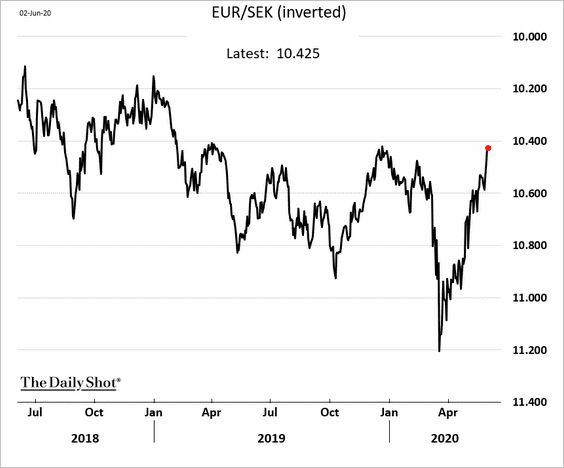
• The Swedish krona has fully rebounded from the crisis selloff.
——————–
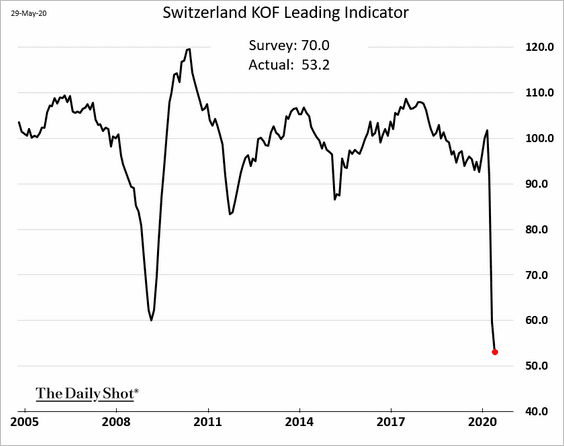
2. Switzerland’s index of leading economic indicators hit a record low in May.
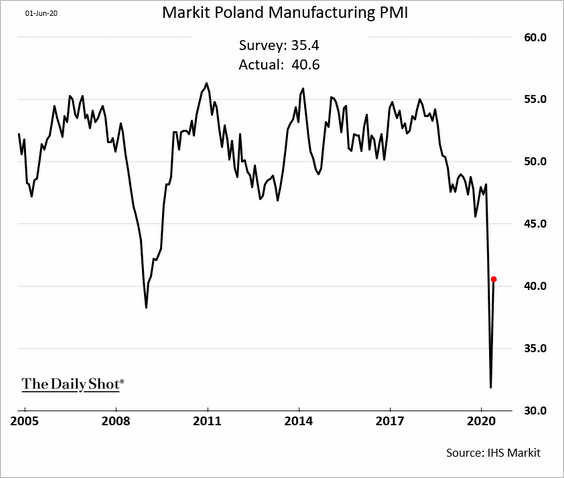
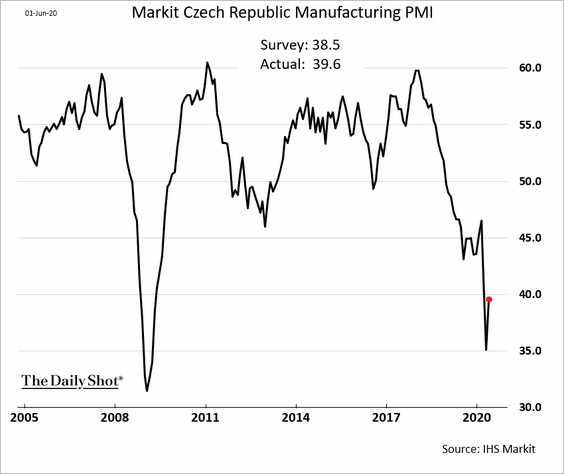
3. Central European manufacturing PMI indicators saw some improvements in May. But activity remains in contraction territory.
• Poland:
• The Czech Republic
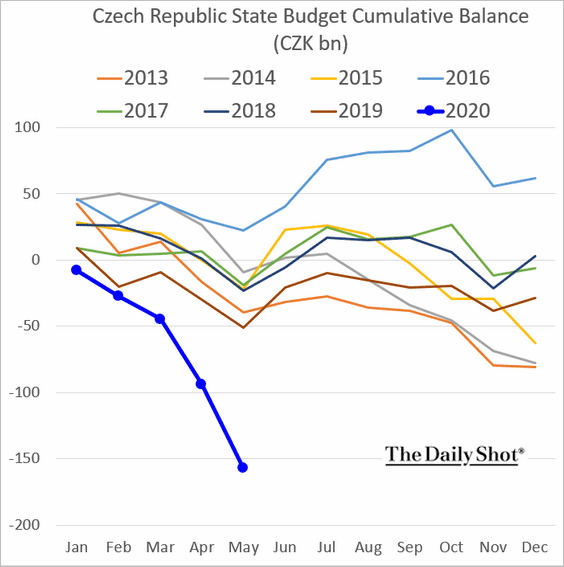
By the way, the Czech government has blown out its budget.
Asia – Pacific
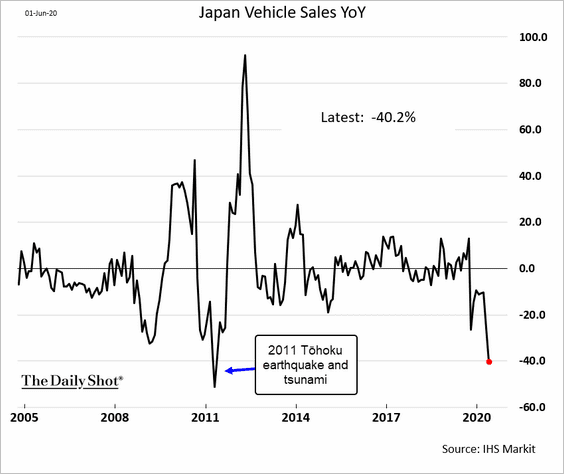
1. Japan’s May vehicle sales were down 40% from a year ago.
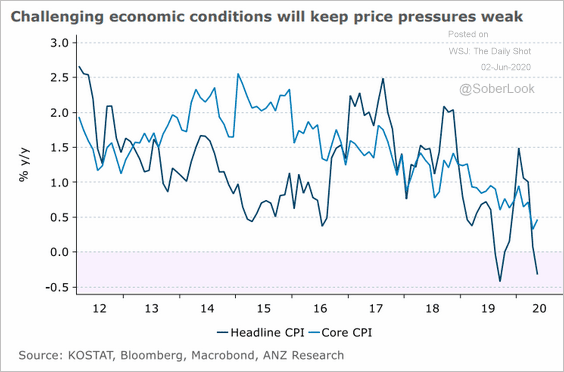
2. South Korea’s headline CPI is back in negative territory.
 Source: ANZ Research
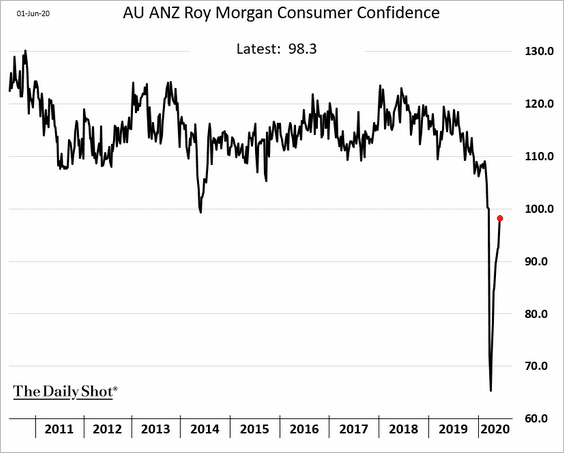
3. Australia’s consumer confidence is rebounding quickly.
China
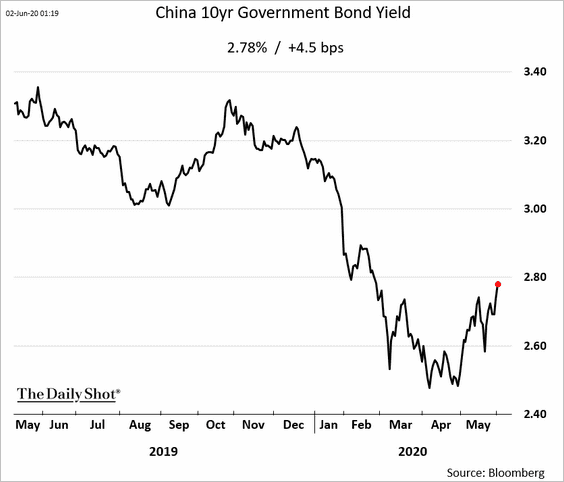
1. The selloff in long-term government bonds continues.
2. This chart shows the IPO volume for Chinese companies by exchange.
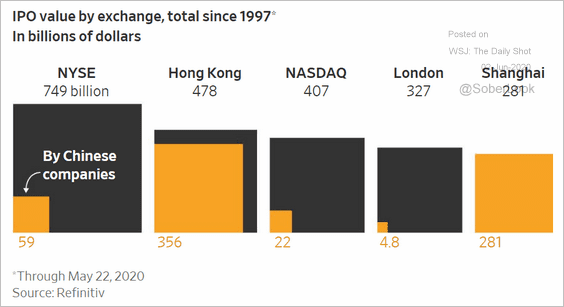 Source: @WSJ Read full article
3. Many EM economies owe China money.
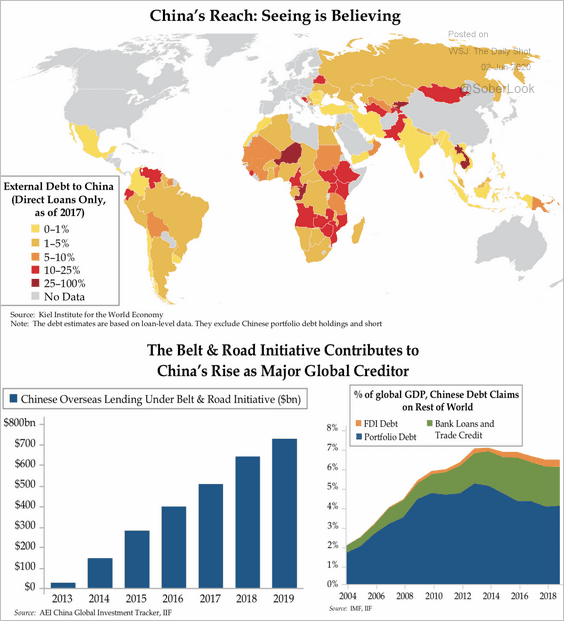 Source: Quill Intelligence
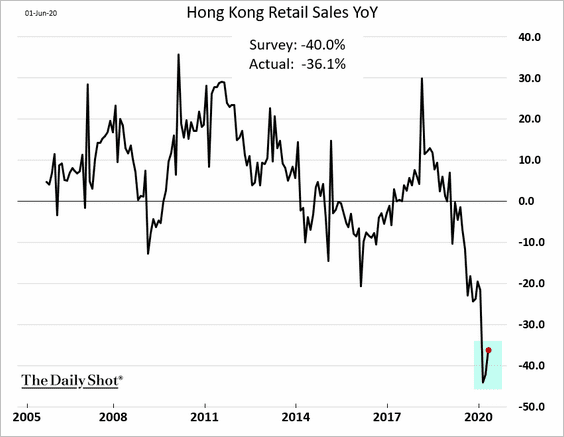
4. Hong Kong’s retail sales bounced from the lows.
Emerging Markets
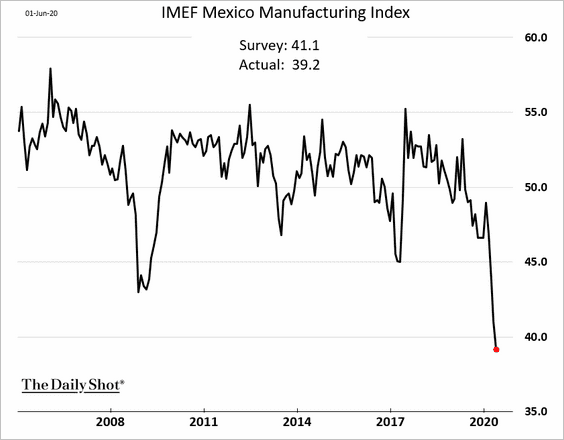
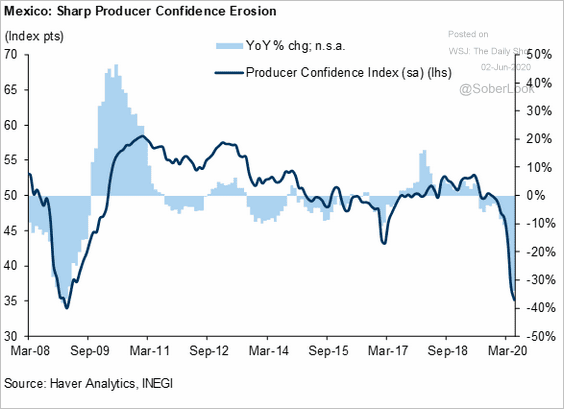
1. Let’s begin with Mexico.
• Manufacturing activity deteriorated further in May.
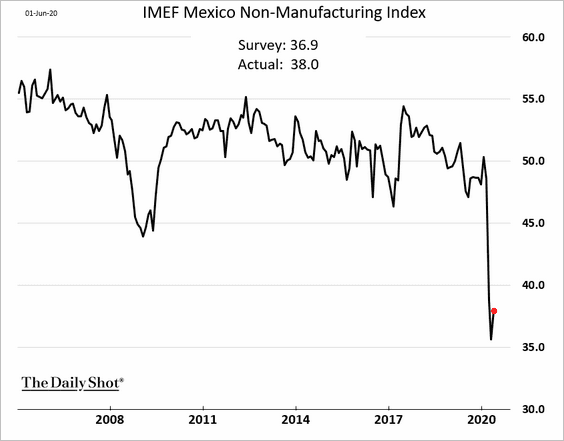
• The contraction in services eased slightly, but the situation is still far worse than what we saw during the financial crisis.
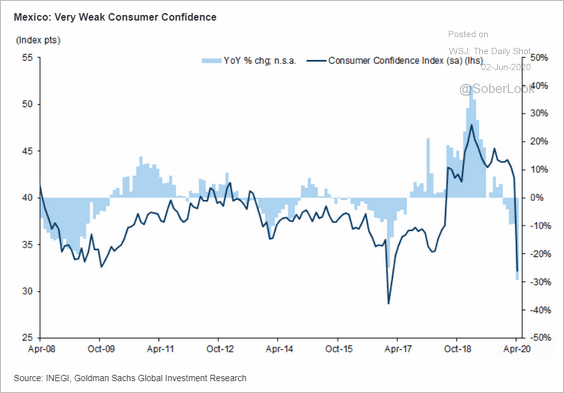
• Consumer and producer confidence remains extremely weak.
 Source: Goldman Sachs
 Source: Goldman Sachs
——————–
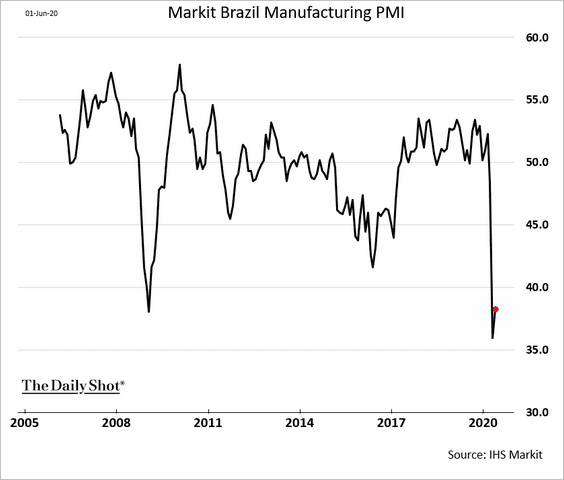
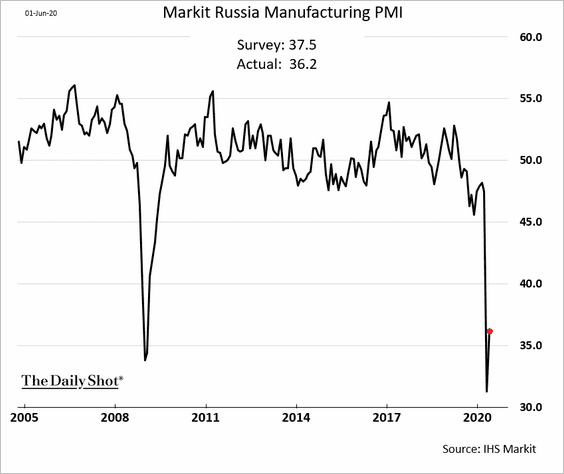
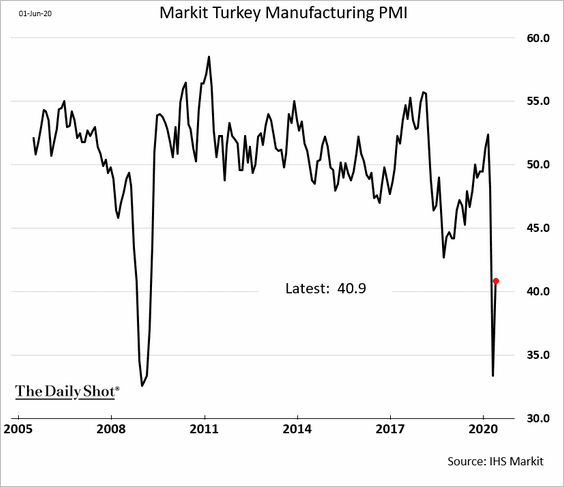
2. Most EM manufacturing PMI indicators saw some improvements in May.
• Brazil (still near record lows):
• Russia:
• Turkey:
——————–
3. Here is Chile’s economic activity ex. mining (through April).
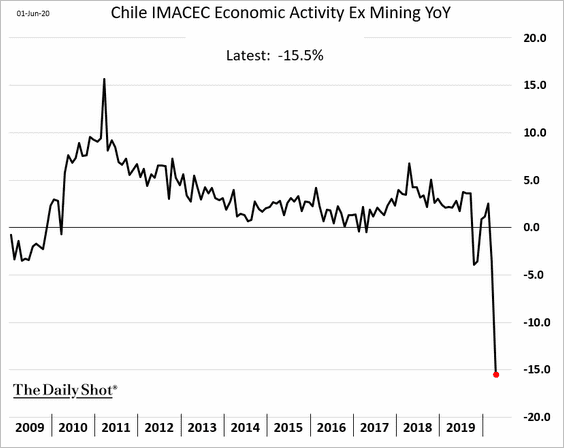
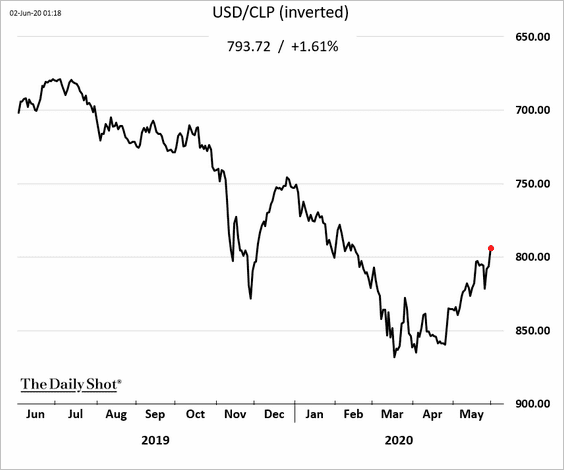
The Chilean peso is recovering.
——————–
4. Moody’s downgraded India’s government debt.
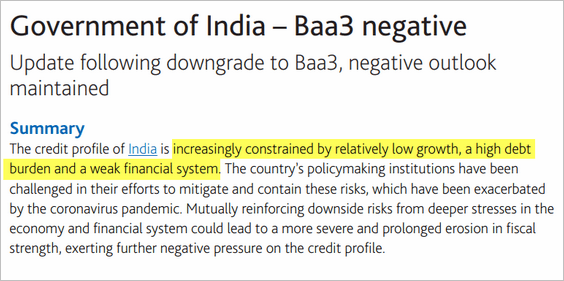 Source: Moody’s Investors Service Read full article
Cryptocurrency
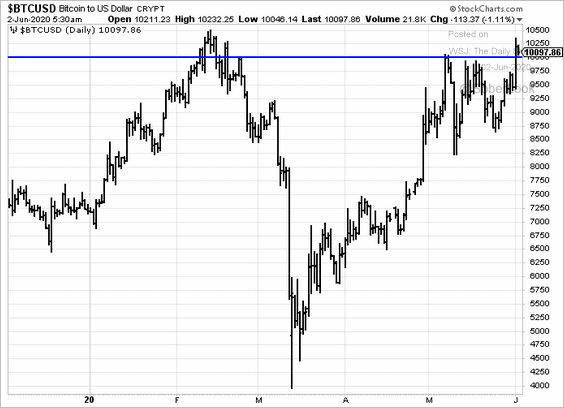
1. Bitcoin is testing the $10k resistance again.
2. According to Goldman Sachs, “cryptocurrencies, including Bitcoin, are not an asset class — they do not generate cash flow or earnings and do not provide consistent diversification benefits. Nor is there evidence they are an inflation hedge …”
The Dutch tulip bubble chart is back.
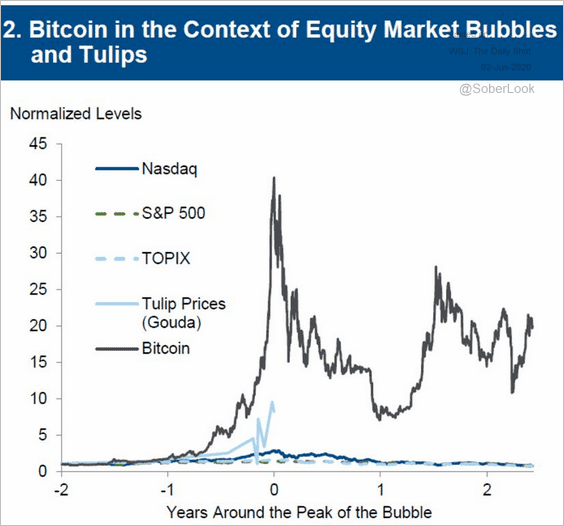 Source: Goldman Sachs, @technology Read full article
Commodities
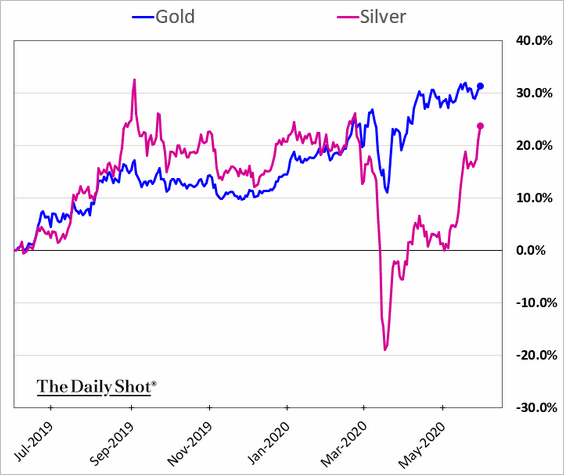
1. Silver has experienced a dramatic rebound from the March lows.
2. Copper, gold, and zinc miners have cut back on capital expenditures over the past eight years.
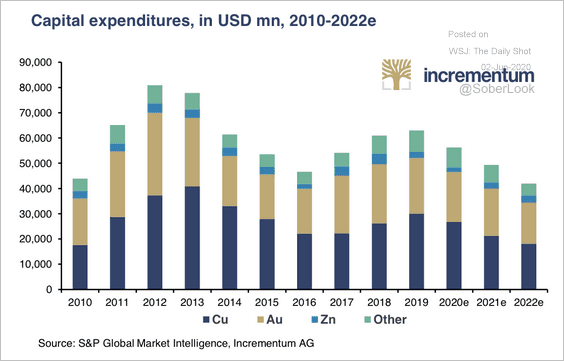 Source: Incrementum
3. Relative to the Dow Jones Index, commodities are currently trading at the lowest valuation level since the mid-1960s.
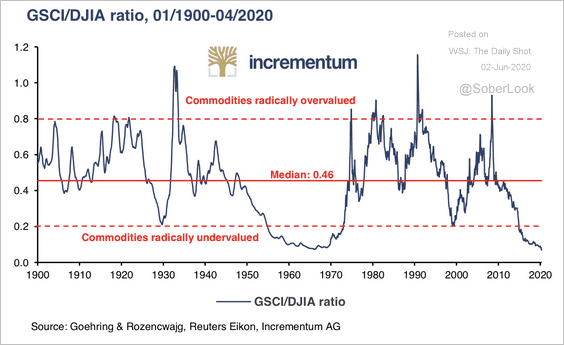 Source: Incrementum
4. US meat prices are reversing some of the coronavirus-driven gains.
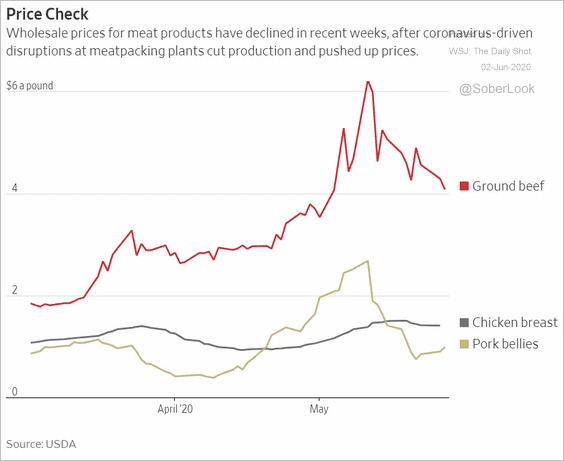 Source: @WSJ Read full article
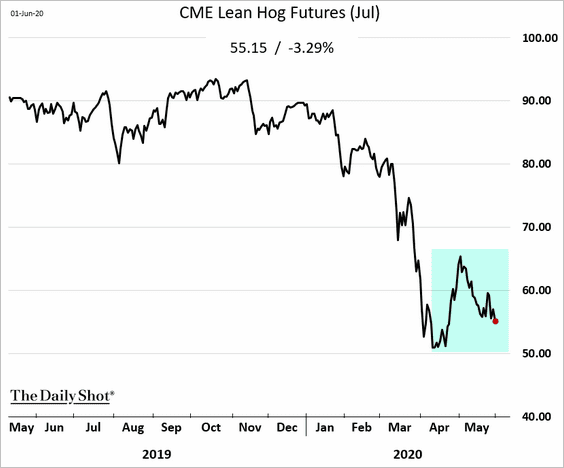
This chart shows the active CME lean hogs futures contract.
Equities
1. The percentage of S&P 500 members that are trading above the 50-day moving average is the highest in nearly three decades.
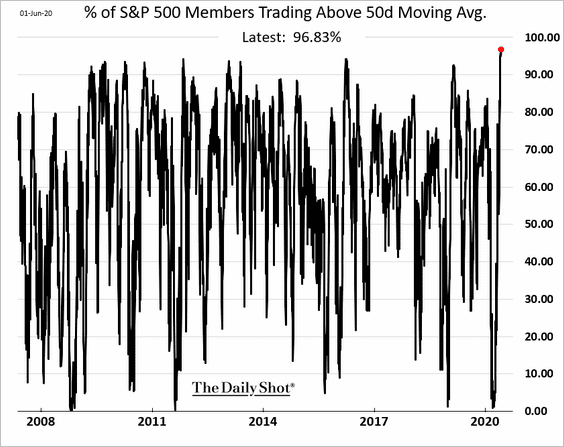
Historically, such high-breadth rallies kept going.
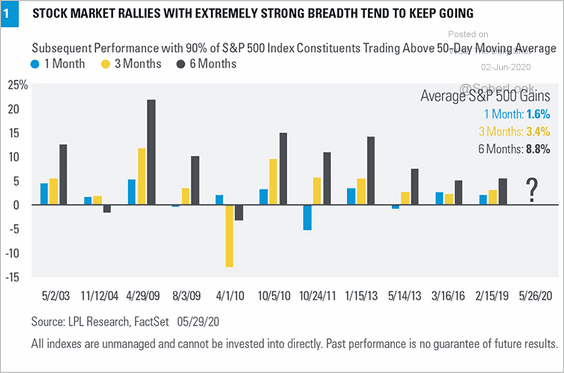 Source: LPL Research
——————–
2. Investors’ equity allocations remain relatively low.
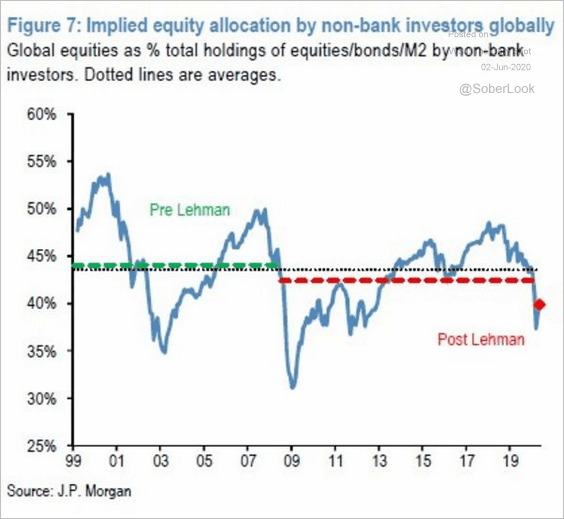 Source: JP Morgan, @markets Read full article
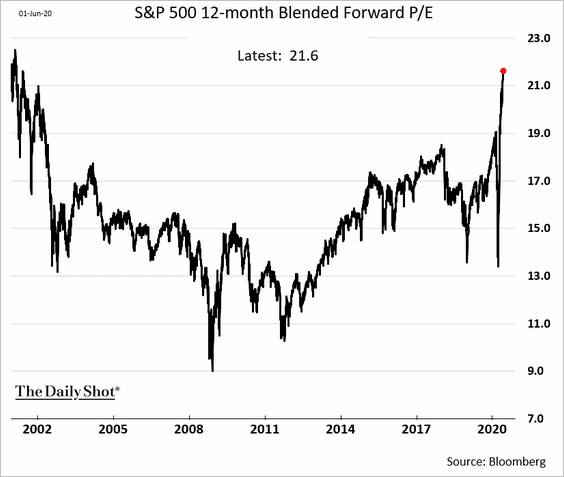
2. Here is the S&P 500 12-month forward P/E ratio over the past couple of decades.
4. Greed is back, according to the CNN Fear & Greed Index.
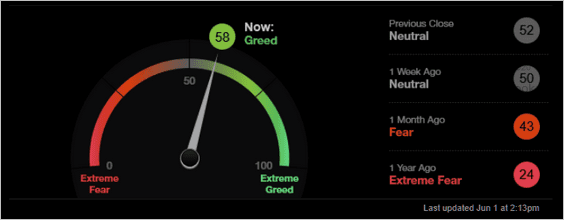 Source: @themarketear, CNN Business
5. This chart shows the total share buybacks for S&P 500 sectors announced over the past three months.
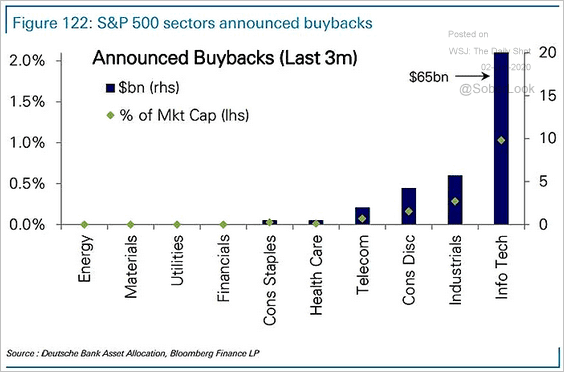 Source: @ISABELNET_SA, @DeutscheBank Read full article
6. Bear markets characterized by exogenous shocks tend to be shorter than average, according to BofA.
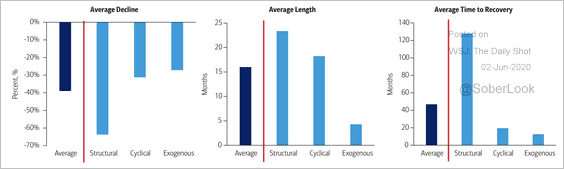 Source: BofA Merrill Lynch Global Research
7. The NASDAQ 100 index is approaching record highs.
 Source: @markets Read full article
8. The momentum factor tends to outperform during the late stage of the economic cycle.
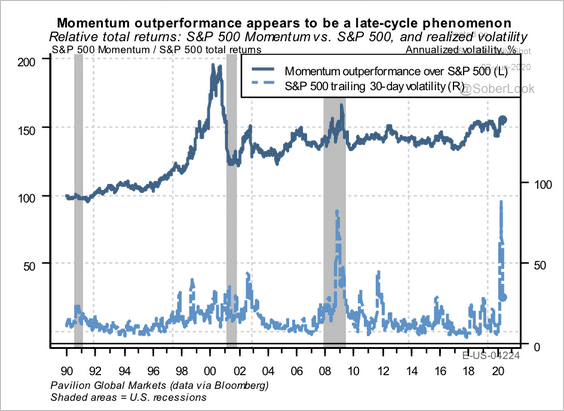 Source: Pavilion Global Markets
9. US technology and biotech stocks are outpacing the rest of the world.
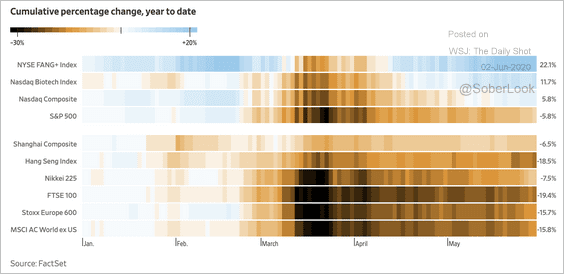 Source: @WSJ Read full article
Credit
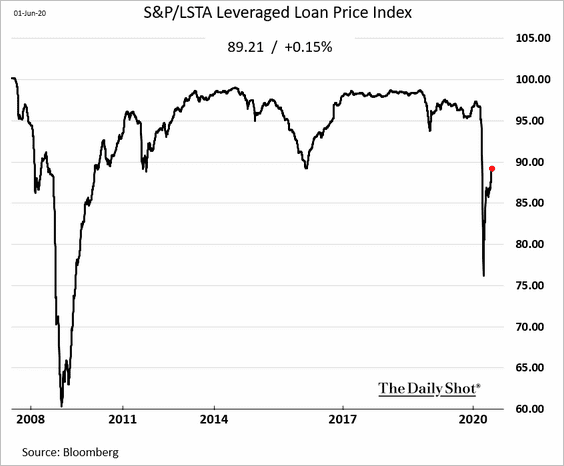
1. Leveraged loan prices continue to recover.
2. US energy-sector high-yield debt has continued to rally while the overall high-yield market’s total return has been flat for the past two months.
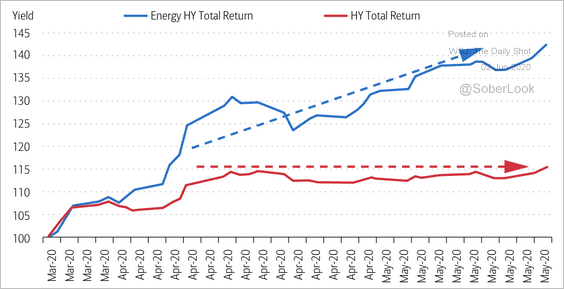 Source: BofA Merrill Lynch Global Research
Independent energy firms saw a significant drop in credit spreads relative to other industries over the past month.
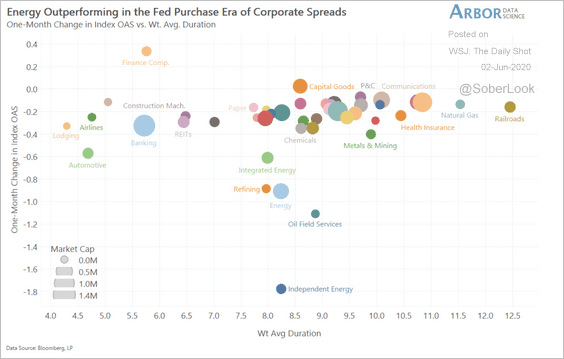 Source: Arbor Research & Trading
——————–
3. US cities face massive revenue shortfalls.
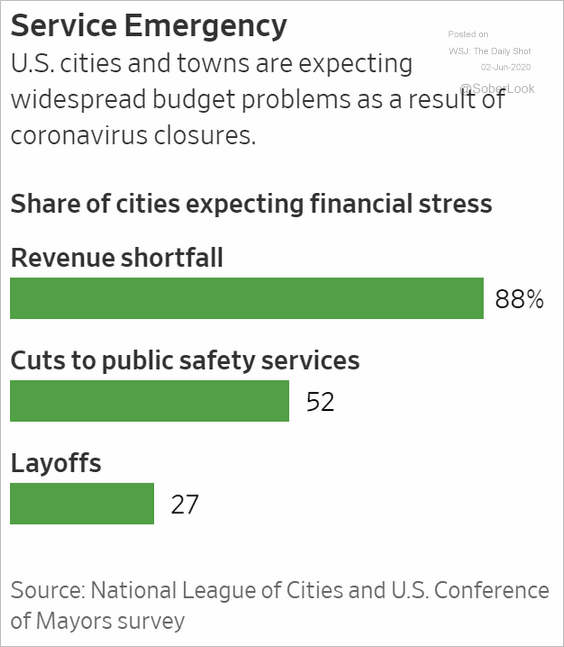 Source: @WSJ Read full article
Rates
1. The unprecedented growth in the US money supply continues.
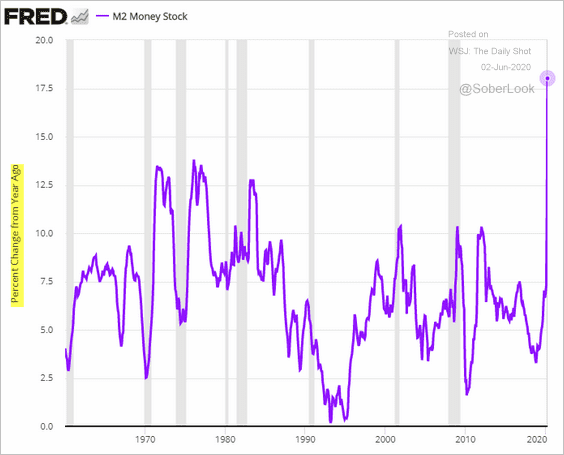
Here is the year-over-year change in checkable deposits.
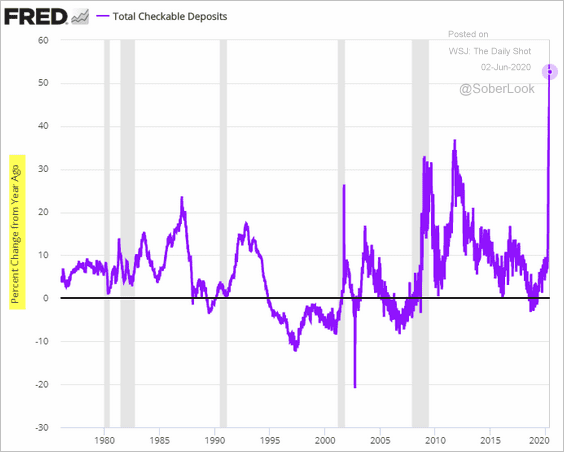
The M1 money supply growth tends to coincide with a steepening Treasury yield curve.
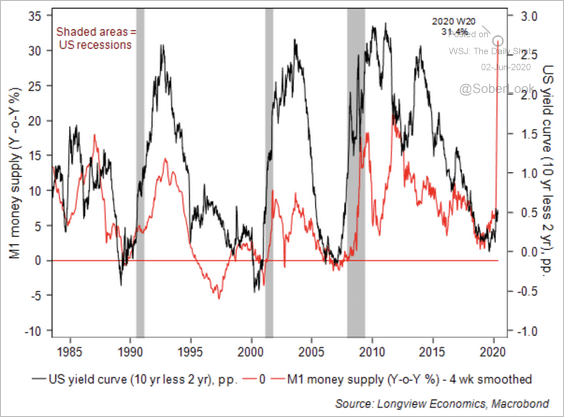 Source: Longview Economics
——————–
2. Foreign holdings of TIPS have grown steadily over the past decade and now represent over half of the market (ex Fed’s holdings).
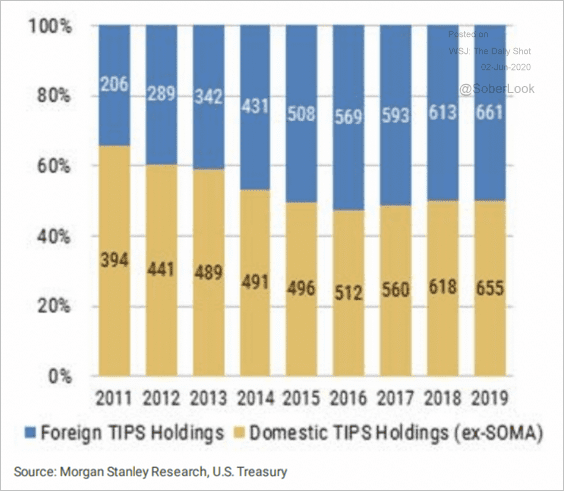 Source: Morgan Stanley Research
Global Developments
1. Let’s start with some updates on fiscal measures and public debt.
• $9 trillion of stimulus deployed:
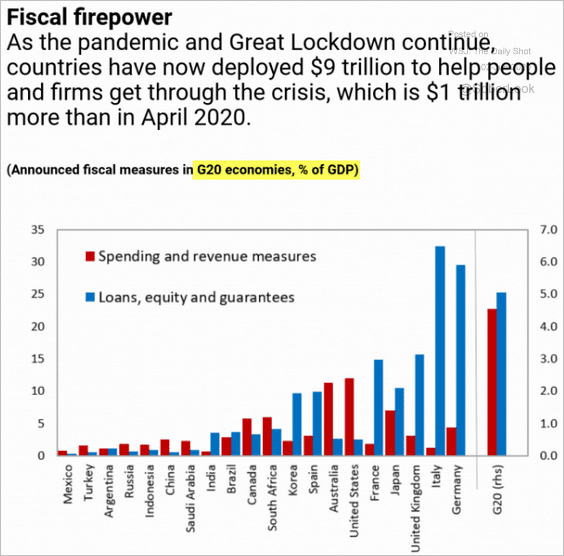 Source: @GitaGopinath, @IMFNews Read full article
• G4 and China fiscal deficit:
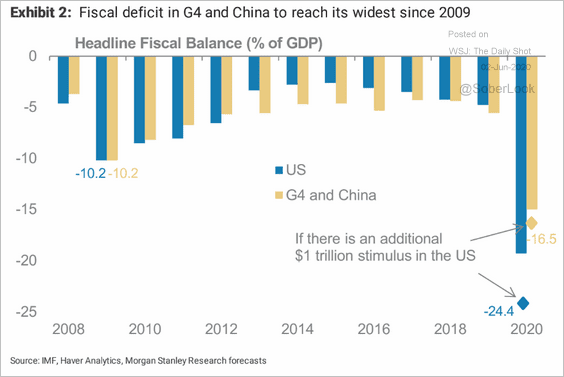 Source: Morgan Stanley Research
• Budget balances before the crisis:
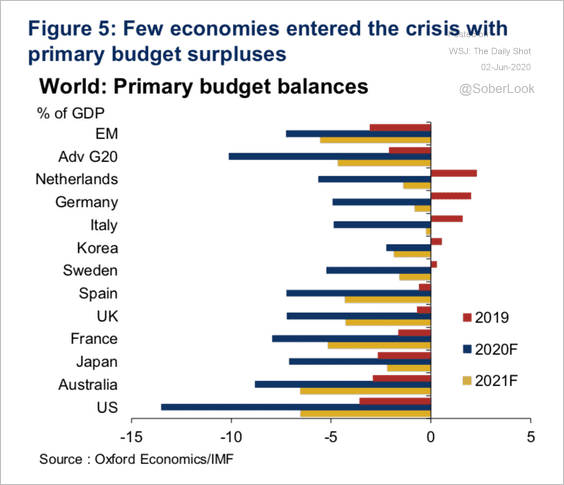 Source: Oxford Economics
• Projected debt levels (2 charts):
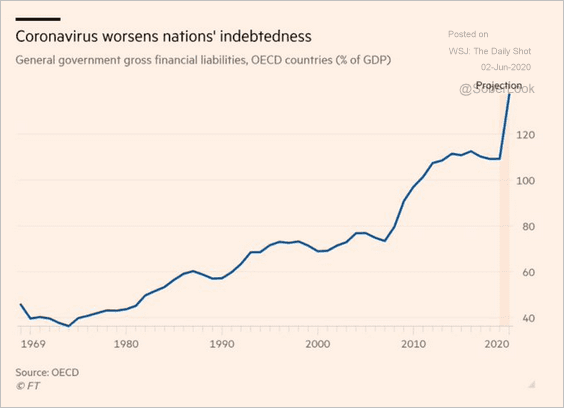 Source: @FT, @adam_tooze Read full article
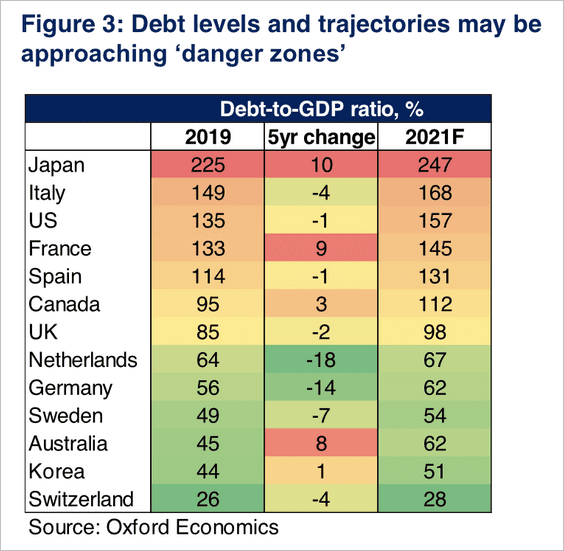 Source: Oxford Economics
• Fiscal policy scenarios from Oxford Economics:
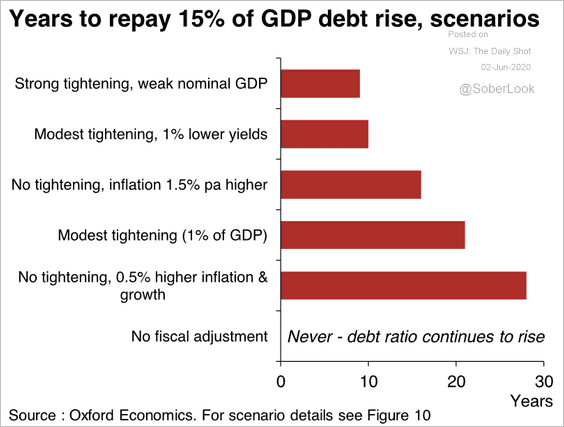 Source: Oxford Economics
——————–
2. Next, we have a couple of updates on the labor market.
• Projected unemployment rates:
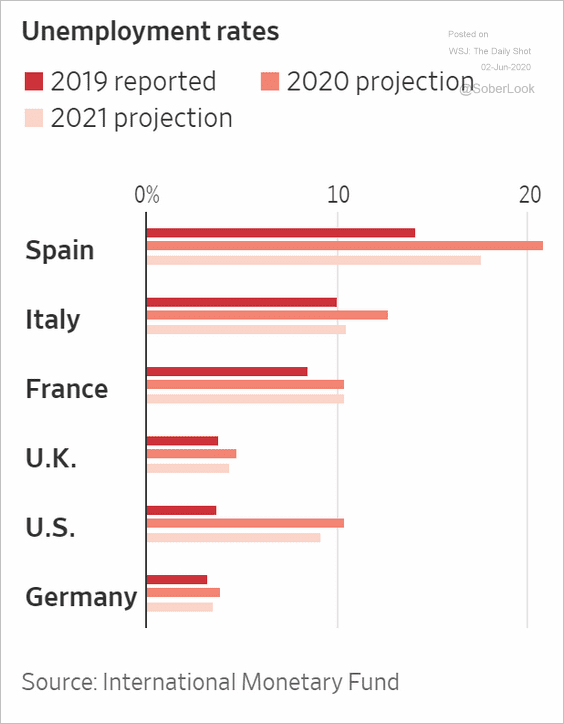 Source: @WSJ Read full article
• Unemployment benefits:
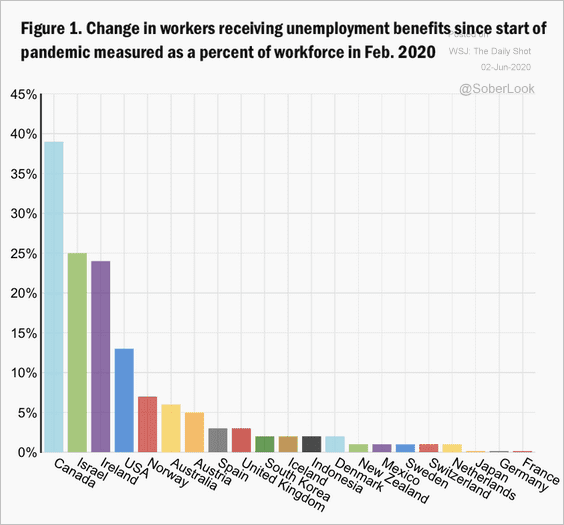 Source: The Brookings Institution Read full article
——————–
3. This chart shows productivity growth across OECD countries.
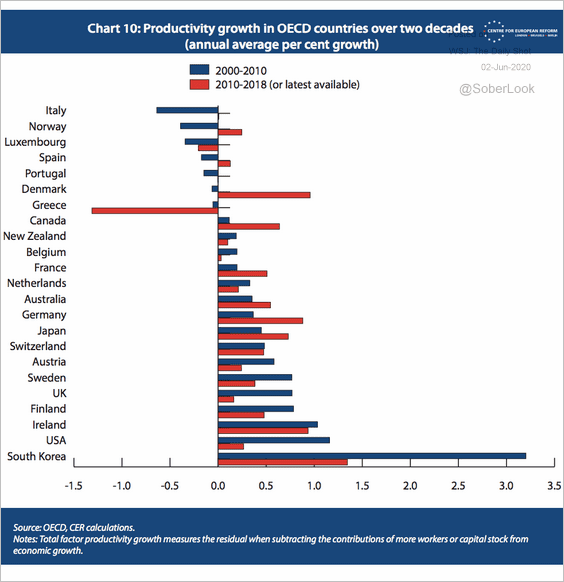 Source: Centre for European Reform Read full article
——————–
Food for Thought
1. Revenue from sports betting:
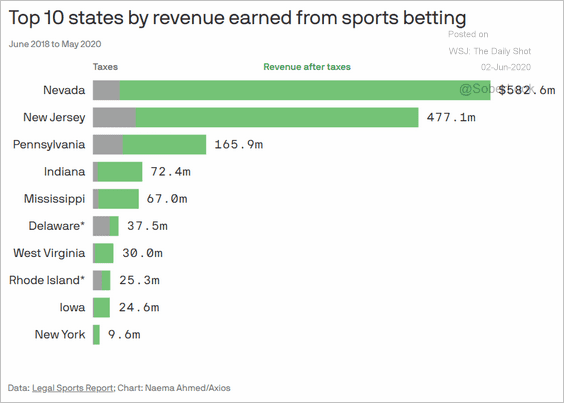 Source: @axios Read full article
2. The volume of mail in the US:
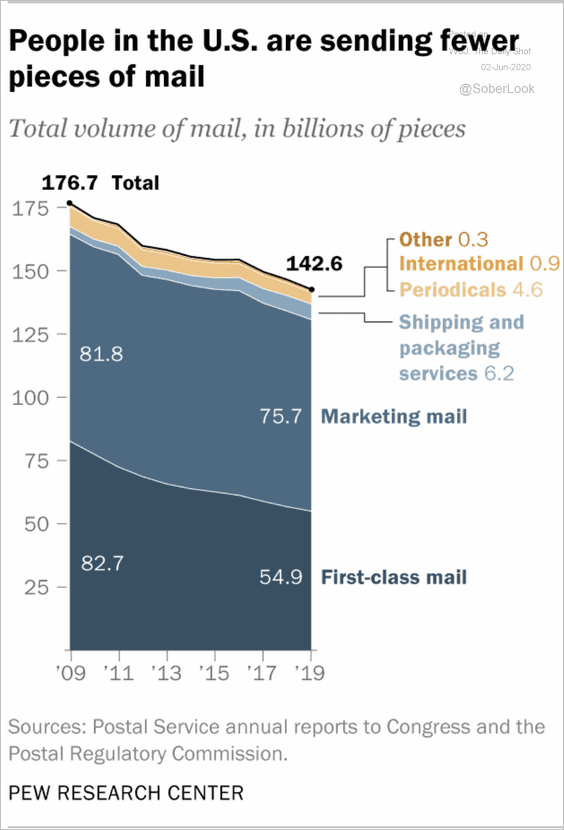 Source: Pew Research Center Read full article
3. Pantry/panic purchases (2 charts):
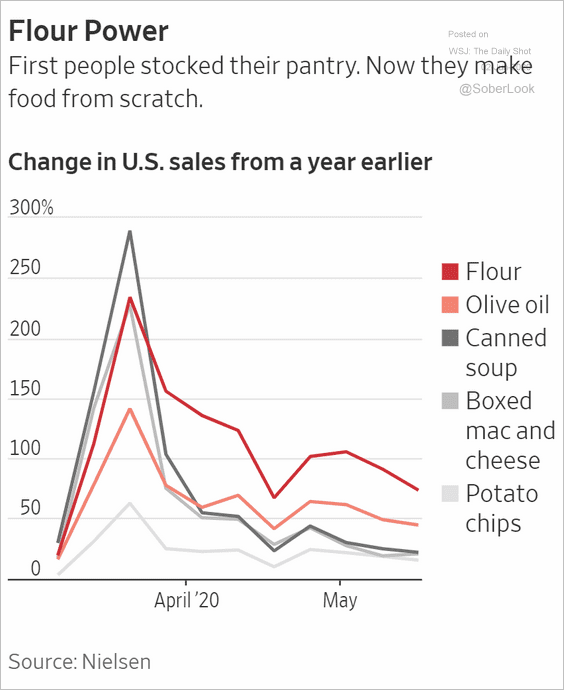 Source: @WSJ Read full article
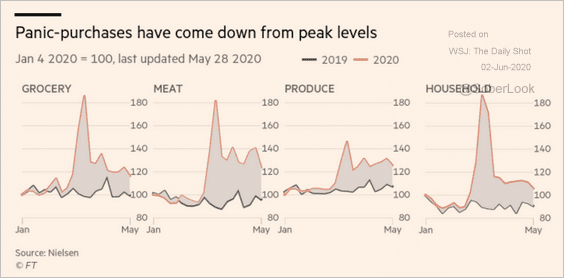 Source: @financialtimes Read full article
4. Online grocery shopping:
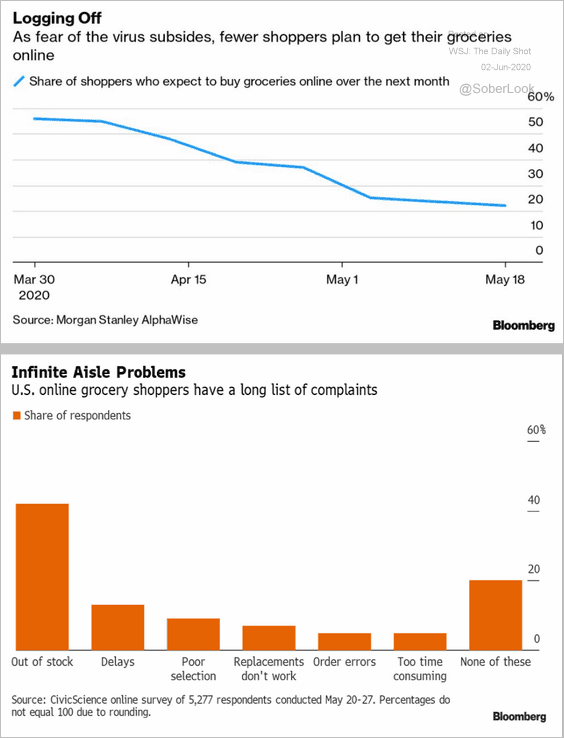 Source: @technology Read full article
5. Accuracy of the COVID-19 death count:
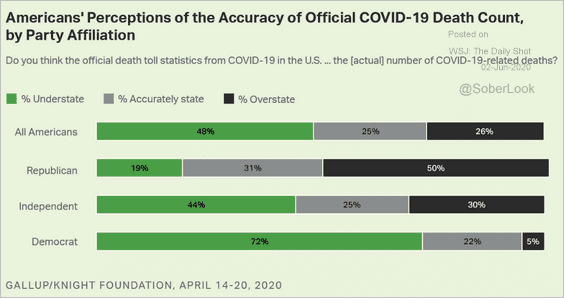 Source: Gallup Read full article
6. Antisemitic incidents in the US:
 Source: ADL
7. Vaccines eradicating common diseases:
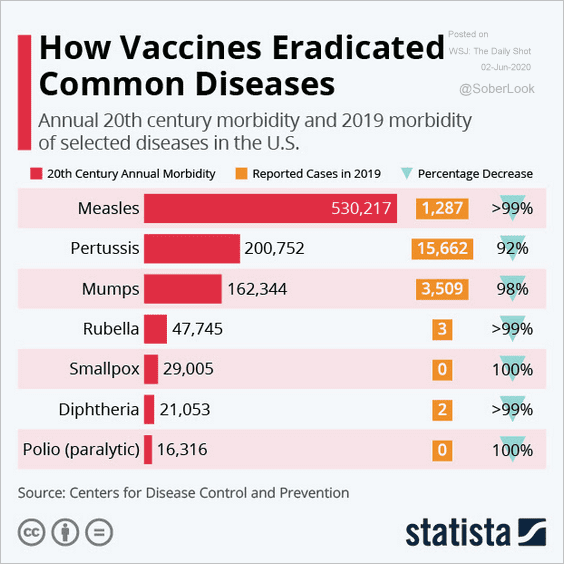 Source: Statista
• The share of children receiving immunizations:
 Source: Statista
——————–
8. UK food and beverage store sales:
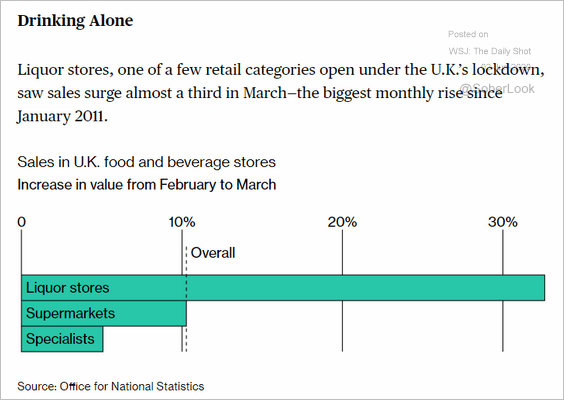 Source: @markets Read full article
——————–