
The Daily Shot: 12-Jun-20
• Credit
• Equities
• Rates
• Energy
• Commodities
• Emerging Markets
• Asia – Pacific
• The United Kingdom
• The United States
• Global Developments
• Food for Thought
Credit
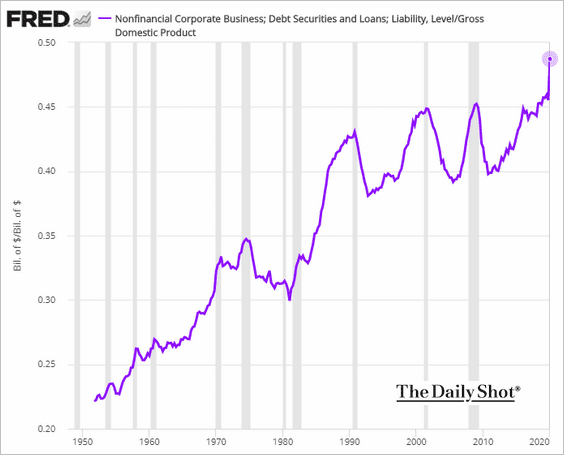
1. US corporate debt is approaching 50% of GDP, a new record. While this chart is through Q1, the ratio likely climbed further in the current quarter.
2. The share of US companies whose debt service costs exceed profits continues to rise.
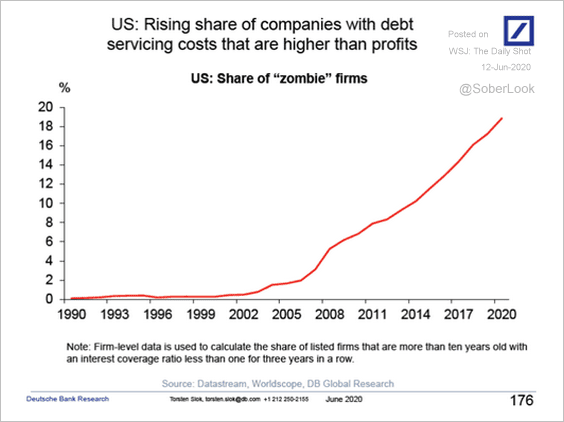 Source: Deutsche Bank Research
3. Many leveraged loan borrowers are violating their debt covenants as revenues tumble and leverage spikes. Most creditors are letting borrowers slide for now by amending loan documents and, in some cases, asking for higher interest (and other concessions).
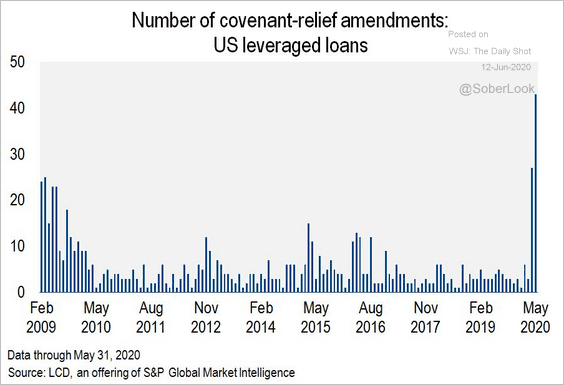 Source: S&P Global Market Intelligence Read full article
4. Investment-grade bond yields are nearing pre-crisis lows.
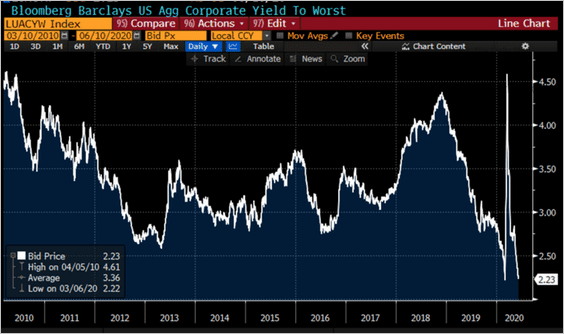 Source: @lisaabramowicz1
By the way, US investment-grade credit has outperformed Treasuries in recent years.
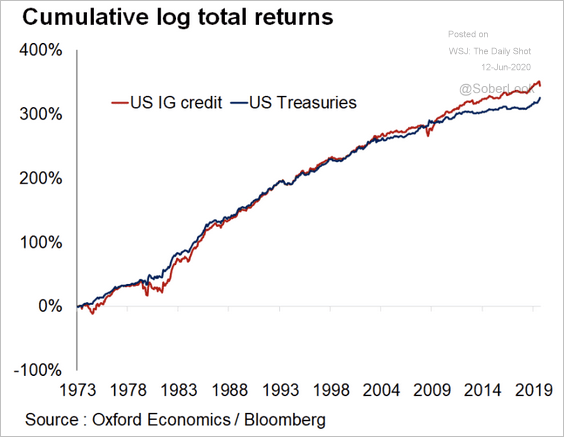 Source: Oxford Economics
——————–
5. Healthcare companies have loaded up on debt during the last recovery, and their weight in the investment-grade corporate index increased.
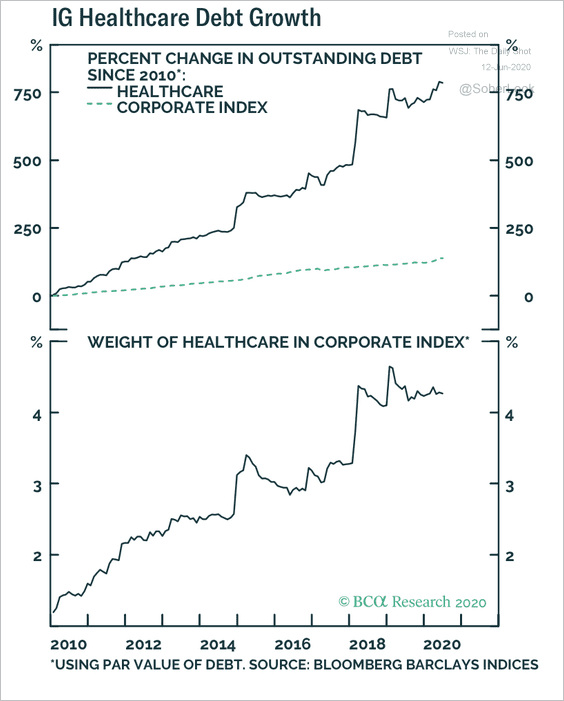 Source: BCA Research
Equities
1. The market blew off some steam on Thursday, but stock futures are already rebounding.
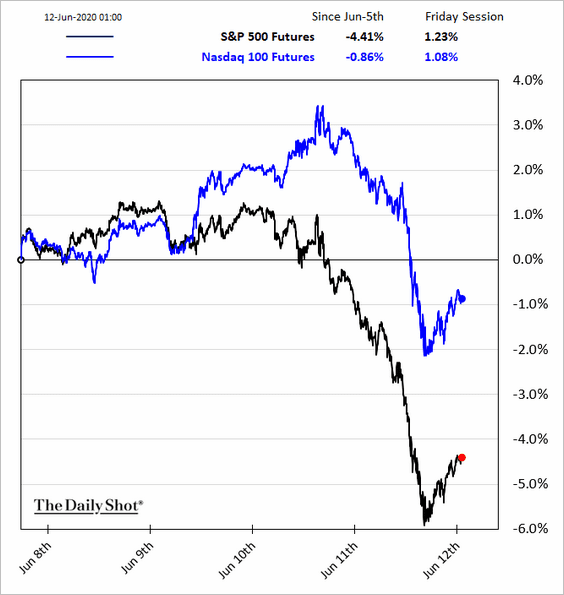
Will market complacency return over the next few weeks?
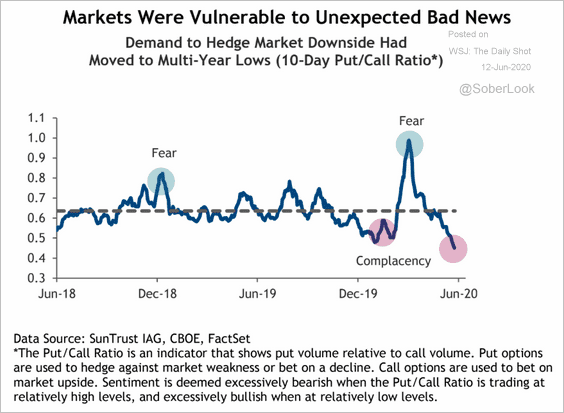 Source: SunTrust Private Wealth Management
——————–
2. Here is a comparison of the current rebound to other bull markets.
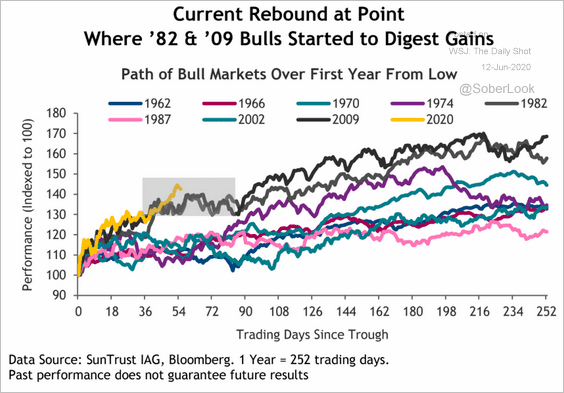 Source: SunTrust Private Wealth Management
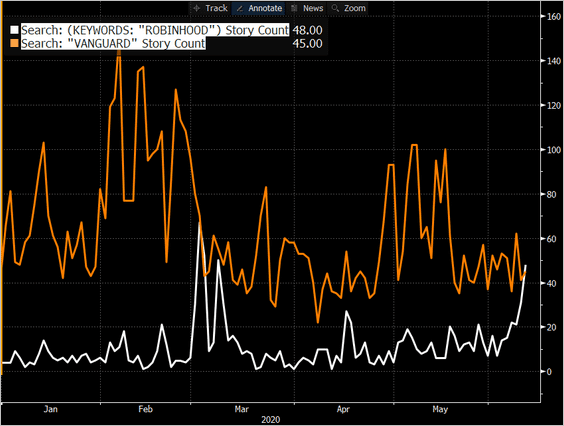
3. News stories mentioning “Robinhood” have surpassed those containing the word “Vanguard.” Day-trading has become extremely popular.
 Source: @EricBalchunas
4. Should equity investors be concerned about this trend in the betting markets?
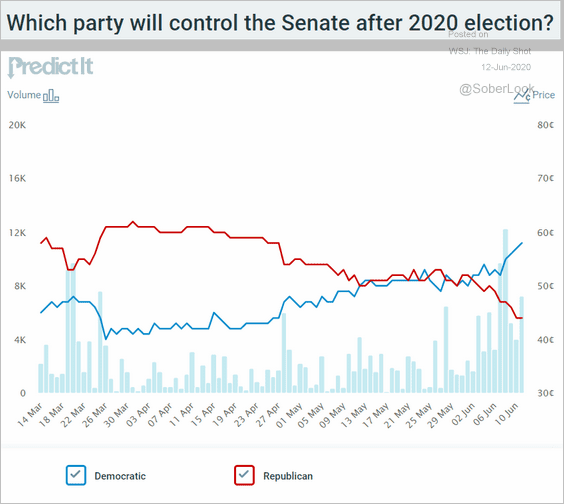 Source: @PredictIt
Is there a risk that some of the corporate tax cuts (and loopholes) could be reversed in the near-term?
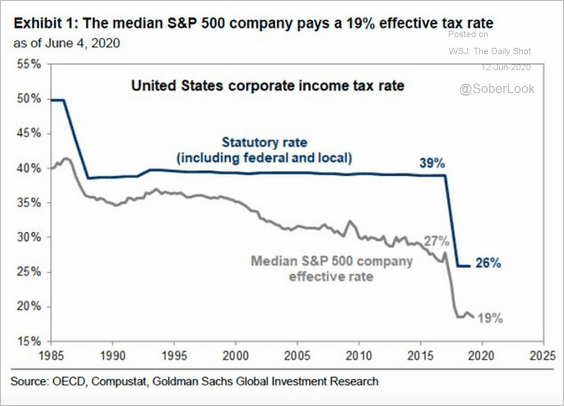 Source: Goldman Sachs, @JohnAuthers Read full article
——————–
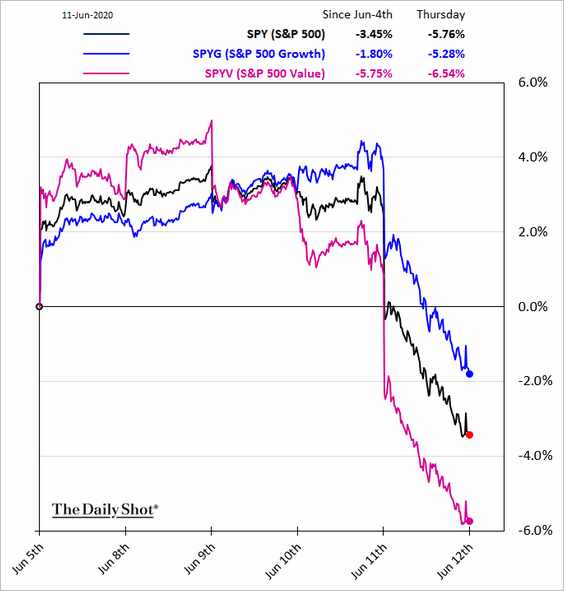
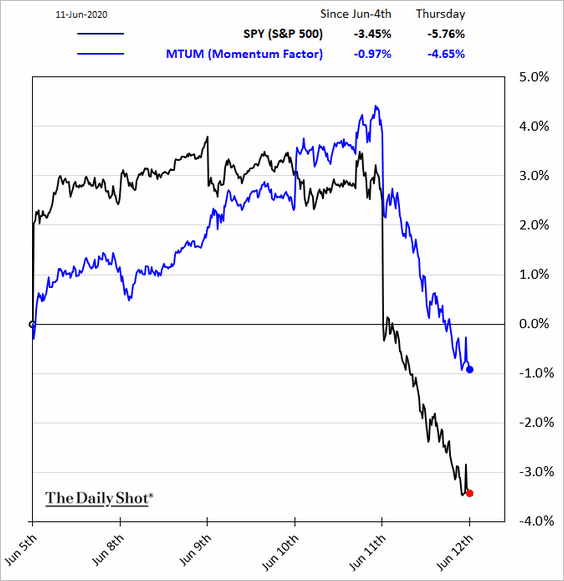
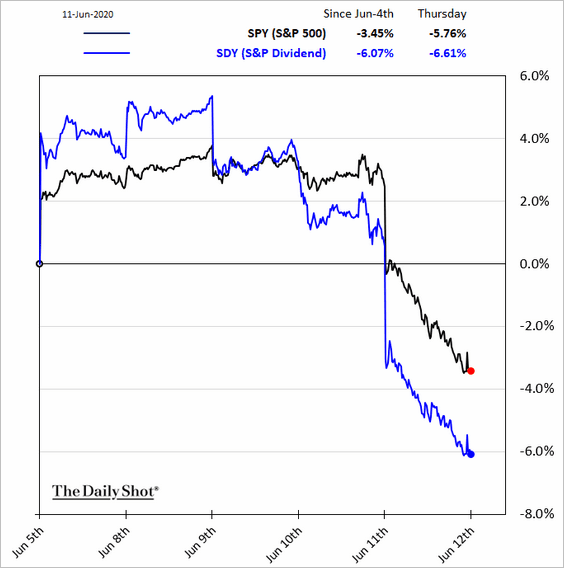
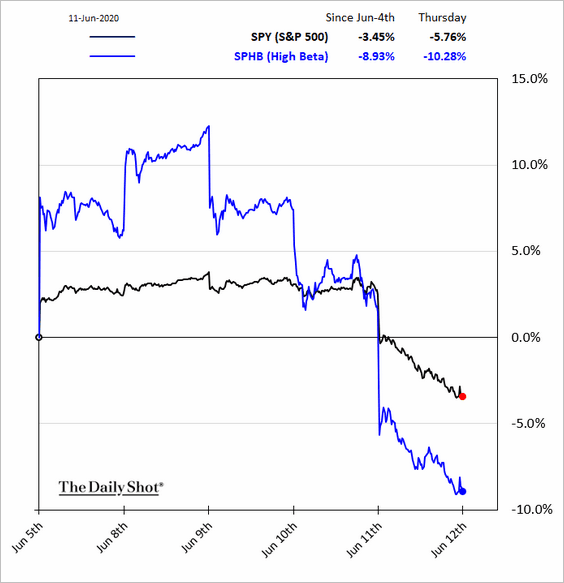
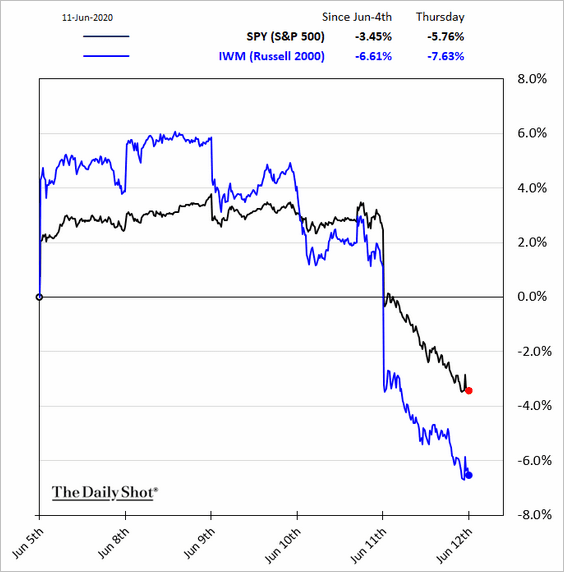
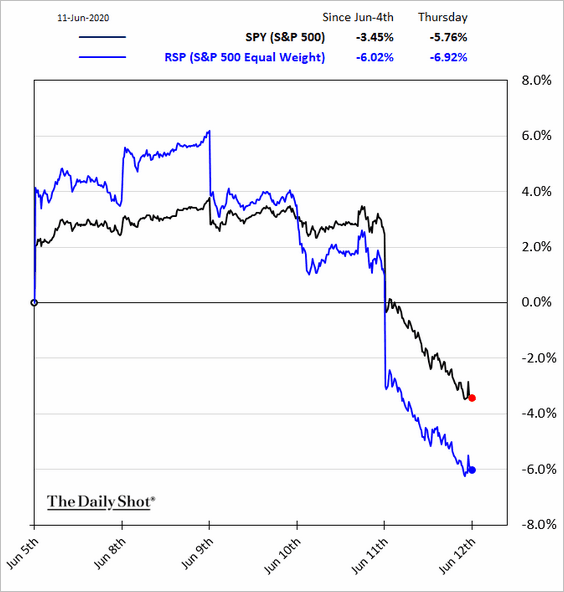
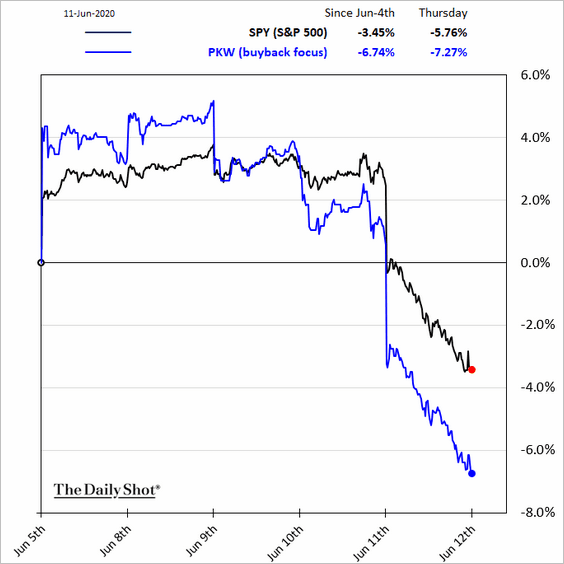
5. Equity factors saw substantial relative moves on Thursday.
• Growth vs. value:
• Momentum:
• High-dividend shares:
• High-beta:
• Small caps and the equal-weight S&P 500:
• Companies known for share buybacks:
By the way, equity factor moves have been explaining more of the S&P 500 returns lately.
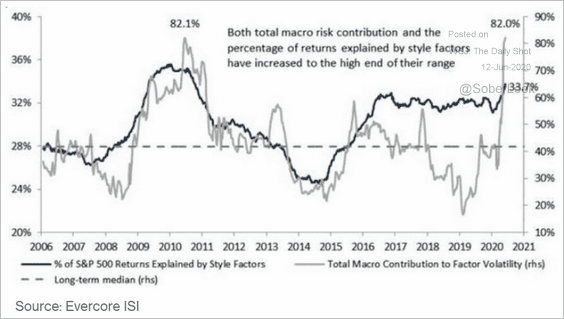 Source: @markets Read full article
——————–
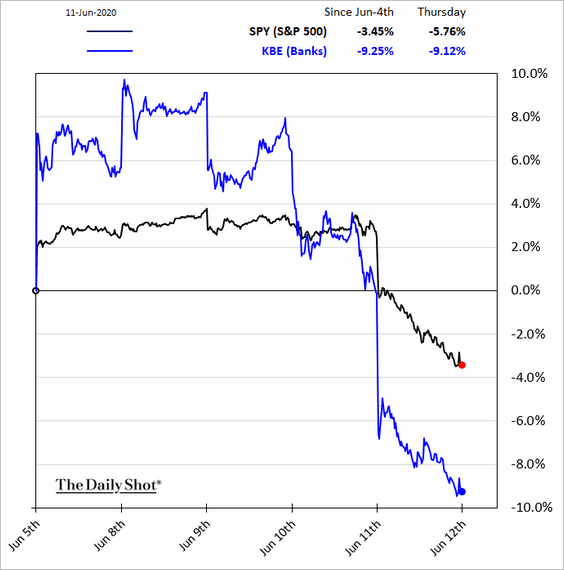
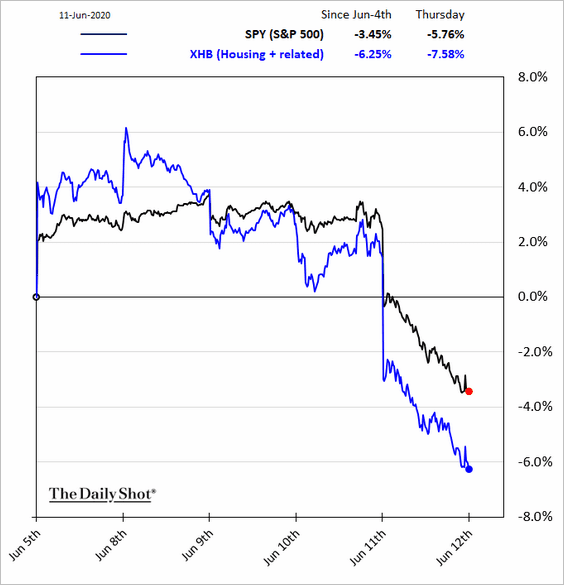
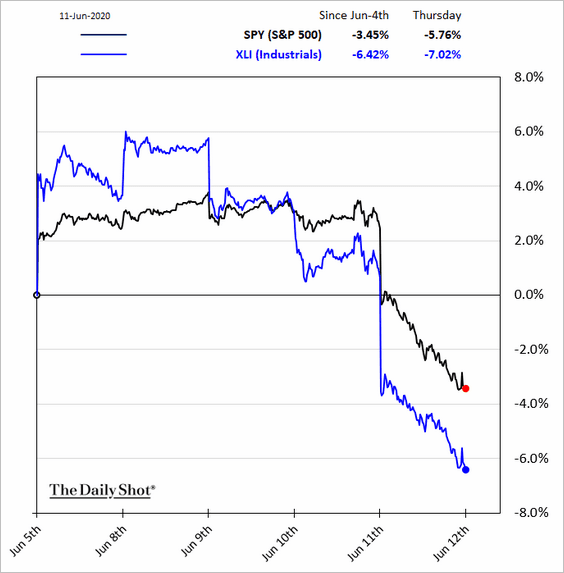
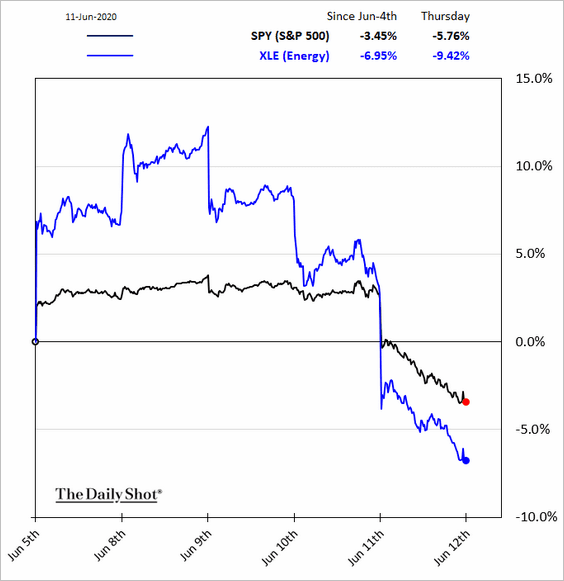
6. Next, we have some sector updates.
• Banks:
• Housing:
• Industrials:
• Transportation:
![]()
• Energy:
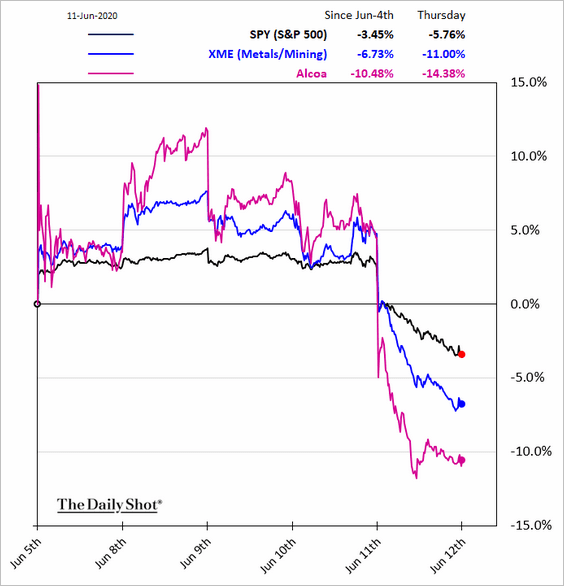
• Metals & mining:
——————–
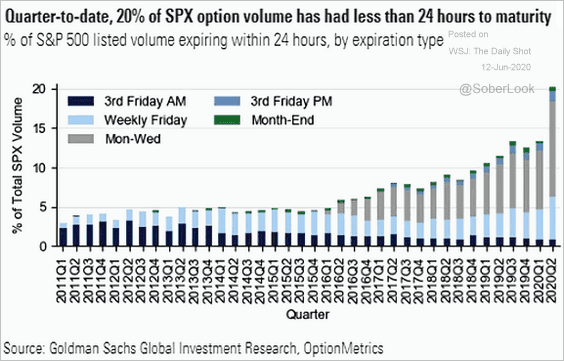
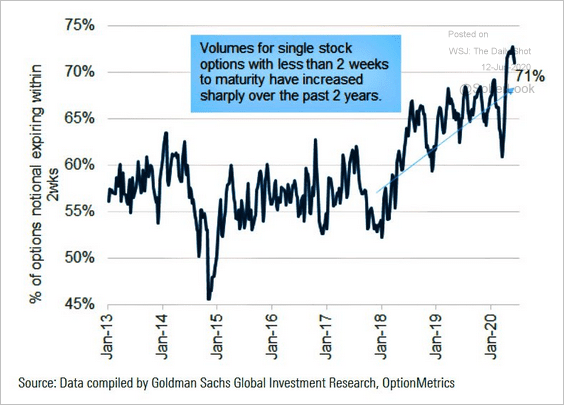
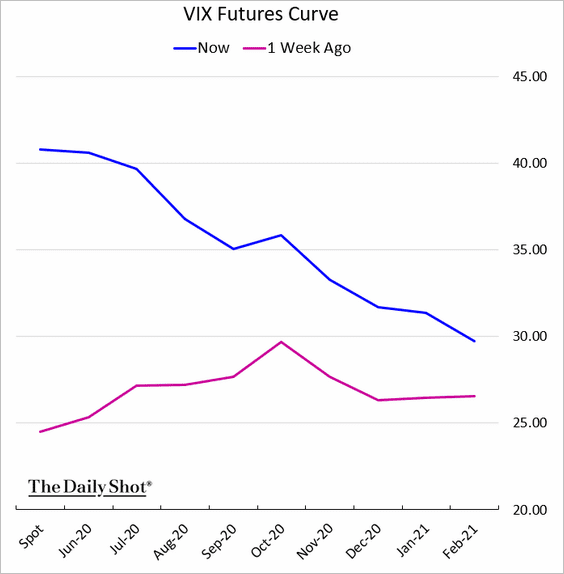
7. Finally, here are some updates on the volatility market.
• Trading in short-term stock options (2 charts from Goldman Sachs Investment Research):
 Source: @ISABELNET_SA, @GoldmanSachs
 Source: @WallStJesus
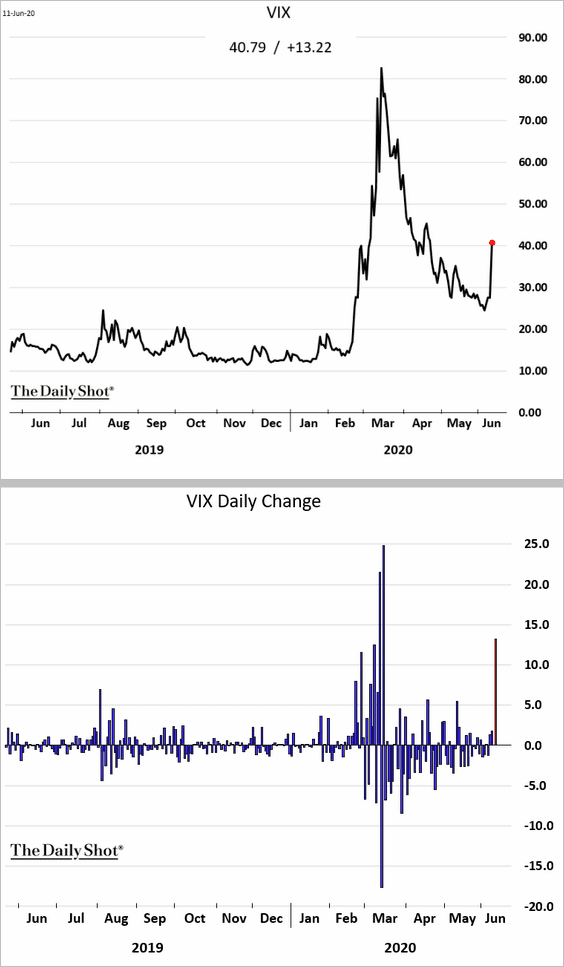
• VIX:
• The VIX futures curve (now in backwardation):
Rates
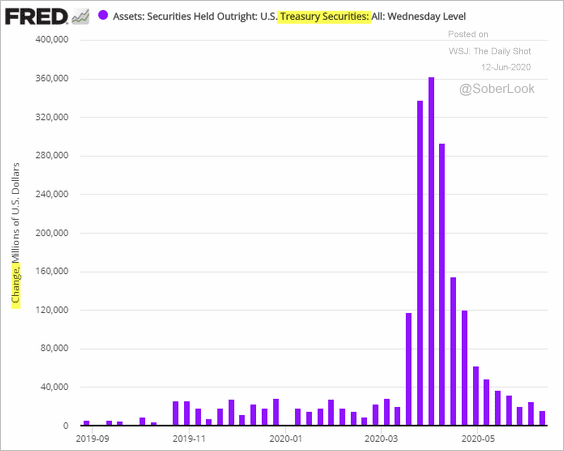
1. The Fed’s purchases of Treasury securities have slowed to pre-pandemic levels. Of course, the central bank was buying only bills before the crisis, but now it targets debt across the curve.
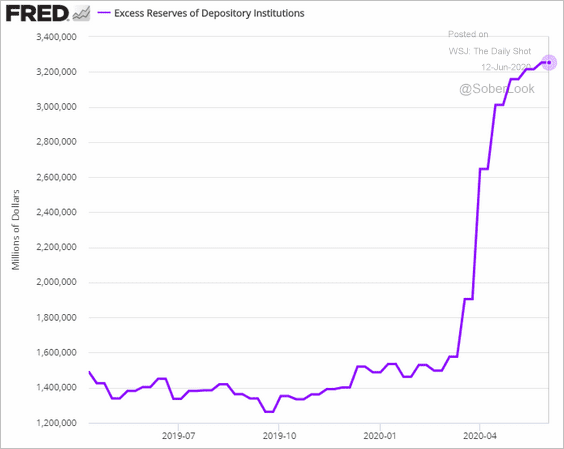
2. Bank reserves have peaked for now as a result of slower QE and record cash balances held by the government at the Fed. (When the US Treasury deposits money at the Fed, it pulls deposits from the private sector, reducing reserves).
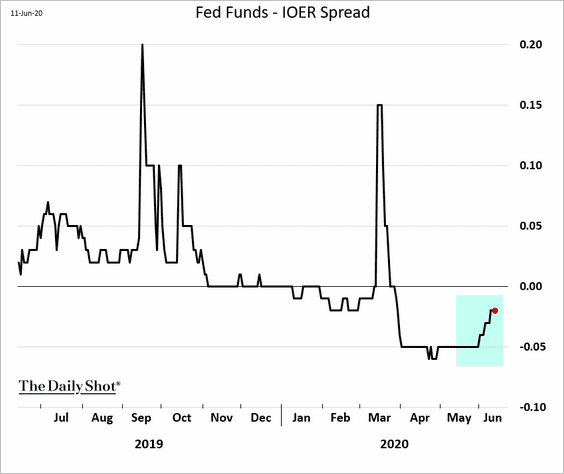
3. With reserves no longer rising, the fed funds rate started grinding higher.
Energy
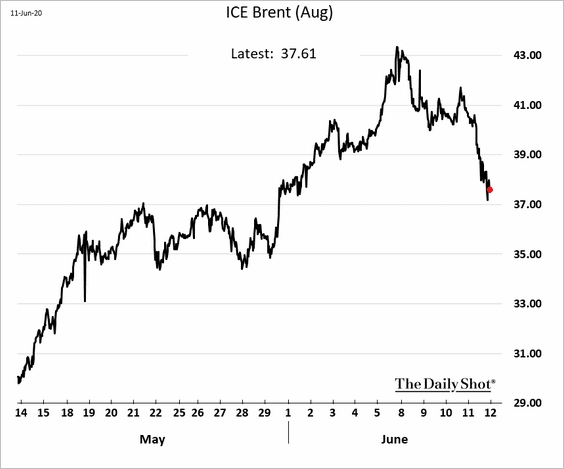
1. Brent is back below $40/bbl, down nearly 13% from the recent high.
2. US refinery inputs are off the lows but remain extremely weak for this time of the year.
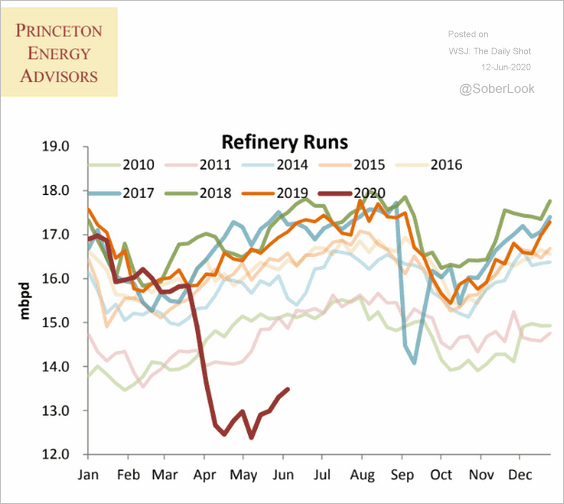 Source: Princeton Energy Advisors
Commodities
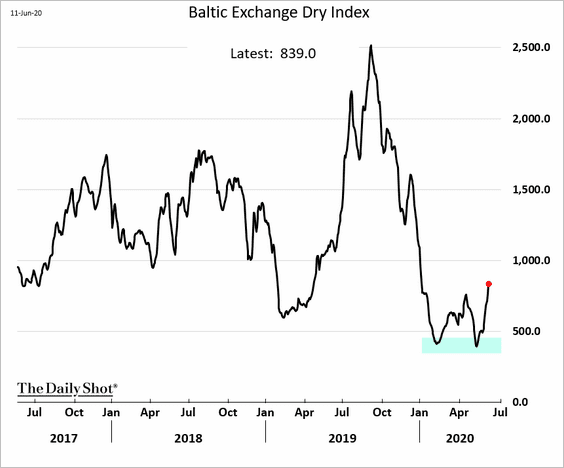
1. Dry bulk shipping costs are rebounding.
2. Cotton futures are at support.
 Source: @cer_hedge
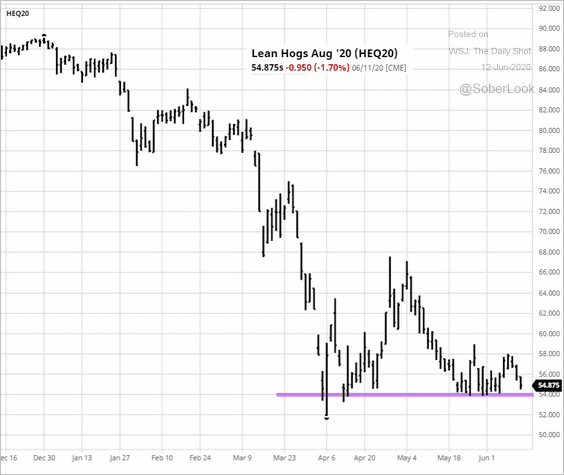
3. US lean hog futures are holding support at $0.54/lb.
 Source: barchart.com
Emerging Markets
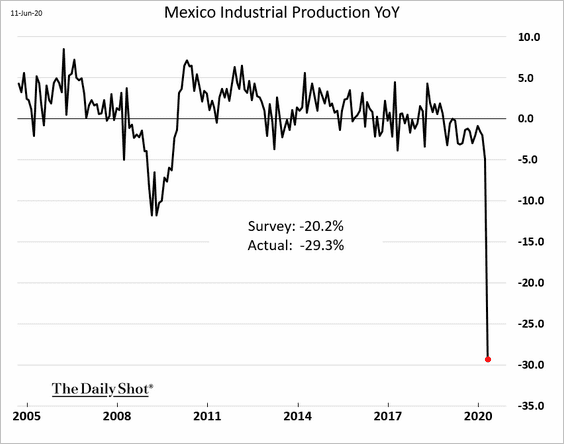
1. Mexico’s industrial production plummetted in April.
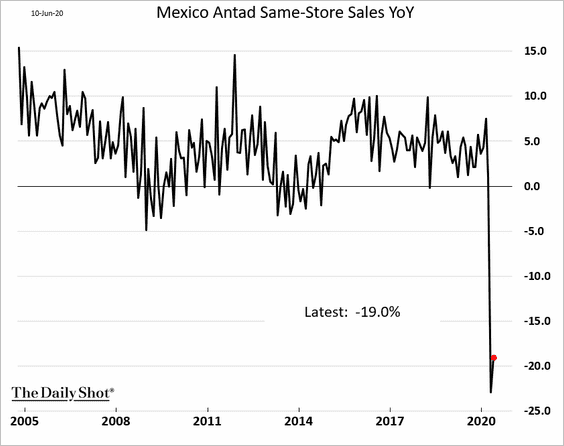
Same-store sales registered a modest improvement in May.
——————–
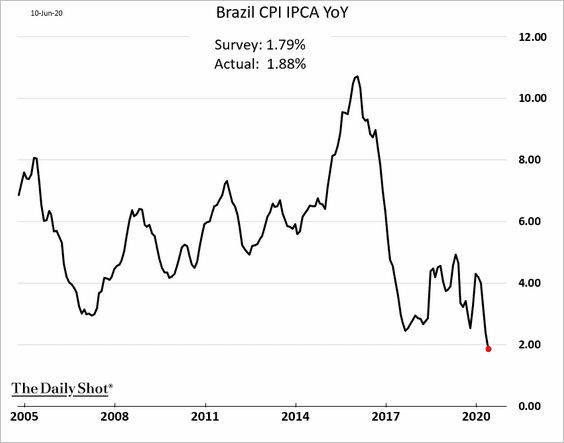
2. Brazil’s inflation continues to moderate.
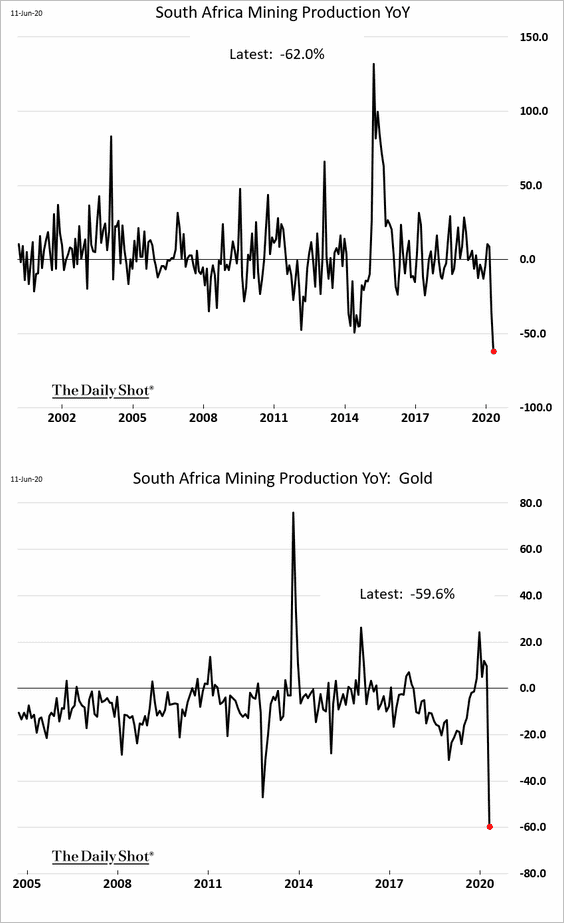
3. South Africa’s mining output was down 62% from a year earlier.
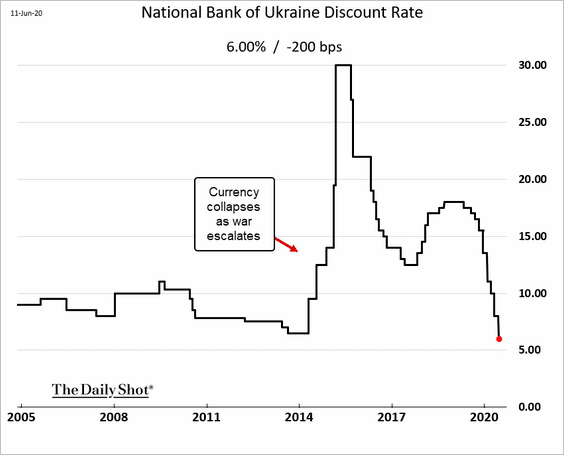
4. Ukraine’s central bank cut rates by 200 bps.
5. India’s GDP could see its first annual contraction in 40 years, according to Gavekal.
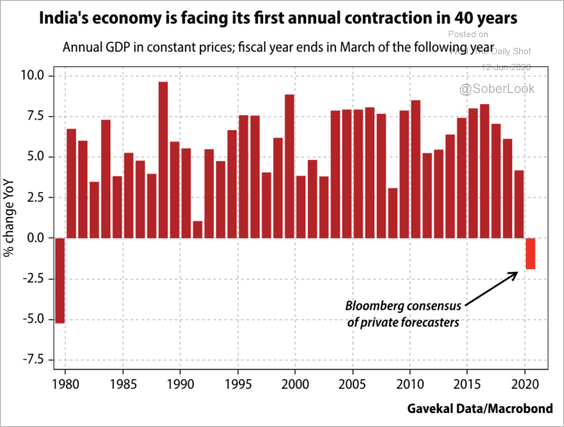 Source: Gavekal
The yield curve has steepened sharply this year.
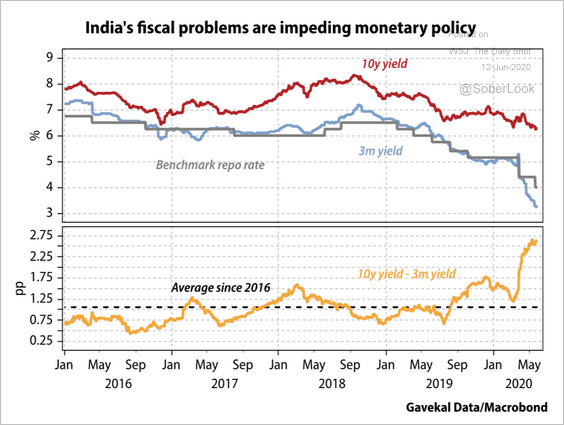 Source: Gavekal
——————–
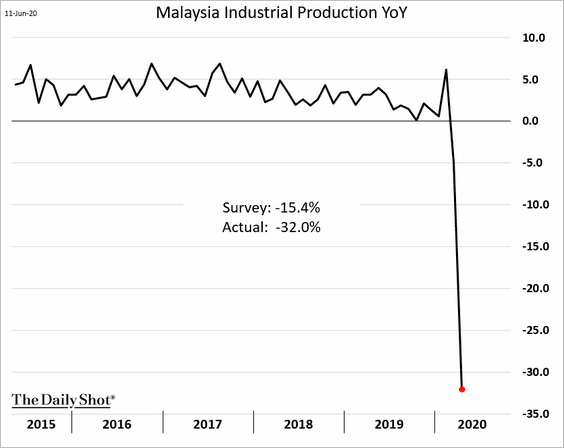
6. Here is Malaysia’s industrial output (through April).
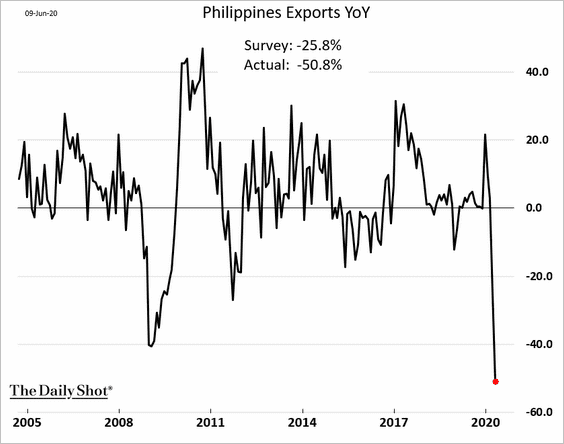
7. Philippine exports collapsed in April.
8. US imports of clothing from EM Asia fell further in May amid rising inventories.
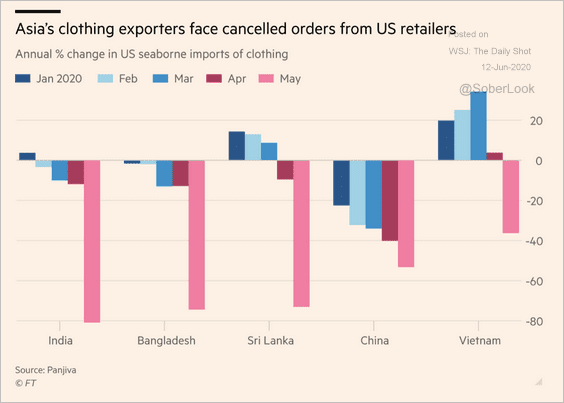 Source: @financialtimes Read full article
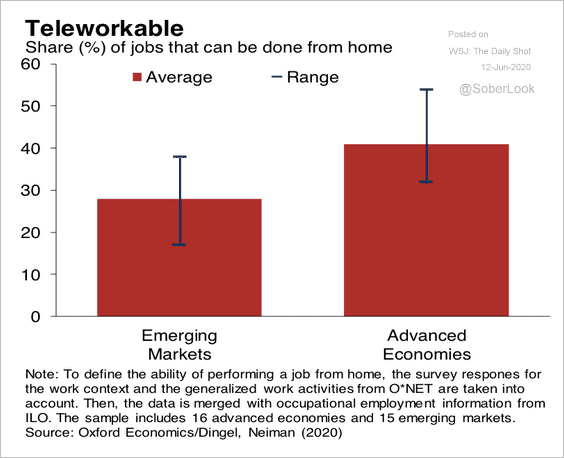
9. There are fewer telework jobs in EM compared to advanced economies, according to an Oxford Economics survey.
 Source: Oxford Economics
Asia – Pacific
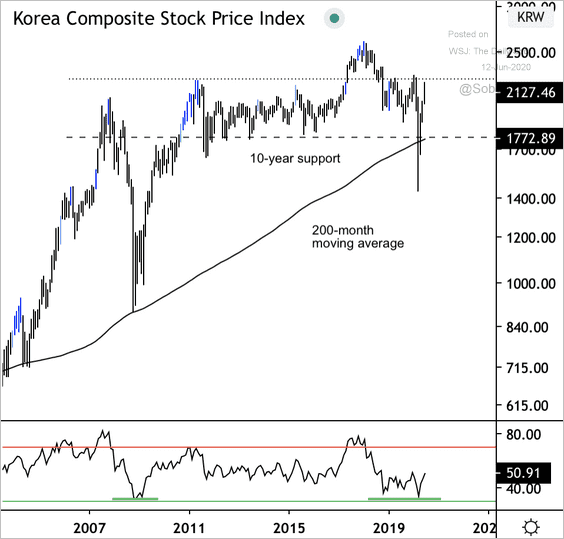
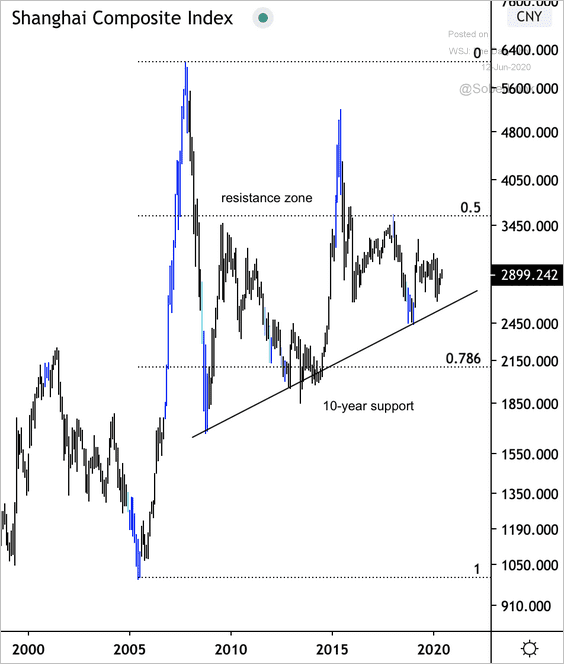
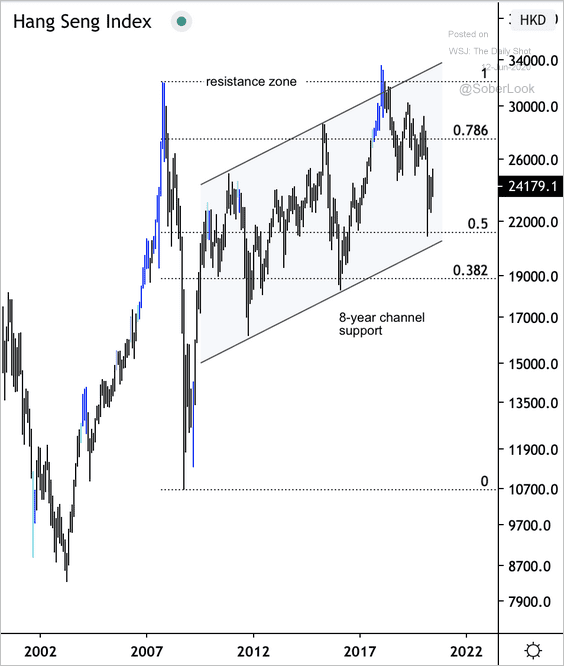
1. Several Asian equity markets are holding long-term support (3 charts).
• South Korea’s Kospi Index:
 Source: @DantesOutlook
• China’s Shanghai Composite Index:
 Source: @DantesOutlook
• Hong Kong’s Hang Seng Index:
 Source: @DantesOutlook
——————–
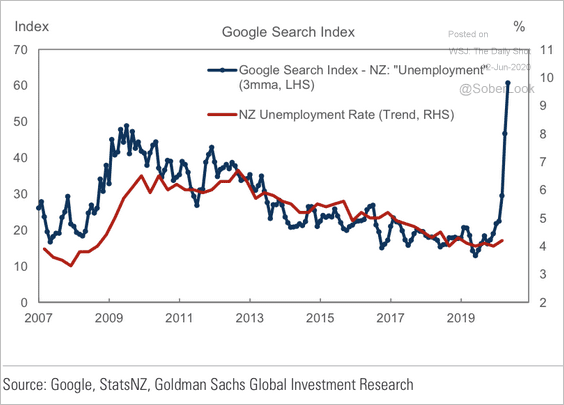
2. Google search data point to a sharp rise in New Zealand’s unemployment rate.
 Source: Goldman Sachs
3. Japan’s car sales declined further in May.
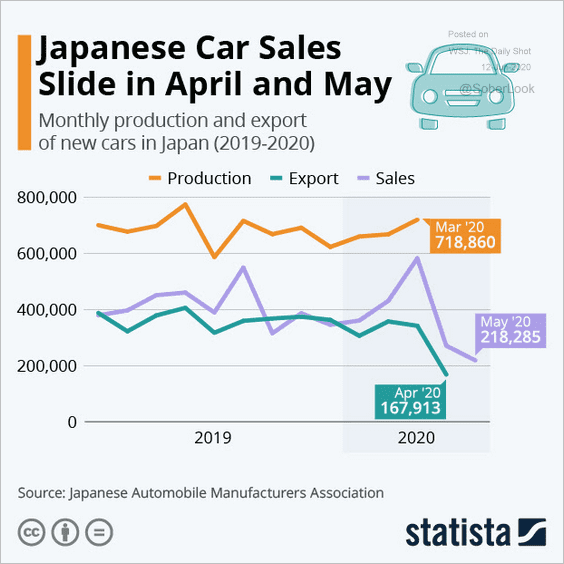 Source: Statista
The United Kingdom
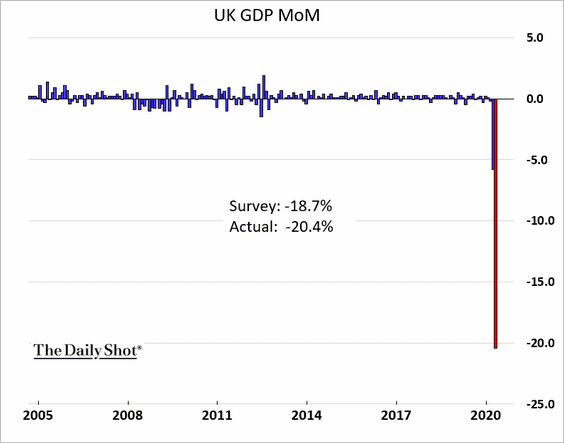
1. The UK GDP shrunk by 20% in April (after a 5% slide in March).
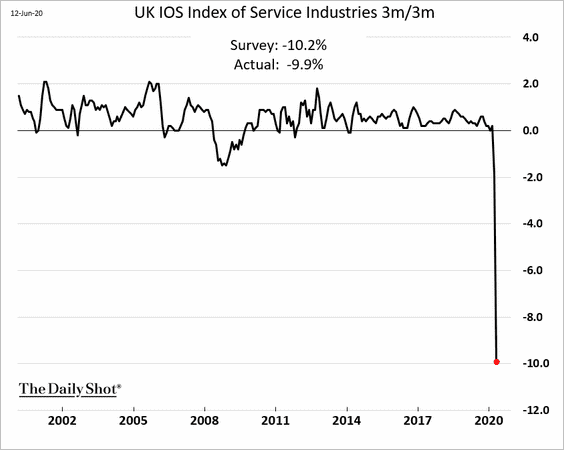
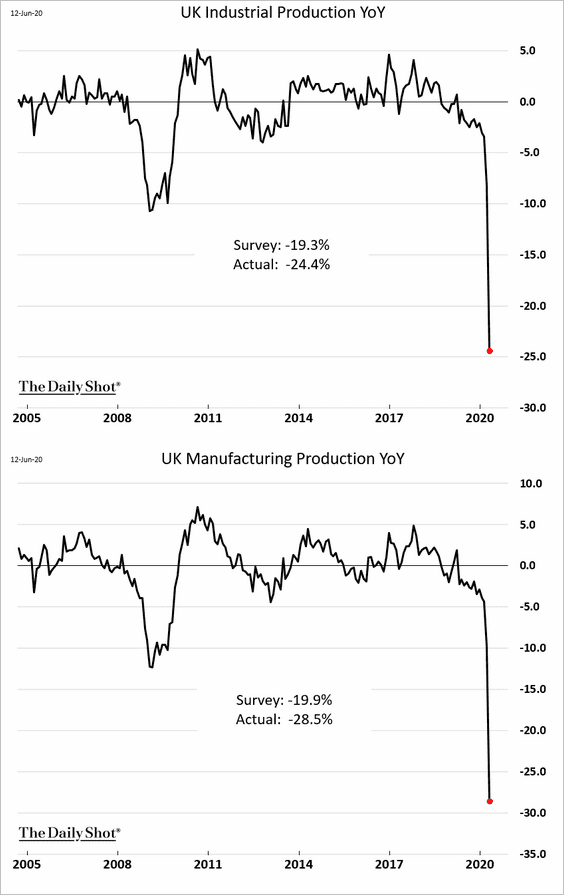
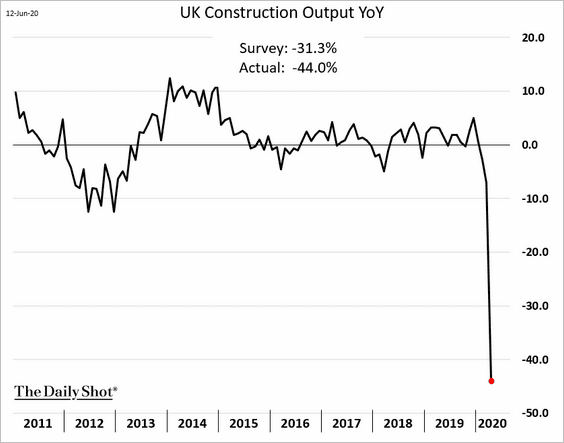
2. Industrial production, construction output, and service sector activity plummetted.
• Services:
• Industry:
• Construction:
——————–
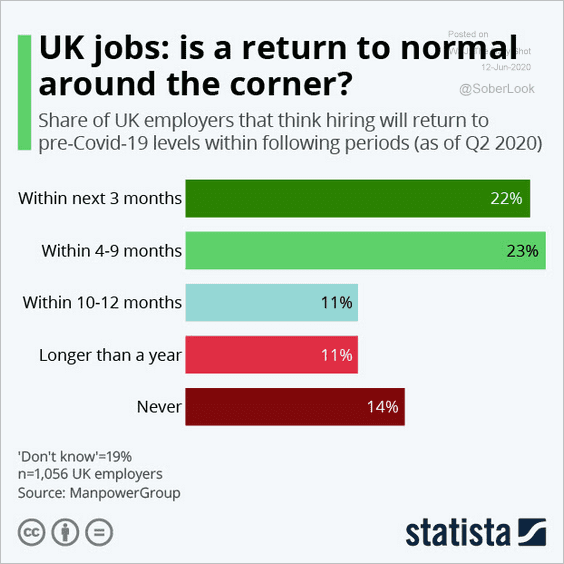
3. When do UK employers think hiring will return to pre-crisis levels?
 Source: Statista
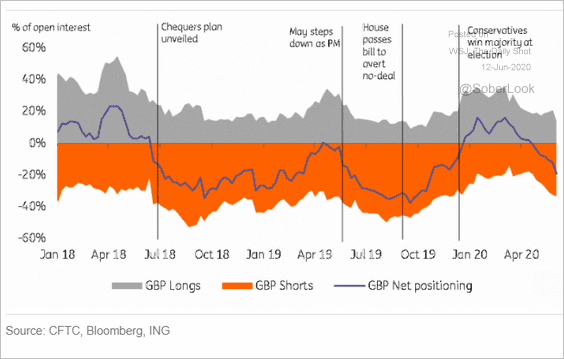
4. Speculative accounts have been betting against the pound.
 Source: ING
The United States
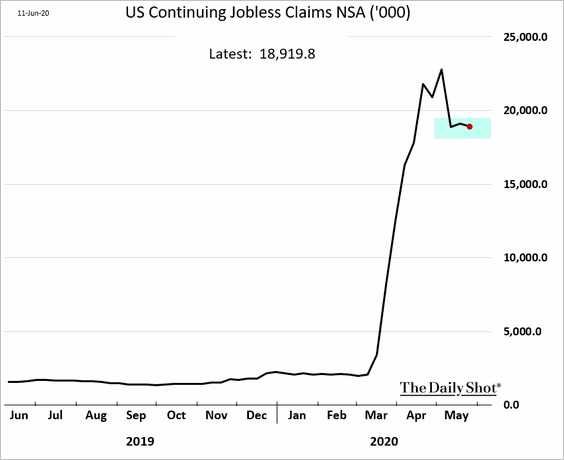
1. Another million and a half Americans filed for unemployment last week.
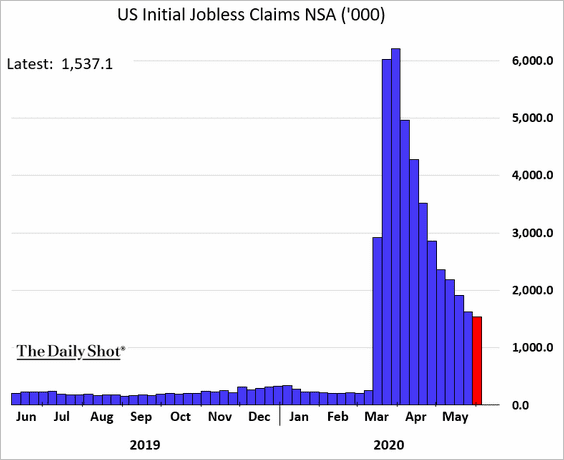
Despite the rehiring (as the economy reopens), the number of Americans receiving unemployment benefits is holding steady (just below 20 million).
——————–
2. Here are a couple of other updates on the labor market.
• The FOMC does not expect the unemployment rate to return to pre-crisis lows for years.
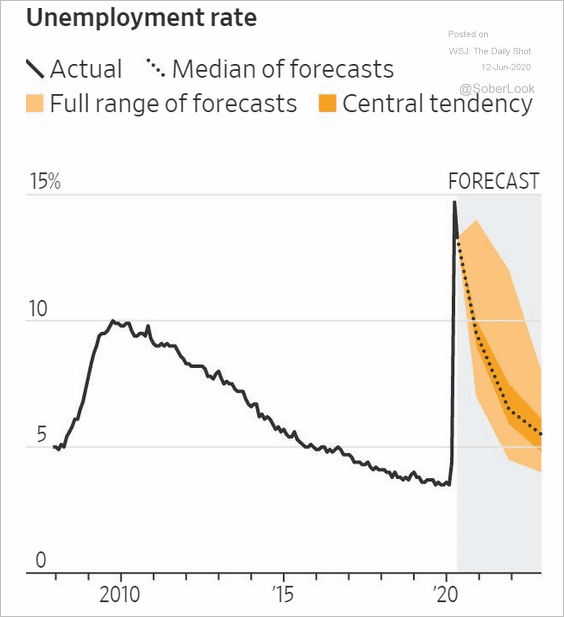 Source: @WSJ Read full article
• As discussed previously, the US unemployment rate calculations are not very reliable at this point.
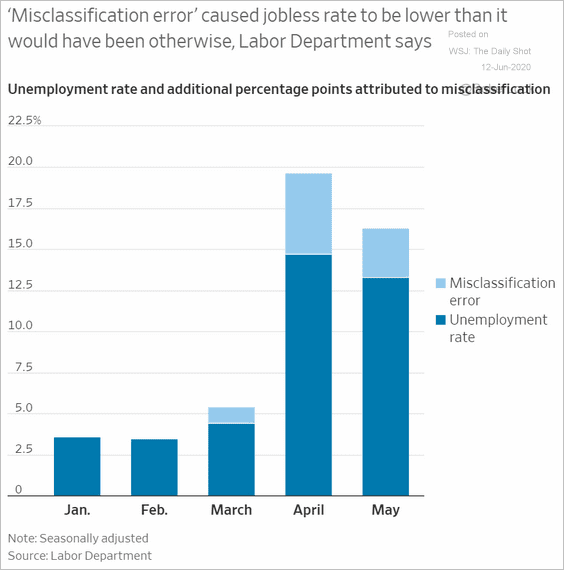 Source: @WSJ Read full article
——————–
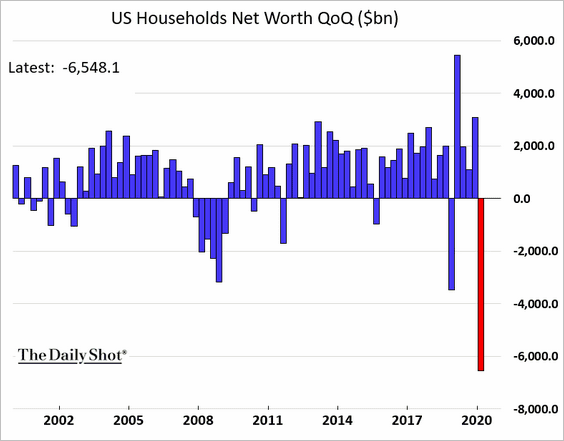
3. US households’ net worth tumbled in the first quarter as the stock market corrected.
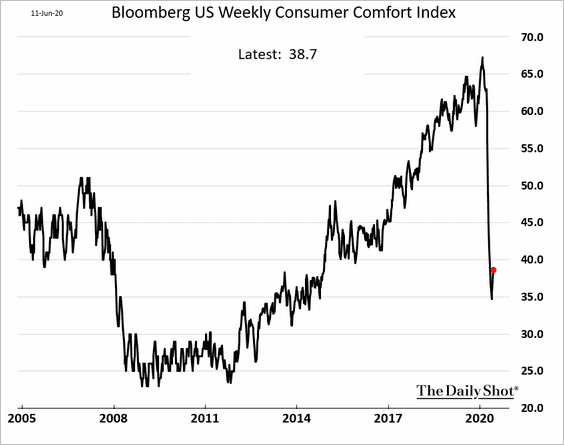
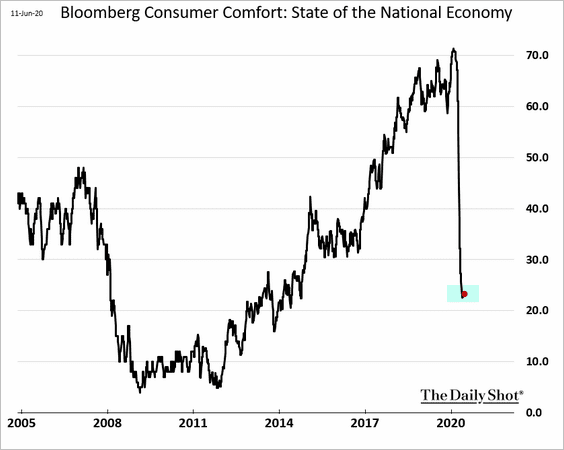
4. Bloomberg’s US consumer sentiment is gradually recovering.
But confidence in the economy is holding at multi-year lows.
——————–
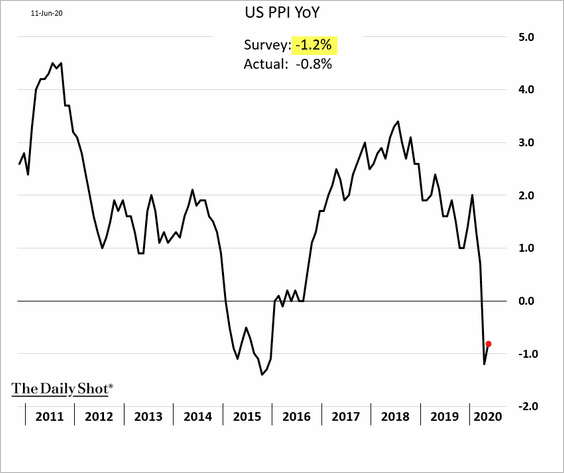
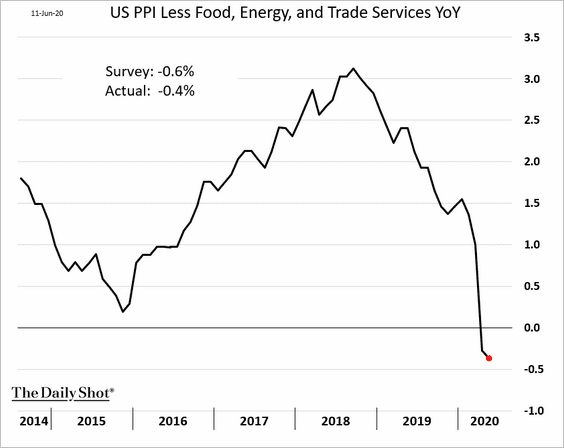
5. The May PPI report was stronger than expected, suggesting that disinflationary pressures may be abating.
• Headline PPI:
• Core PPI ex trade services:
However, Nomura expects the US to enter deflation in the months ahead (the chart below shows the US core CPI).
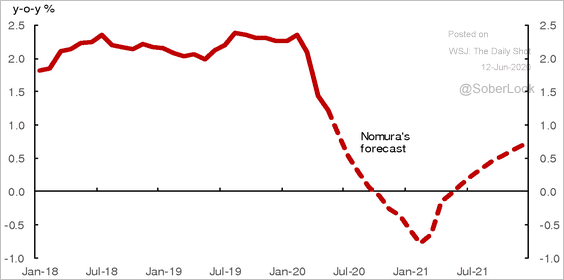 Source: Nomura Securities
Global Developments
1. Let’s take a look at some economic forecasts from the OECD.
• The 2020 GDP hit (“double-hit scenario” represents a second wave of the COVID-19 pandemic):
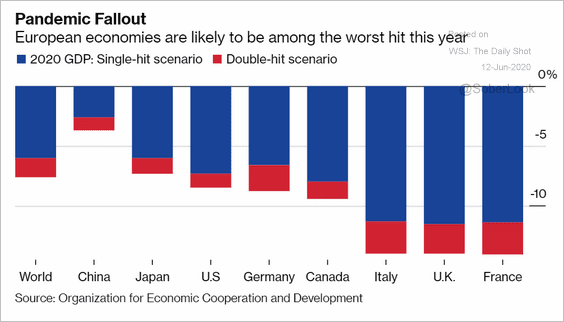 Source: @markets Read full article
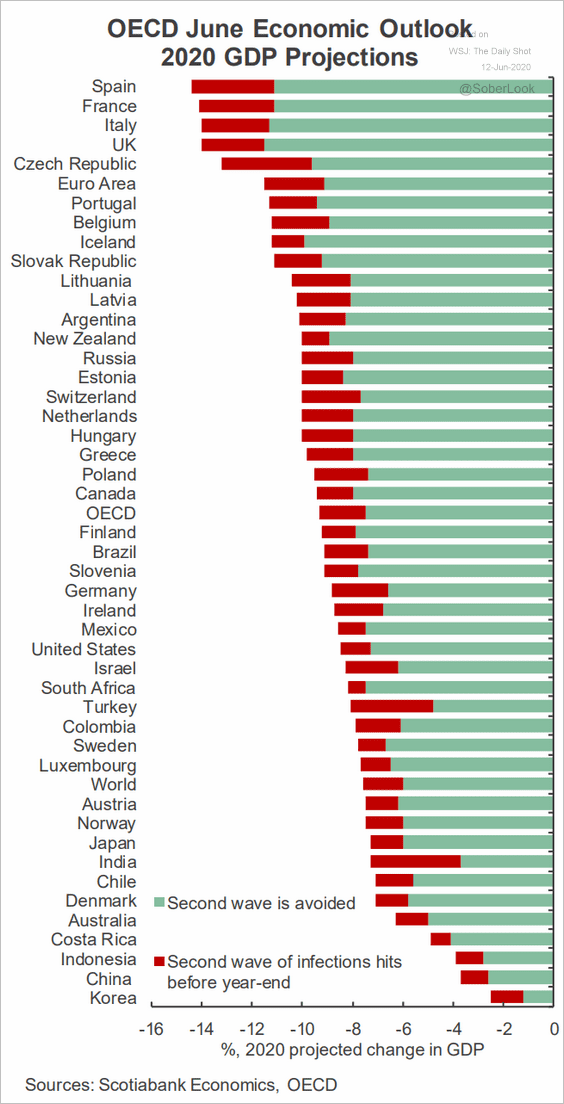 Source: Scotiabank Economics
• GDP scenarios with and without the second wave:
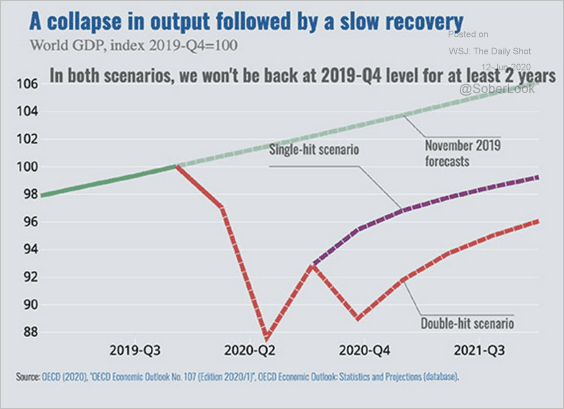 Source: OECD
• Unemployment:
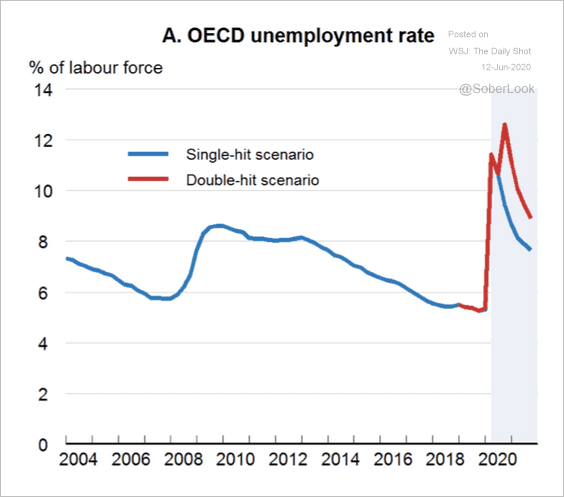 Source: OECD
• Per capita incomes:
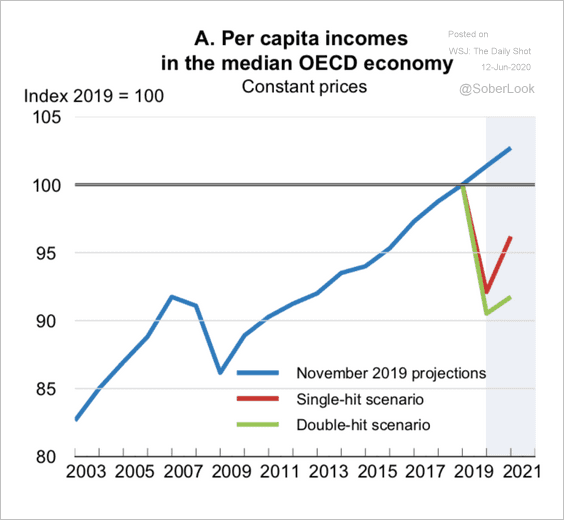 Source: OECD
——————–
2. Business surveys conducted by Moody’s Analytics point to ongoing deterioration in pricing power as well as investing and hiring plans.
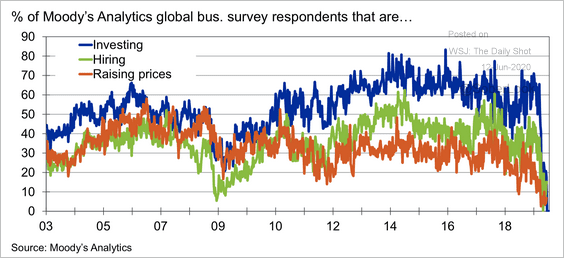 Source: Moody’s Analytics
——————–
Food for Thought
1. Monthly changes in US food prices:
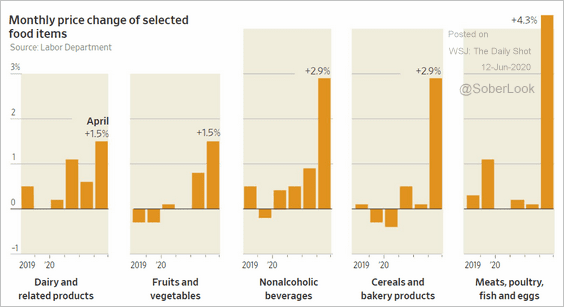 Source: @WSJ Read full article
2. Productivity when working from home:
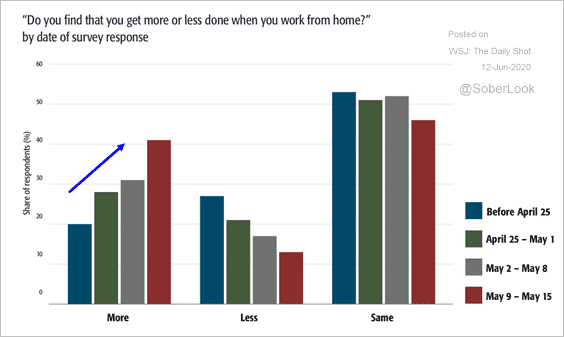 Source: Pioneer Public Further reading
3. Urban vs. rural population projections (globally):
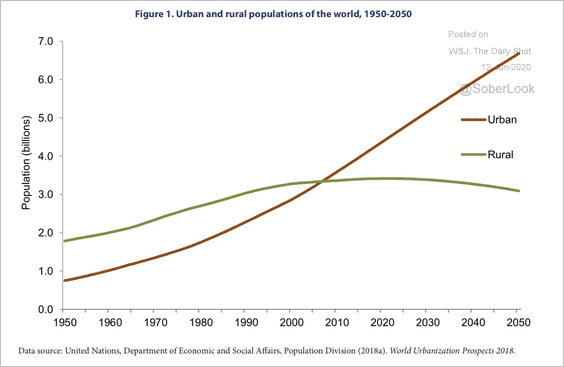 Source: UN Read full article
4. Chinese students in the US:
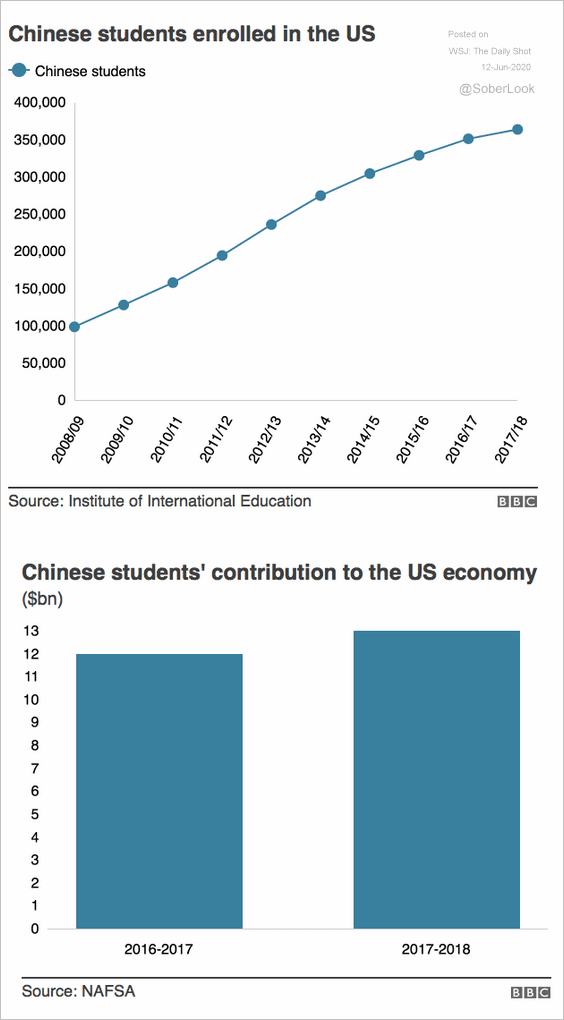 Source: BBC Read full article
5. Socializing in public places:
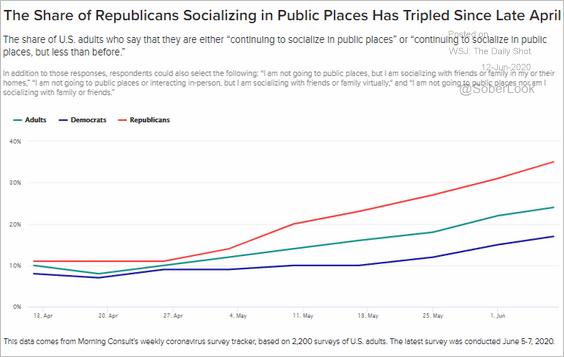 Source: Morning Consult Read full article
6. Voter support for the Black Lives Matter movement:
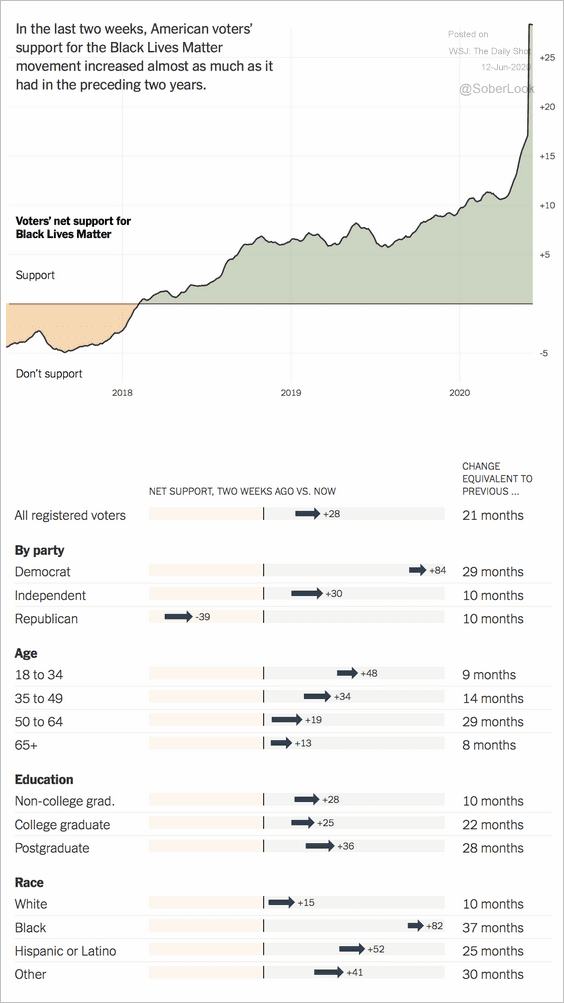 Source: The New York Times Read full article
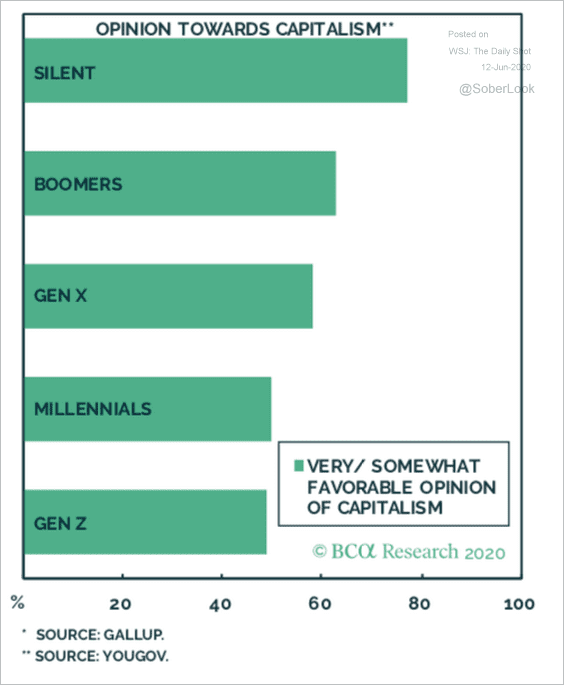
7. The tilt to the left (2 charts):
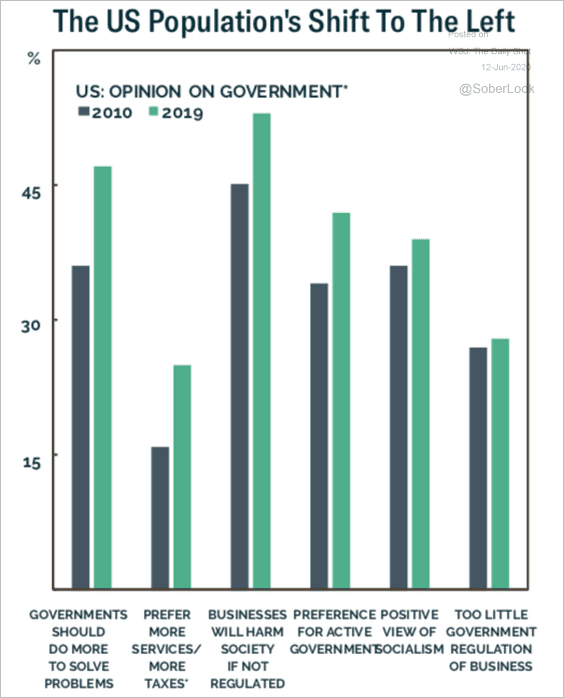 Source: BCA Research
 Source: BCA Research
——————–
8. What did you miss the most about dining out?
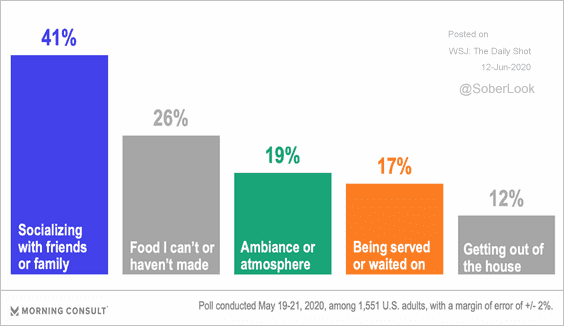 Source: Morning Consult Read full article
——————–
Have a great weekend!