
The Daily Shot: 25-Jun-20
• The United States
• Canada
• The Eurozone
• Europe
• Asia – Pacific
• Emerging Markets
• Energy
• Equities
• Rates
• Global Developments
• Food for Thought
The United States
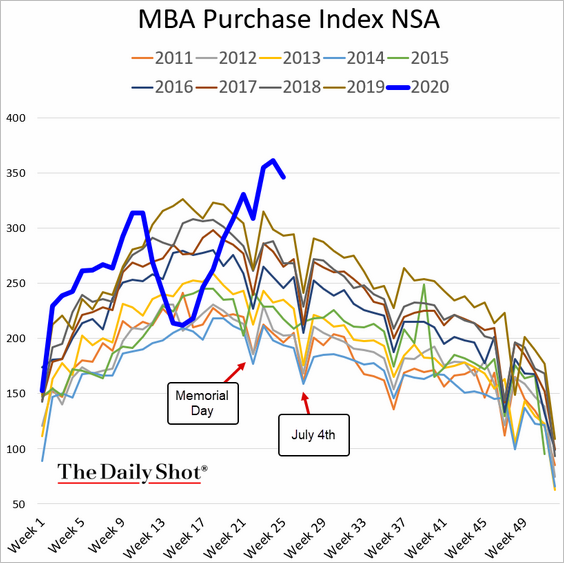
1. Once again, let’s start with the housing market.
• Mortgage applications to purchase a house are holding at multi-year highs for this time of the year.
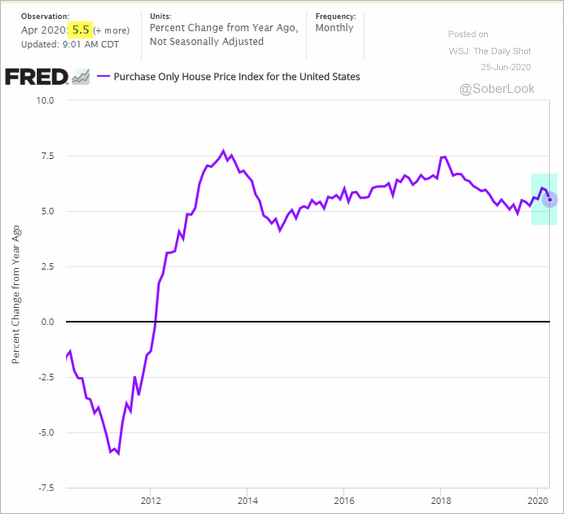
• Home price appreciation ticked lower in April, but still registered a 5.5% increase from a year ago.
 Source:
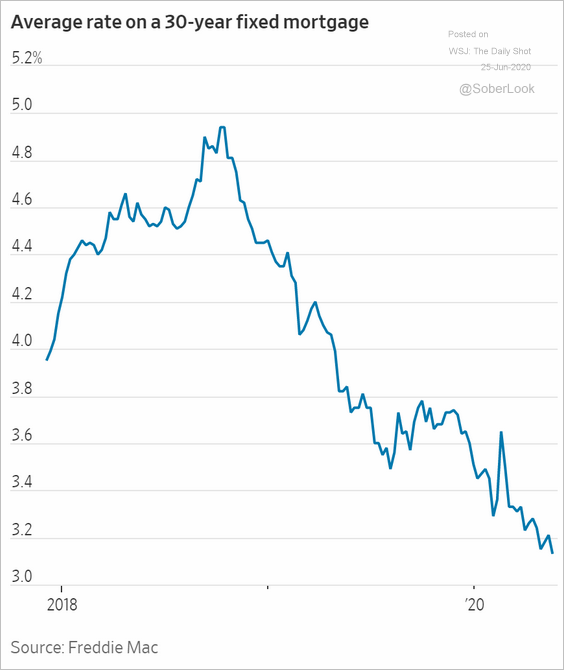
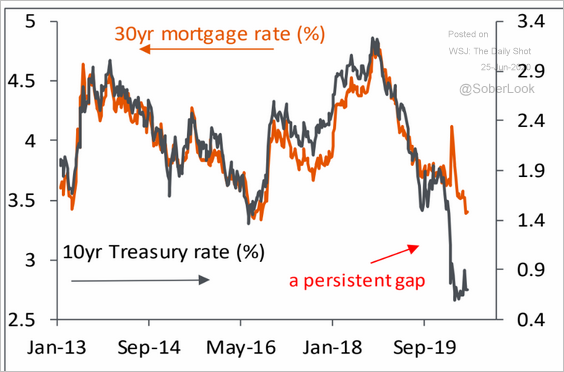
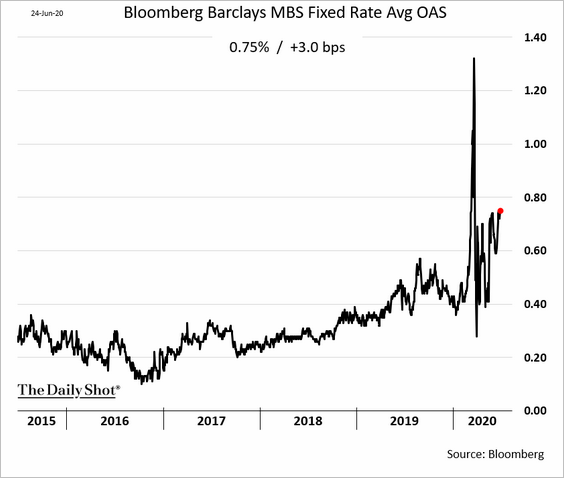
• Mortgage rates are hovering near record lows, but they have lagged the declines in the 10-year Treasury yield (second chart).
 Source: @WSJ Read full article
 Source: Piper Sandler
• One of the reasons for the persistent gap between mortgage rates and Treasury yields is the elevated spread on mortgage-backed securities (MBS). This spread would have been even wider without the Fed’s rapid-fire MBS purchases since March (see chart).
——————–
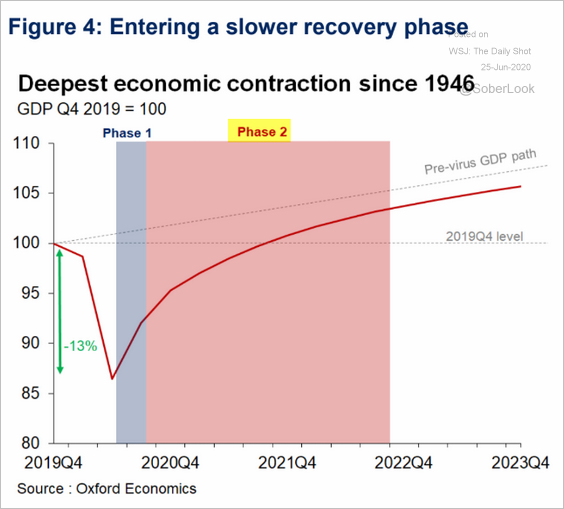
2. The Oxford Economics activity tracker shows the US recovery slowing.
![]() Source: Oxford Economics
Source: Oxford Economics
After a sharp post-reopening rebound, we are entering the slow phase of the recovery.
 Source: Oxford Economics
——————–
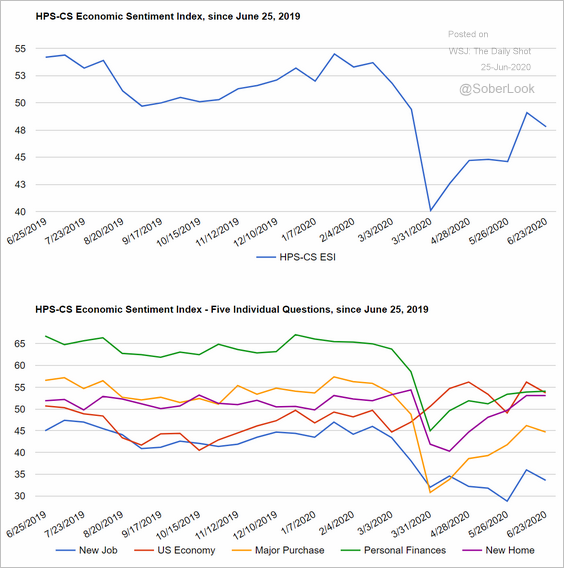
3. Here is the HPS-CS consumer sentiment indicator.
 Source: @HPSInsight, @CivicScience
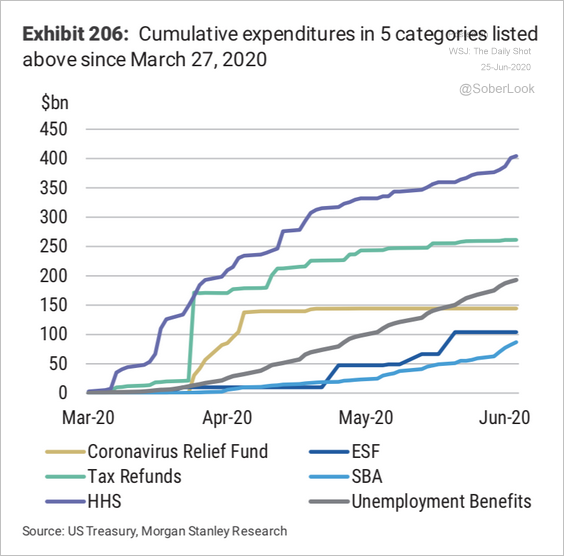
4. This chart shows cumulative spending across the various federal stimulus programs.
 Source: Morgan Stanley Research
And there is more stimulus on the way.
 Source: @bpolitics Read full article
——————–
5. US-listed companies have raised record amounts of cash to get through the crisis.
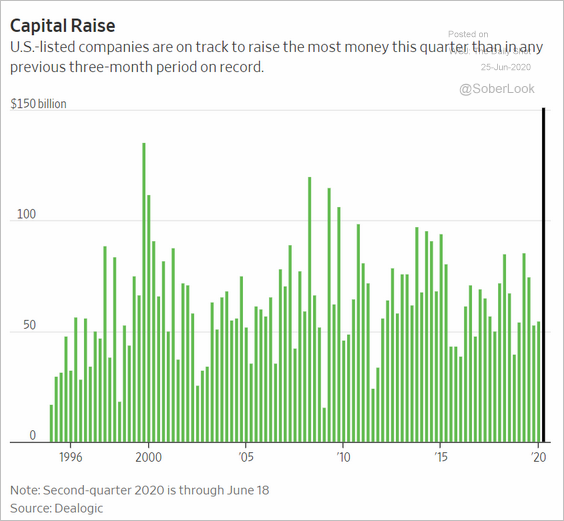 Source: @WSJ Read full article
The bulk of that capital has been raised in the credit markets, pushing corporate debt to new highs (see chart).
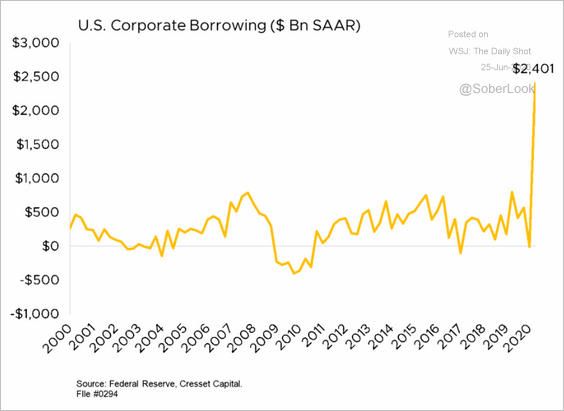 Source: Jack Ablin, Cresset Wealth Advisors
——————–
5. Currency traders are nervous about the November elections. This chart shows the spread between the six- and the 3-month implied volatility in dollar-yen.
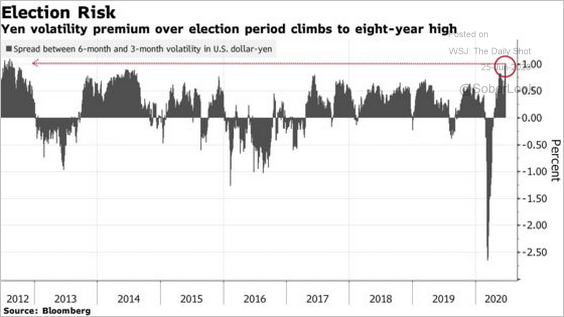 Source: @markets Read full article
Canada
1. Fitch stripped Canada of its AAA rating in response to “the deterioration of Canada’s public finances resulting from the coronavirus pandemic.”
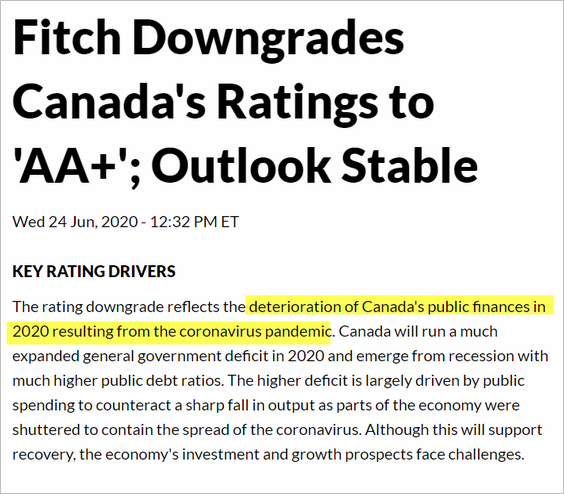 Source: Fitch Ratings Read full article
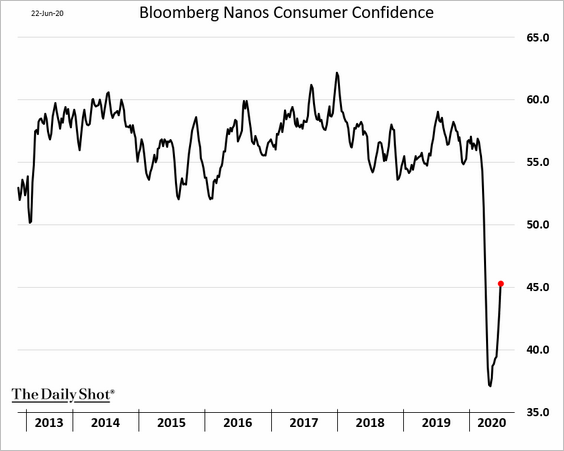
2. Consumer confidence continues to recover.
3. The market expects Canada to lead in hiking rates next year.
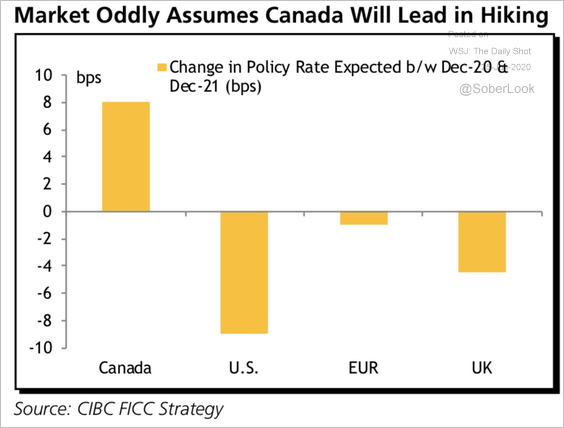 Source: CIBC Capital Markets
4. Just like in the US, mortgage applications to purchase a house have been rising rapidly.
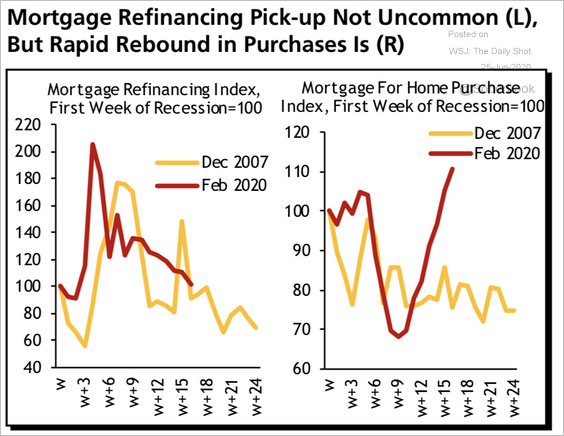 Source: CIBC Capital Markets
5. Industries dominated by office work experienced further job losses in May.
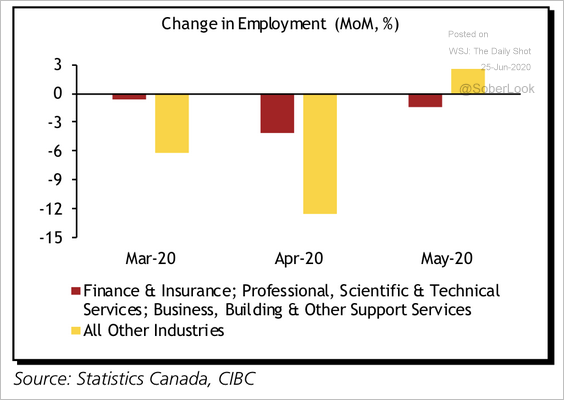 Source: CIBC Capital Markets
The Eurozone
1. The Ifo indicator showed a sharp improvement in Germany’s business expectations (second chart).
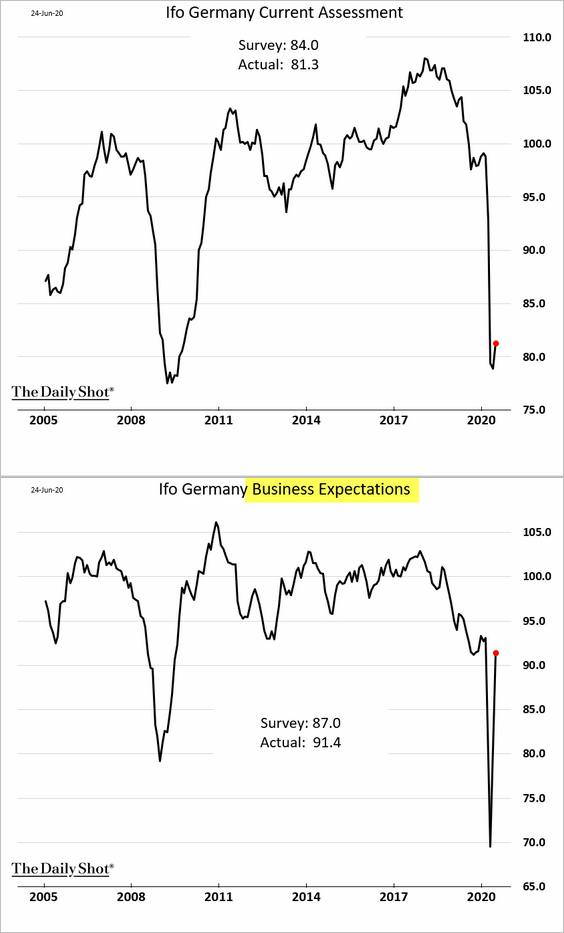
This rebound was primarily driven by manufacturing (chart in the upper left).
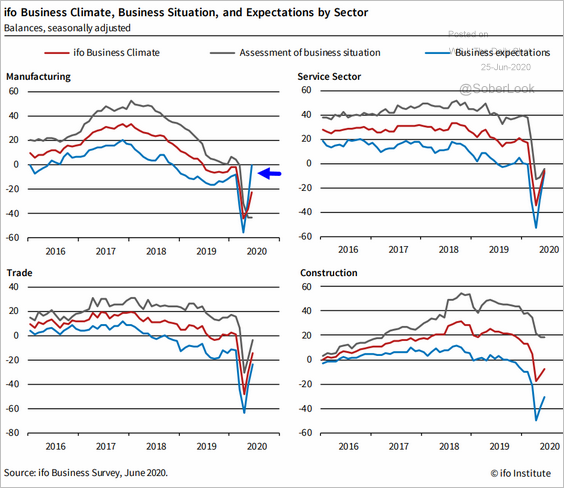 Source: ifo Institute
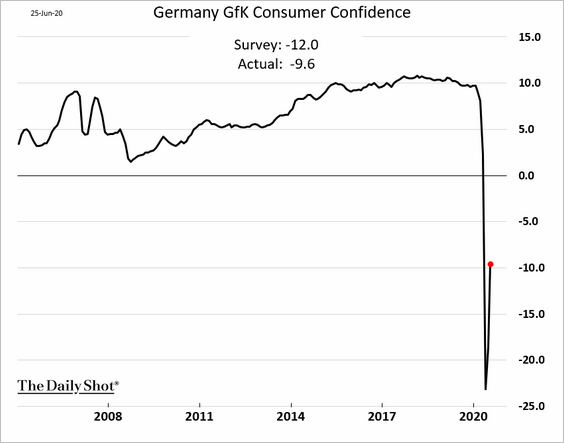
Germany’s consumer sentiment is rebounding as well.
——————–
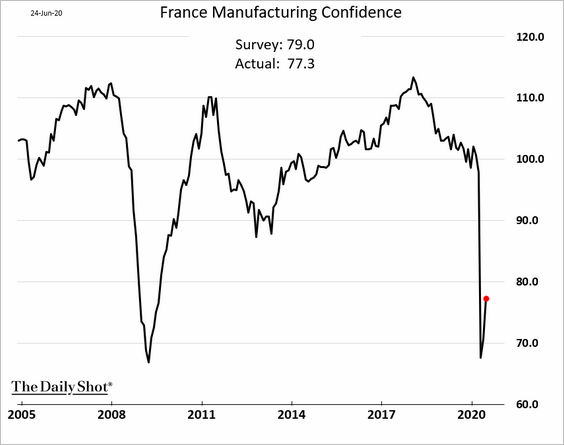
2. The bounce in French manufacturing confidence was weaker than expected.
3. Italy has been issuing large amounts of bills to cover crisis-related expenses.
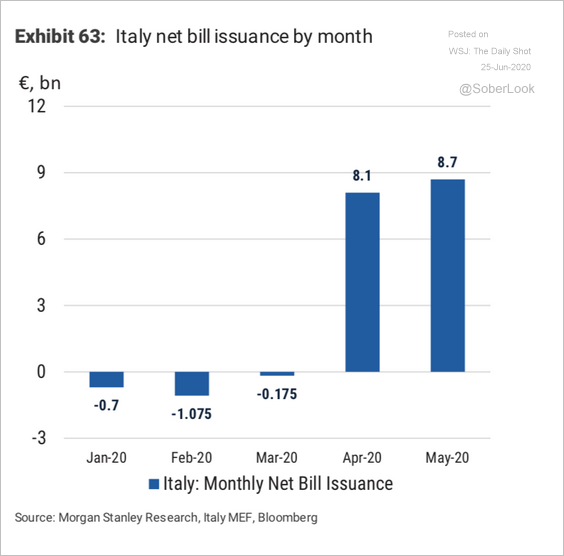 Source: Morgan Stanley Research
Bill issuance lowered the nation’s average debt maturity (WAM).
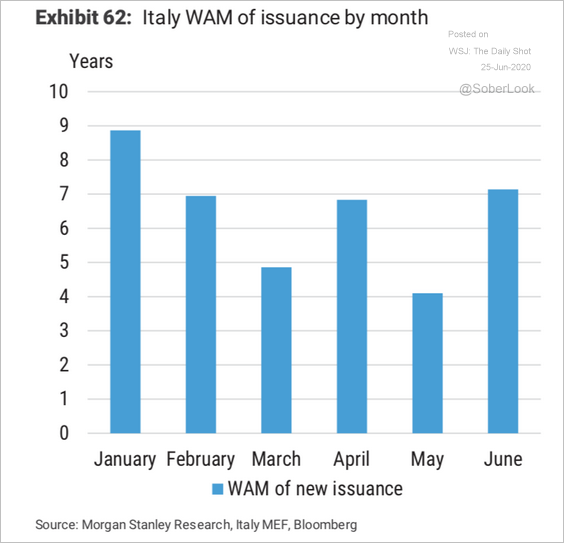 Source: Morgan Stanley Research
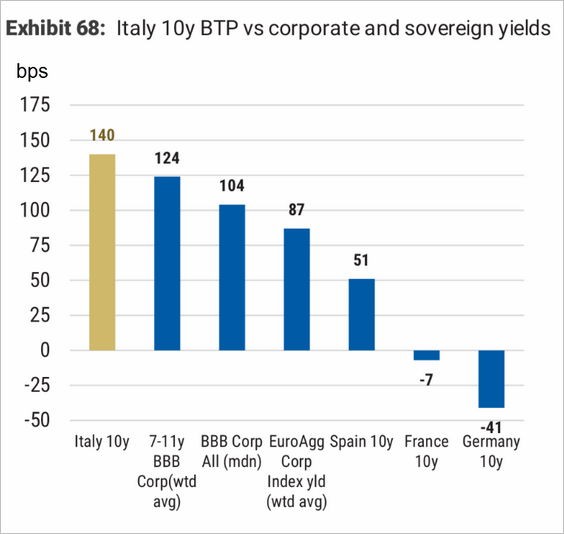
Italian spreads remain elevated relative to other debt markets, including corporate bonds.
Europe
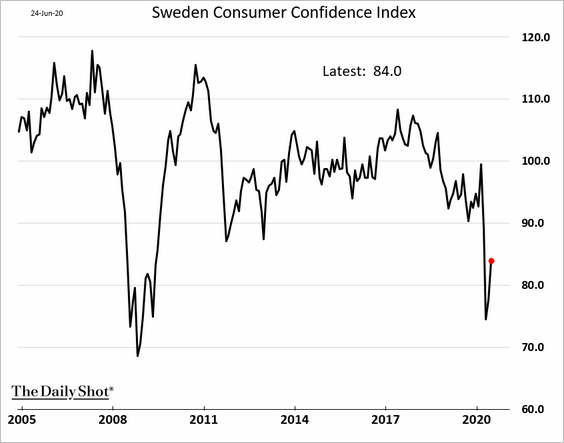
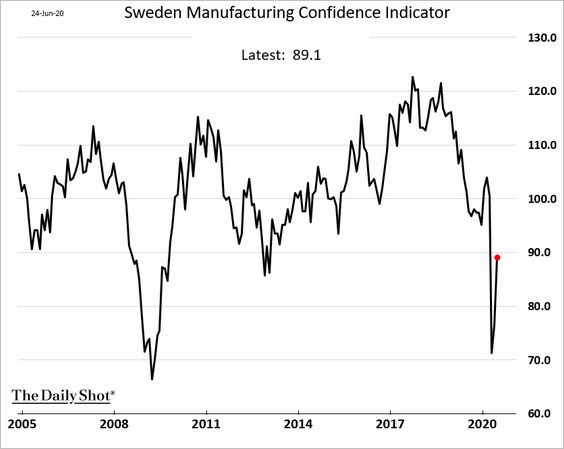
1. Sweden’s sentiment indicators showed improvement in June.
• Consumer:
• Manufacturing:
——————–
2. European household saving rates rose sharply this year.
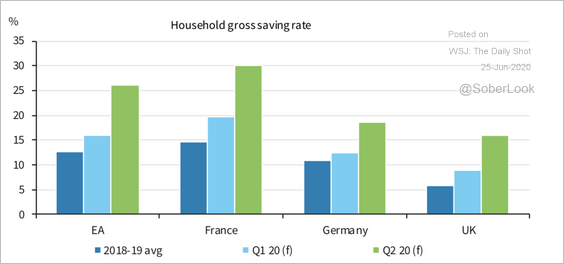 Source: Barclays Research
3. Here is the distribution of fiscal stimulus measures in the EU.
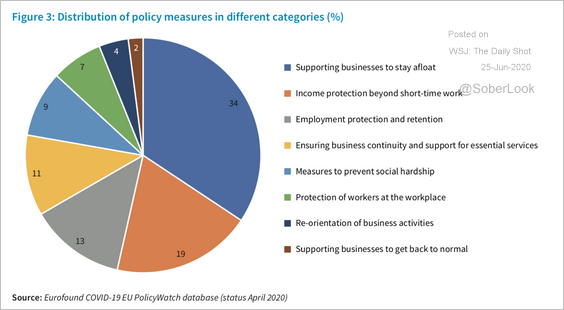 Source: Eurofound Read full article
Asia – Pacific
1. Singapore faces a record fiscal deficit in 2020.
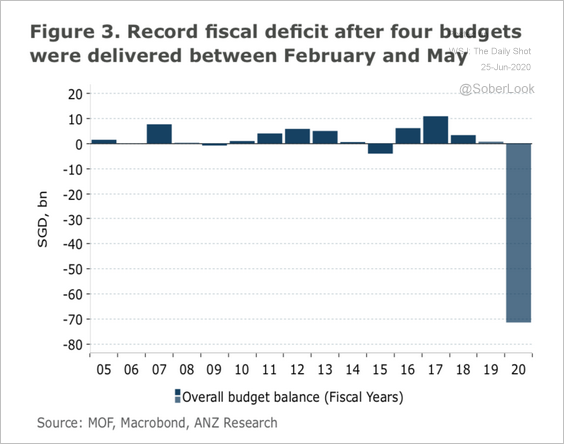 Source: ANZ Research
2. How much of a rebound in domestic demand will we see in Q3?
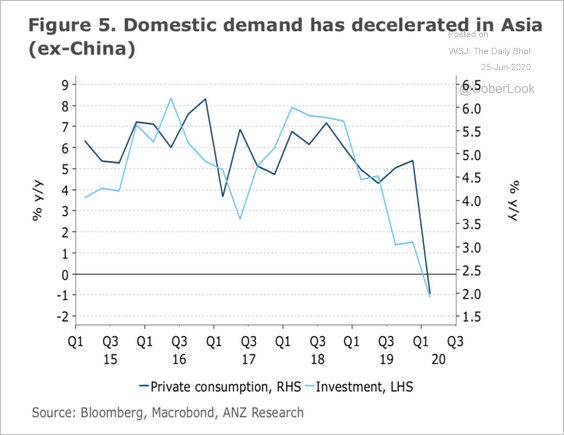 Source: ANZ Research
3. Next, we have some updates on Australia and New Zealand.
• The decline in Australia’s job vacancies through May was severe.
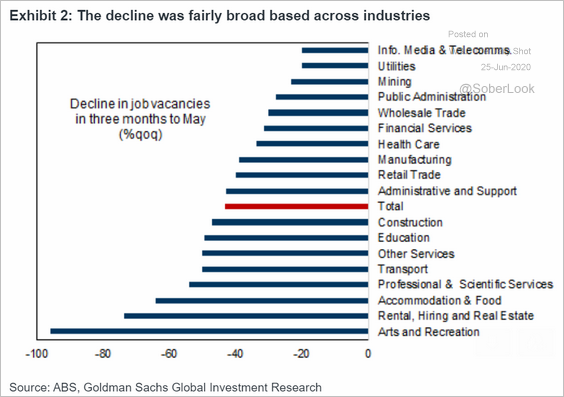 Source: Goldman Sachs
• Speculative accounts are adding to their long positions in Aussie and Kiwi dollars.
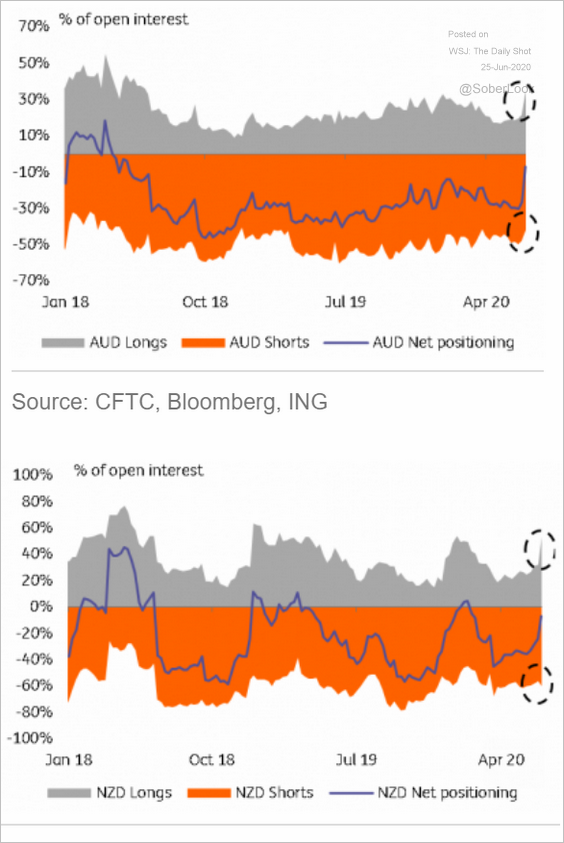 Source: ING
• Australia’s yield curve is the steepest in the developed world.
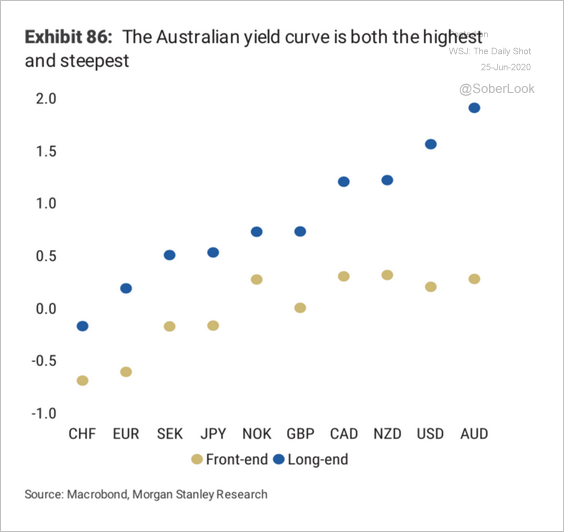 Source: Morgan Stanley Research
——————–
4. Interest rate differentials between Japan and the G10 average have narrowed over the past few years.
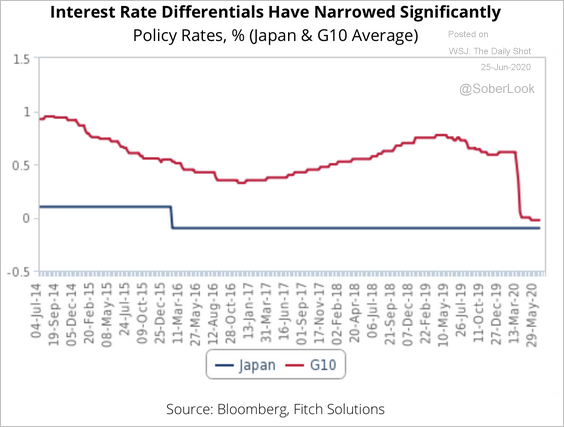 Source: Fitch Solutions Macro Research
5. Capital inflows could support the yen.
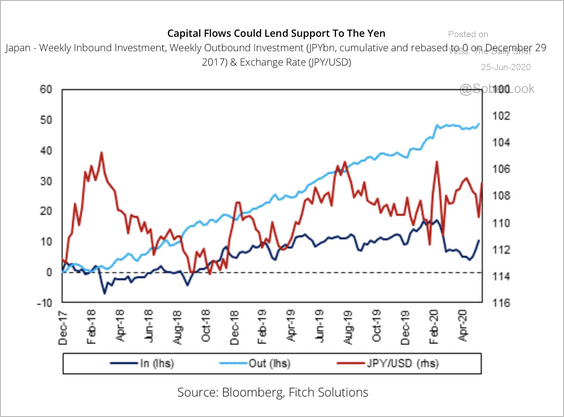 Source: Fitch Solutions Macro Research
Emerging Markets
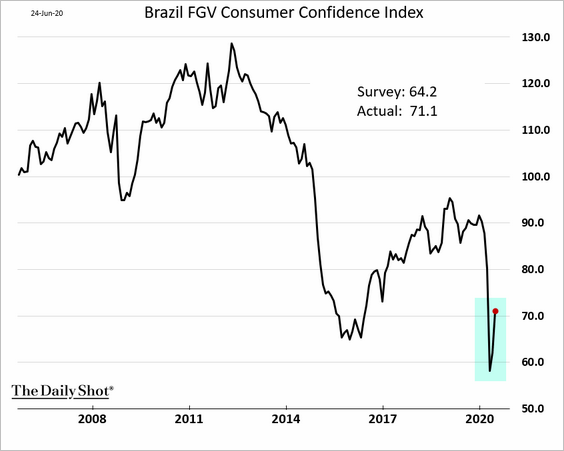
1. Brazil’s consumer confidence bounced from extreme lows.
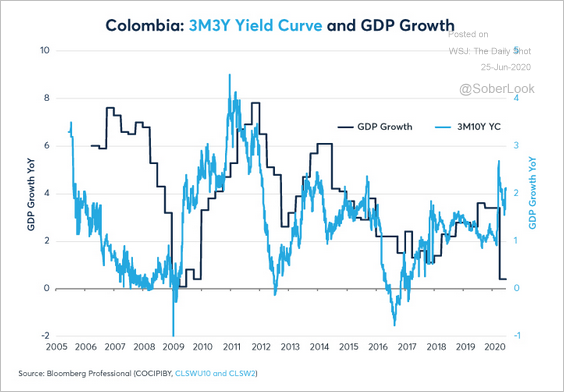
2. The collapse in Colombia’s retail sales and consumer confidence has been devastating.
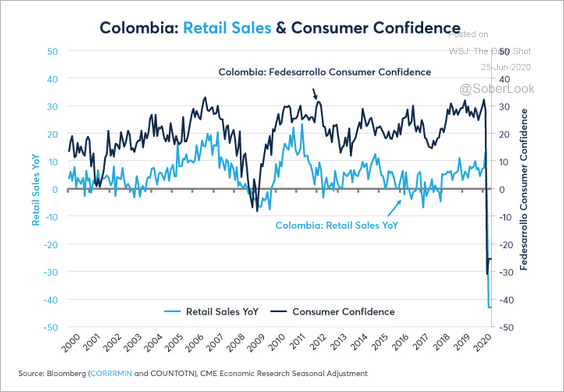 Source: CME Group Read full article
Colombia’s yield curve is the steepest since 2014, which could weigh on growth.
 Source: CME Group Read full article
——————–
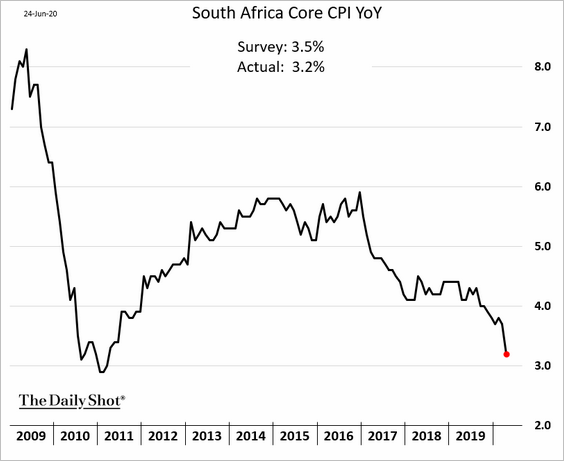
3. South Africa’s inflation surprised to the downside.
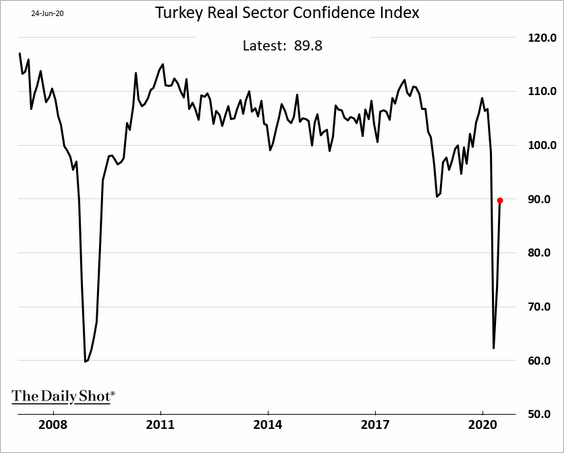
4. Turkey’s business confidence bounced from extreme lows.
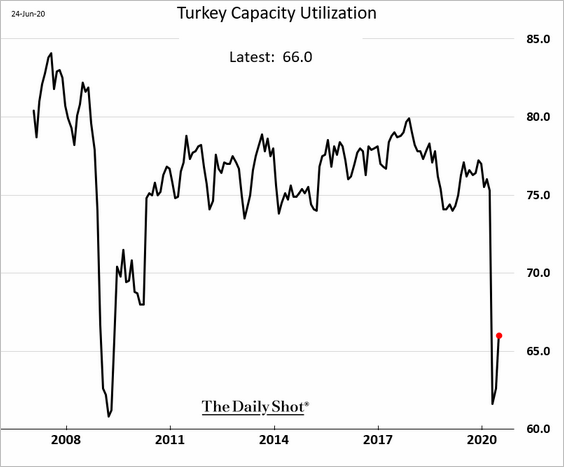
Capacity utilization remains depressed (66%).
——————–
5. Here are the components of India’s June SMI. Business activity remains deep in contraction territory.
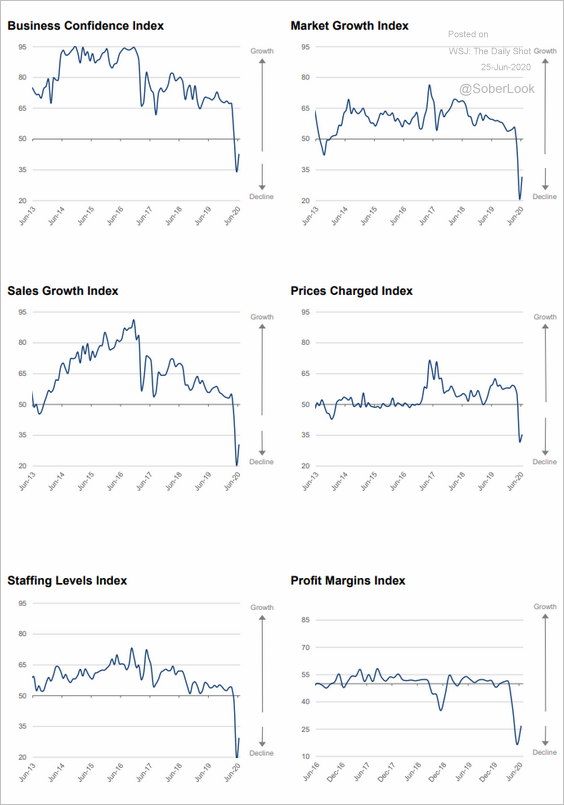 Source: World Economics
6. Indonesia’s unemployment has been surging.
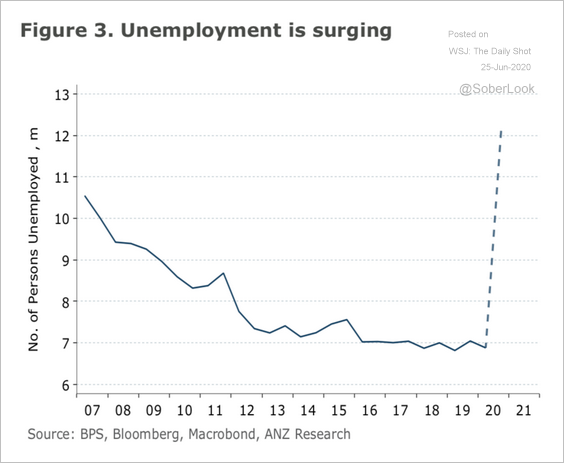 Source: ANZ Research
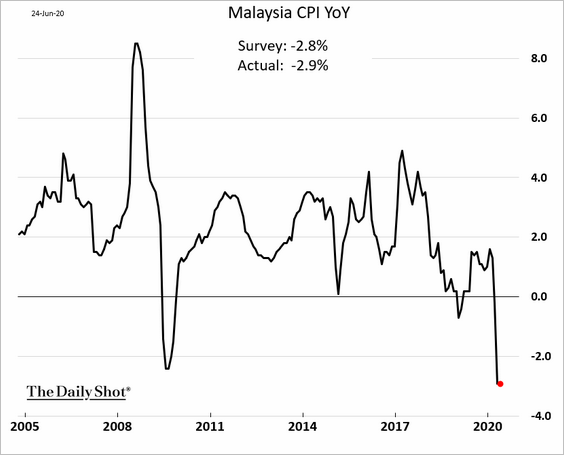
7. Malaysia’s record deflation did not ease last month.
8. Here is a summary of EM central banks’ policy responses this year.
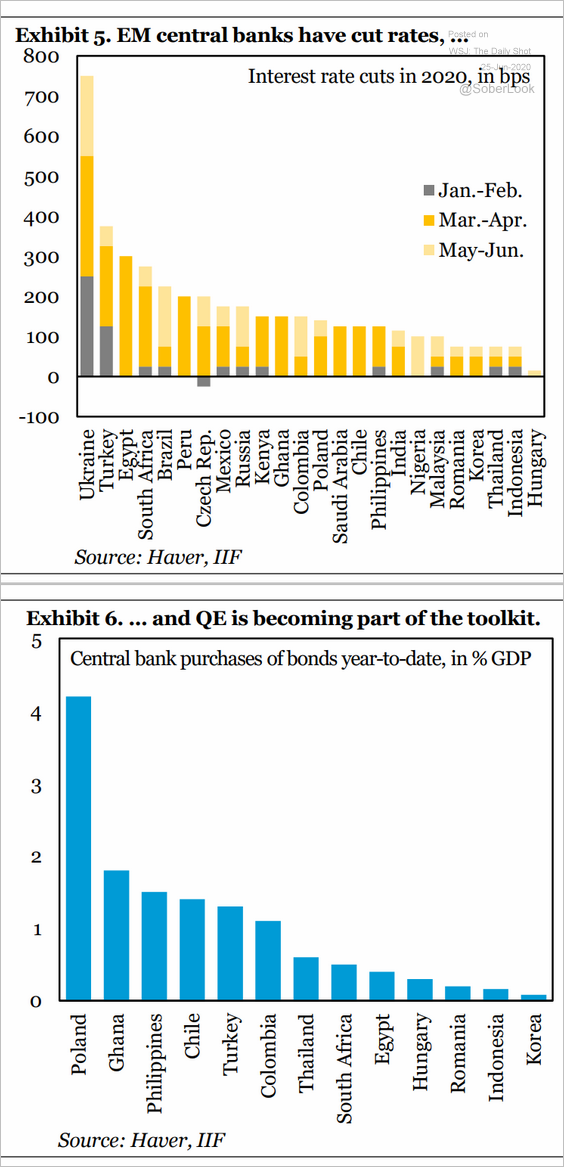 Source: IIF
Energy
1. Brent crude tumbled 5.4% on Wednesday and is testing support at $40/bbl.
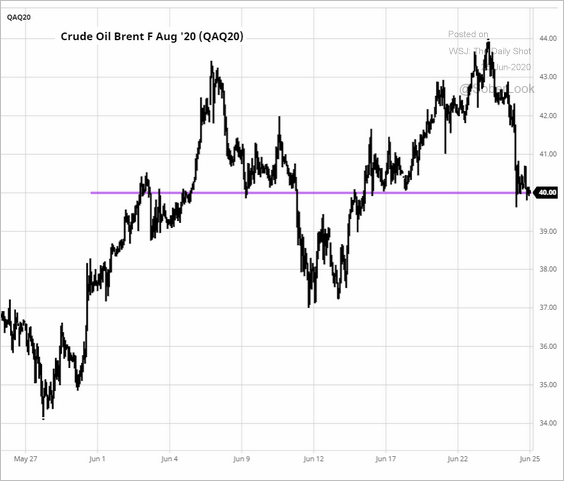 Source: barchart.com
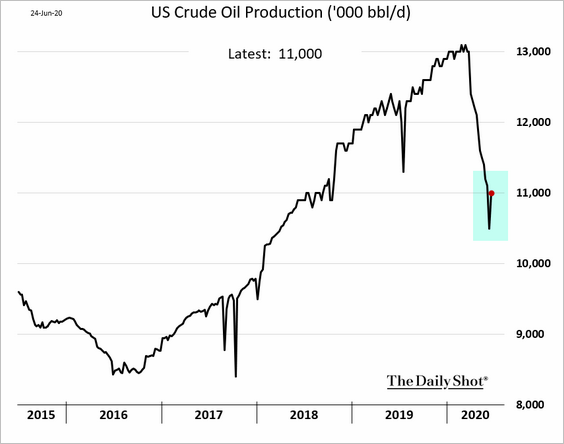
2. US crude oil production unexpectedly bounced last week.
3. Will US rig counts start increasing if oil prices recover further?
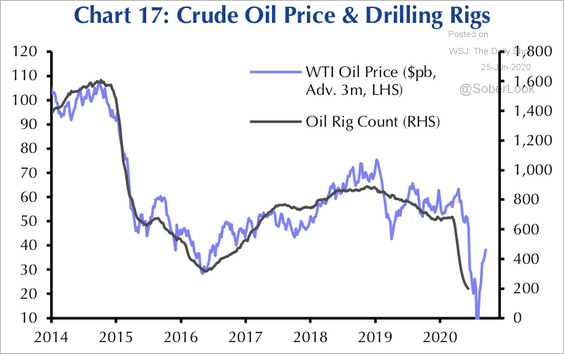 Source: Capital Economics
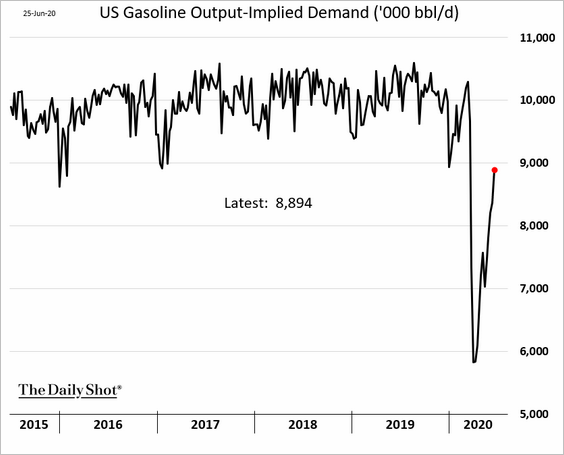
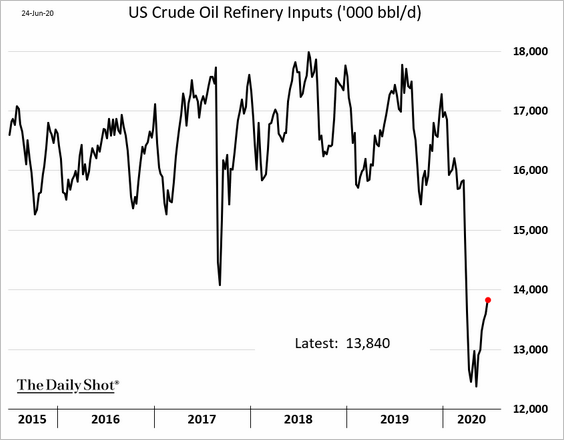
4. US gasoline demand continues to rebound.
Refinery runs are still soft.
Jet fuel demand appears to have bottomed.
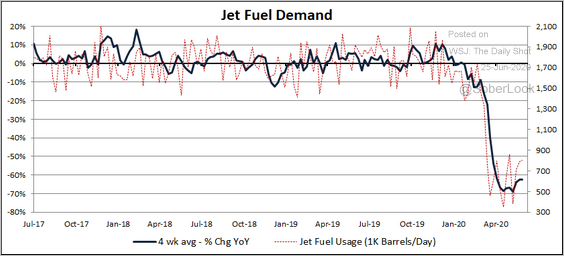 Source: @DoneDraperClone
——————–
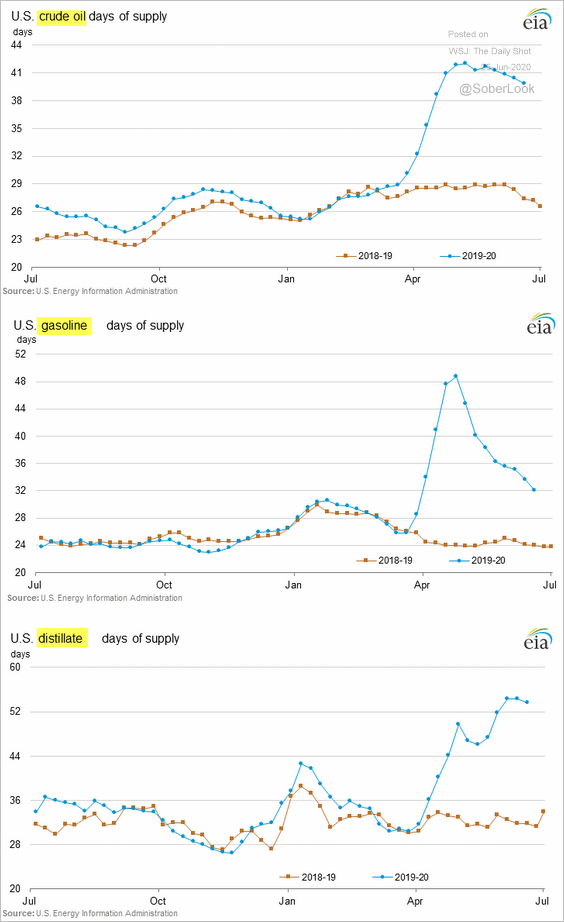
5. US crude oil stockpiles hit another record high.
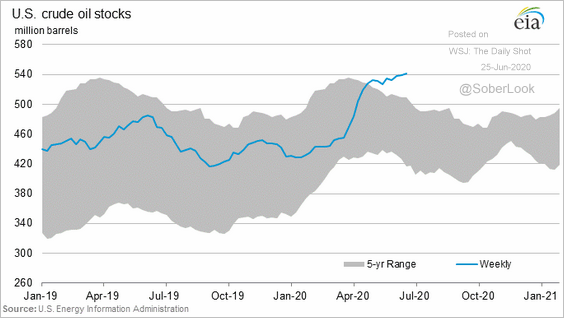
But inventories are drifting lower when measured in days of supply.
——————–
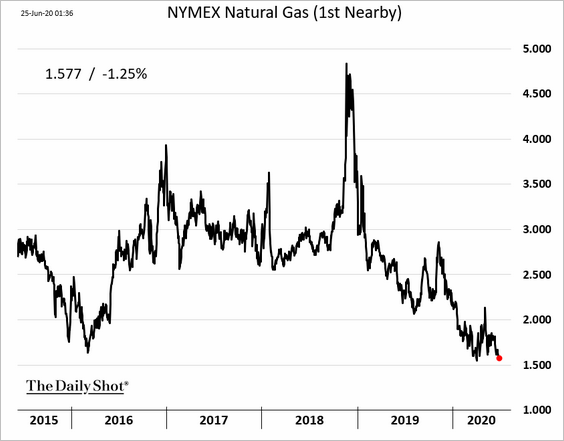
6. US natural gas futures are nearing multi-year lows.
Equities
1. Wednesday was a tough day for stocks as pandemic-related concerns reemerged.
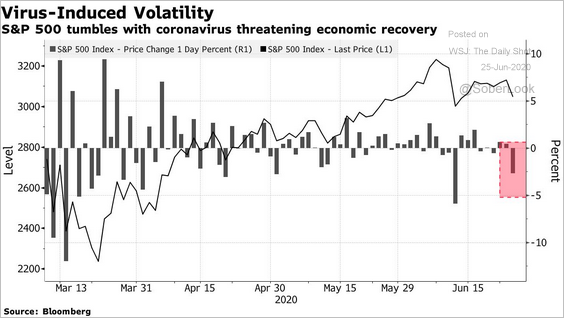 Source: @markets Read full article
The “stay-at-home” basket has been outperforming,
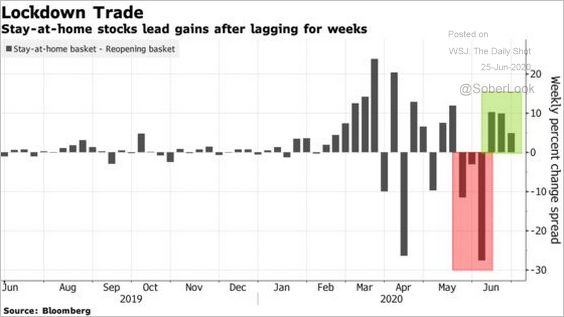 Source: @markets Read full article
——————–
2. Earnings estimates appear to have stabilized.
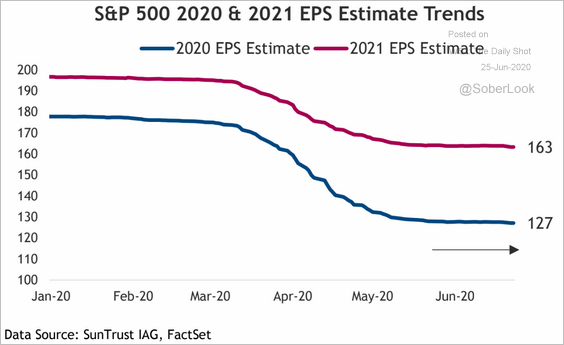 Source: SunTrust Private Wealth Management
This chart shows the S&P 500 earnings forecasts from Yardeni Research (which are below consensus).
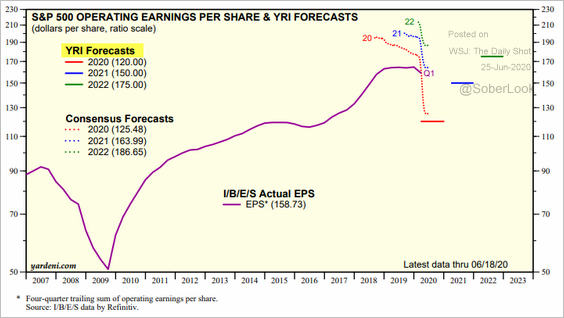 Source: Yardeni Research
And here are the growth estimates for Q2 2020 by sector.
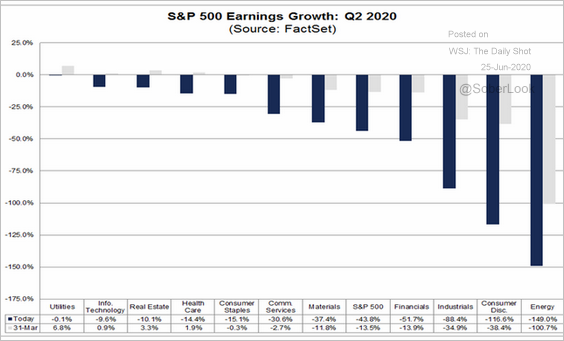 Source: @FactSet Read full article
——————–
3. The S&P 500 dividend yield remains above the 10yr Treasury yield.
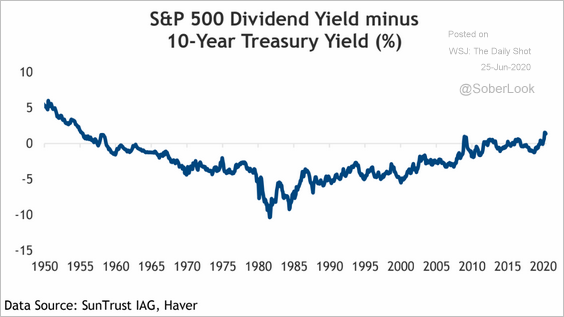 Source: SunTrust Private Wealth Management
4. This chart compares the S&P 500 to the US truck tonnage index.
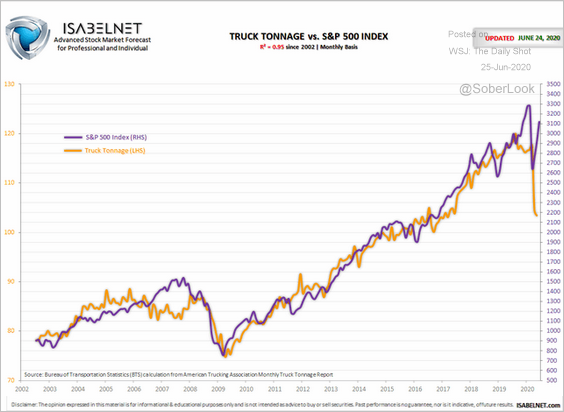 Source: @ISABELNET_SA
5. The US market’s outperformance vs. the rest of the world has been unprecedented.
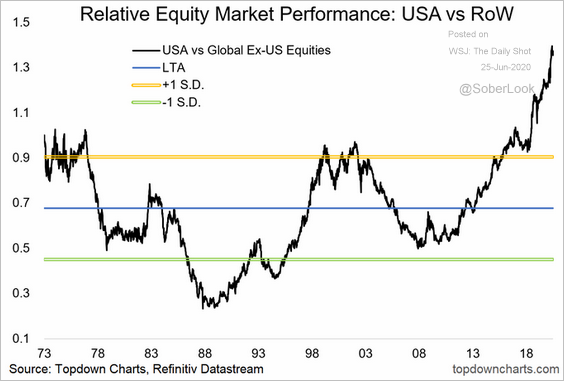 Source: @topdowncharts Read full article
6. The equity market’s inverse correlation to the US dollar is near extreme levels.
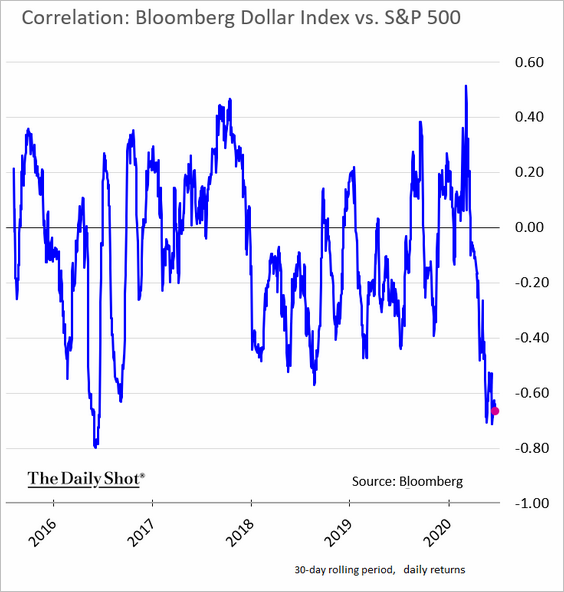 h/t Michael Brown, Caxton
7. The value line median price-to-equity ratio reached an all-time high.
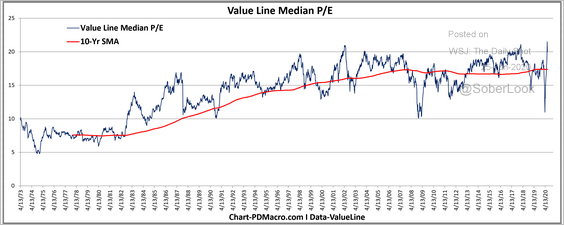 Source: @DavidTaggart
Rates
1. Bullish sentiment on Treasuries is nearing past cyclical peaks.
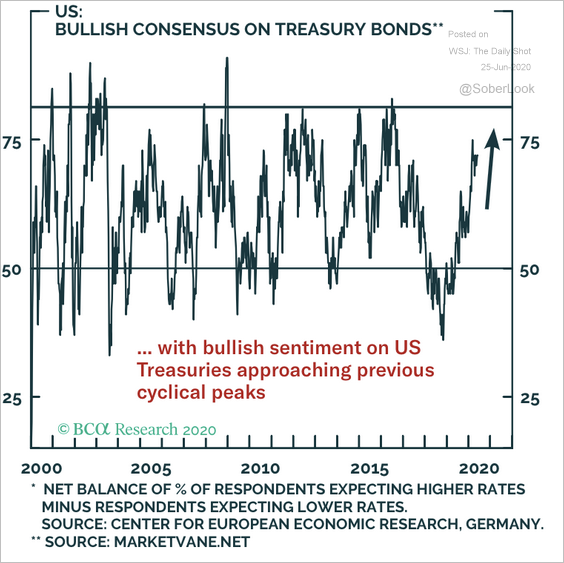 Source: BCA Research
2. Who are the largest foreign holders of Treasuries?
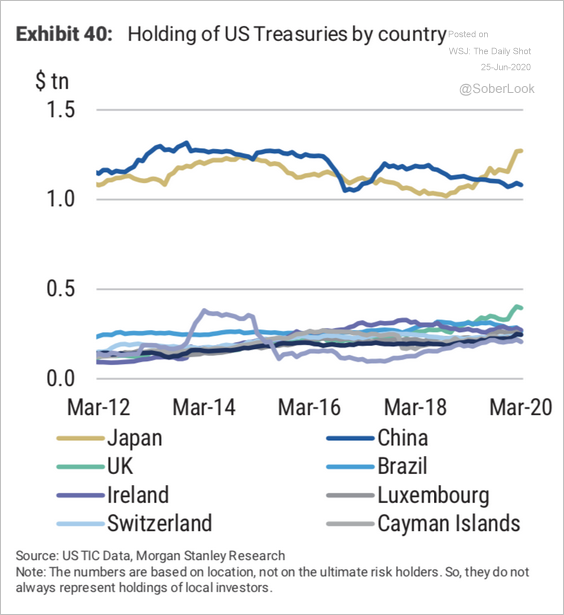 Source: Morgan Stanley Research
3. US real money supply growth hit the highest level since the early 1940s.
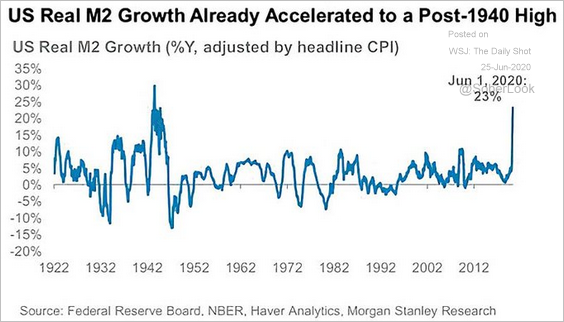 Source: @ISABELNET_SA, @MorganStanley
Global Developments
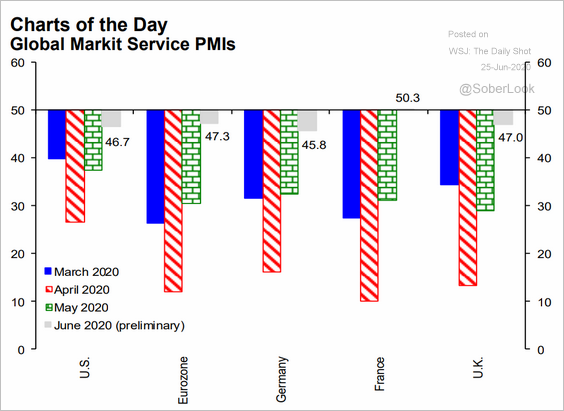
1. Service sector activity has been stabilizing.
 Source: Hugo Ste-Marie, Portfolio & Quantitative Strategy Global Equity Research, Scotia Capital
2. The IMF now sees a deeper 2020 recession than its April estimate.
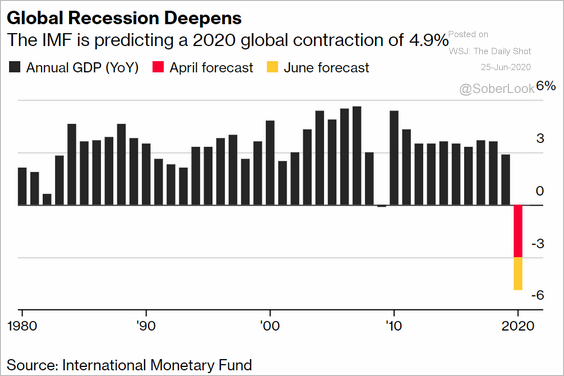 Source: @markets Read full article
Here are the GDP trajectories for advanced and emerging economies.
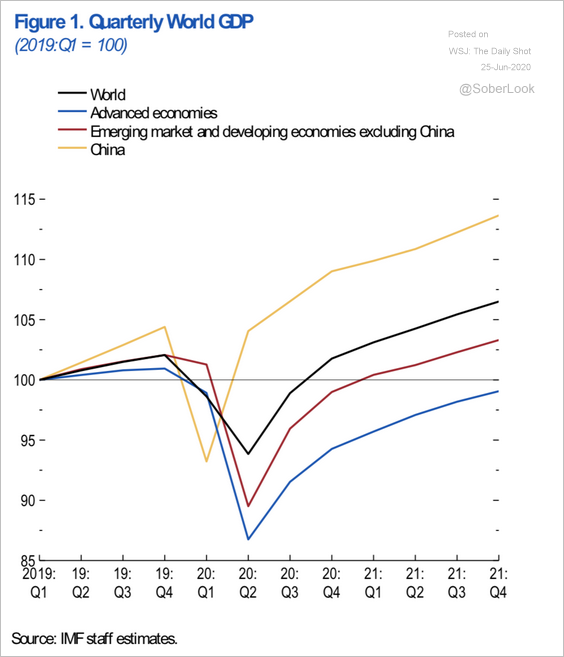 Source: IMF Read full article
——————–
3. Commercial property prices in the US and Europe are falling.
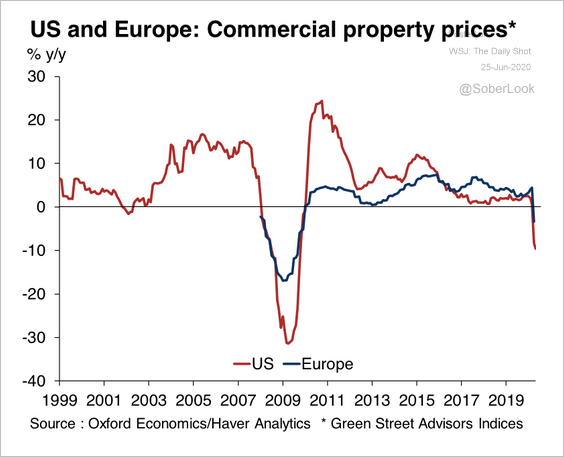 Source: Oxford Economics
——————–
Food for Thought
1. US personal incomes derived from government benefits:
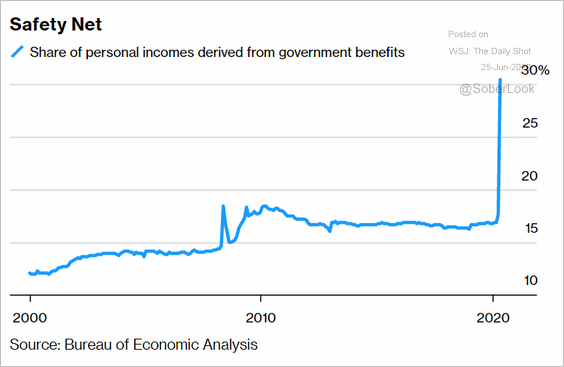 Source: @markets Read full article
2. Who has benefitted the most from the US stimulus bill?
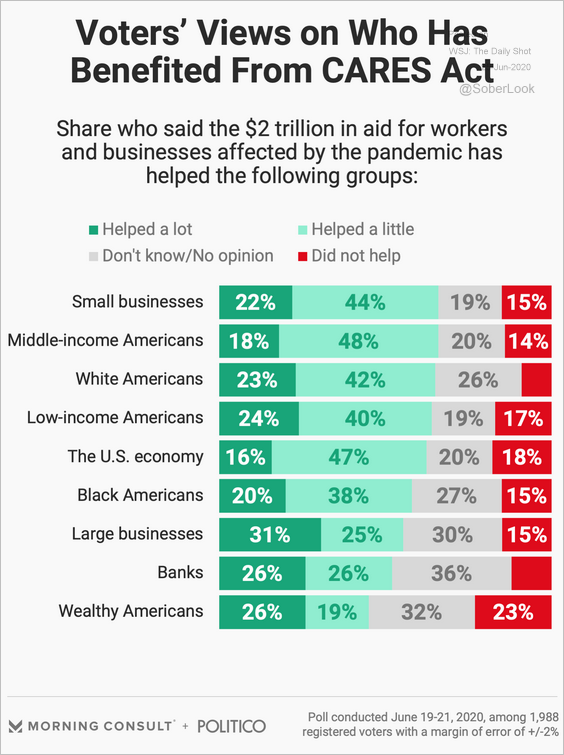 Source: Morning Consult Read full article
3. The global tourism industry (2 charts):
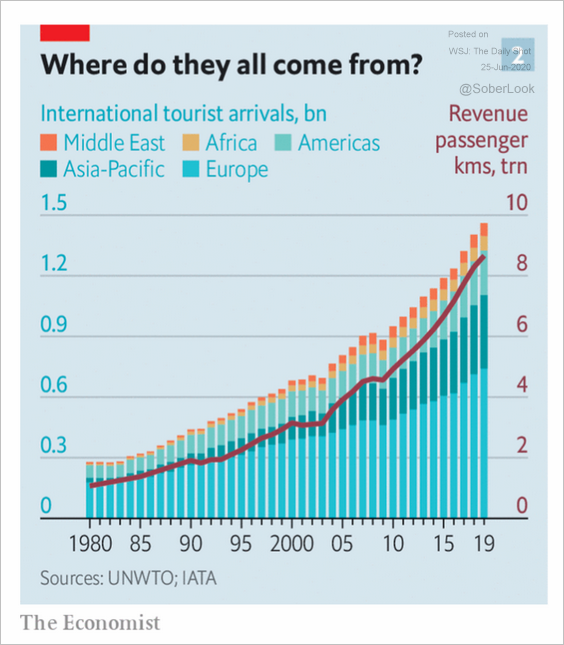 Source: @adam_tooze, The Economist Read full article
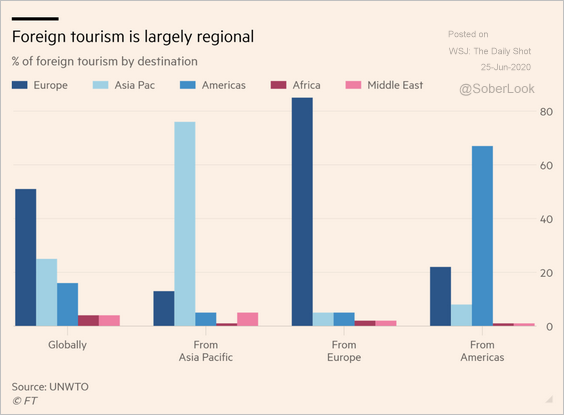 Source: @financialtimes Read full article
——————–
4. Changes in approval ratings of global leaders:
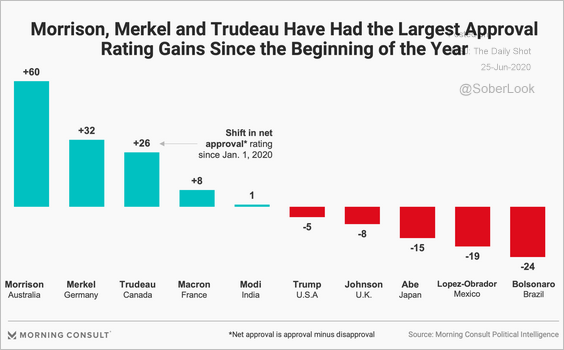 Source: Morning Consult Read full article
5. Perceptions of the most pressing problems in the US:
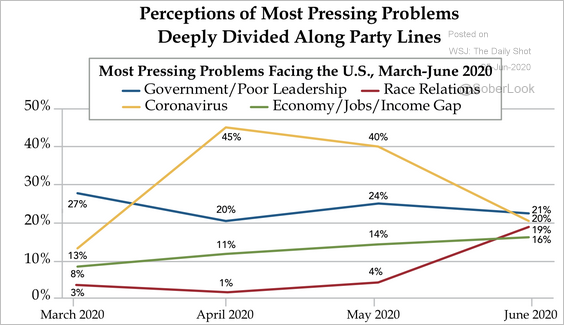 Source: The Daily Feather
6. Prime-age foreign-born people in the US (% of the prime-age population):
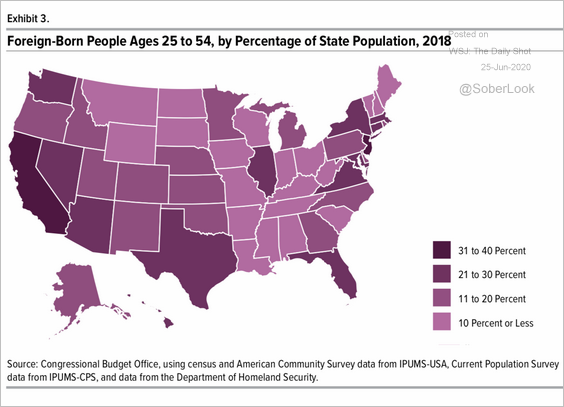 Source: CBO Read full article
7. Support for returning to lockdowns:
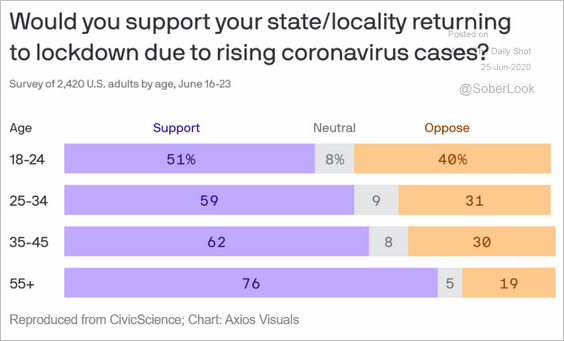 Source: @axios Read full article
8. Mask-wearing requirements:
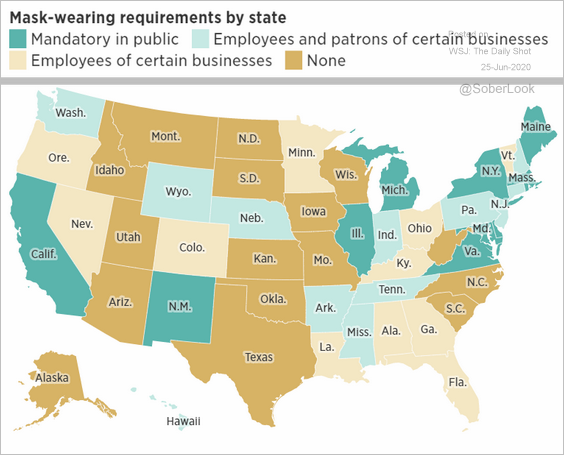 Source: @jduchneskie, @phillyinquirer Read full article
9. The most popular sheet music:
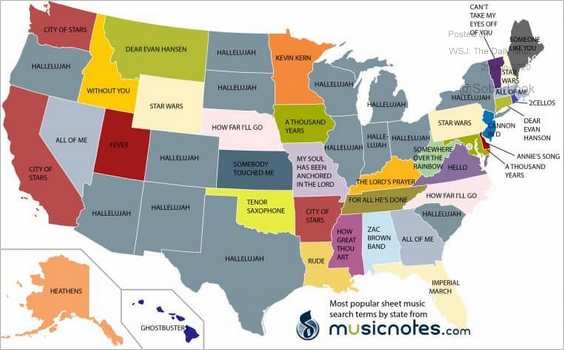 Source: Musicnotes, Inc. Read full article
——————–