
The Daily Shot: 08-Jul-20
• The United States
• The Eurozone
• Europe
• Asia – Pacific
• China
• Emerging Markets
• Commodities
• Energy
• Equities
• Credit
• Global Developments
• Food for Thought
The United States
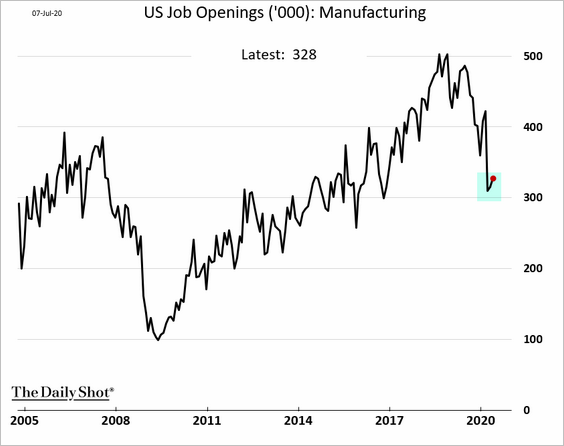
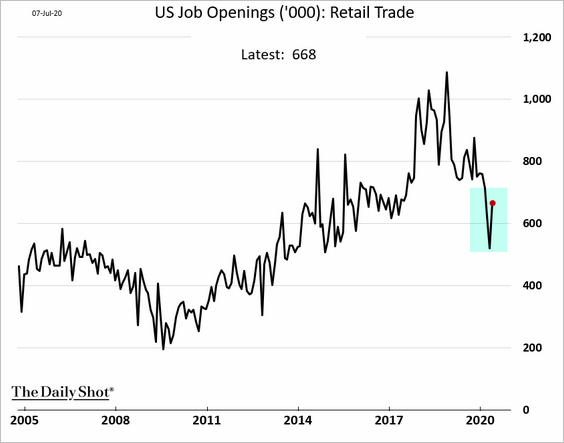
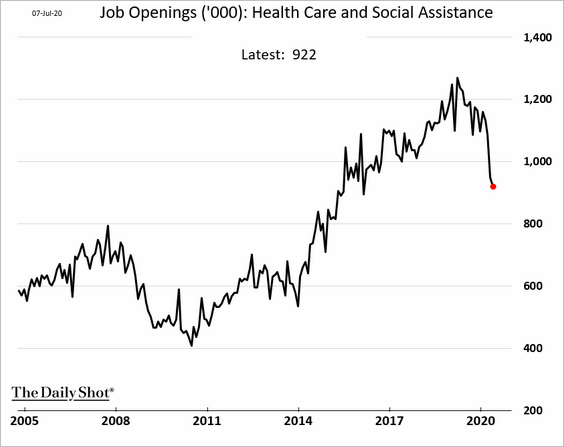
1. In another upside economic surprise, job openings unexpectedly increased in May.
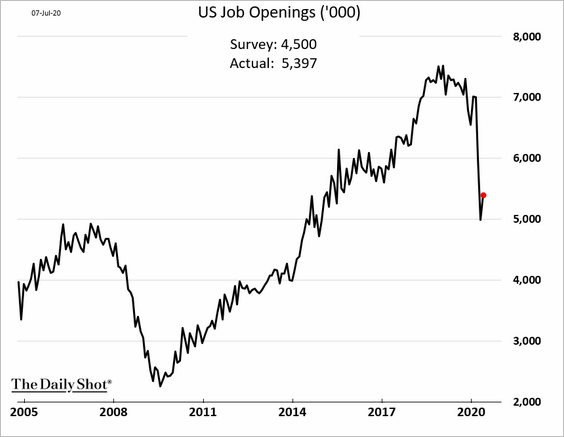
Here are some of the trends, by sector.
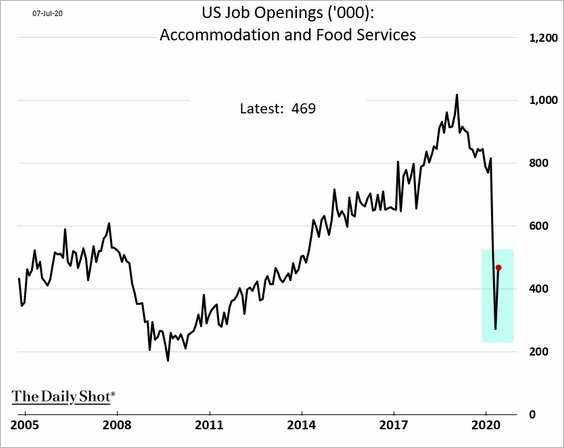
– Restaurants/hotels:
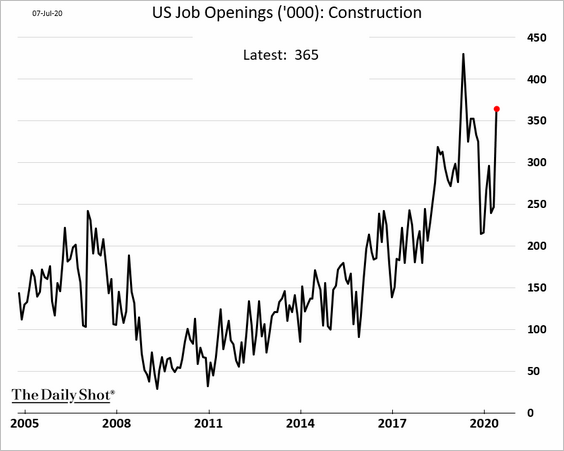
– Construction:
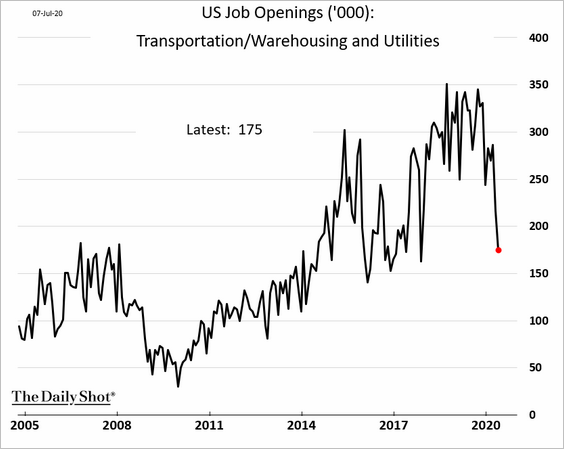
– Logistics:
– Manufacturing:
– Retail:
– Healthcare:
——————–
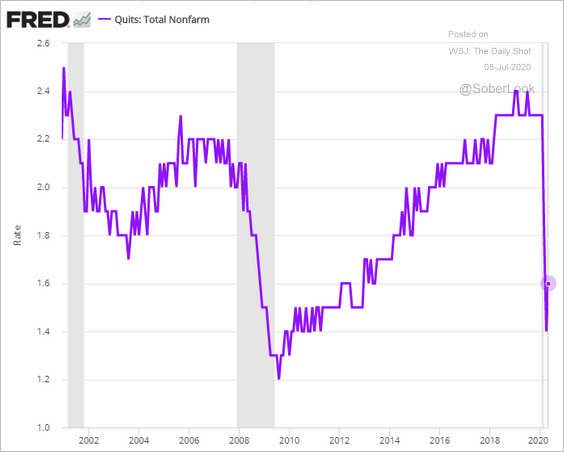
• Voluntary separations increased from multi-year lows.
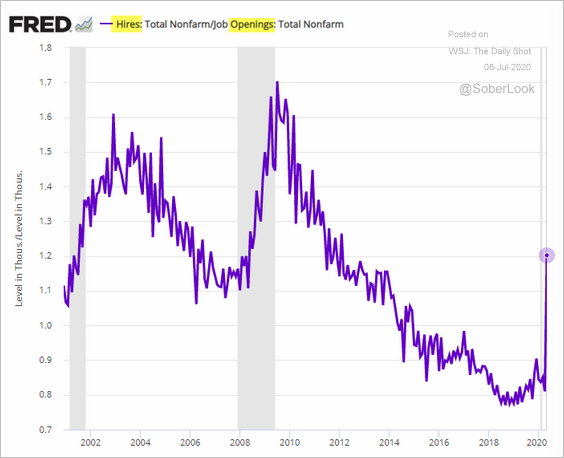
• The hires-to-openings ratio jumped as furloughed workers returned.
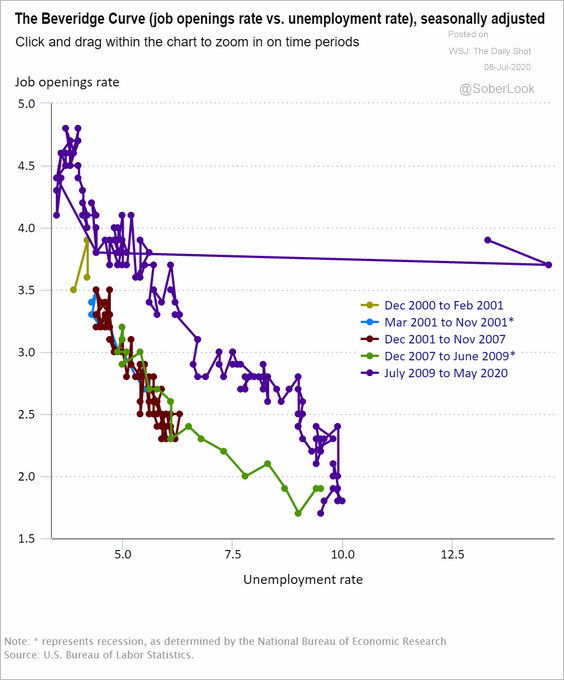
• Here is the Beveridge curve.
 Source: BLS
——————–
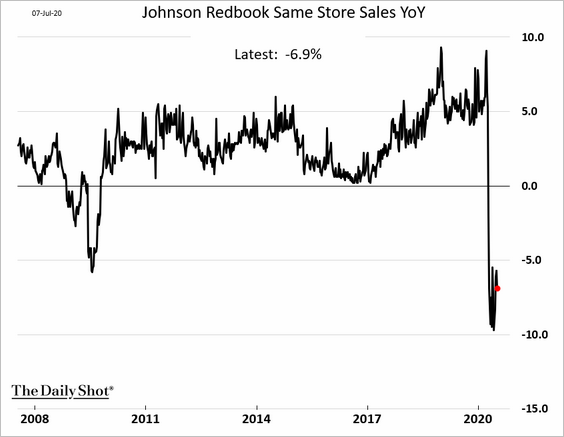
2. The Johnson Redbook index of same-store sales is yet to see a meaningful rebound.
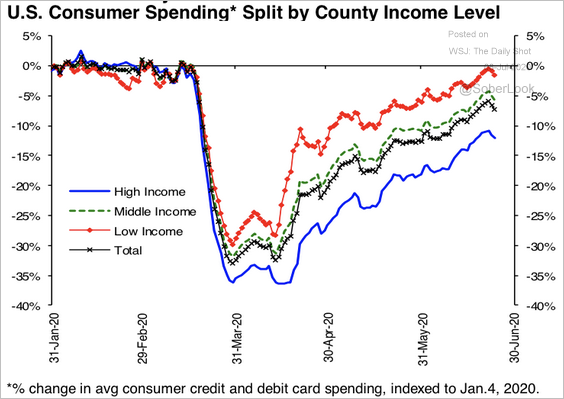
4. Spending by low-income consumers is back to pre-crisis levels.
 Source: Hugo Ste-Marie, Portfolio & Quantitative Strategy Global Equity Research, Scotia Capital
5. Government assistance has helped boost disposable personal income in April and May, …
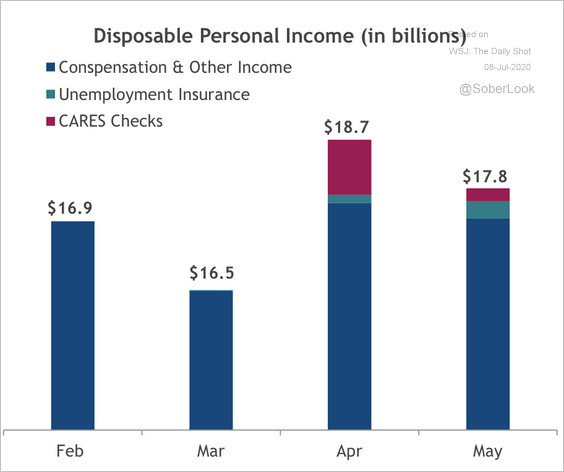 Source: SunTrust Private Wealth Management
… which resulted in an unprecedented surge in bank deposits. Some analysts have suggested that this increase also boosted speculative stock/options trading by retail investors.
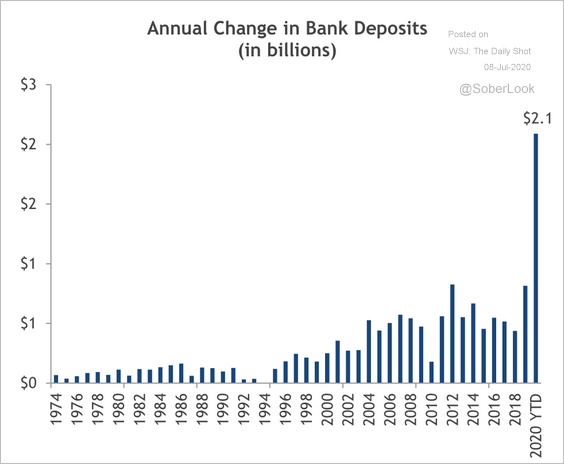 Source: SunTrust Private Wealth Management
——————–
6. COVID-related government assistance for states and municipalities has a relatively long tail.
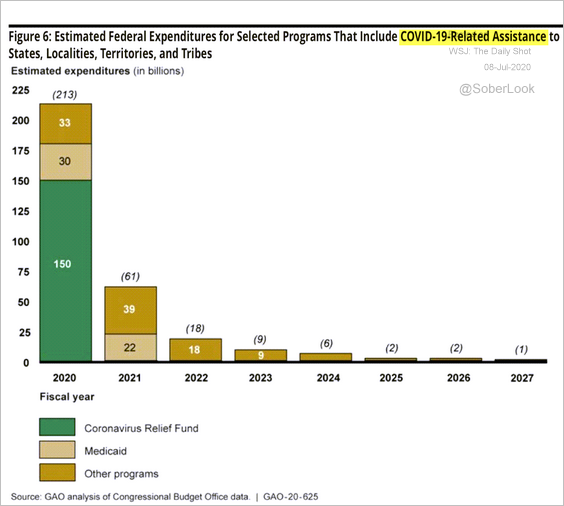 Source: GAO
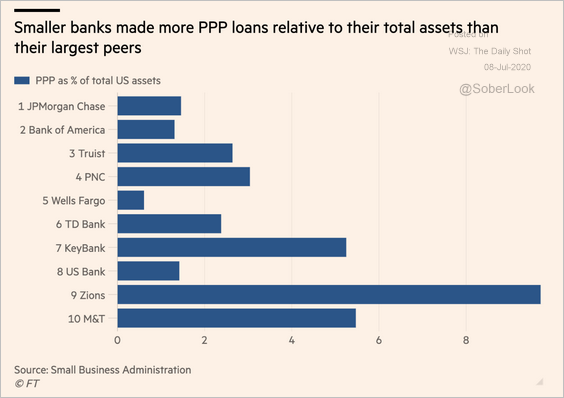
7. Here is the distribution of PPP loans by loan size.
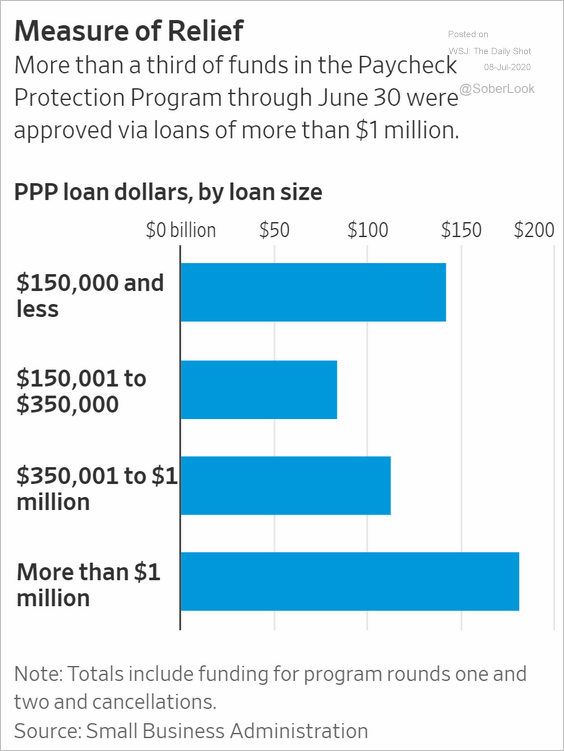 Source: @WSJ Read full article
US regional banks punched above their weight in providing PPP financing.
 Source: @financialtimes Read full article
The Eurozone
1. Will the recent spike in liquidity boost European shares?
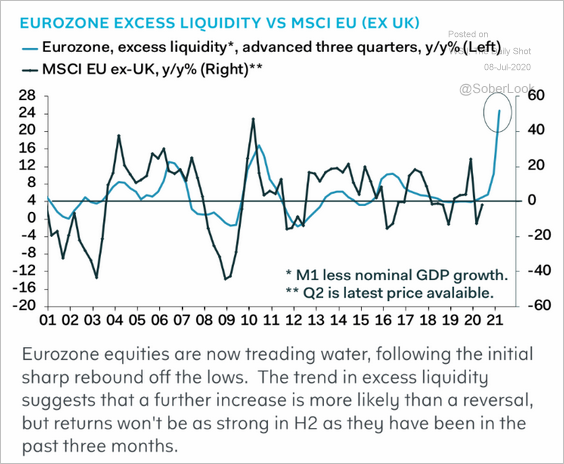 Source: Pantheon Macroeconomics
The Euro Stoxx 50 index has been testing resistance at the 200-day moving average.
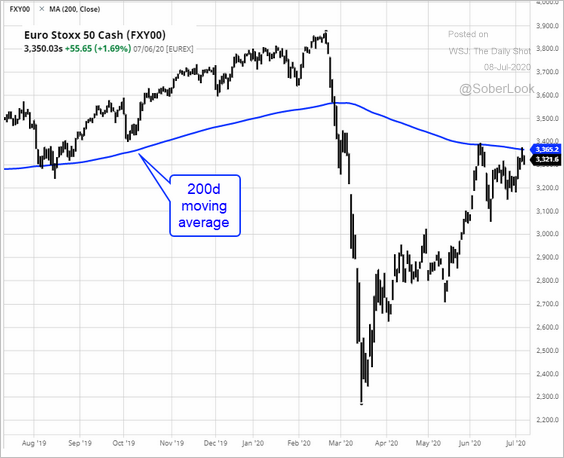 Source: barchart.com, {h/t} Jan-Patrick Barnert
——————–
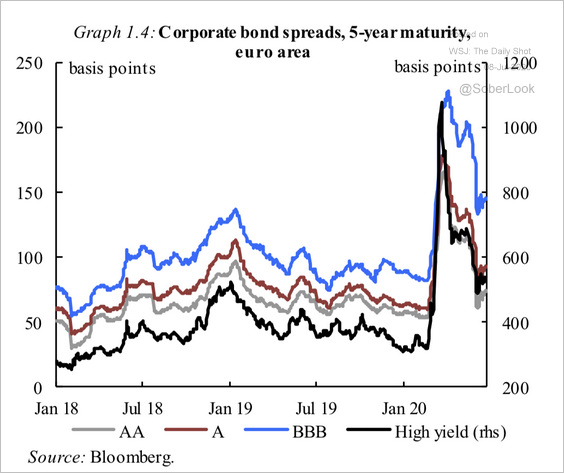
2. This chart shows euro-area corporate bond spreads by rating.
 Source: European Commission Read full article
3. The ECB has closed the funding gap for euro-area governments.
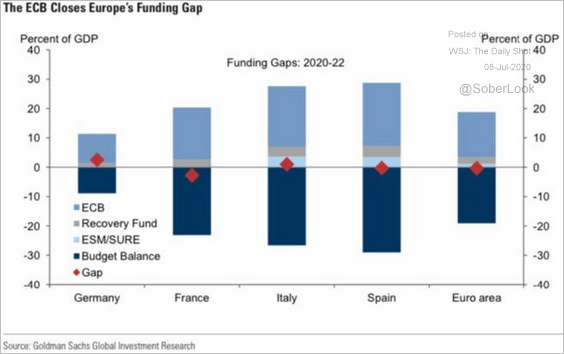 Source: Goldman Sachs
By the way, public and private debt levels were relatively steady going into the crisis.
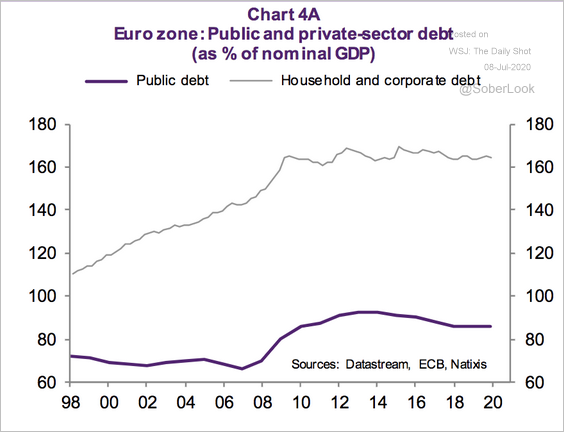 Source: Natixis
——————–
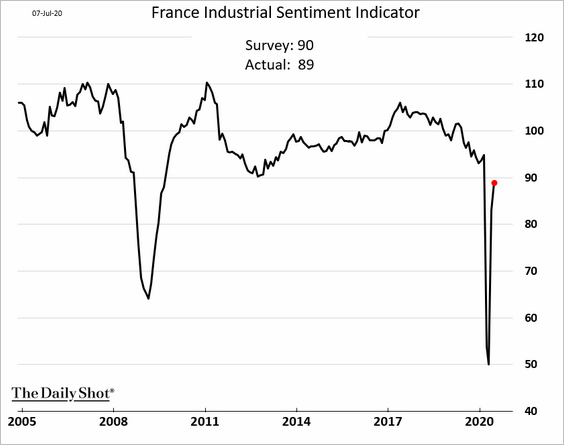
4. French industrial confidence continues to recover.
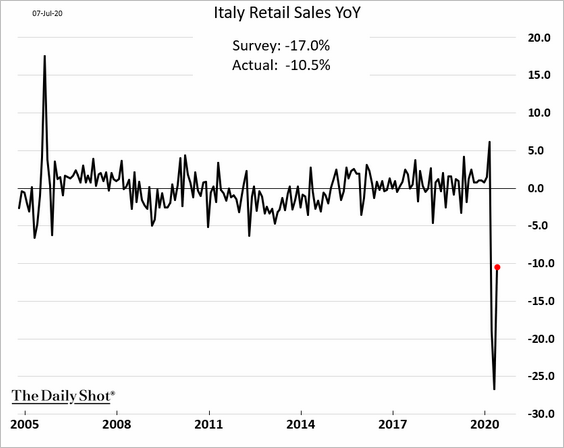
5. Italian retail sales surged in May but were still down 10% from 2019.
6. The European Commission is now estimating the 2020 GDP contraction at 8.7%.
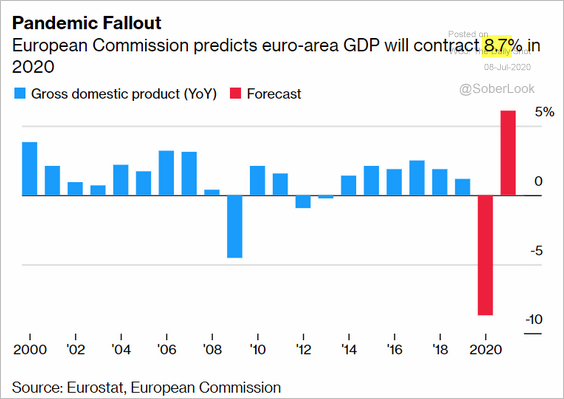 Source: @business Read full article
Europe
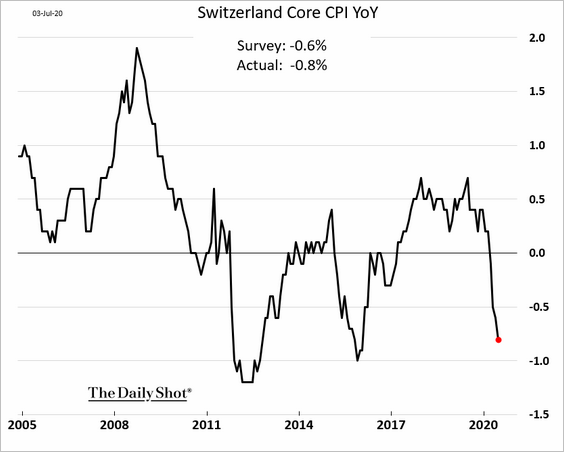
1. Switzerland’s deflation deepens.
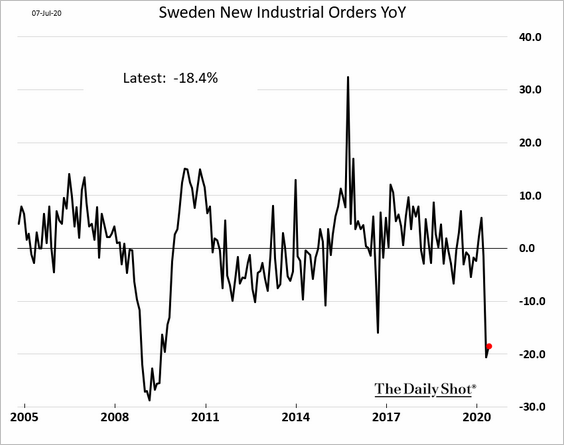
2. Sweden’s industrial production barely changed in May.
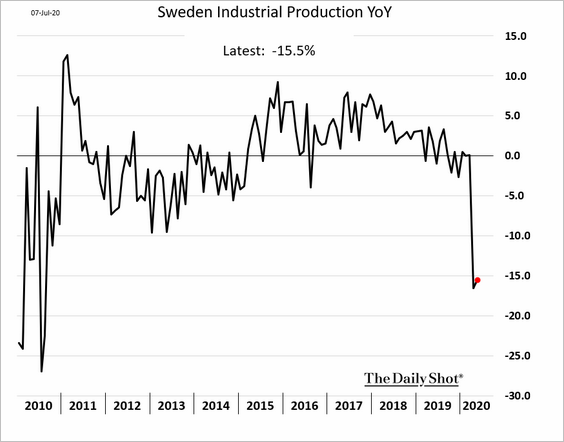
New orders remained weak.
——————–
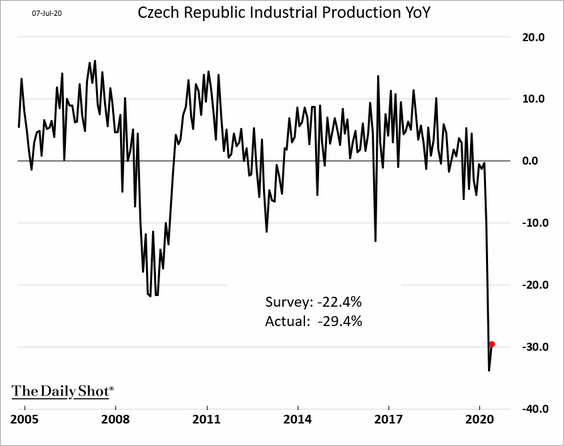
3. The contraction in Czech industrial output has been unprecedented.
4. However, key industrial sectors returned to growth in June.
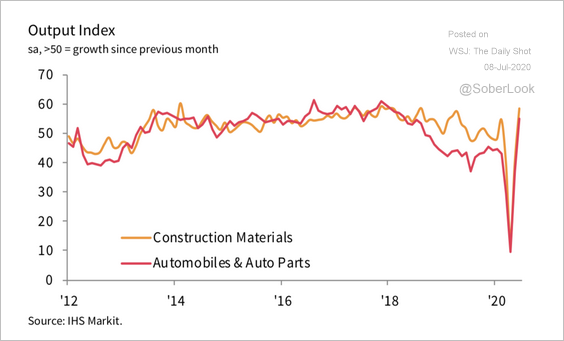 Source: IHS Markit Read full article
5. This map shows life expectancy across Western and Central Europe.
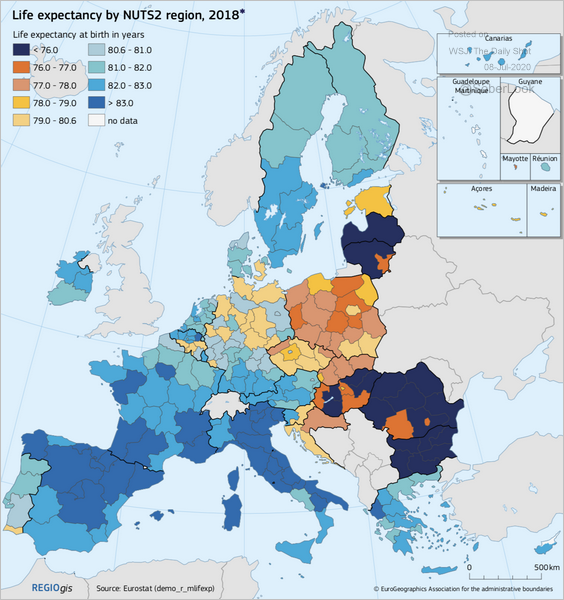 Source: European Commission Read full article
Asia – Pacific
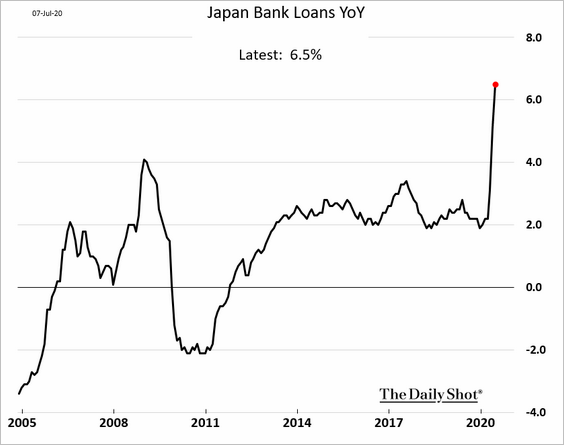
1. Japan’s loan growth accelerated as companies sought liquidity.
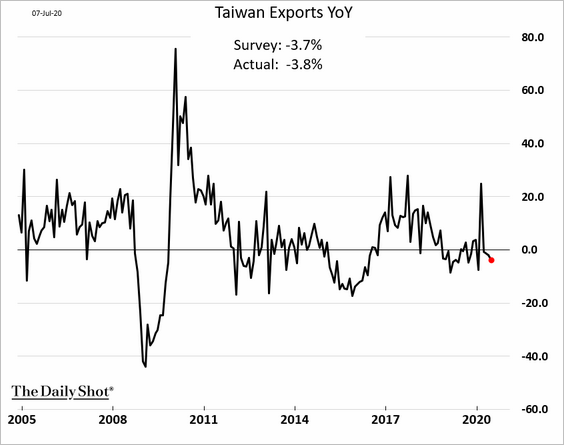
2. Taiwan’s exports slowed last month.
China
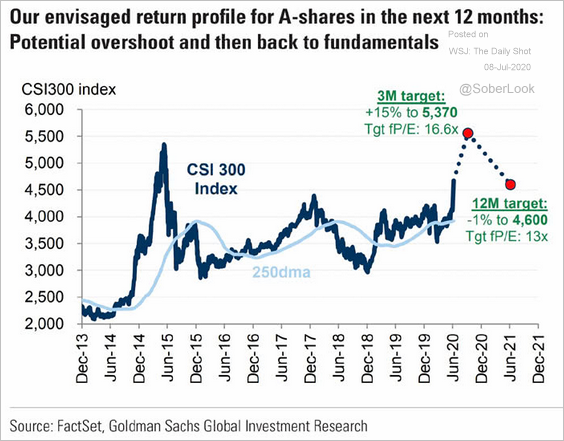
1. Here is Goldman’s forecast for China’s stock market.
 Source: @ISABELNET_SA, @GoldmanSachs
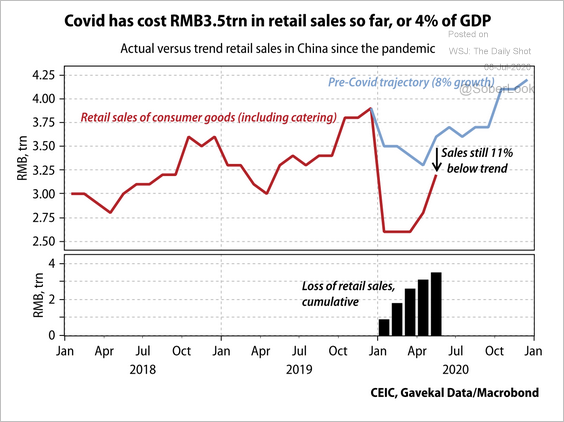
2. Retail sales have been recovering but remain well below previous trend growth.
 Source: Gavekal
Delayed purchases will contribute to above-trend auto sales growth in the coming months, according to Gavekal.
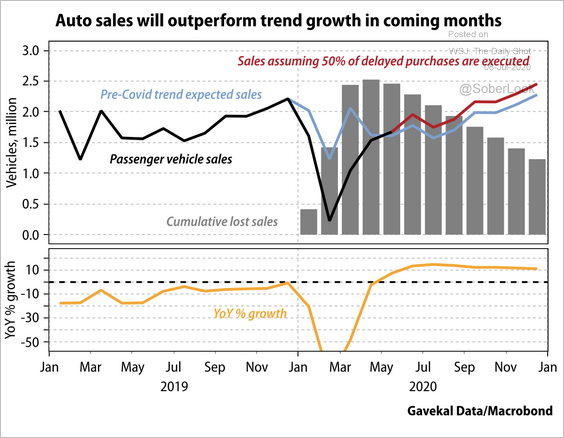 Source: Gavekal
——————–
3. This chart shows China’s imports from the US relative to the Phase-1 deal targets.
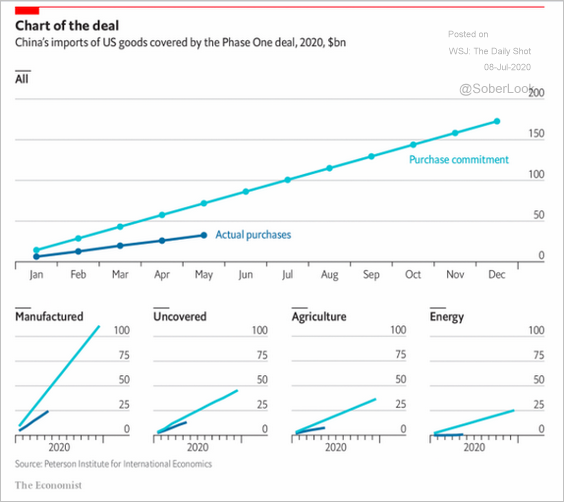 Source: @acemaxx, @TheEconomist Read full article
4. China’s asset management industry continues to expand.
• Mutual funds have a greater weight in China’s household financial assets.
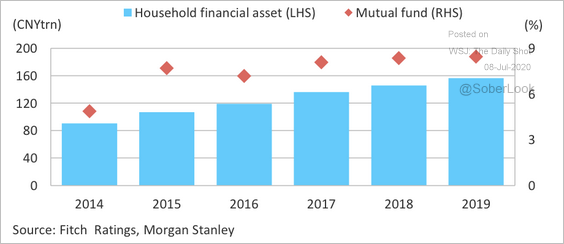 Source: Fitch Ratings
• Here are the top 10 mutual fund asset managers, according to Fitch.
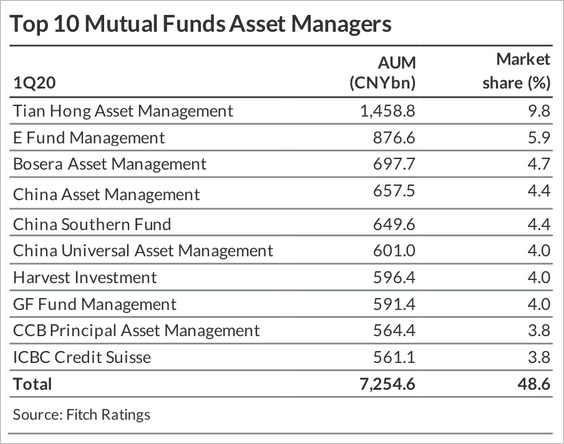 Source: Fitch Ratings
• ETF assets have more than doubled since 2017.
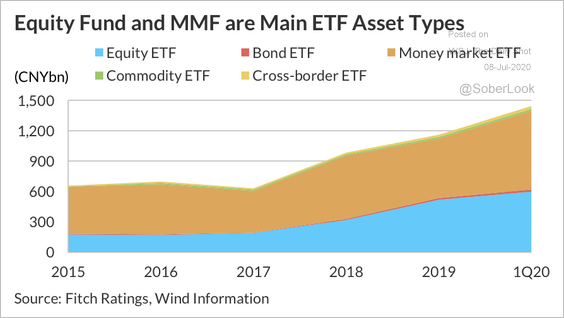 Source: Fitch Ratings
Emerging Markets
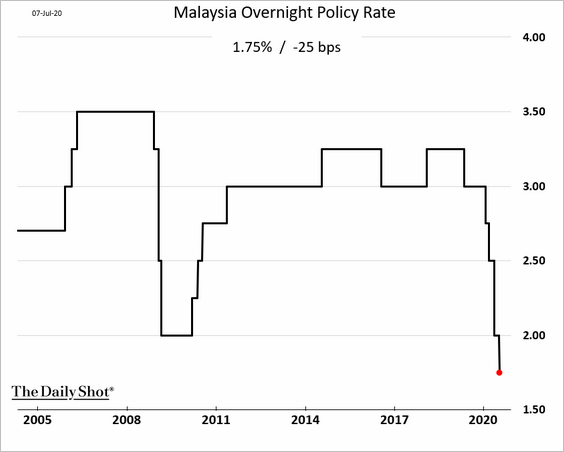
1. Malaysia cut the benchmark interest rate to a record low.
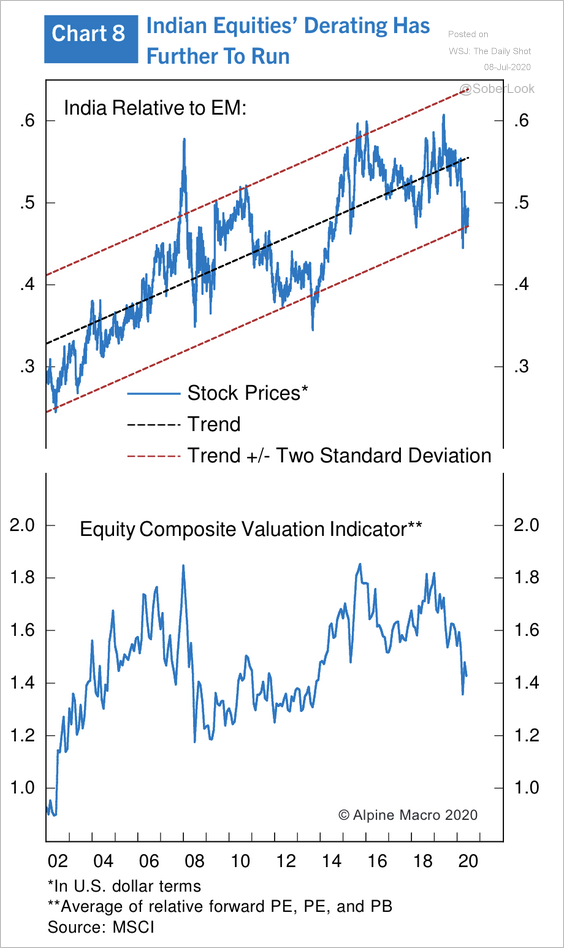
2. Indian equities are still the most expensive market in EM, according to Alpine Macro.
 Source: Alpine Macro
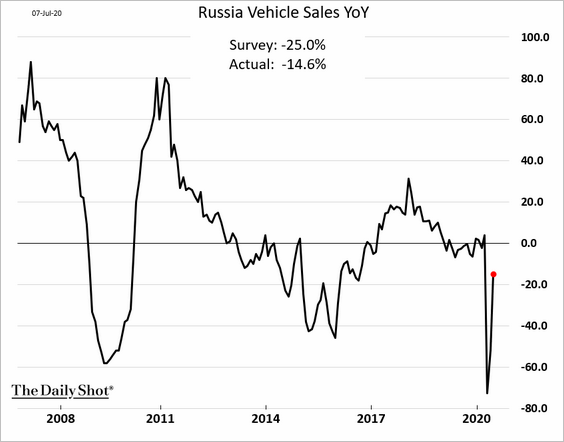
3. Russia’s car sales rebounded last month.
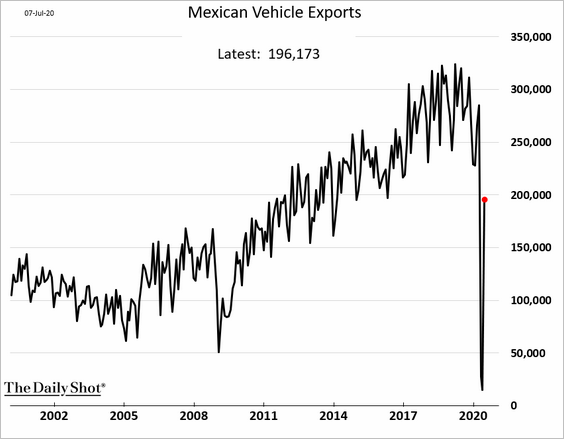
4. Mexico’s vehicle exports are stabilizing as the US demand recovers.
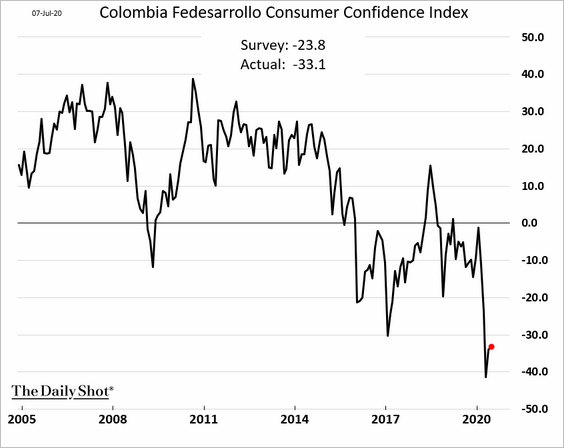
5. Colombia’s consumer confidence remains fragile.
6. This chart shows the flows of remittance funds for select economies.
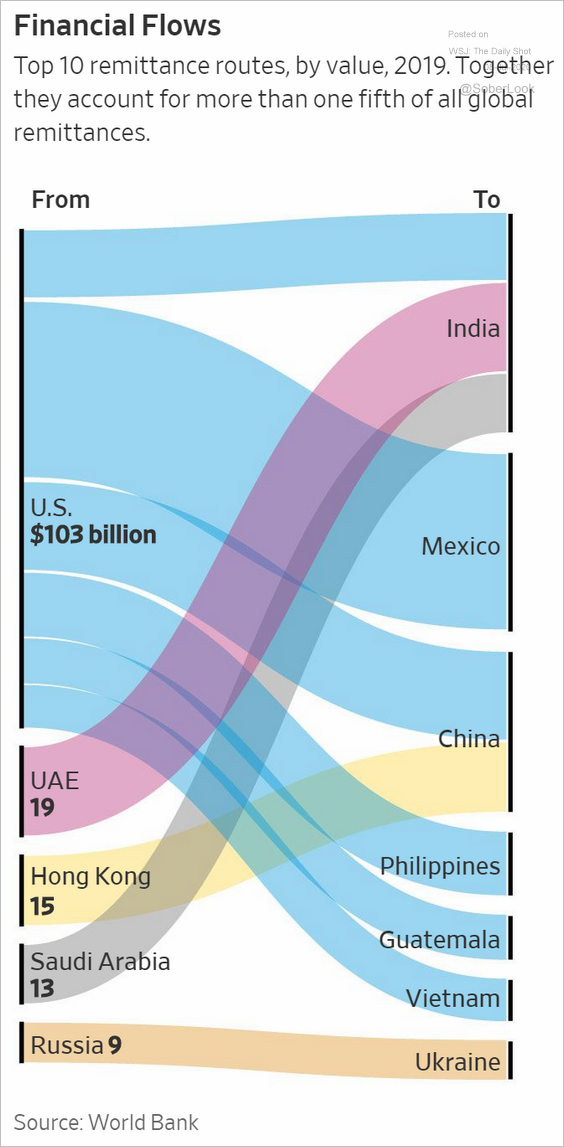 Source: @WSJ Read full article
Commodities
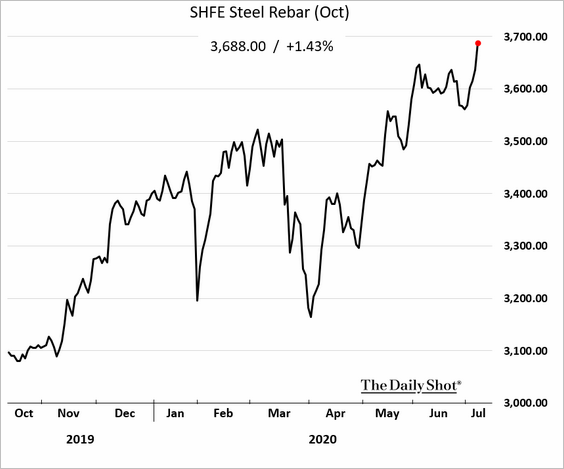
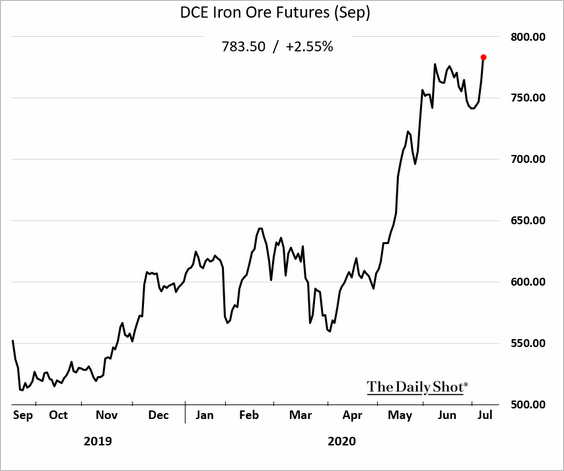
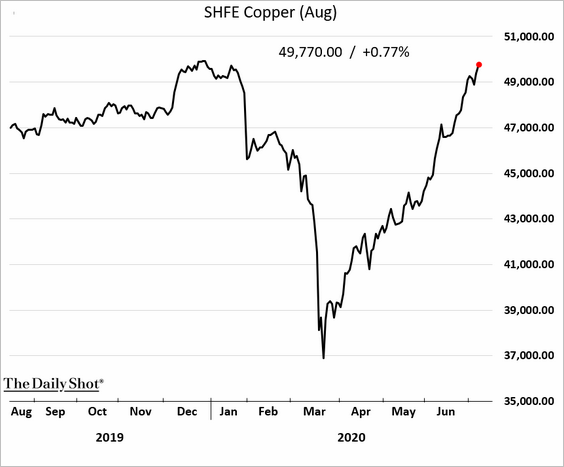
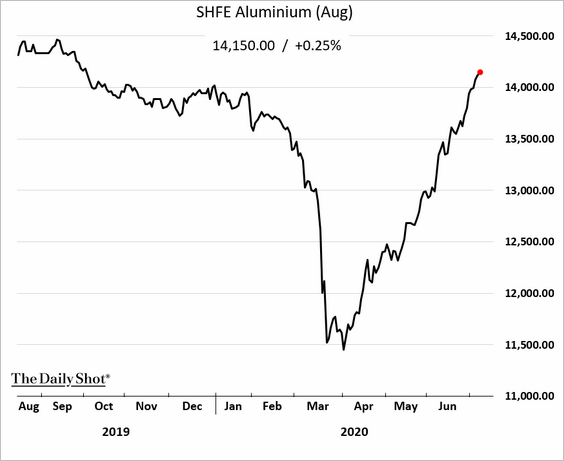
1. The rally in China’s industrial commodities continues.
• Steel:
• Iron ore:
• Copper:
• Aluminum:
——————–
2. Here is the correlation of various asset classes with inflation.
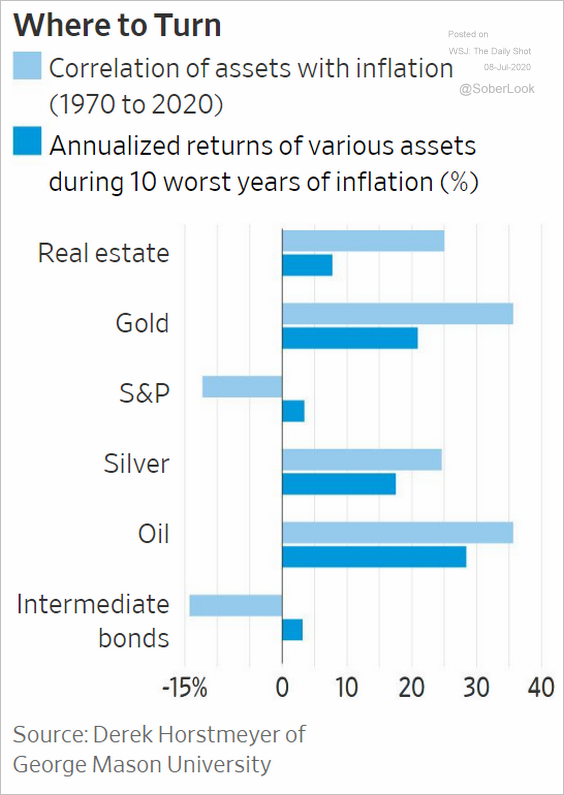 Source: @WSJ Read full article
Energy
1. This chart shows US energy exports to China.
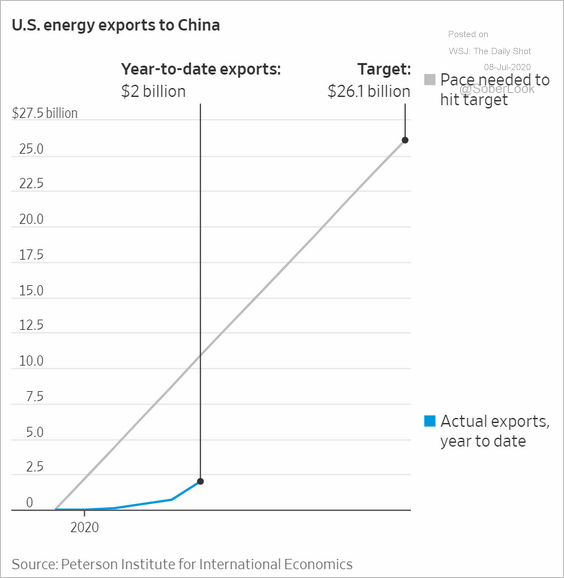 Source: @WSJ Read full article
2. Next, we have some trends in renewable energy.
• Cost of electricity by fuel type:
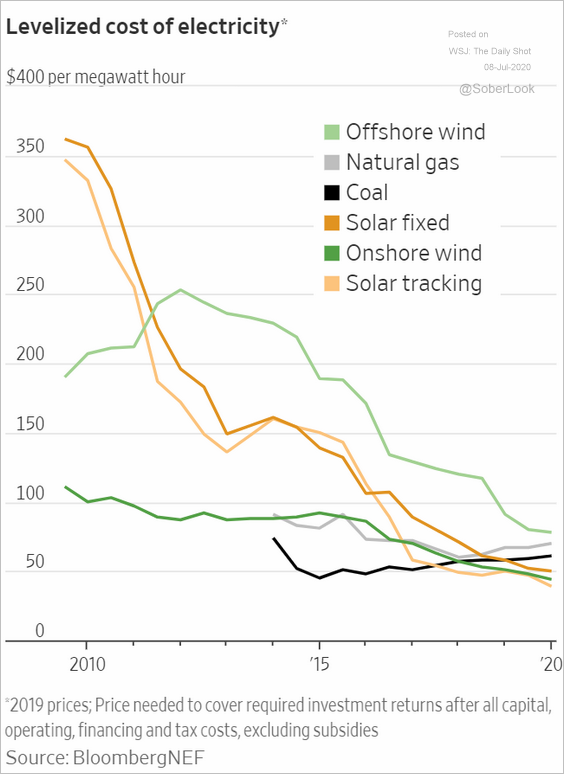 Source: @WSJ Read full article
• Renewables capacity by region:
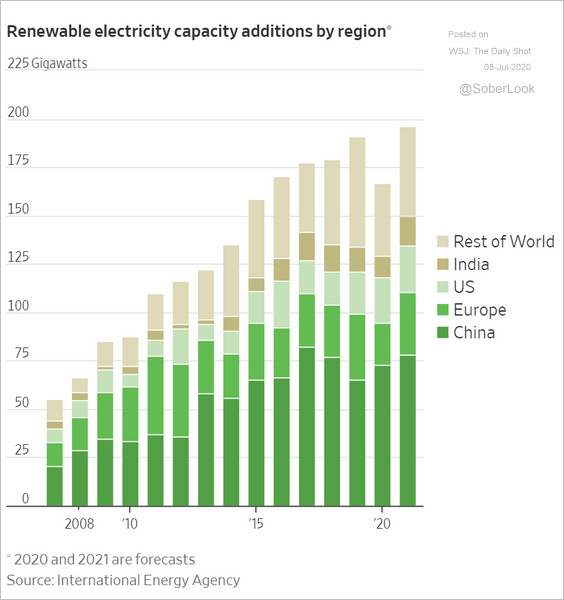 Source: @WSJ Read full article
• Declines in coal usage:
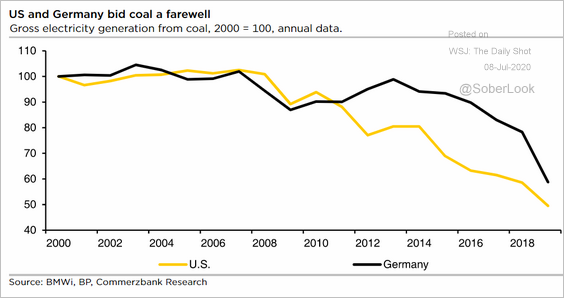 Source: Commerzbank Research
• US utilities’ energy mix:
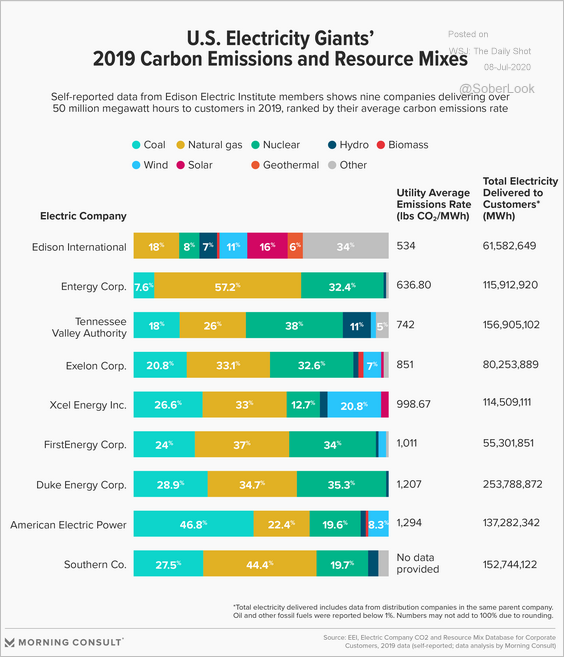 Source: Morning Consult Read full article
• Capital spending on wind and solar projects:
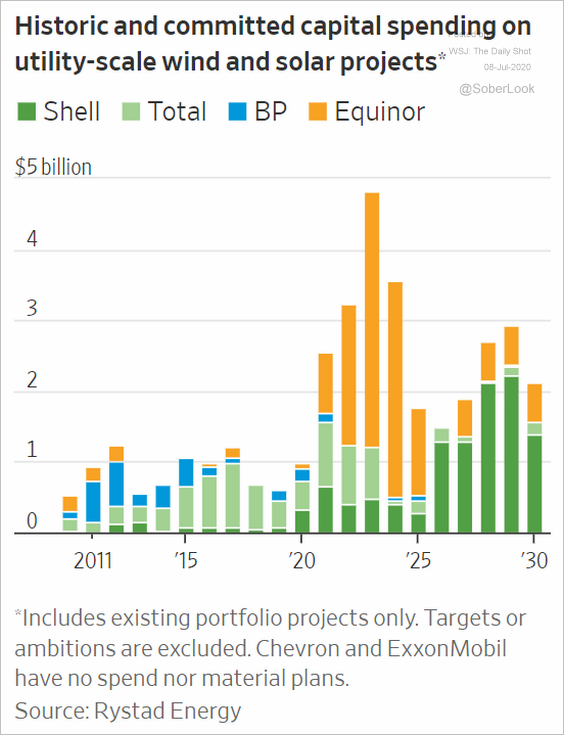 Source: @WSJ Read full article
Equities
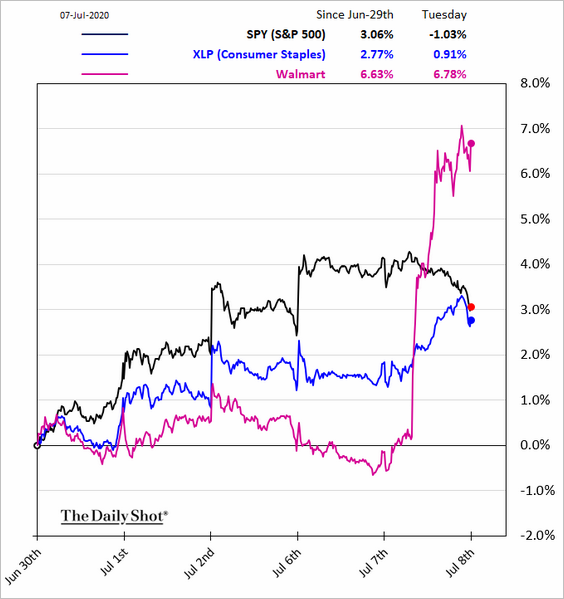
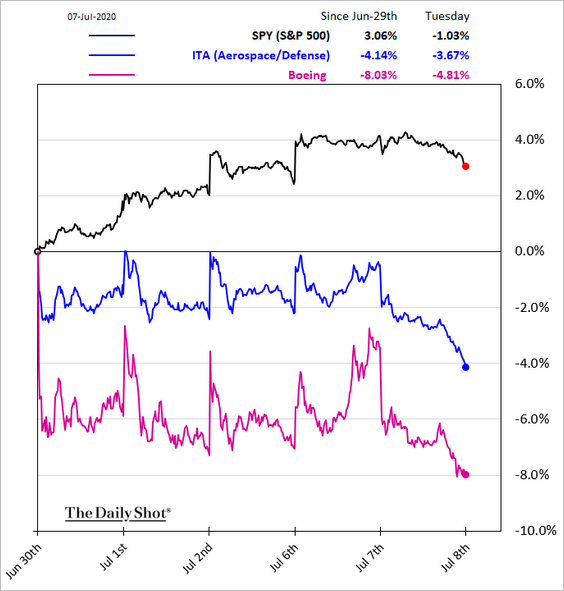
1. The market sold off on Tuesday on concerns about the recovery. Futures are stable this morning.
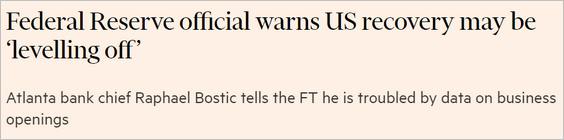 Source: @financialtimes Read full article
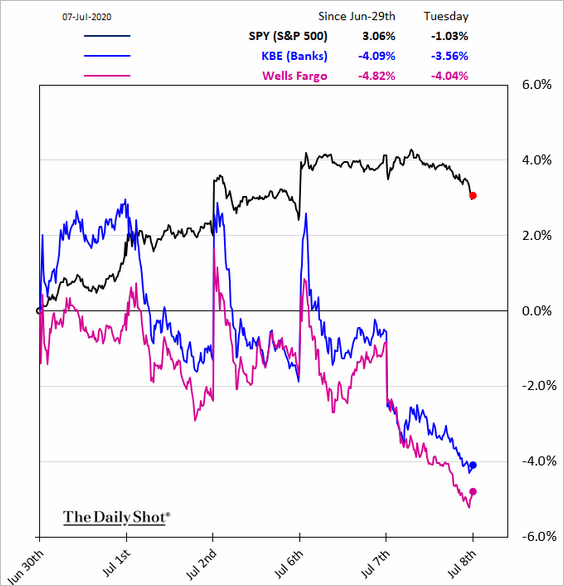
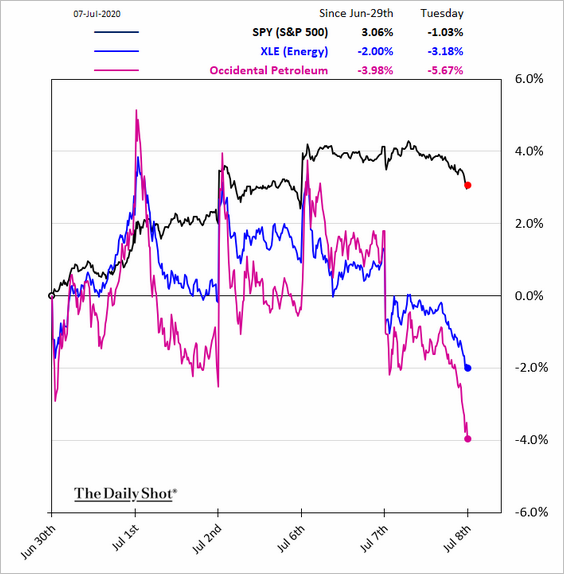
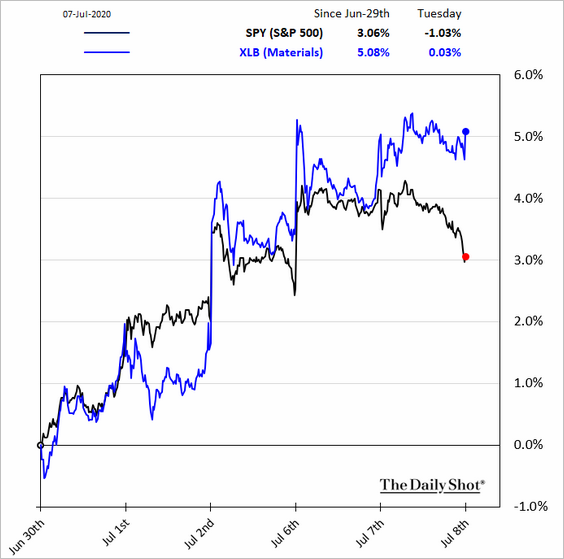
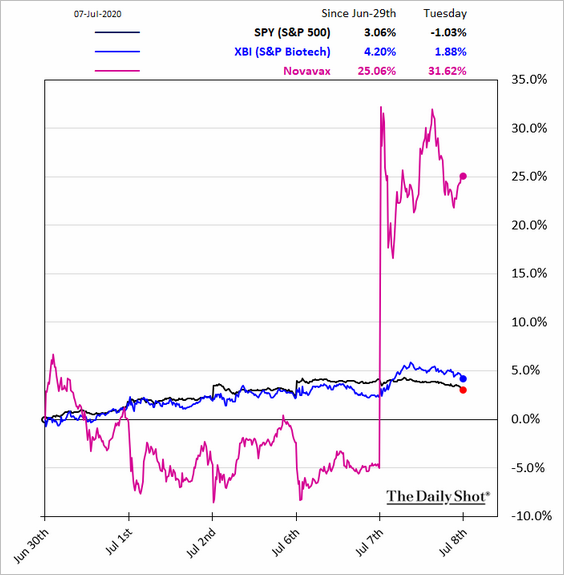
Here are some sector trends.
• Banks (concerns about Q2 earnings, loan loss provisions):
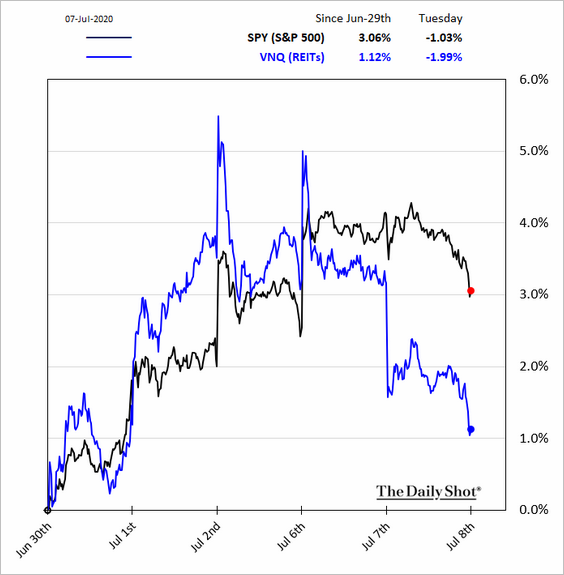
• REITs:
• Consumer Staples:
• Energy:
• Materials:
• Biotech:
 Source: Reuters Read full article
Here is biotech relative to other healthcare sub-sectors.
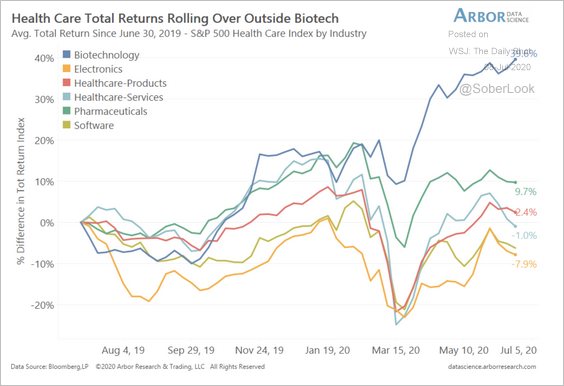 Source: Arbor Research & Trading
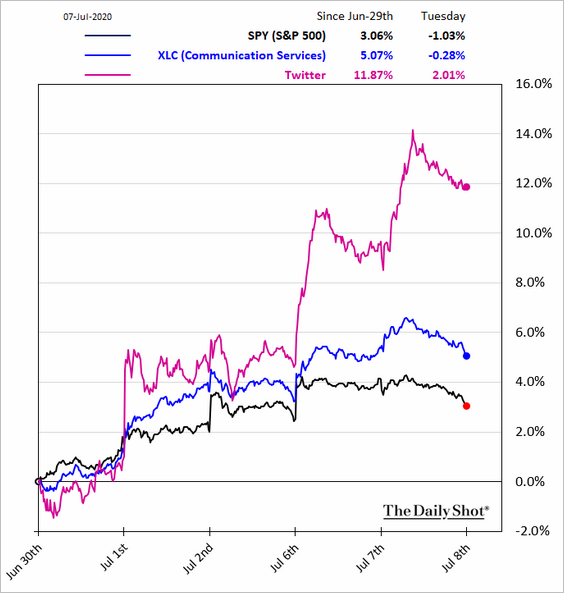
• Communication Services:
• Semiconductors:
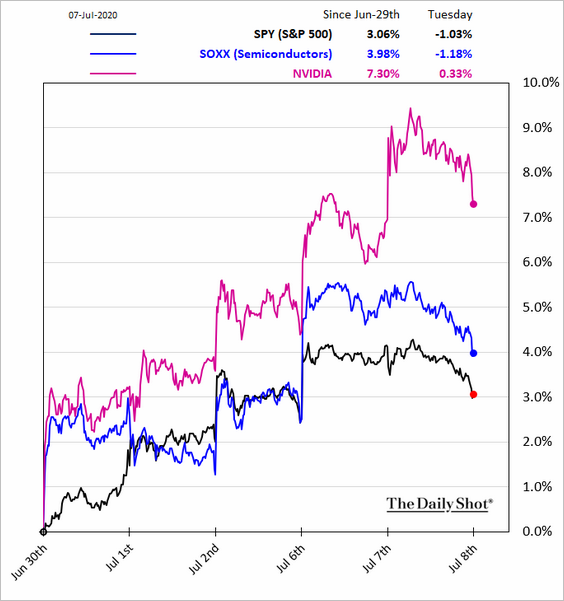
 Source: Barron’s Read full article
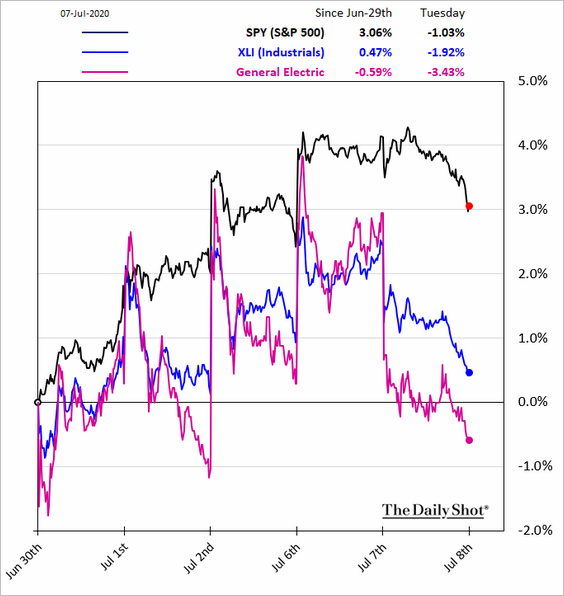
• Industrials:
• Aerospace:
• Transportation:
![]()
——————–
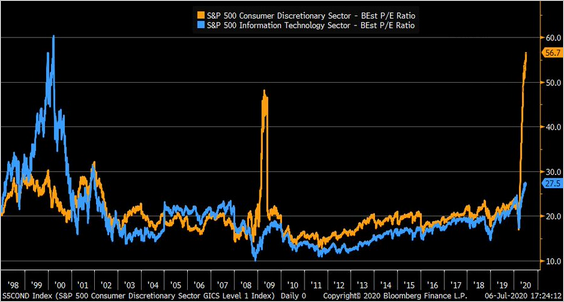
2. Below is the forward P/E ratio for the S&P 500 Consumer Discretionary sector.
 Source: @LizAnnSonders, @business
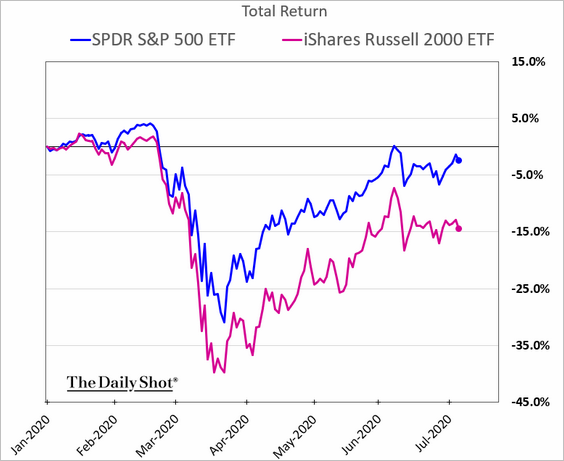
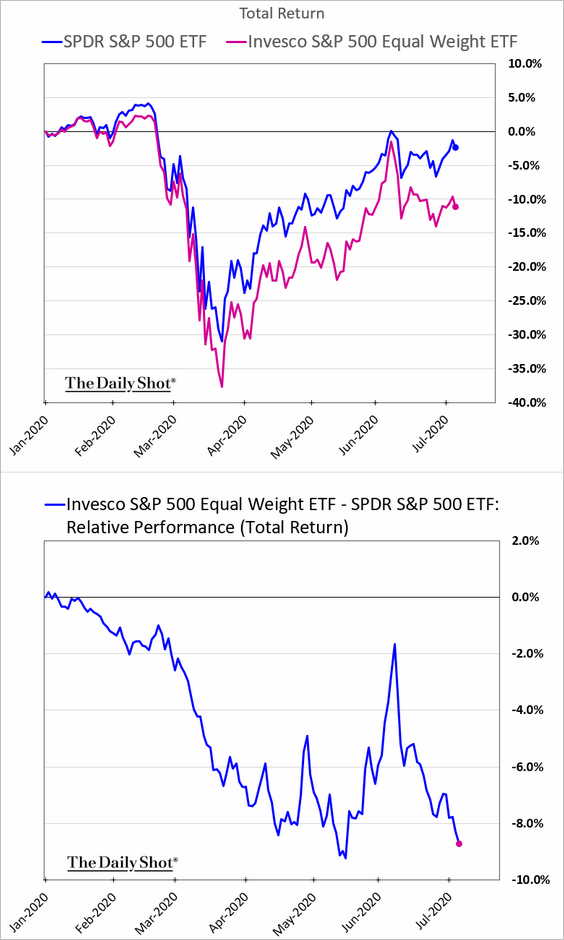
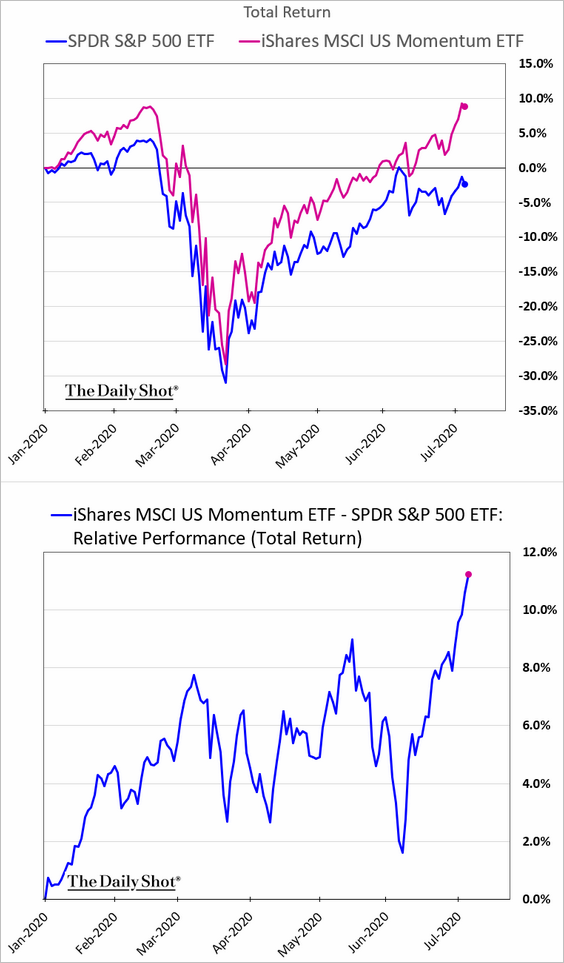
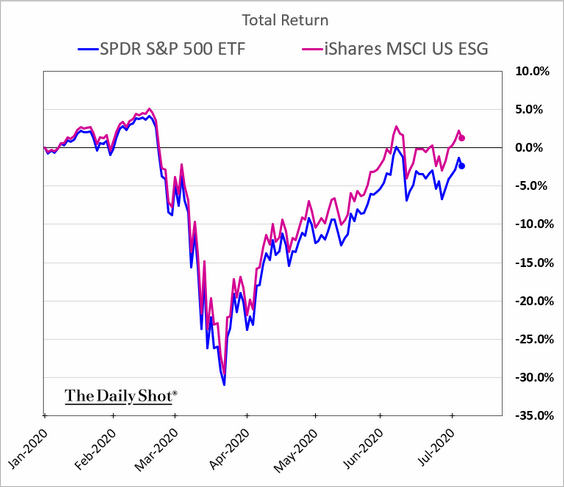
3. Next, we have the year-to-date performance for select factor/style portfolios.
• Small caps:
• Equal-weight S&P 500:
• Dividend dogs:
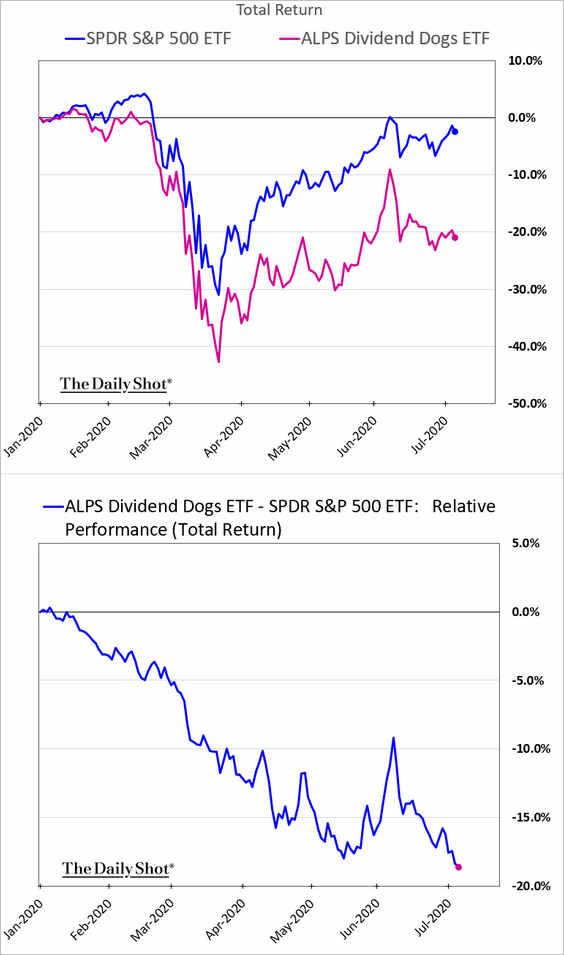
• Share buyback focus:
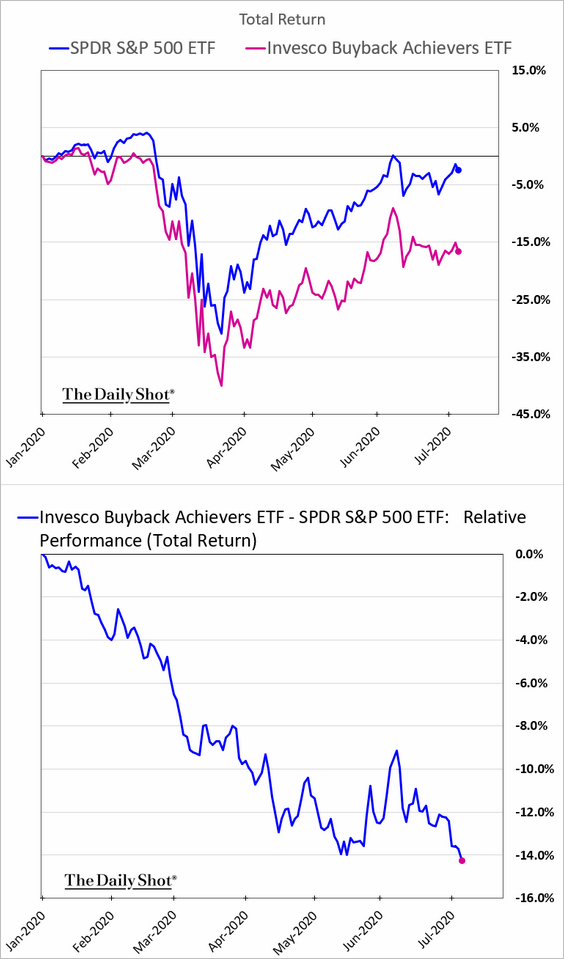
• Value vs. growth:
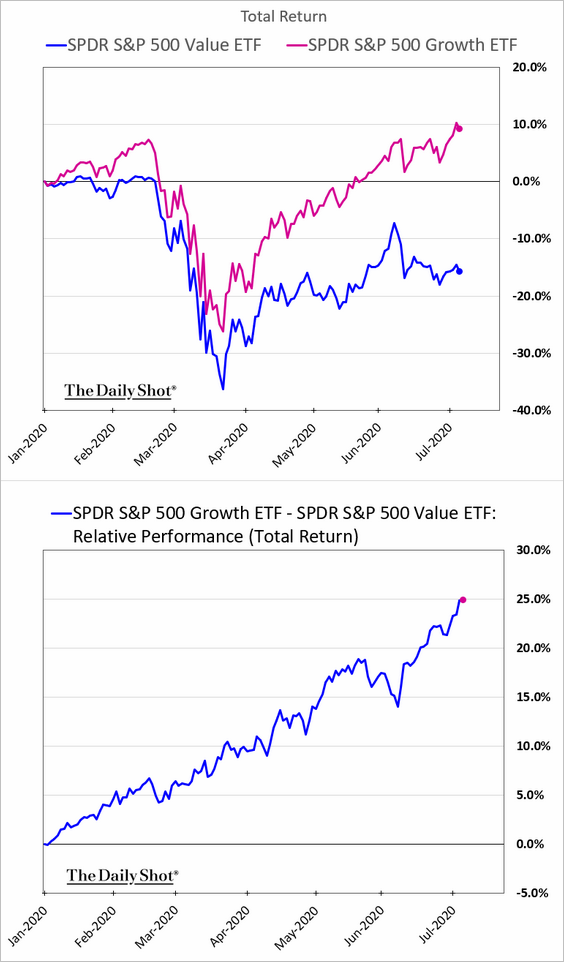
• High-beta:
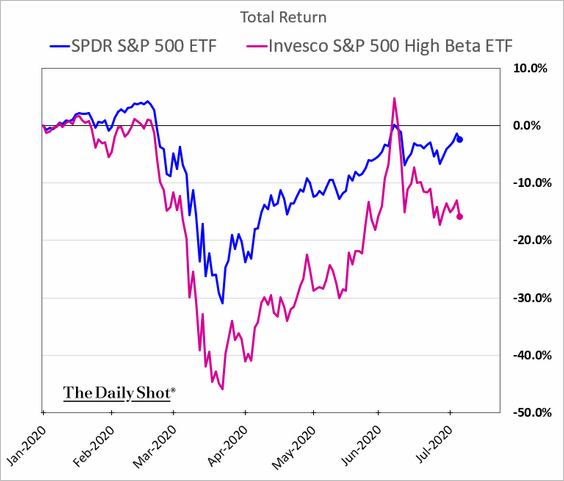
• Momentum:
• ESG:
——————–
4. Finally, here is the year-to-date stock market performance by country.
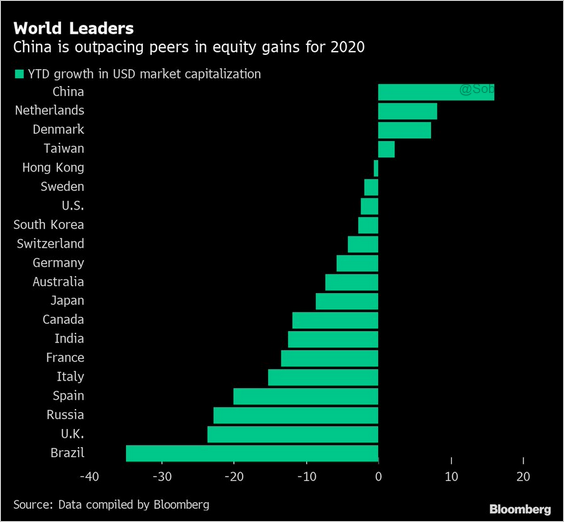 Source: @LizAnnSonders, @Bloomberg
Credit
1. This chart shows municipal credit performance for select states.
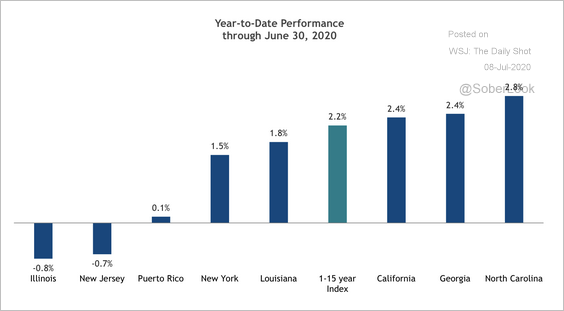 Source: SunTrust Private Wealth Management
By the way, the muni bonds backing the American Dream mall in New Jersey are down sharply.
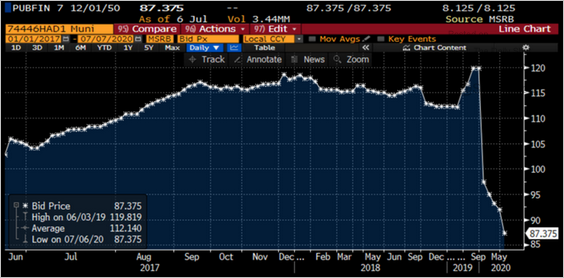 Source: @lisaabramowicz1, @MartinZBraun, @theterminal
——————–
2. Many properties backing commercial mortgage-backed securities (CMBS) loans have faced deteriorating fundamentals over the past quarter. The chart below shows an assessment by Moody’s (red-yellow-green is associated with high- to low-risk scores).
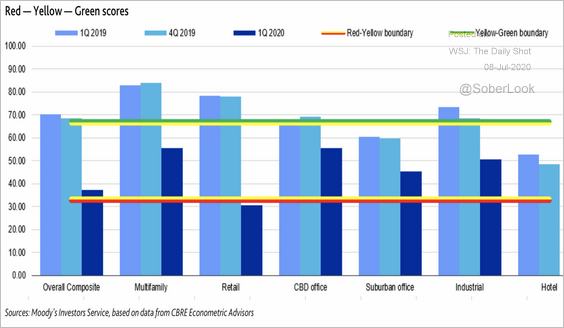 Source: Moody’s Investors Service
This chart shows the dispersion in scores by property type.
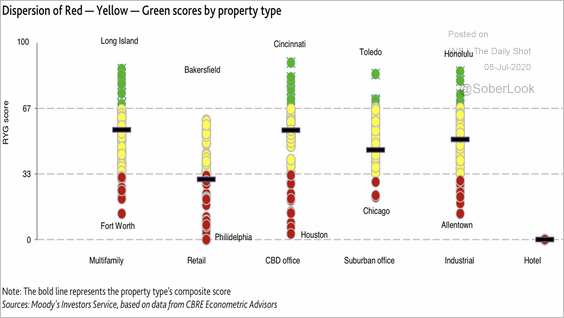 Source: Moody’s Investors Service
Global Developments
1. Are concerns about inflation overblown?
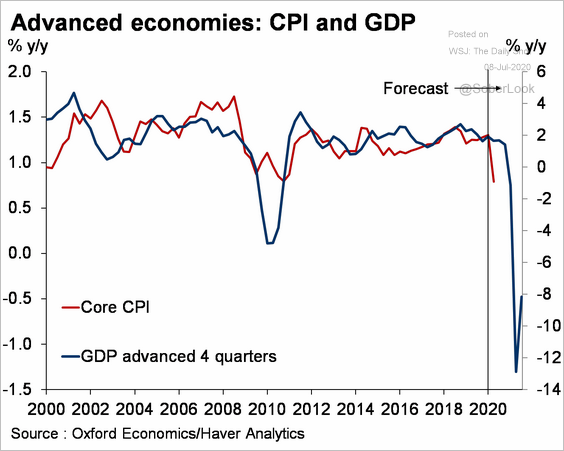 Source: Oxford Economics
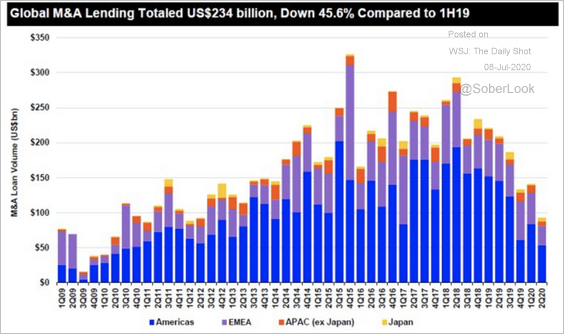
2. M&A activity has slowed substantially.
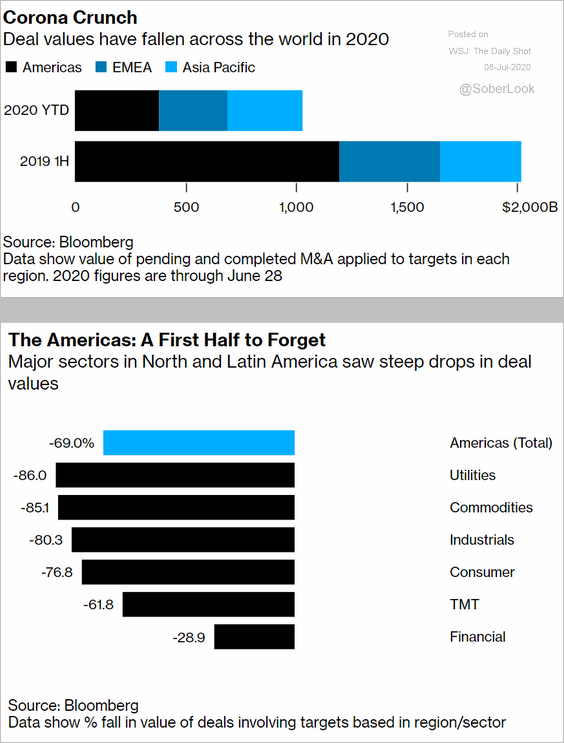 Source: @markets Read full article
 Source: @Refinitiv
——————–
3. Global wealth growth has been steady over the past 20 years.
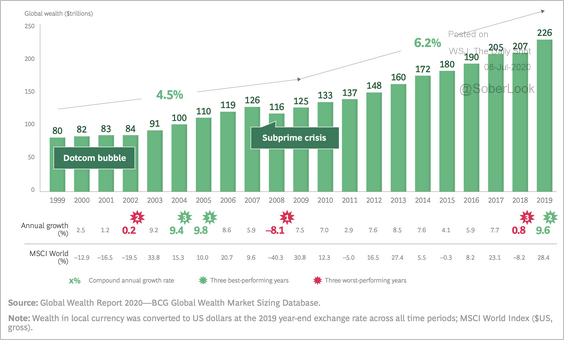 Source: BCG Read full article
——————–
Food for Thought
1. US cinema releases:
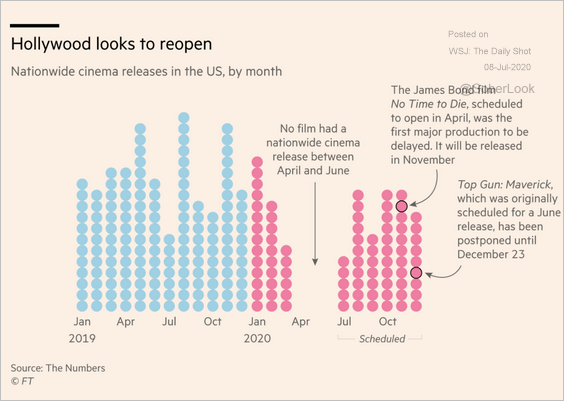 Source: @financialtimes Read full article
2. Electric cars:
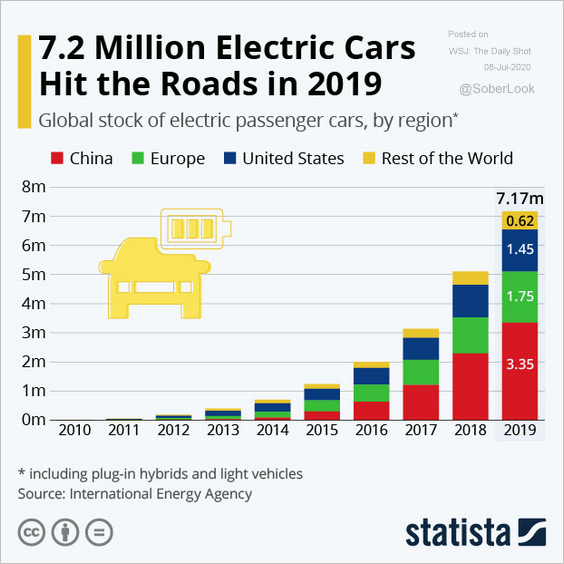 Source: Statista
3. Police spending by city:
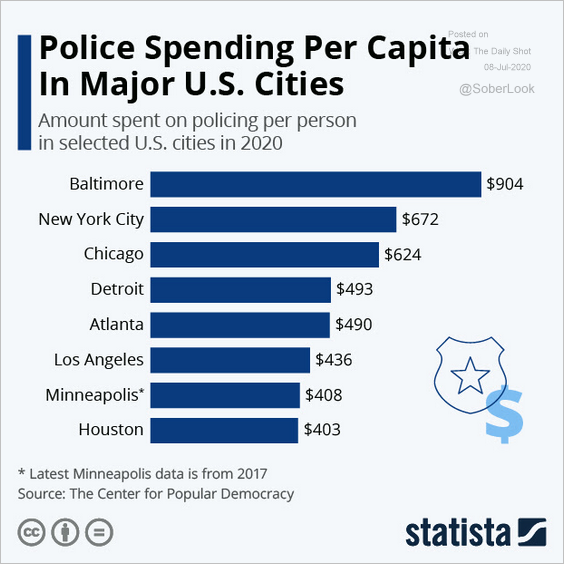 Source: Statista
4. Drinking at home:
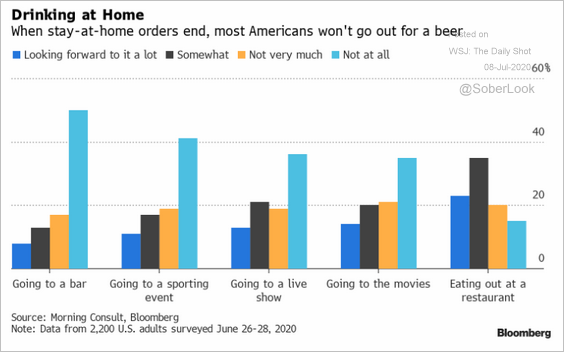 Source: @A_Riley17, @TheTerminal
5. Attending college remotely:
 Source: @YouGovAmerica Read full article
6. How Canadians view other countries:
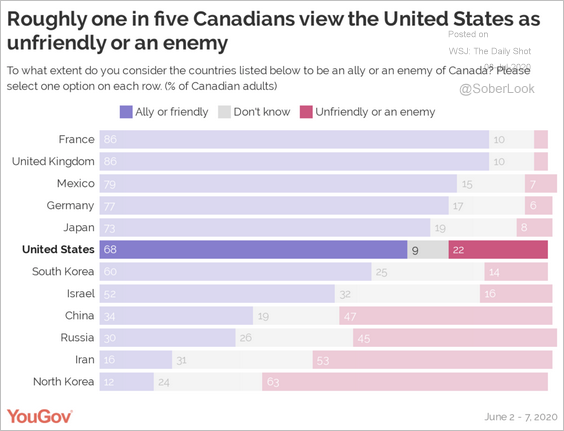 Source: YouGov Read full article
7. US views on the coronavirus situation:
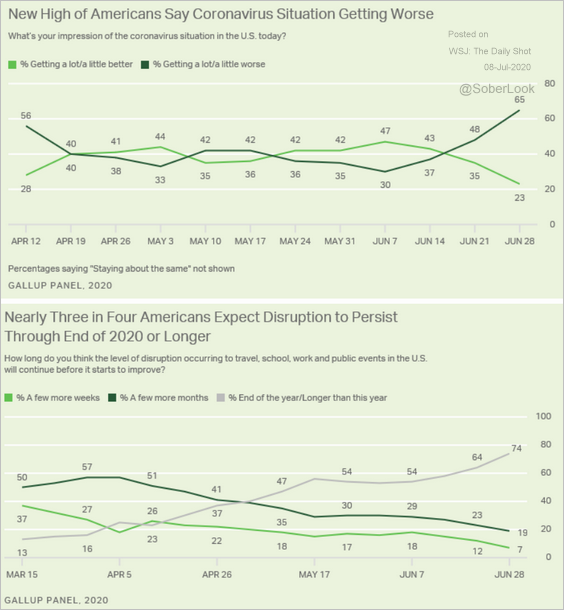 Source: Gallup Read full article
8. Adults out of work due to closed schools/daycare:
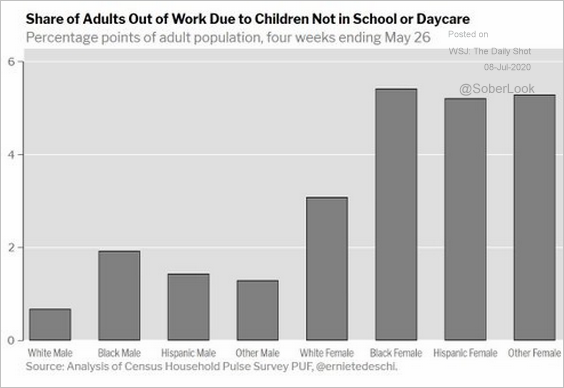 Source: @mmcassella, @ernietedeschi Read full article
9. DNA sequencing:
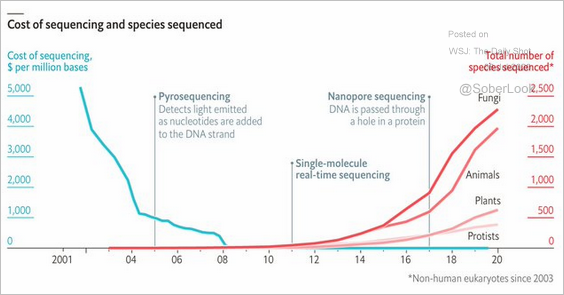 Source: @adam_tooze, The Economist Read full article
——————–