
The Daily Shot: 14-Jul-20
• The United States
• Canada
• Europe
• Asia – Pacific
• China
• Emerging Markets
• Commodities
• Energy
• Equities
• Credit
• Rates
• Global Developments
• Food for Thought
The United States
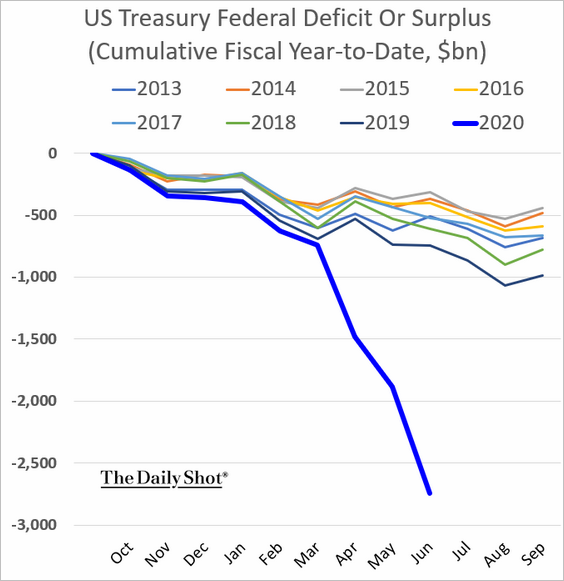
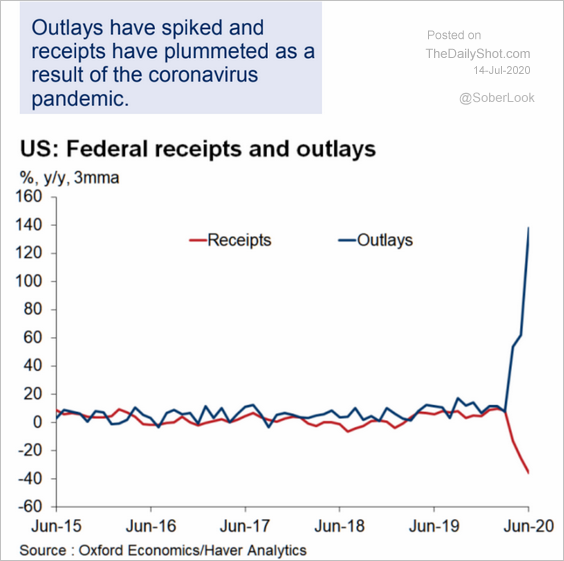
1. The 2020 federal deficit is rapidly approaching $3 trillion after the biggest monthly increase on record in June (see story).
This chart shows federal receipts and outlays over time.
 Source: Oxford Economics
——————–
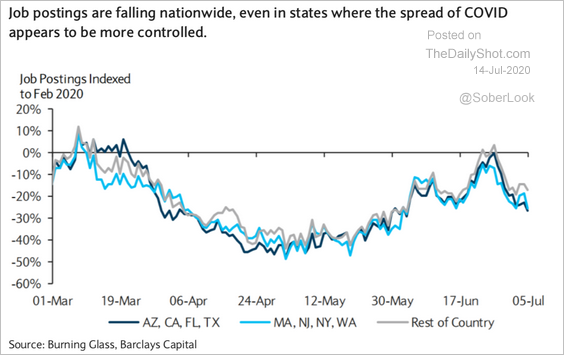
2. Job postings have slowed again.
 Source: Barclays Research
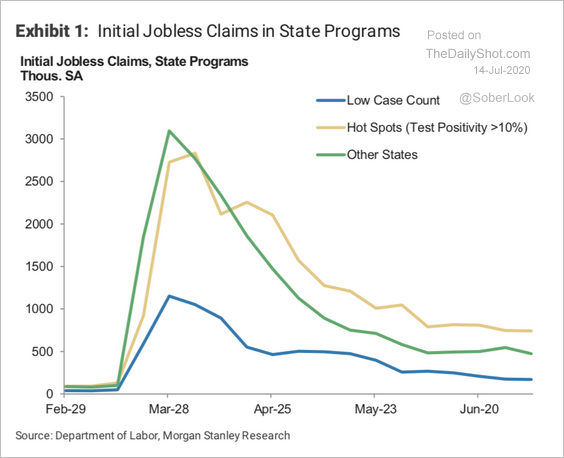
3. This chart shows the US initial jobless claims for states with high and low infection counts.
 Source: Morgan Stanley Research
4. Wealthier communities had a stronger rebound in retail traffic than lower-income areas.
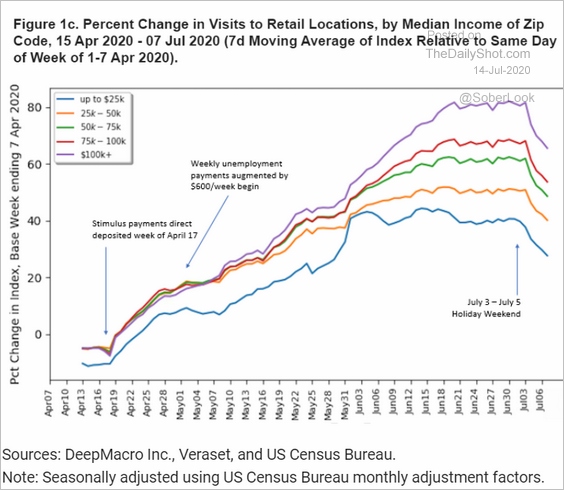 Source: DeepMacro
5. Hotel rates are recovering.
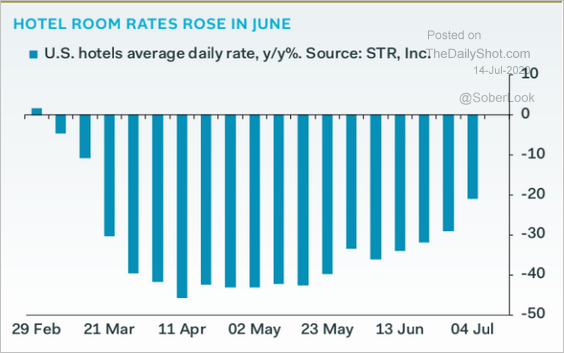 Source: Pantheon Macroeconomics
6. While the US trade deficit with China has been moderating, it widened with the rest of the world.
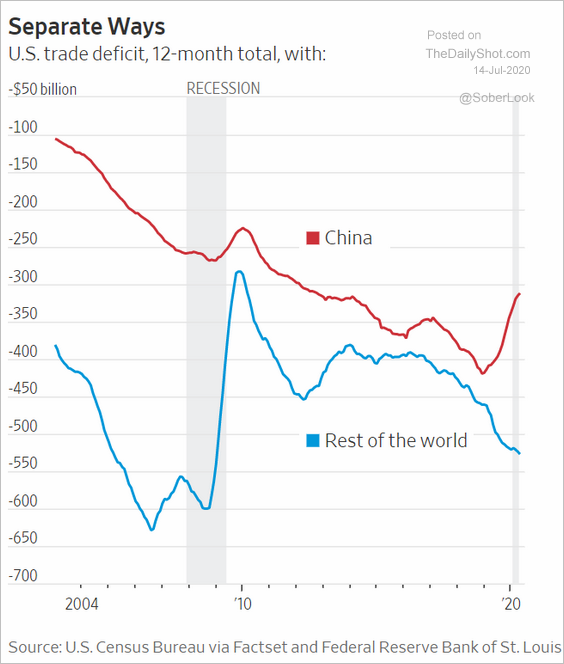 Source: @WSJ Read full article
7. The US dollar tends to strengthen after presidential elections.
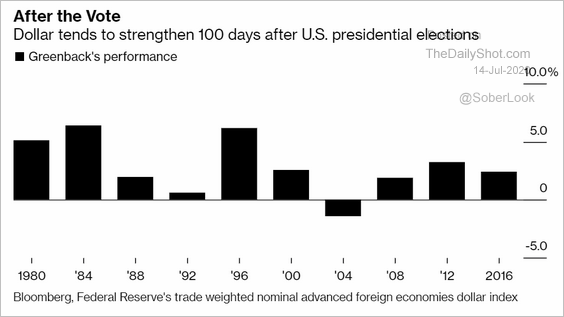 Source: @markets Read full article
For now, asset managers are boosting their bets against the greenback.
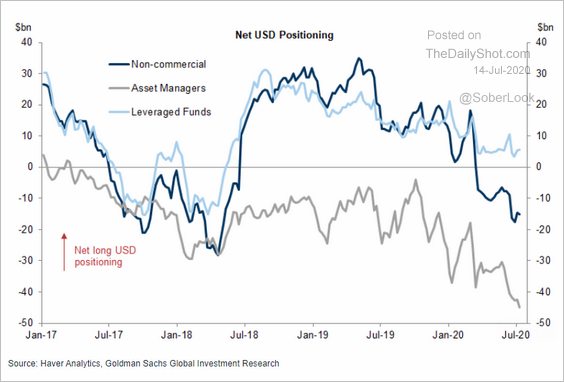 Source: Goldman Sachs
Canada
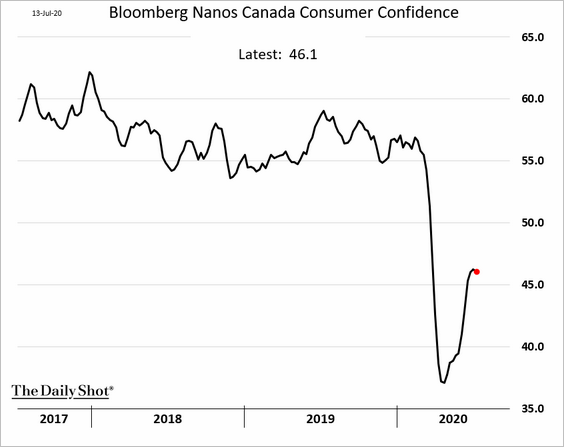
1. The rebound in consumer confidence has stalled, a trend that is taking place in several advanced economies.
2. Declining investments and capacity pressures could weigh on inflation.
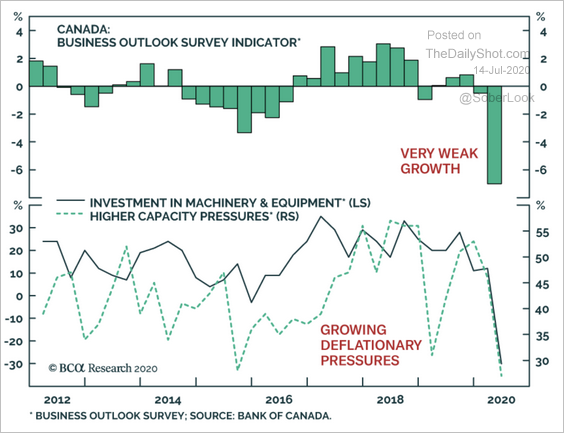 Source: BCA Research
3. Outside of the residential space, credit growth remains fragile.
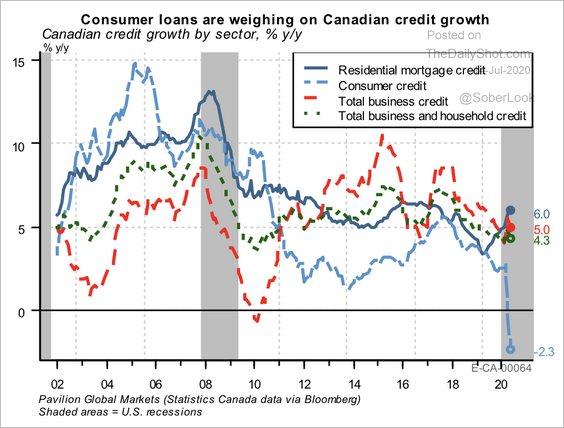 Source: Pavilion Global Markets
Businesses are facing tighter credit conditions despite unprecedented easing by the BoC.
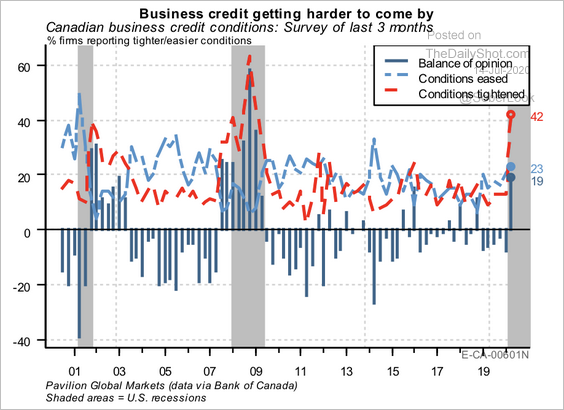 Source: Pavilion Global Markets
Europe
1. The German government has been generating extra income selling negative-yielding debt.
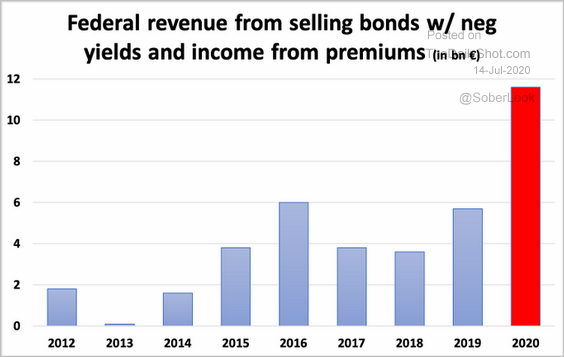 Source: @Schuldensuehner, @BarkowConsult, @welt Read full article
2. UK wage growth may decline further.
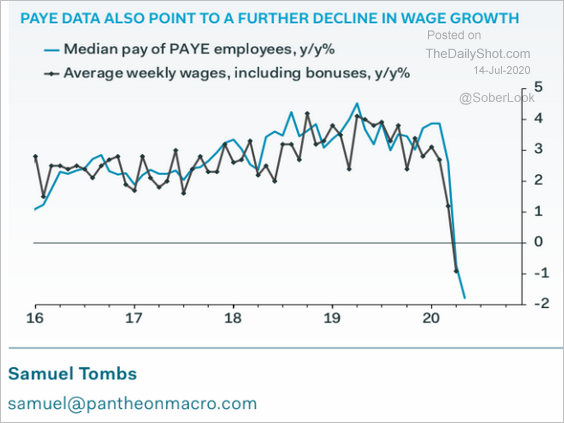 Source: Pantheon Macroeconomics
Separately, the UK GDP rebound in May was disappointing (1.8% vs. 5.5% expected). More on this tomorrow.
——————–
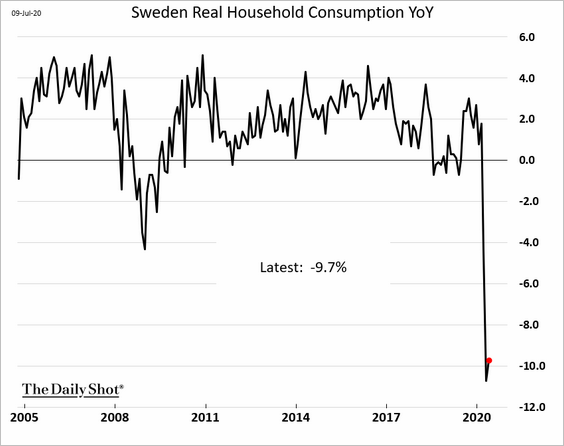
3. Sweden’s unemployment rate hit the highest level in a decade.
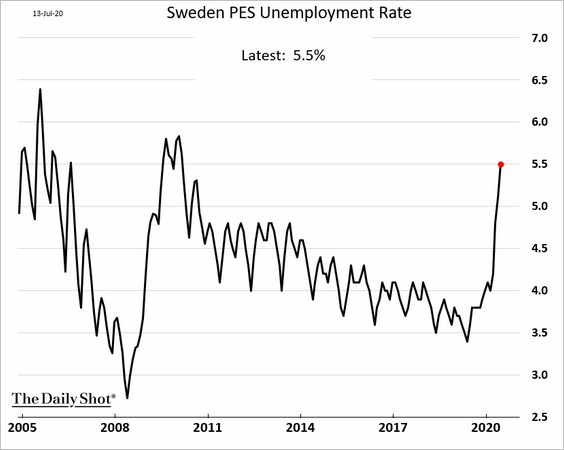
Household consumption showed no meaningful recovery in May.
——————–
4. Here is the IMF’s latest GDP projection for the EU.
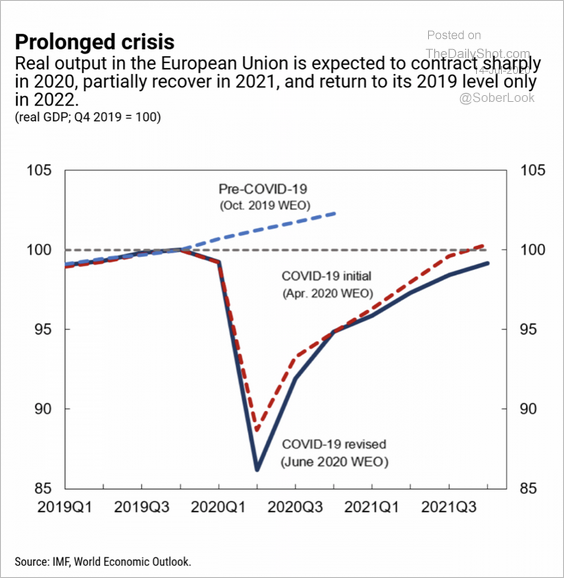 Source: IMF Read full article
5. This chart shows the ease of bankruptcy process across the EU.
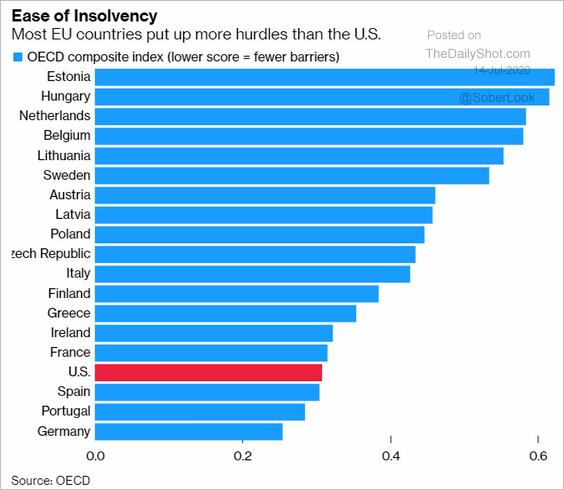 Source: @markets Read full article
6. Next, we have the projected EU old-age dependency ratios.
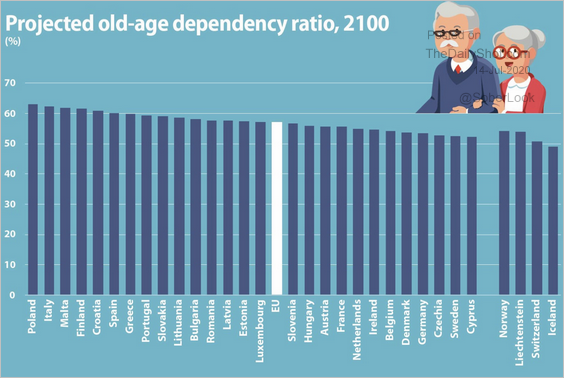 Source: Eurostat Read full article
Asia – Pacific
1. Singapore’s GDP plummetted in the second quarter.
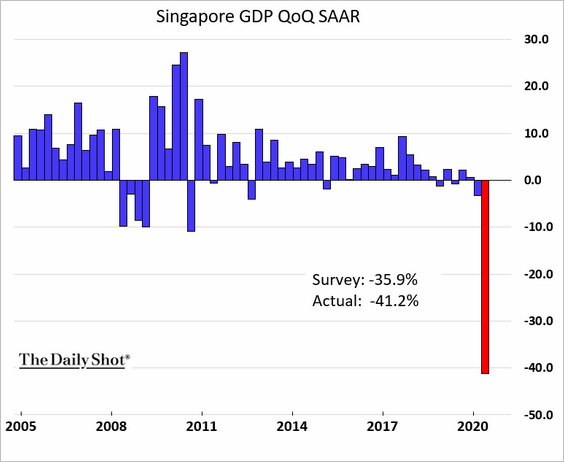
 Source: Reuters Read full article
——————–
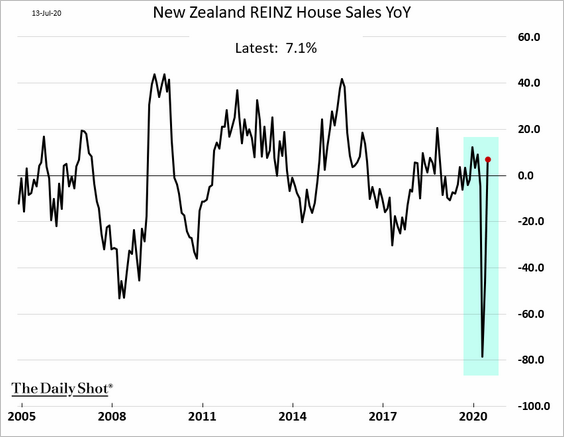
2. New Zealand’s home sales have fully recovered.
3. The rebound in Australia’s consumer confidence has stalled, a trend that we see in other countries.
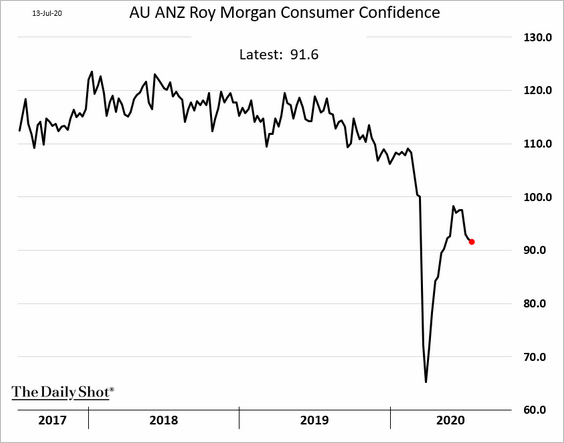
The situation in Victoria has also been a drag on sentiment.
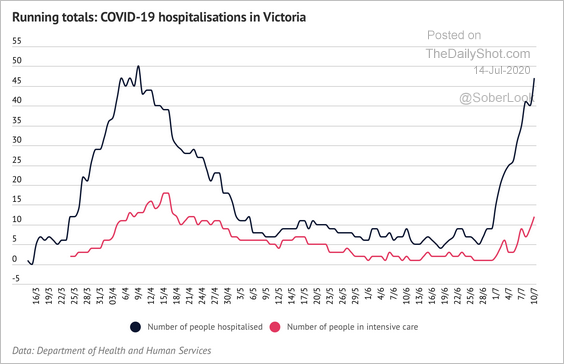 Source: The Age Read full article
China
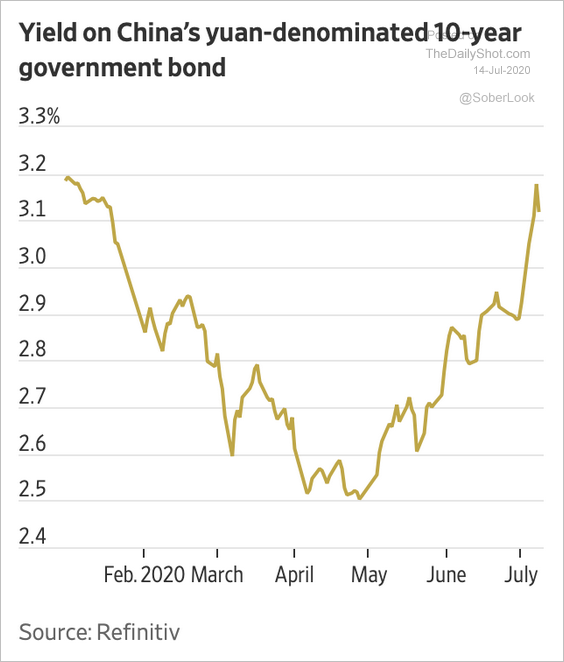
1. Foreign investors are increasingly buying Chinese government debt for safety and yield.
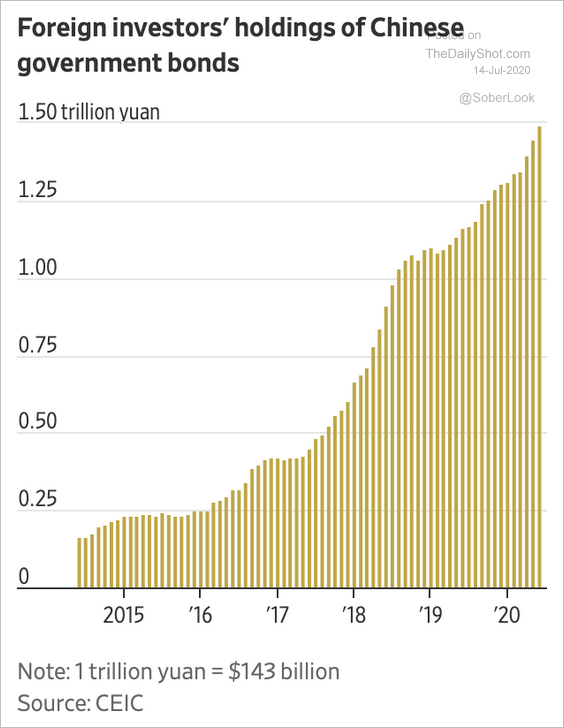 Source: @WSJ Read full article
 Source: @WSJ Read full article
——————–
2. Rate differentials have been supporting the renminbi.
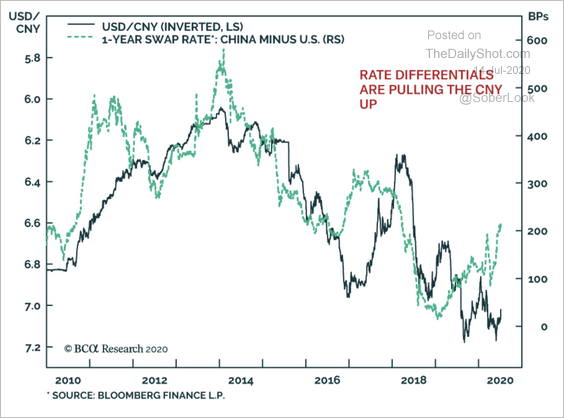 Source: BCA Research
3. The Shanghai Composite has outperformed copper prices.
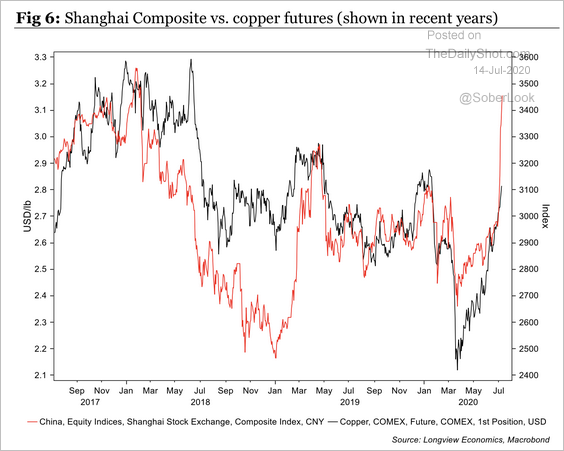 Source: Longview Economics
The ChiNext index rally has been impressive.
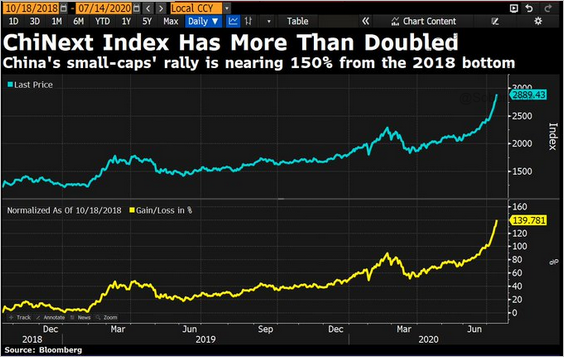 Source: @DavidInglesTV
——————–
4. Here is Goldman’s China wage tracker.
![]() Source: Goldman Sachs
Source: Goldman Sachs
5. China’s GDP is much less dependent on the consumer than the US economy.
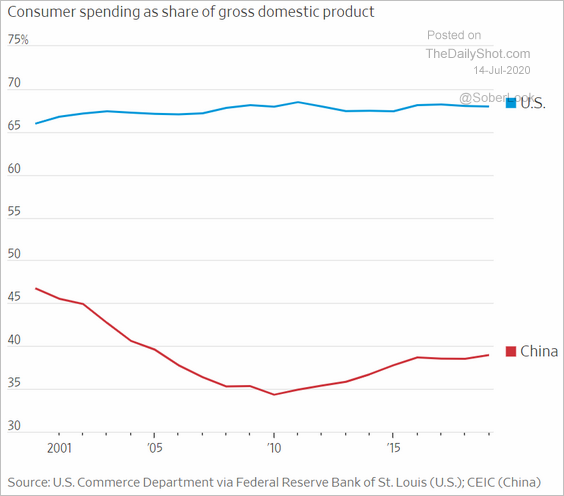 Source: @WSJ Read full article
Emerging Markets
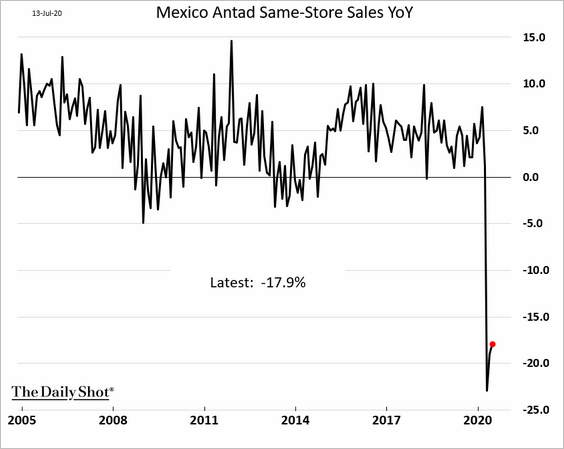
1. Let’s begin with Mexico.
• Same-store sales remained extraordinarily weak in June.
• The labor market may deteriorate further, according to Goldman Sachs.
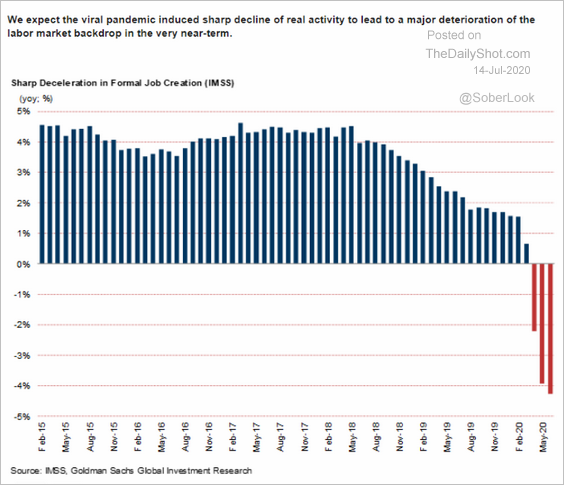 Source: Goldman Sachs
——————–
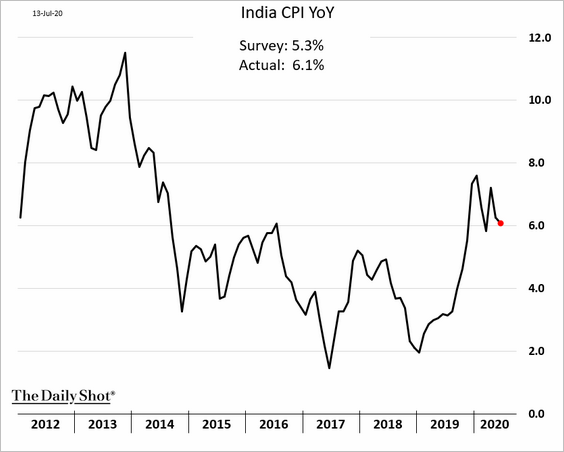
2. India’s CPI is holding above 6%, which is at the upper end of the RBI’s tolerance band.
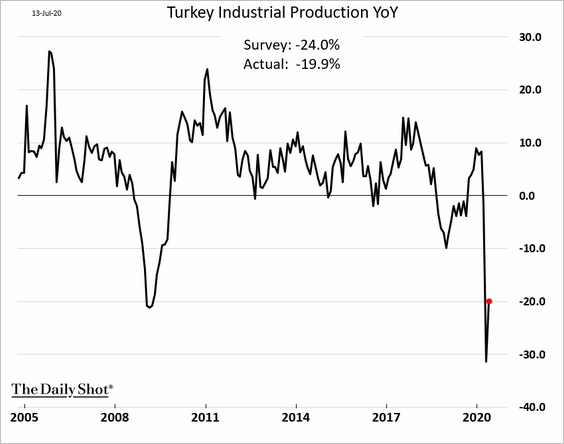
3. Turkey’s industrial production bounced in May but was still 20% below 2019 levels.
4. Non-resident holders represent a significant portion of local government bond markets in some EM countries.
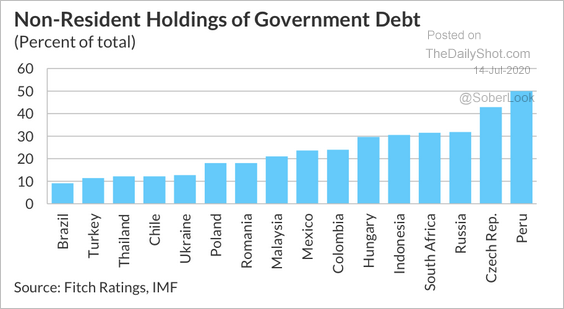 Source: Fitch Ratings
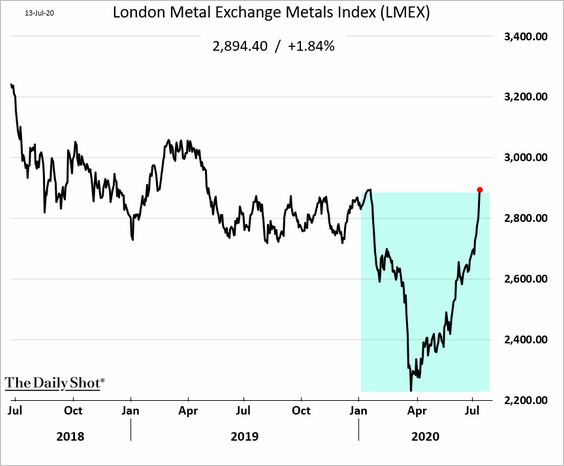
Commodities
1. Industrial metals have fully recovered from the pandemic-related losses.
2. Copper is at resistance.
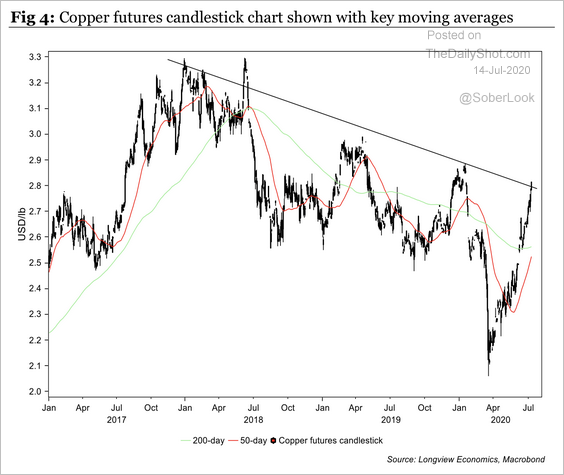 Source: Longview Economics
3. European emissions permits hit the highest level since 2006 as the EU prepares a massive investment to cut greenhouse gases.
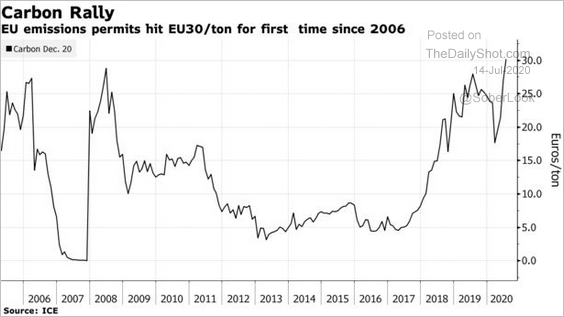 Source: @business Read full article
Energy
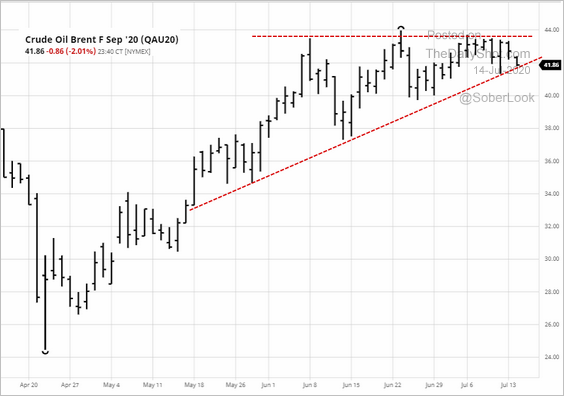
1. Brent futures have been consolidating.
2. The global trade price index is highly correlated with crude oil.
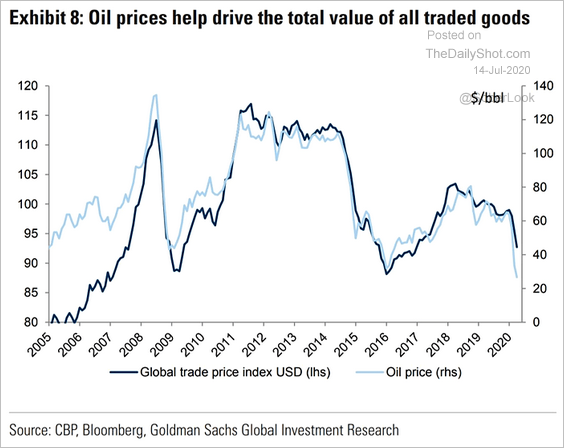 Source: @ISABELNET_SA, @GoldmanSachs
Equities
1. Let’s start with the history of market pullbacks since the Financial Crisis.
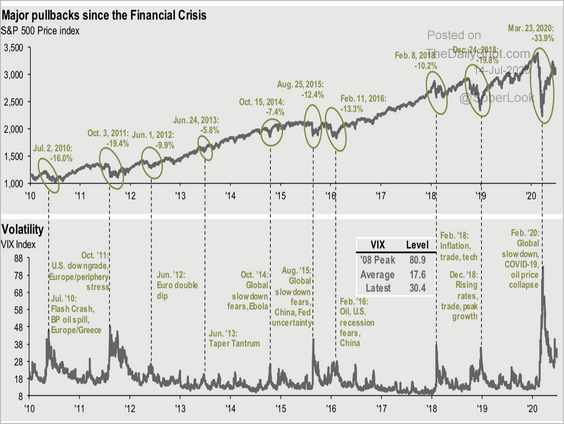 Source: J.P. Morgan Asset Management
2. BofA’s private clients finally moved some money into stocks.
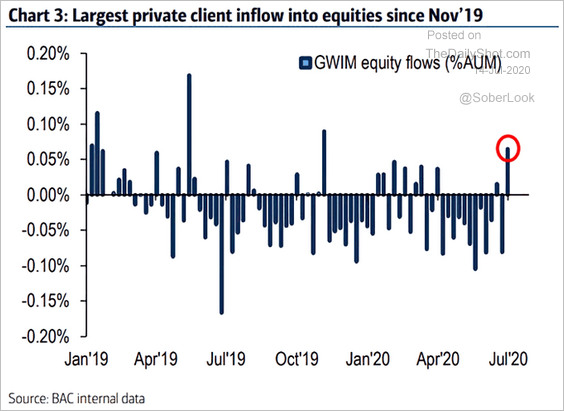 Source: @ISABELNET_SA, @BofAML
3. Here is the Nasdaq 100 Optimism Index.
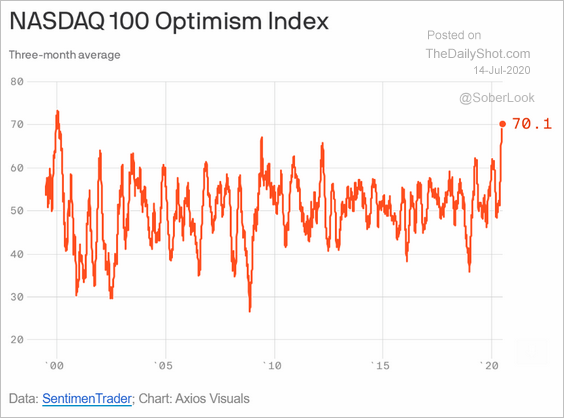 Source: @axios Read full article
4. Analysts’ earnings estimates are all over the place.
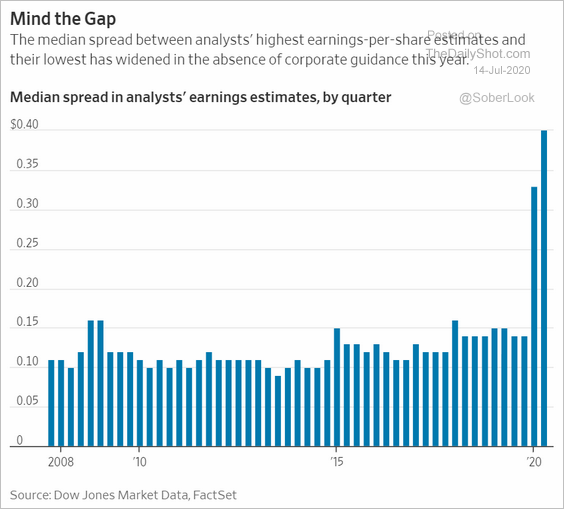 Source: @WSJ Read full article
5. To align with return targets that are far above prevailing market interest rates, US pension funds have increased allocations to riskier assets such as equities and alternatives, according to Moody’s.
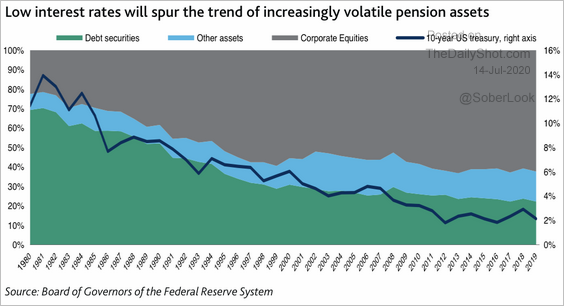 Source: Moody’s Investors Service
6. Stock market performance in the lead-up to an election is usually a good indicator of whether the incumbent will win.
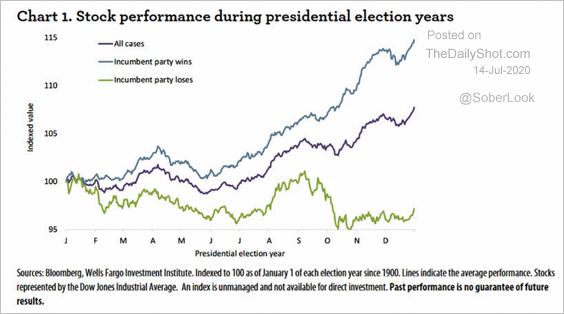 Source: Wells Fargo
7. Active manager performance has improved in 2020 relative to 2019.
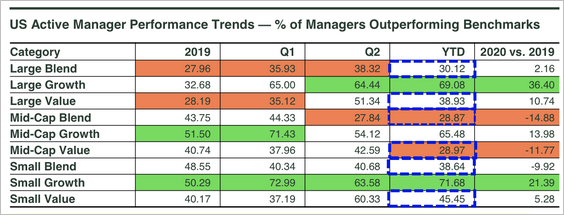 Source: SPDR Americas Research, @mattbartolini
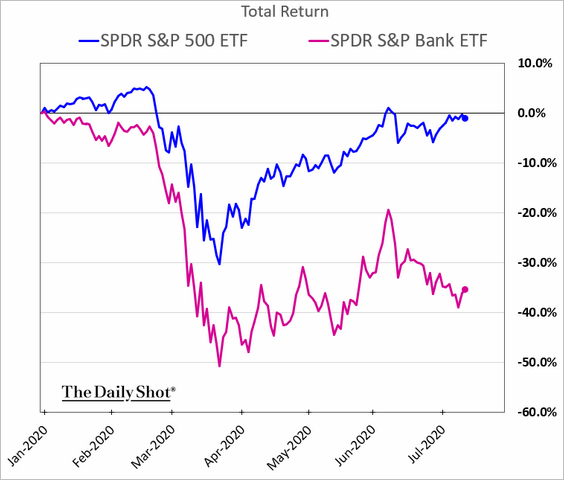
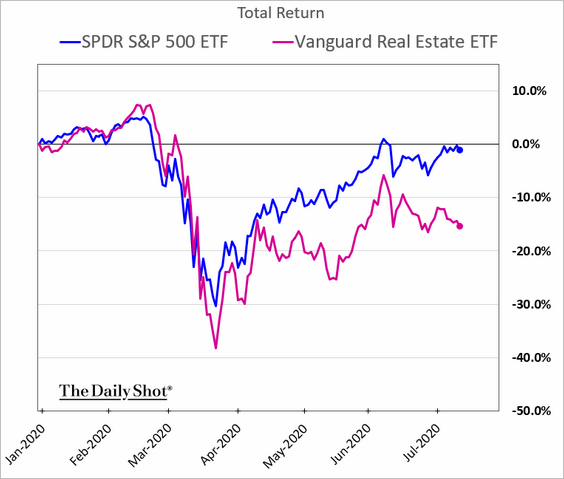
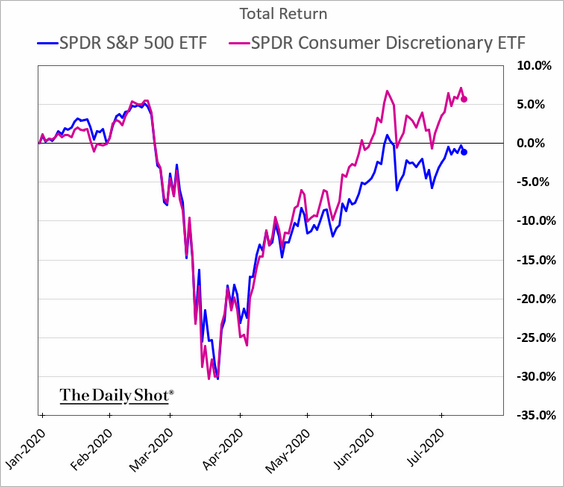
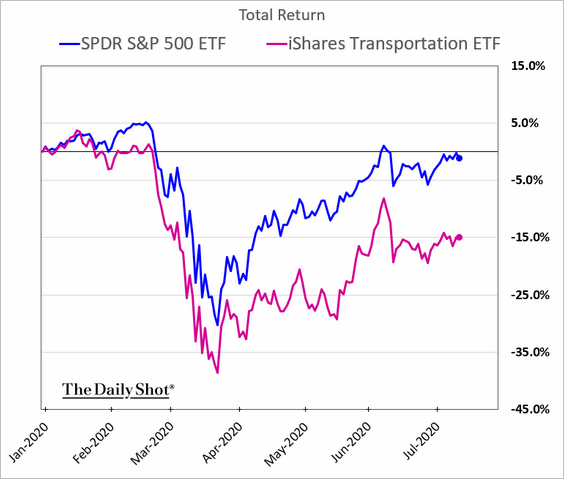
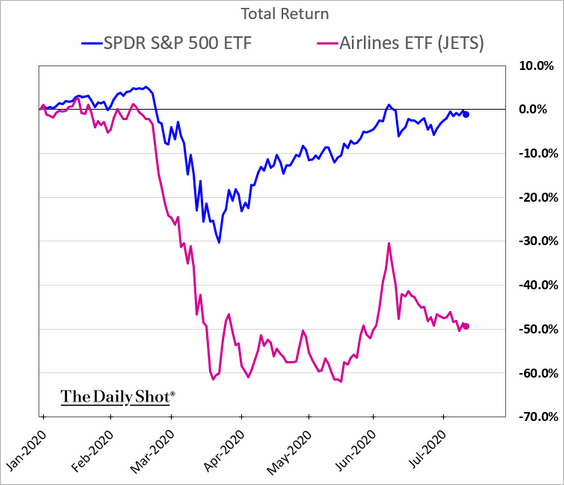
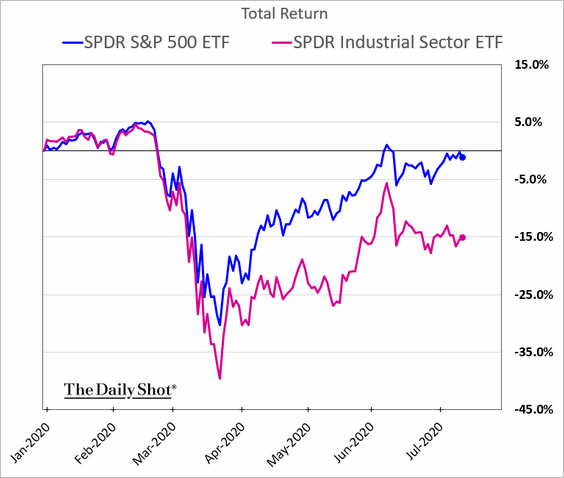
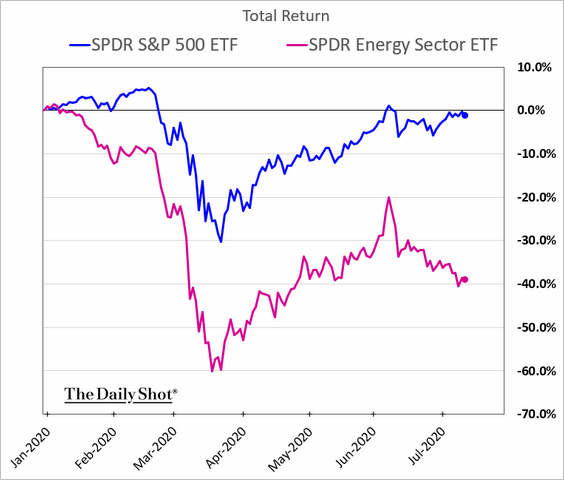
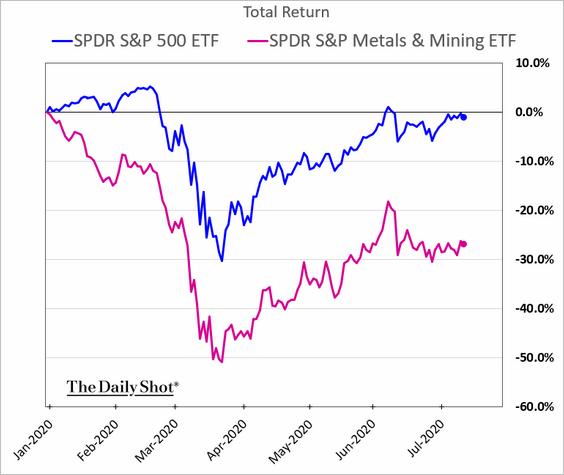
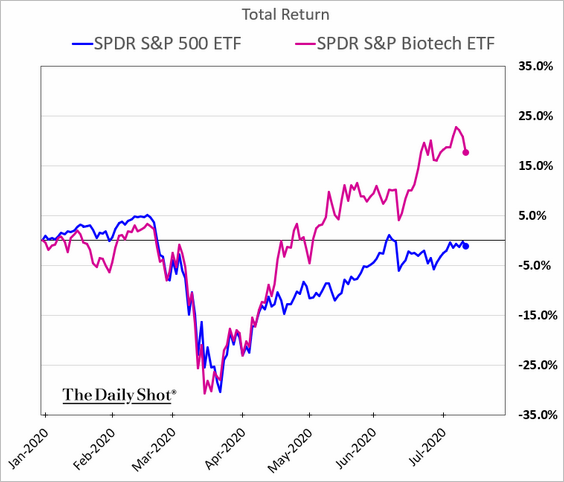
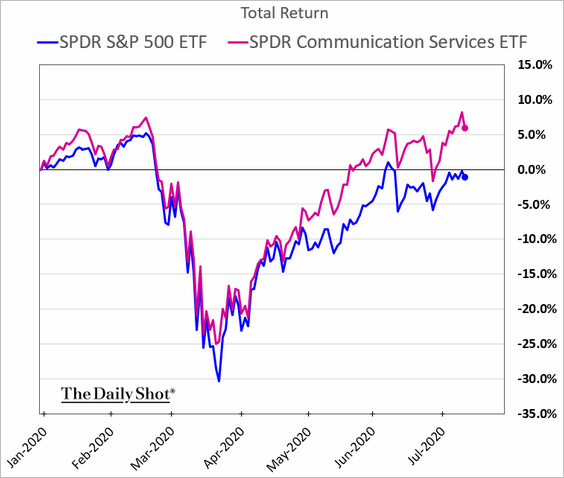
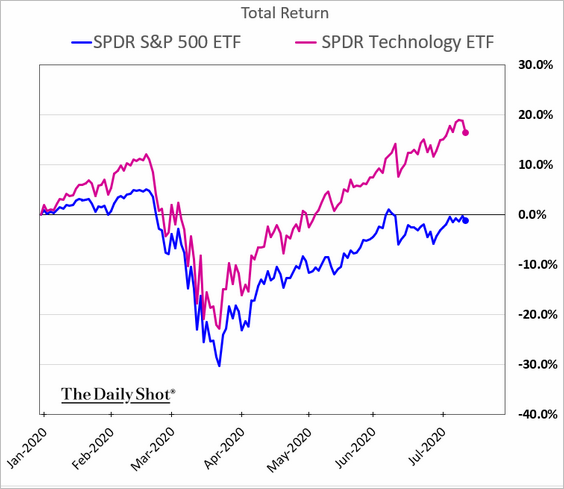
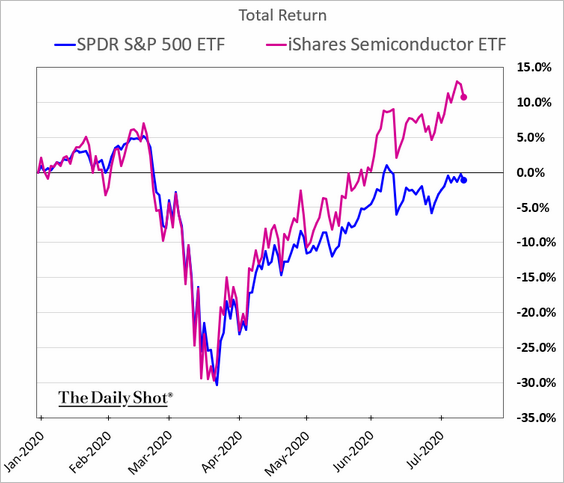
8. Next, we have the year-to-date relative performance of several US sectors.
• Banks:
• Real estate operators (REITs):
• Consumer Discretionary:
• Transportation (2 charts):
• Industrials:
• Energy:
• Metals & Mining:
• Biotech:
• Communication Services:
• Tech and semiconductors:
FANG+ stocks:
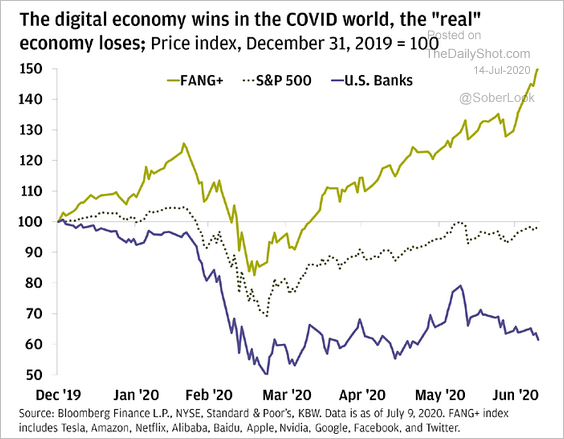 Source: @ISABELNET_SA, @jpmorgan
Credit
1. Secured high-yield bond issuance spiked this year.
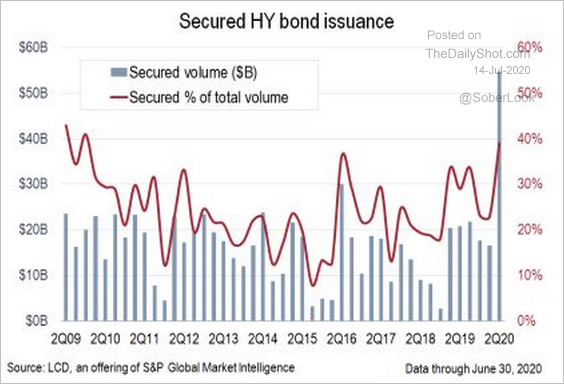 Source: @lcdnews, @JakemaLewis
2. This chart shows the issuance of social bonds.
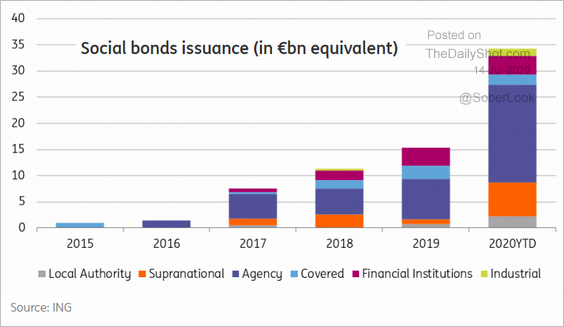 Source: ING
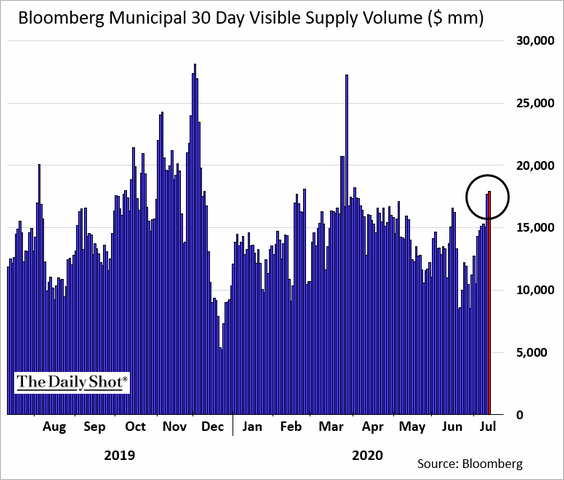
3. The US muni supply is rebounding.
Rates
1. While the 10-year nominal yield remains in a tight range, the breakeven and real yield saw substantial movements in recent months.
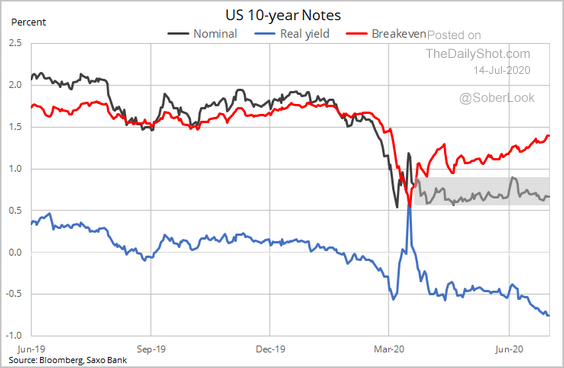 Source: @Ole_S_Hansen
2. Is the copper/gold ratio signaling higher Treasury yields?
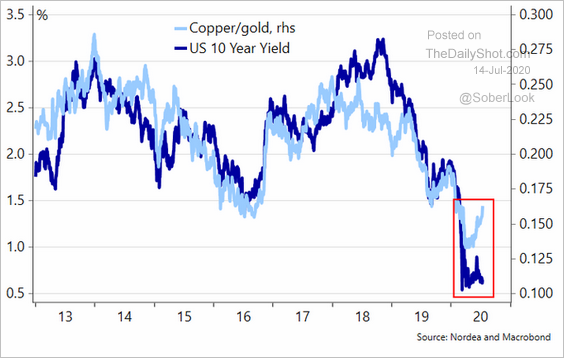 Source: @meremortenlund
3. Treasury bill auction demand remains solid as average bid-to-cover ratios have increased in the 1-month and 6-month tenors.
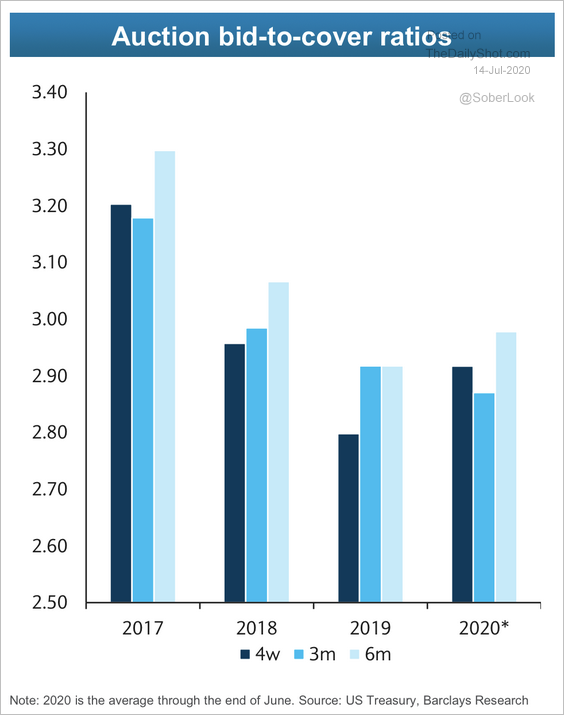 Source: Barclays Research
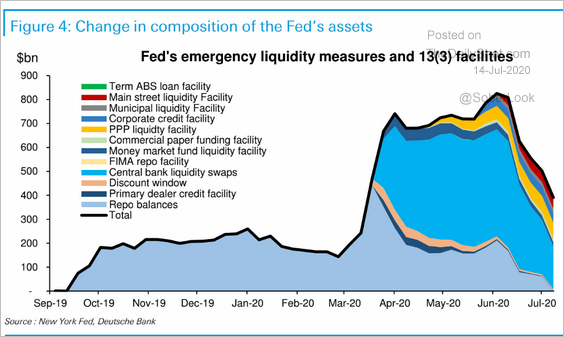
4. This chart shows the Fed’s liquidity facilities over time (see #4 here).
 Source: Deutsche Bank Research
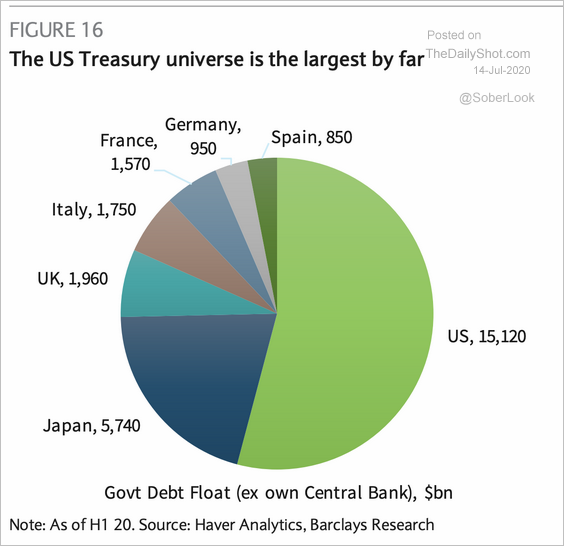
5. Next, we have some data on government debt in select economies (3 charts).
 Source: Barclays Research, @Schuldensuehner
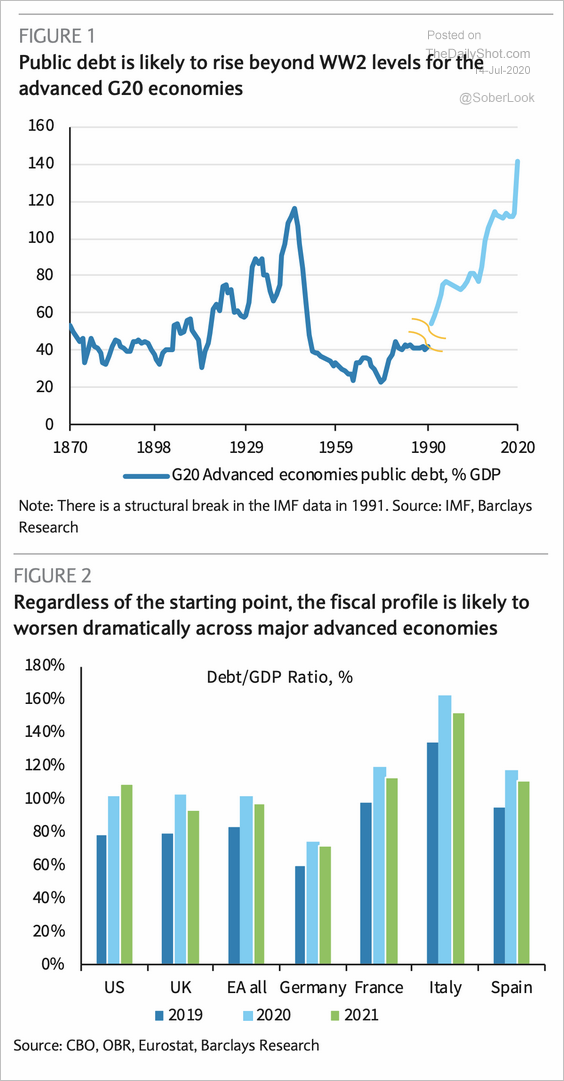 Source: Barclays Research, @Schuldensuehner
Global Developments
1. Cross-asset volatility subsided from the March highs but remains elevated relative to one year ago.
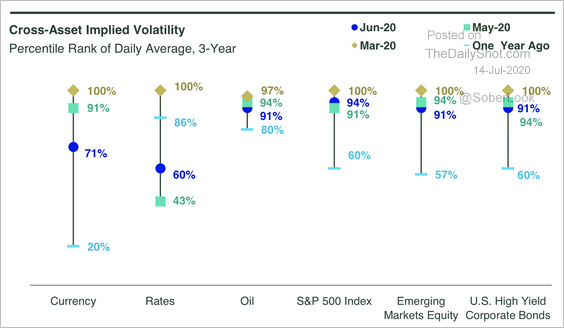 Source: SPDR Americas Research, @mattbartolini
2. G7 productivity growth has deteriorated in recent decades.
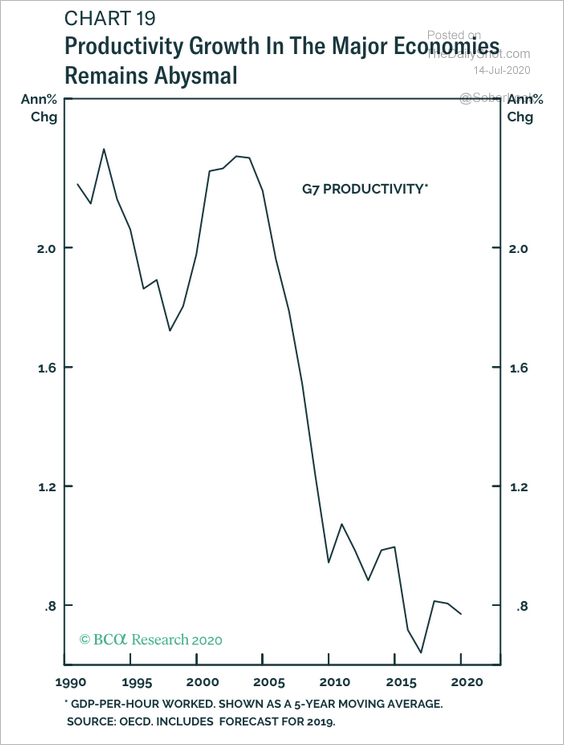 Source: BCA Research
3. This has been a lopsided global auto recovery, with China in the lead and Europe stalling.
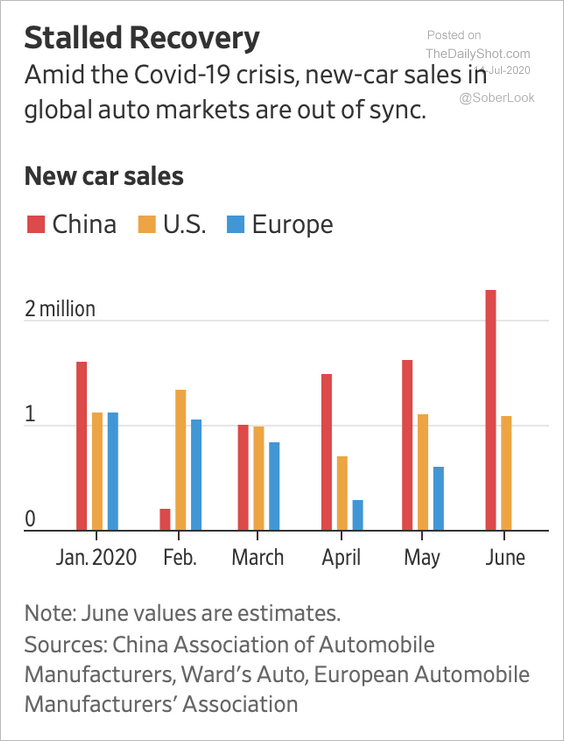 Source: @WSJ Read full article
4. Finally, we have the domiciles of global investment fund assets.
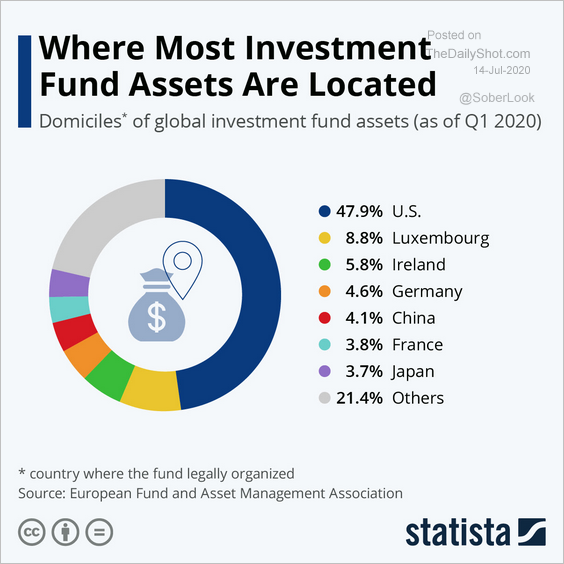 Source: Statista
——————–
Food for Thought
1. Class-action filings in the US:
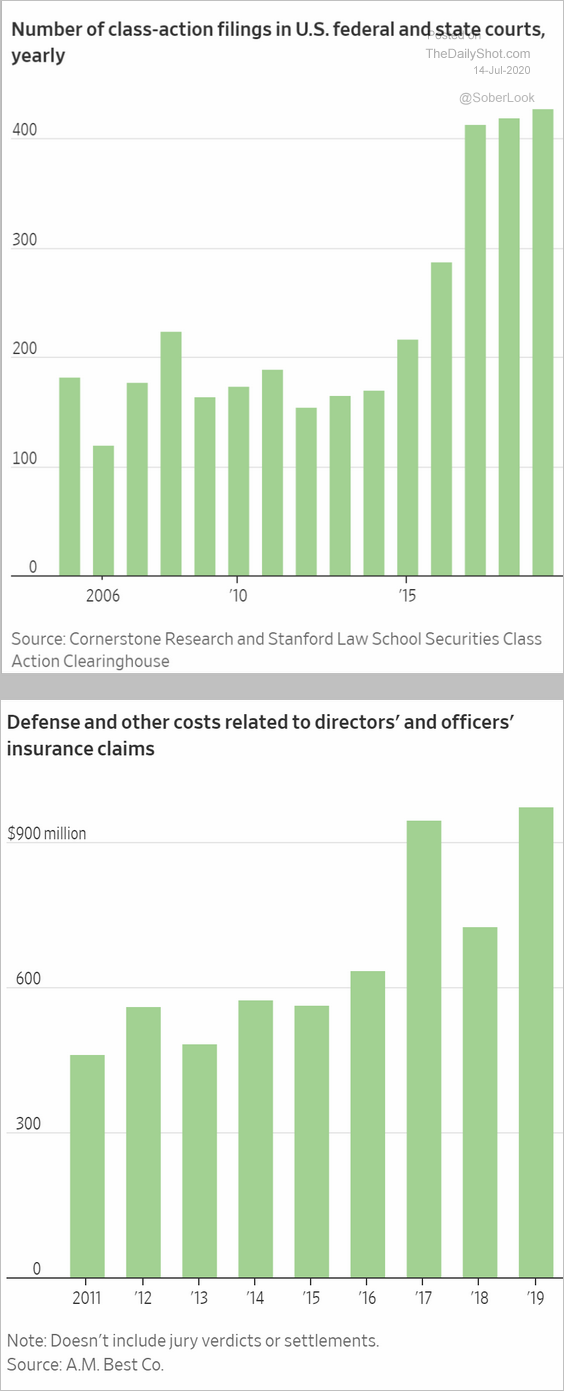 Source: @WSJ Read full article
2. The Las Vegas strip revenue mix:
 Source: Morgan Stanley Research, Snippet.Finance
3. New York City subway ridership:
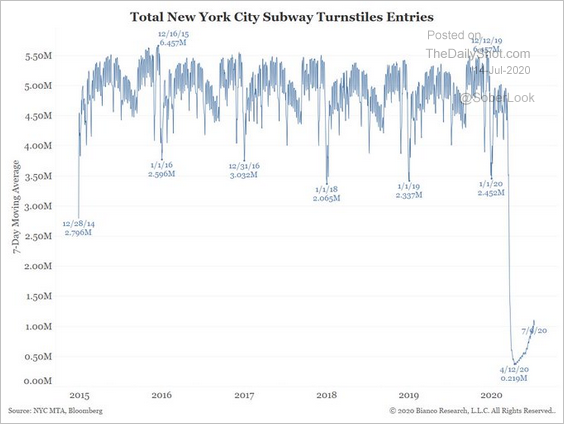 Source: @LizAnnSonders, @biancoresearch, @MTA, @Bloomberg
4. Manhattan rents:
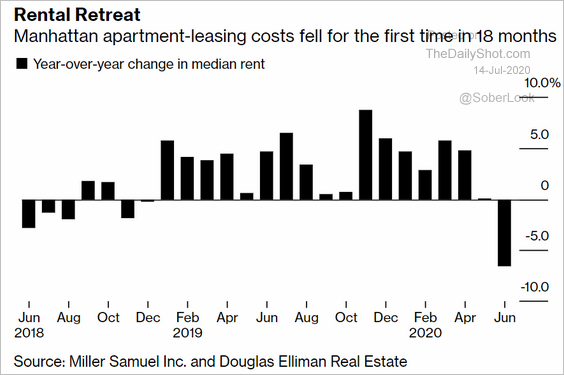 Source: @business Read full article
5. Next month’s mortgage payment:
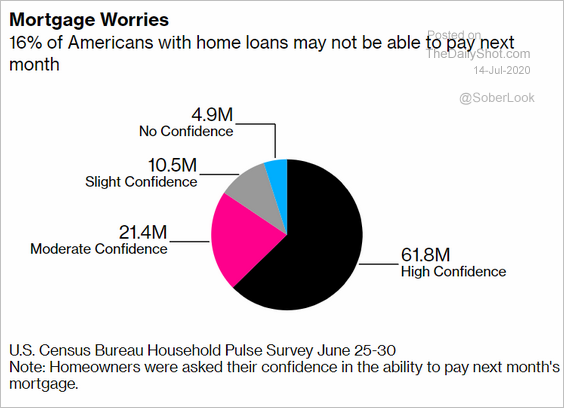 Source: @markets Read full article
6. Consumer spending on essentials (by income category):
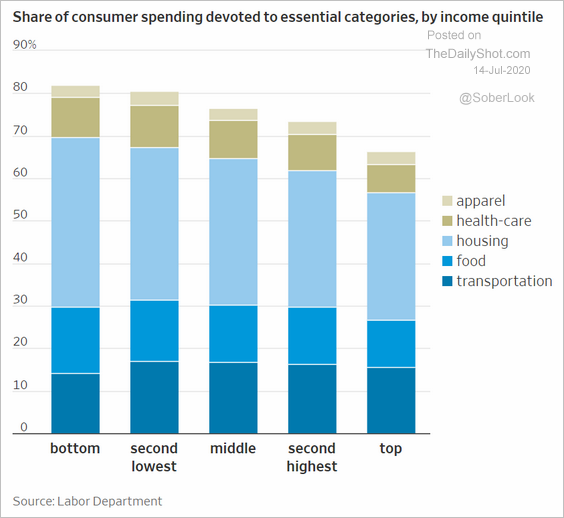 Source: @WSJ Read full article
7. New coronavirus cases vs. mask usage and restaurant activity:
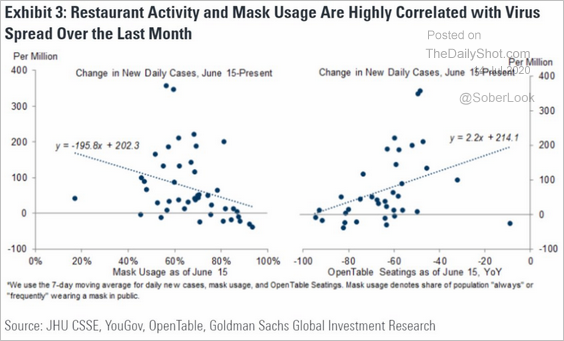 Source: @LizAnnSonders, @GoldmanSachs
8. Percent of the population between 15 and 64 years old:
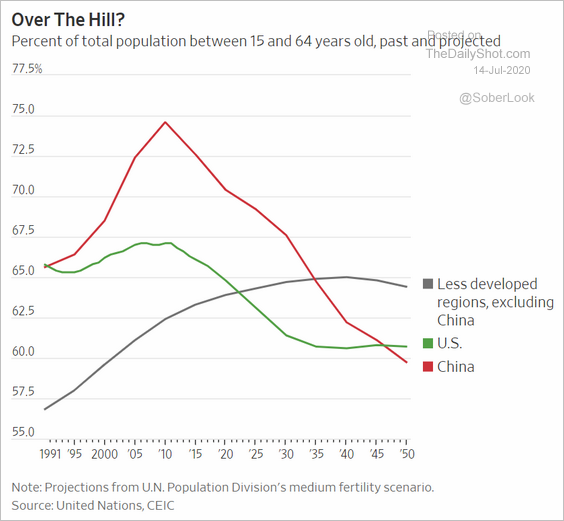 Source: @WSJ Read full article
9. The number of pubs in the UK:
 Source: Statista
——————–