
The Daily Shot: 03-Aug-20
• The United States
• Canada
• The United Kingdom
• The Eurozone
• Japan
• Asia – Pacific
• China
• Emerging Markets
• Commodities
• Energy
• Equities
• Credit
• Rates
• Food for Thought
The United States
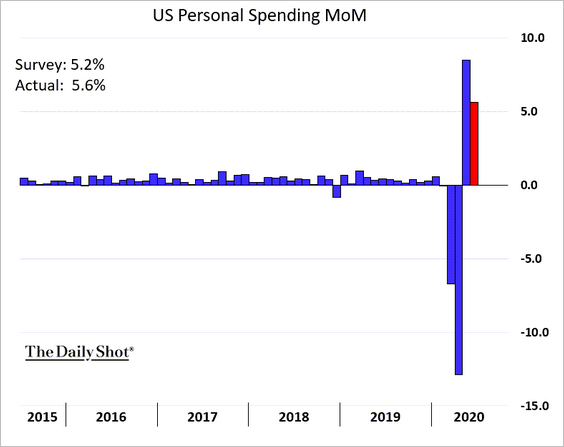
1. Consumer spending rose sharply in June as households put some of their pandemic savings to work.
• Here is the breakdown by sector.
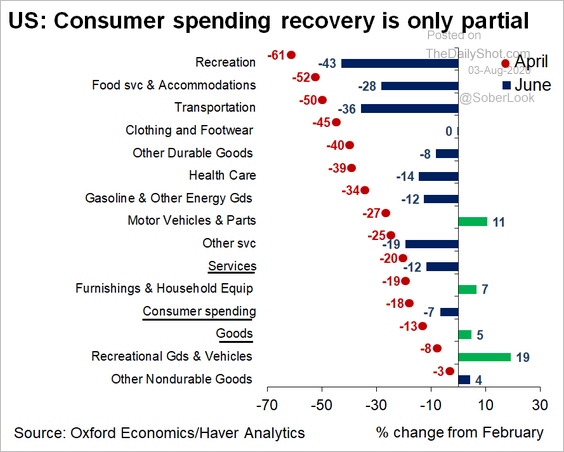 Source: @GregDaco
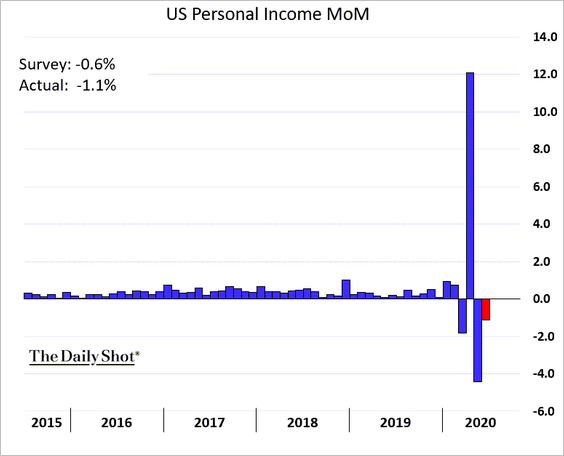
• Incomes declined.
• This chart shows the dollar amounts for income and spending.
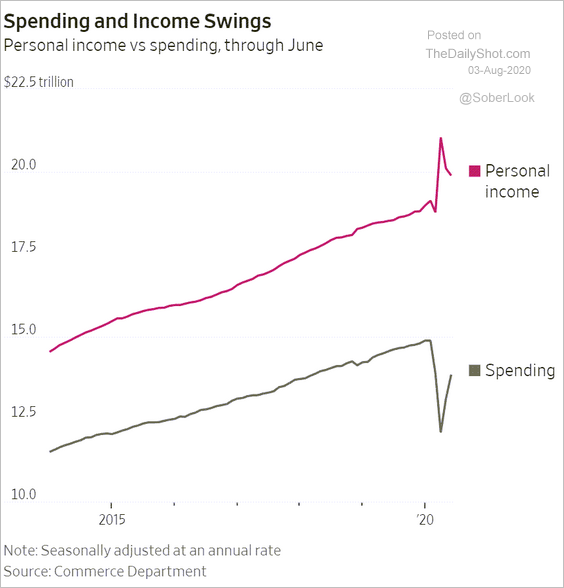 Source: @WSJ Read full article
• Here are the contributions to the overall change in disposable income from February to June.
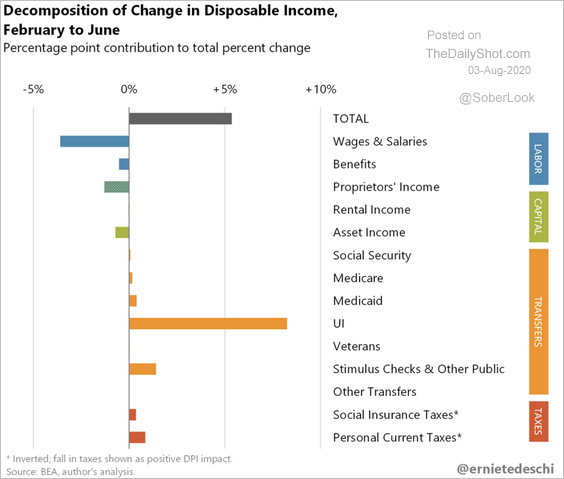 Source: @ernietedeschi
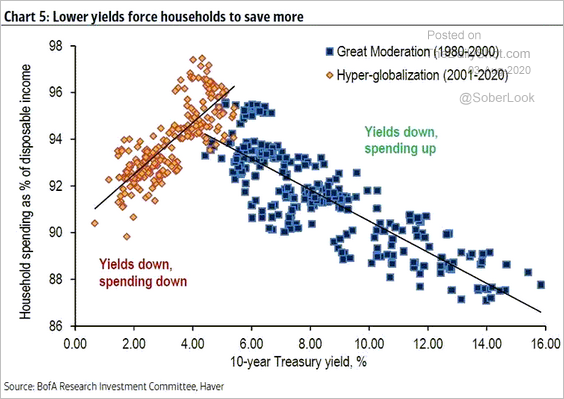
• Separately, the scatterplot below shows the two regimes of household spending vs. the 10yr Treasury yield.
 Source: BofA Merrill Lynch Global Research
——————–
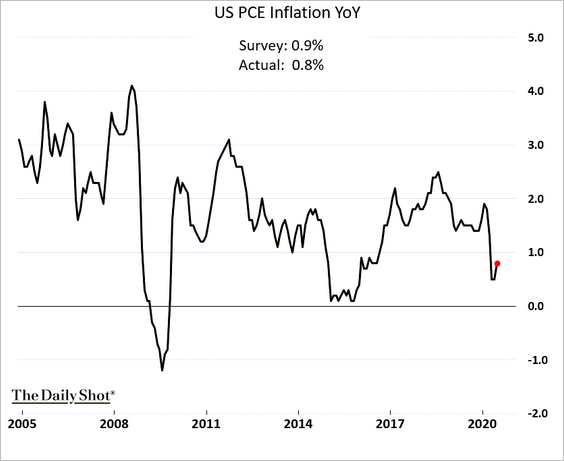
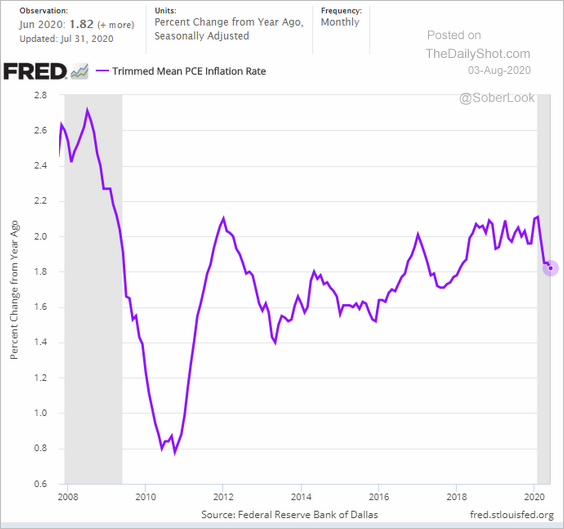
2. The PCE inflation rate ticked up in June but was below market expectations.
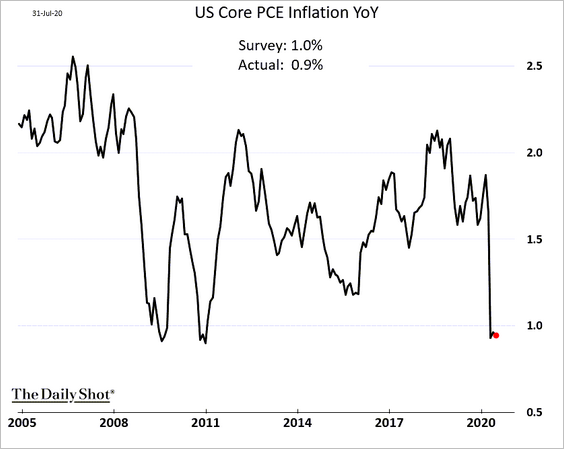
• The core PCE measure, the Fed’s preferred benchmark, is holding below 1%.
• Here is the trimmed mean PCE index from the Dallas Fed.
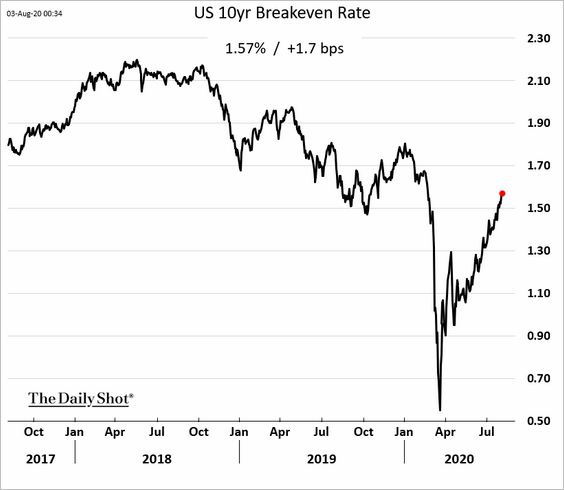
• Longer-term market-based inflation expectations continue to climb.
——————–
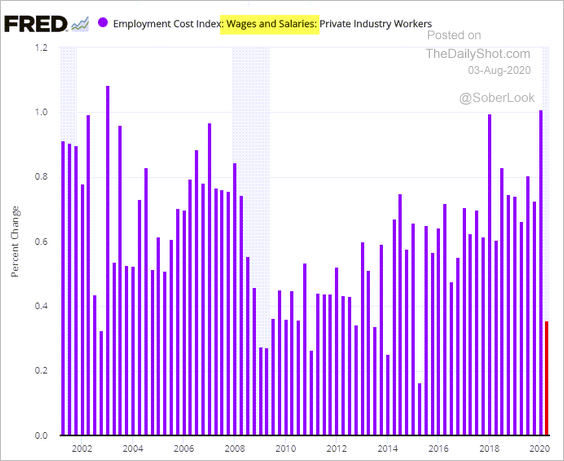
3. Growth in the US employment cost index slowed last quarter.
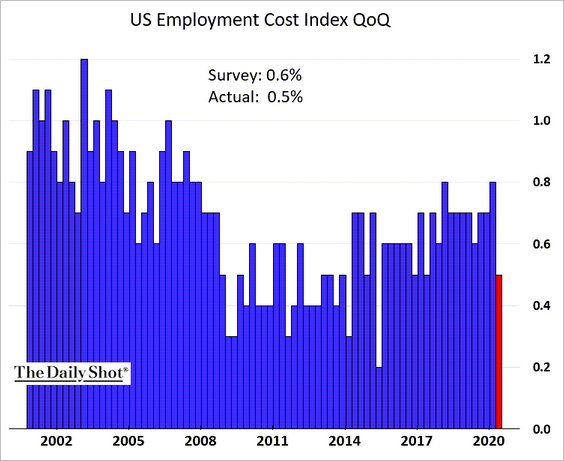
Here is the ‘wages and salaries’ component.
——————–
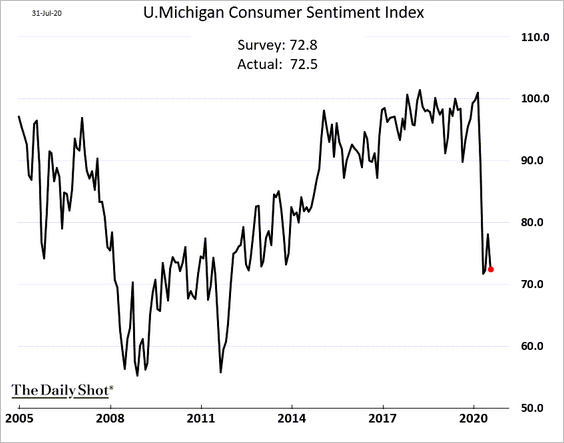
4. The updated U. Michigan consumer sentiment index weakened in the latter part of July.
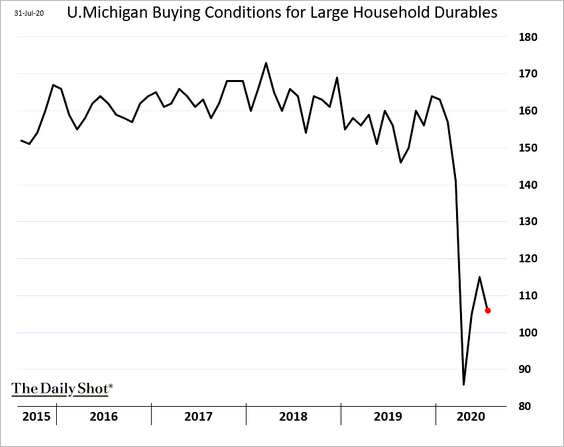
The index of buying conditions for large household items gave up its June gains.
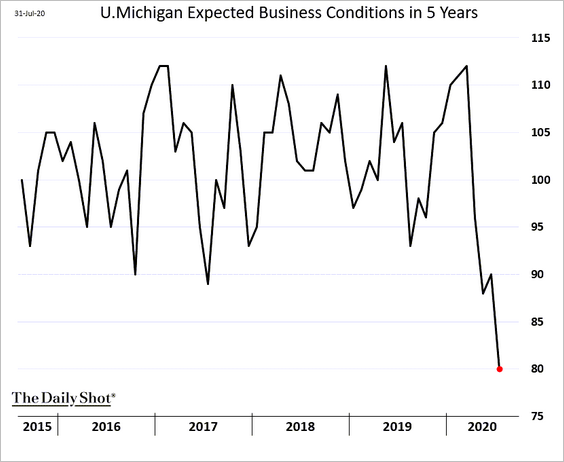
Here is the index of expected business conditions in five years.
——————–
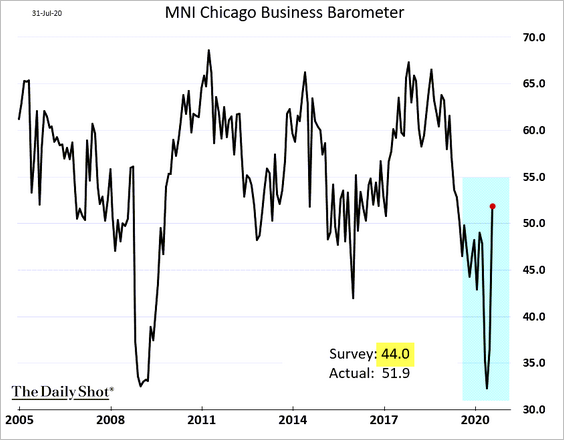
5. The Chicago PMI rebounded sharply last month, suggesting that Midwest manufacturing activity is back in growth mode. We should see substantial gains in the ISM manufacturing index today.
6. Vehicle sales strengthened in June, …
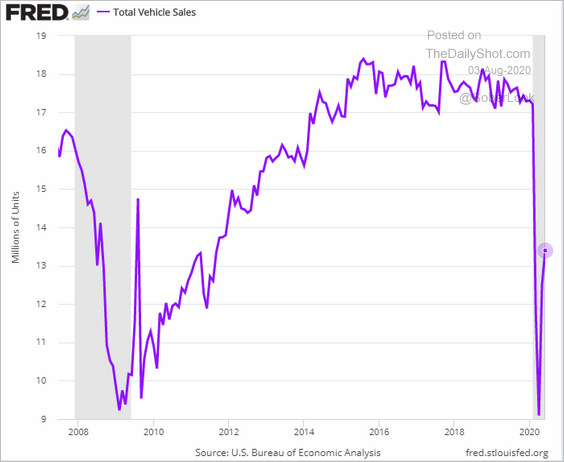
… and online search activity points to further gains in July.
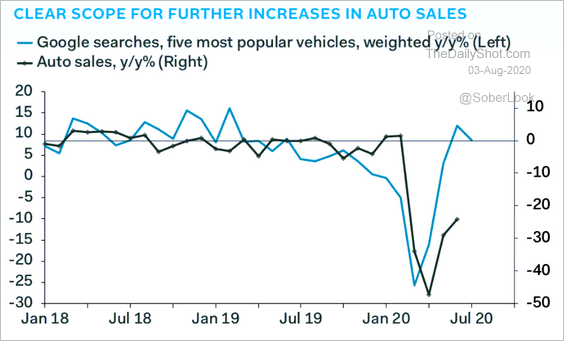 Source: Pantheon Macroeconomics
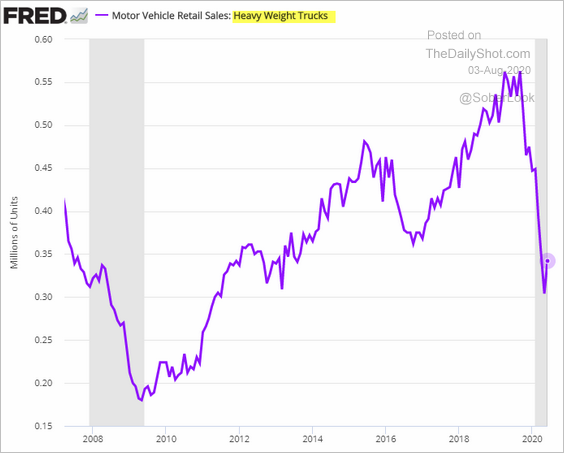
Heavy truck sales have been soft.
——————–
7. The US economic contraction in 2020 has been less severe than what we see in the Eurozone. The unprecedented fiscal stimulus cushioned the US slump.
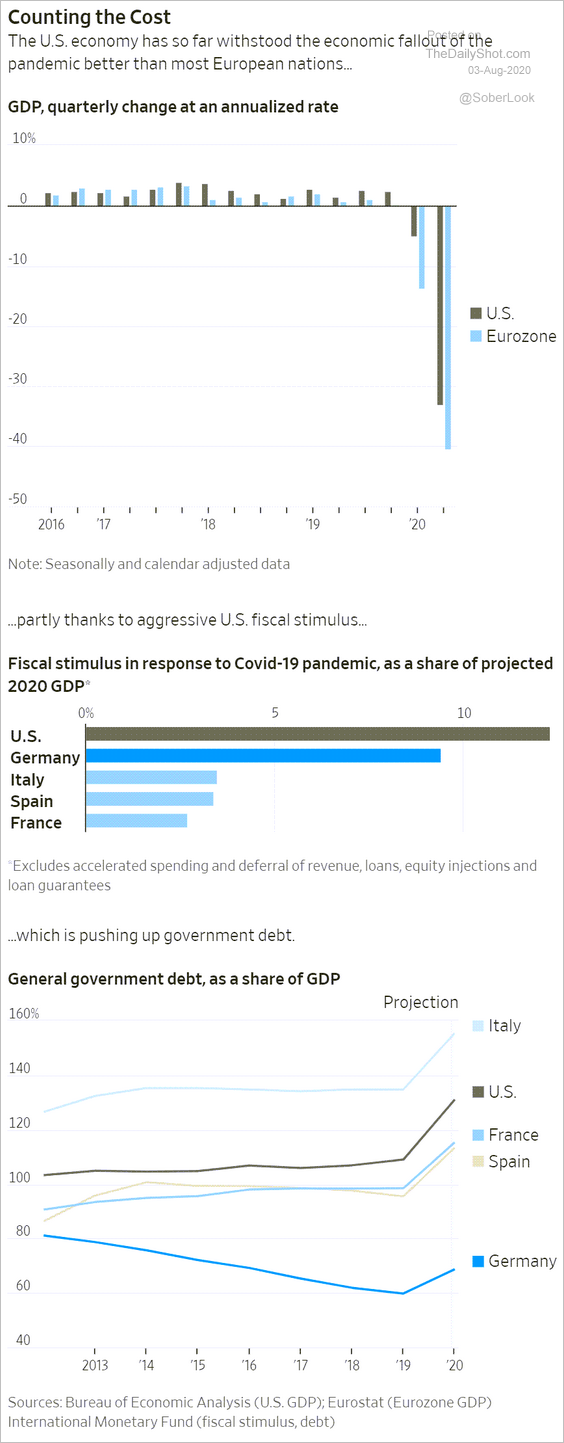 Source: @WSJ Read full article
Here is Morgan Stanley’s forecast for the US Q3 and Q4 GDP growth.
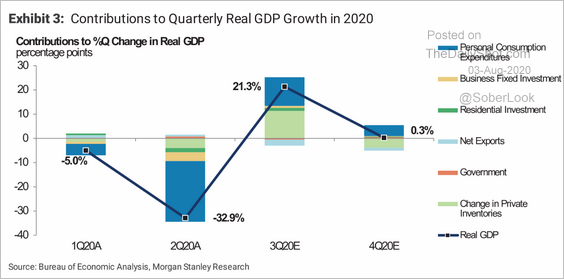 Source: Morgan Stanley Research
——————–
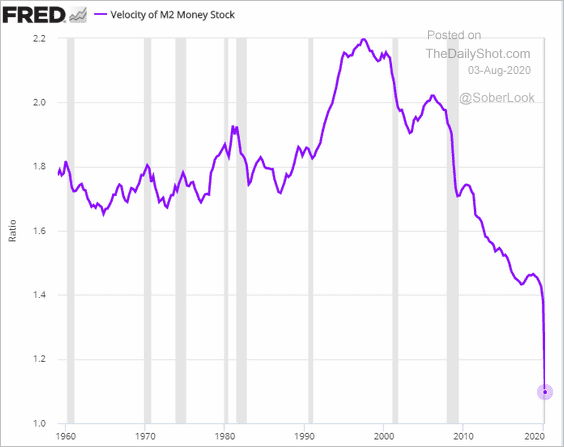
8. The US velocity of money has collapsed. The rapidly rising money supply has been generating far less economic growth (less GDP per unit of new credit).
9. Finally, we have some high-frequency indicators.
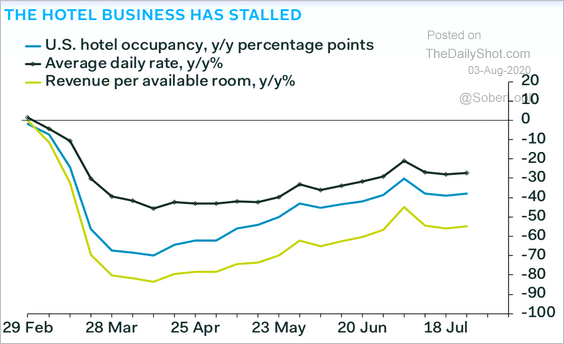
• Hotel occupancy and revenues:
 Source: Pantheon Macroeconomics
• The Oxford Economics Recovery Tracker:
![]() Source: @GregDaco, @OxfordEconomics
Source: @GregDaco, @OxfordEconomics
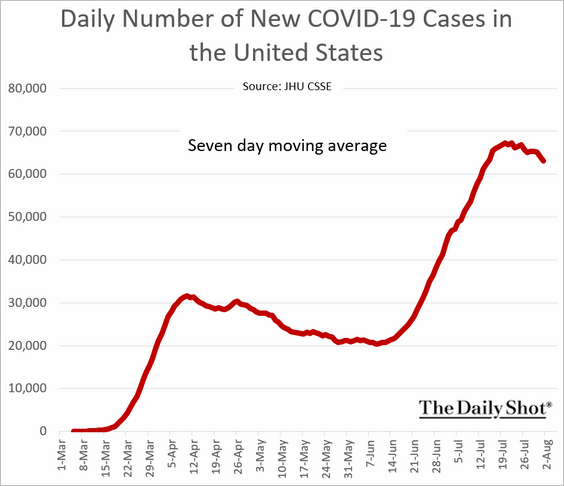
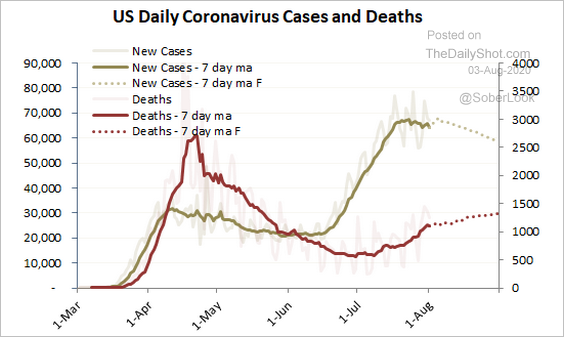
• New coronavirus cases (peaking):
Forecasts from Princeton Energy Advisors:
 Source: Princeton Energy Advisors
Canada
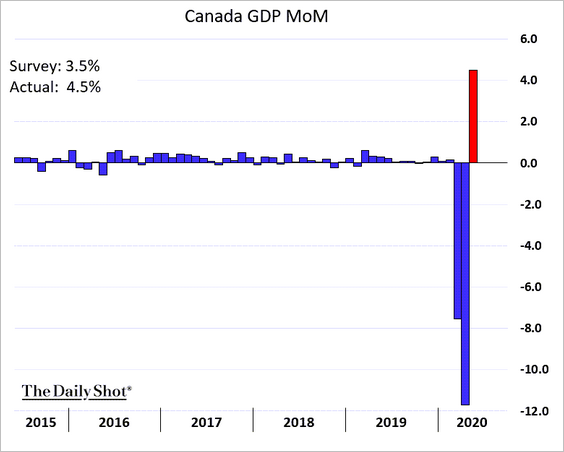
1. The economy returned to growth in May but remained almost 14% below last year’s levels.
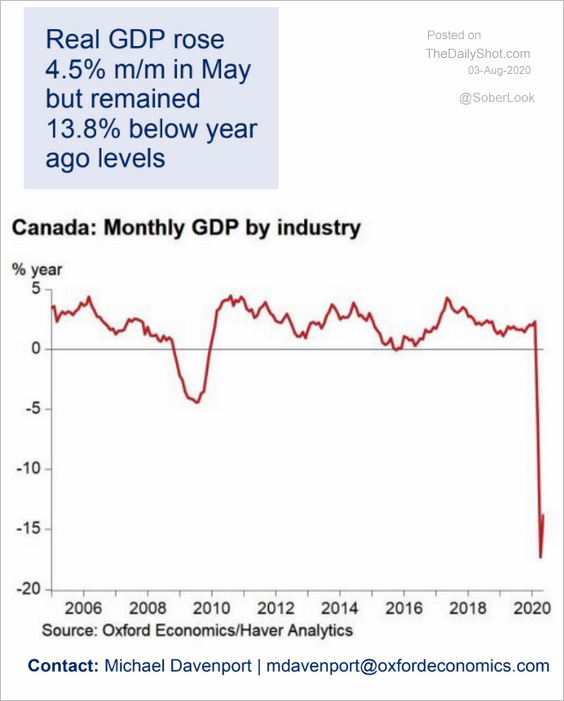 Source: Oxford Economics
——————–
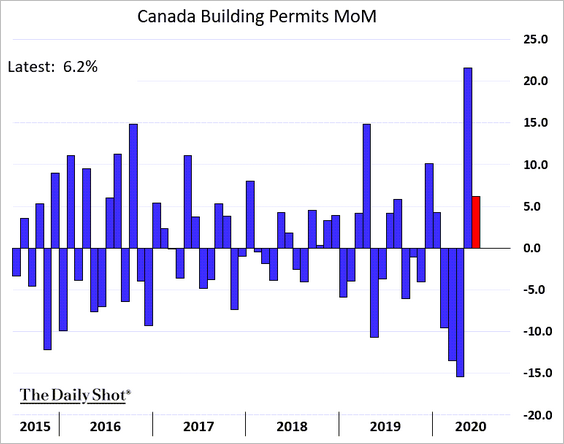
2. Construction permits increased further in June.
3. Canadian stocks appear oversold relative to the rest of the world.
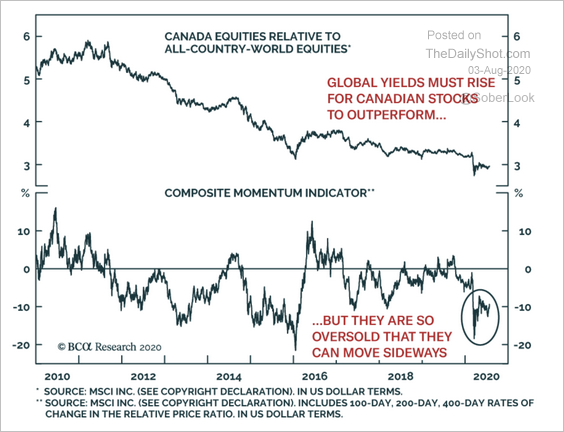 Source: BCA Research
The United Kingdom
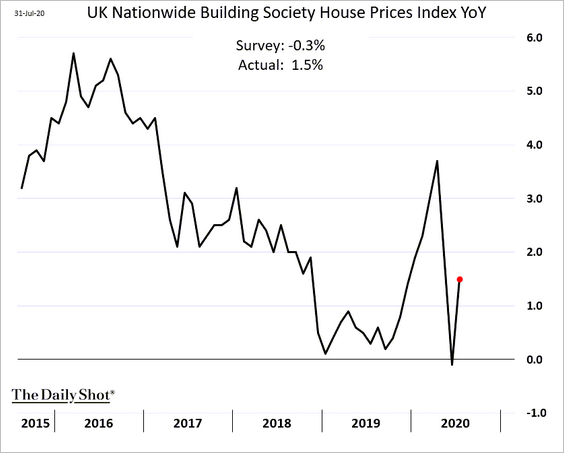
1. Home price appreciation rebounded in July on pent-up demand.
2. The labor market remains fragile.
• Furloughed employees:
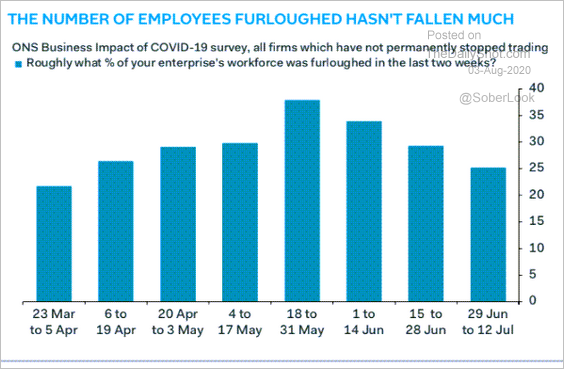 Source: Pantheon Macroeconomics
• Employment intentions survey:
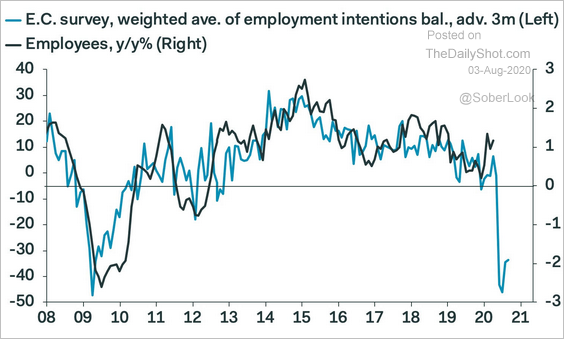 Source: Pantheon Macroeconomics
The Eurozone
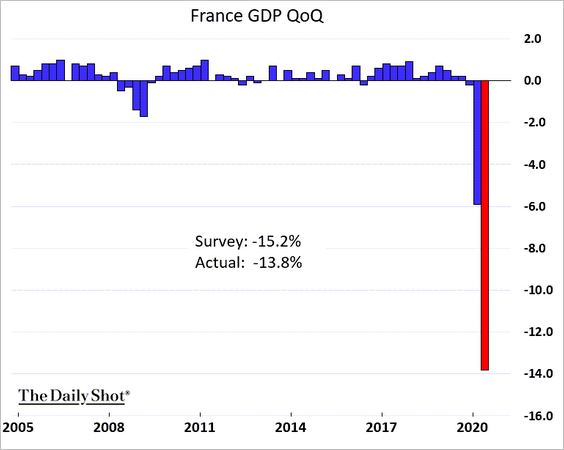
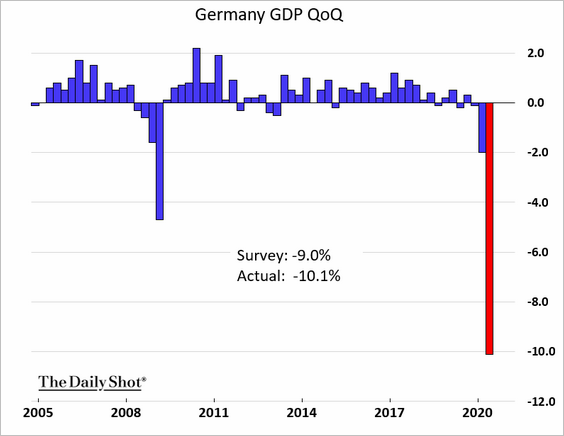
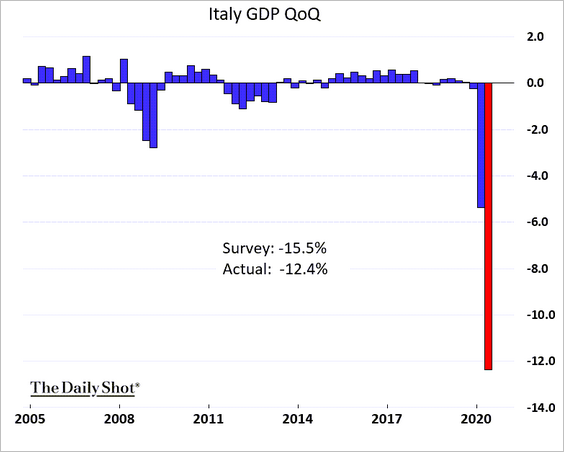
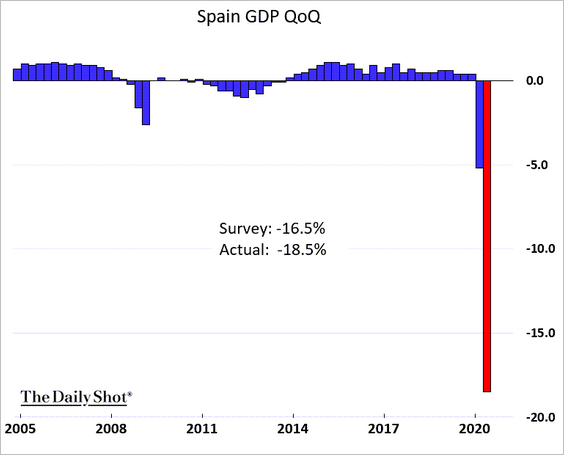
1. Let’s begin with the Q2 GDP contraction (Spain took the biggest hit).
• France:
• Germany:
• Italy:
• Spain:
Spain’s GDP index:
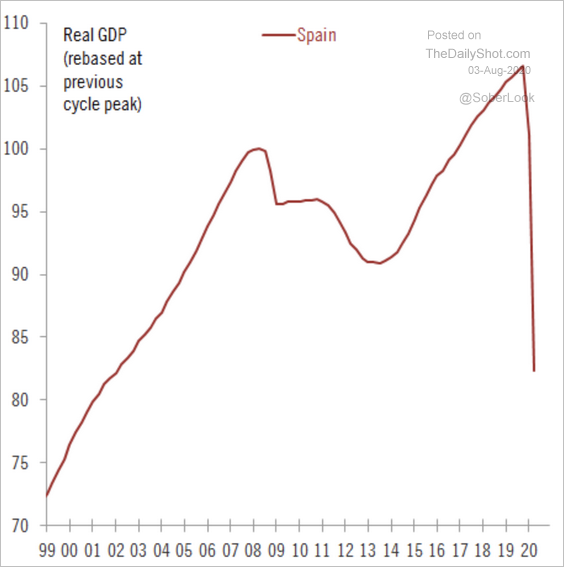 Source: @fwred
• The Eurozone (2 charts):
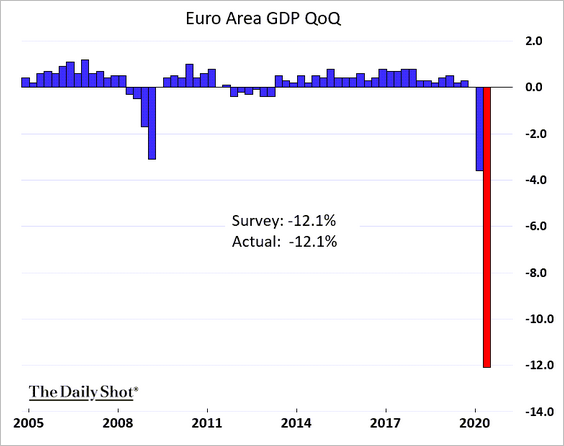
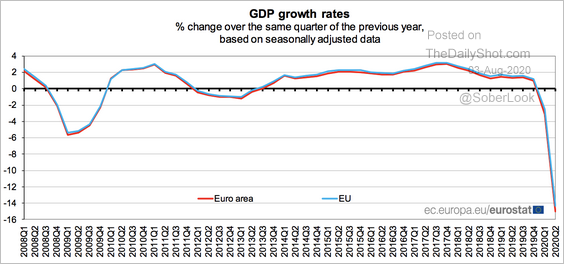 Source: Eurostat Read full article
• Summary:
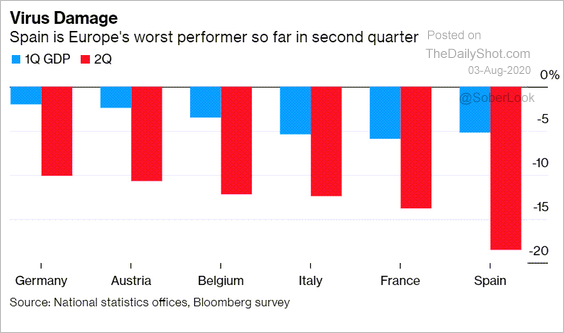 Source: @markets Read full article
• We should see a rebound going forward. July euro-area PMIs have recovered sharply, which could set the stage for more robust business activity in Q3.
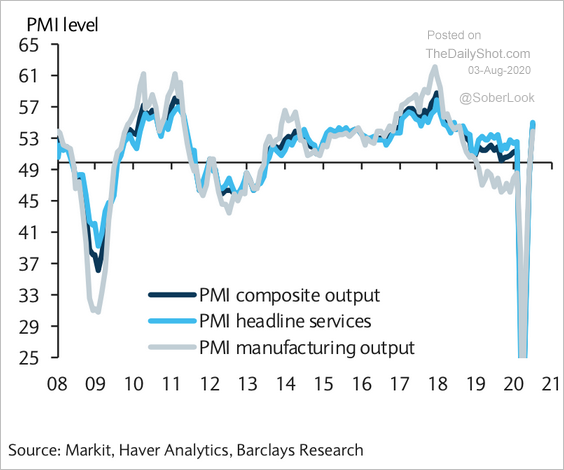 Source: Barclays Research
——————–
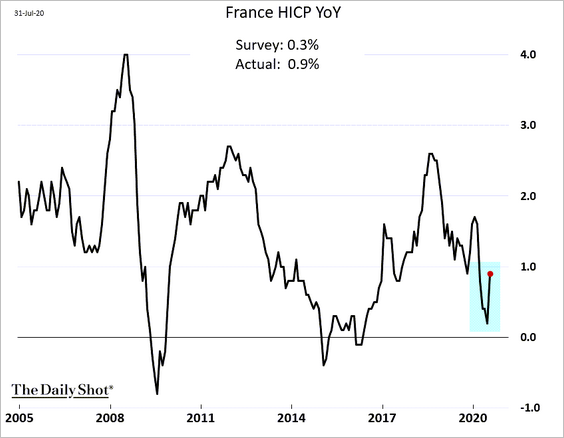
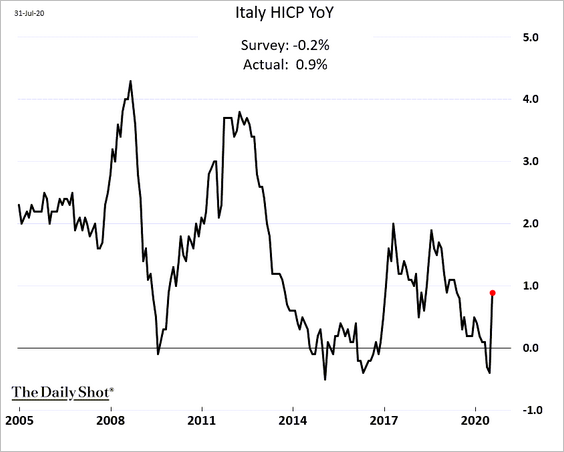
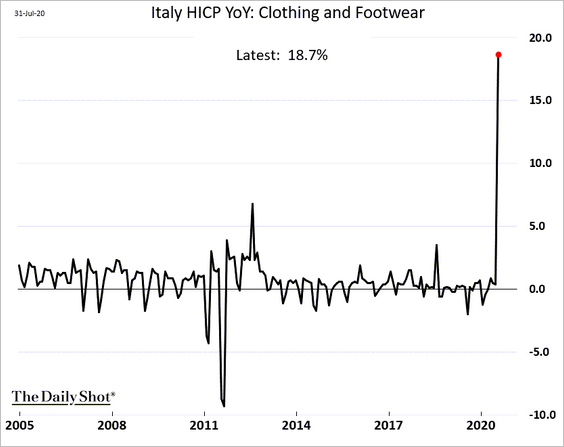
2. French and Italian CPI surprised to the upside – driven mostly by delayed summer sales.
• France:
• Italy (2 charts):
• The Eurozone (3 charts):
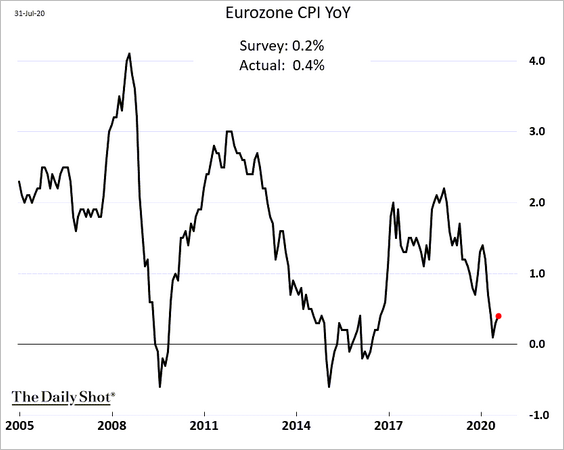
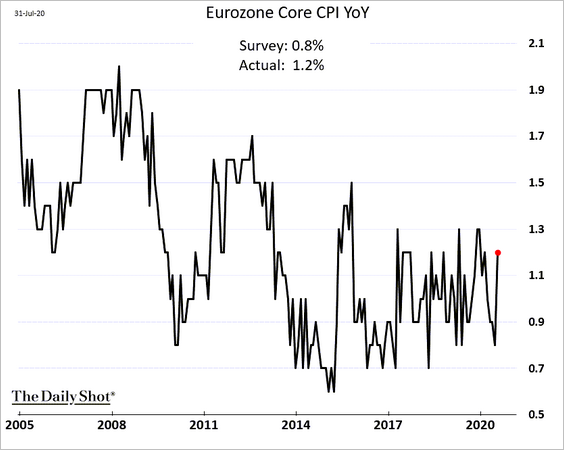
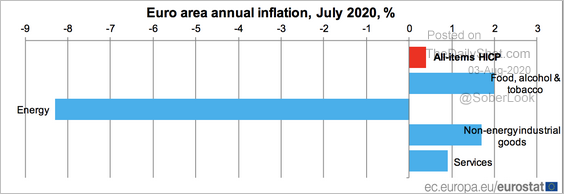 Source: Eurostat Read full article
• Barclays expects euro-area inflation to maintain some momentum this summer.
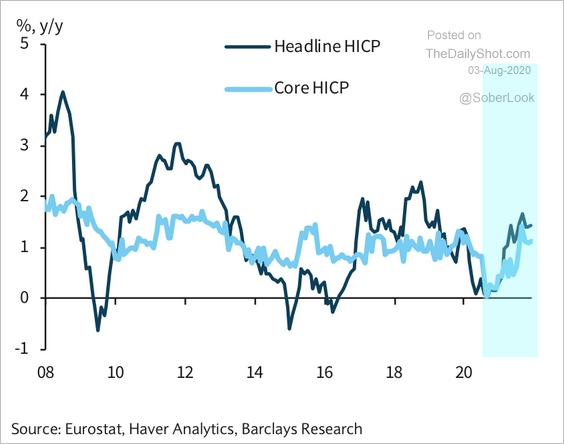 Source: Barclays Research
——————–
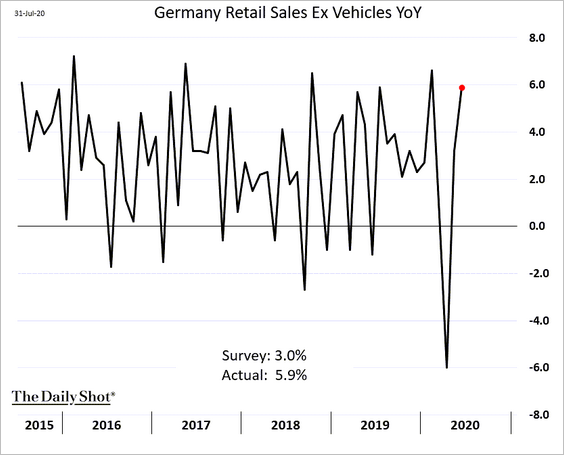
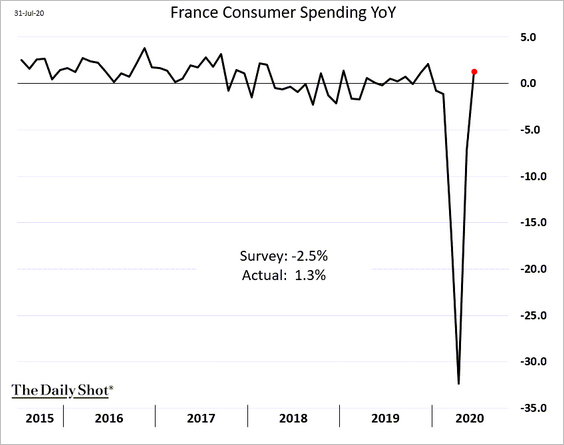
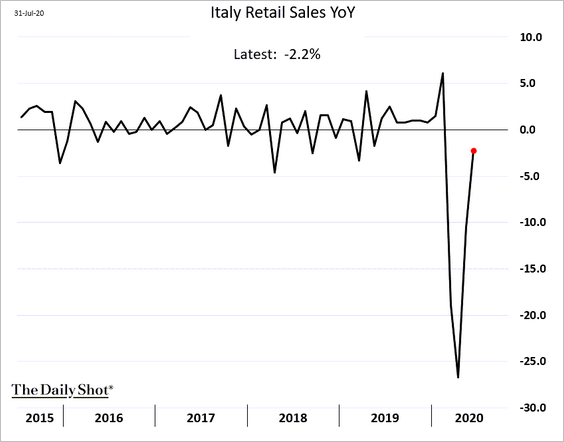
3. Euro-area consumption continued to recover in June.
• German retail sales:
• French consumer spending:
• Italian retail sales:
——————–
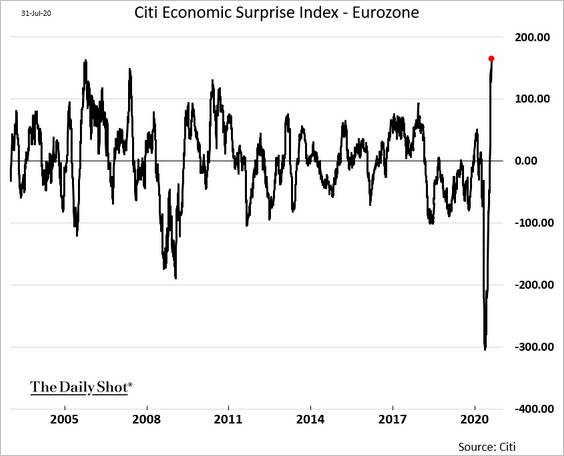
4. Overall, euro-area economic data have been surprising to the upside. The Citi Economic Surprise Index hit a record high last week.
——————–
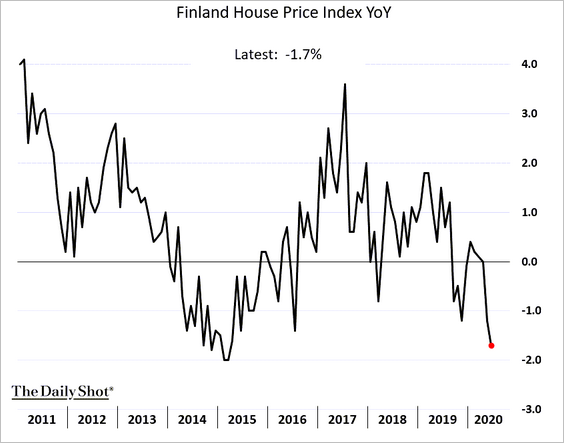
5. Finland is facing another bout of housing deflation.
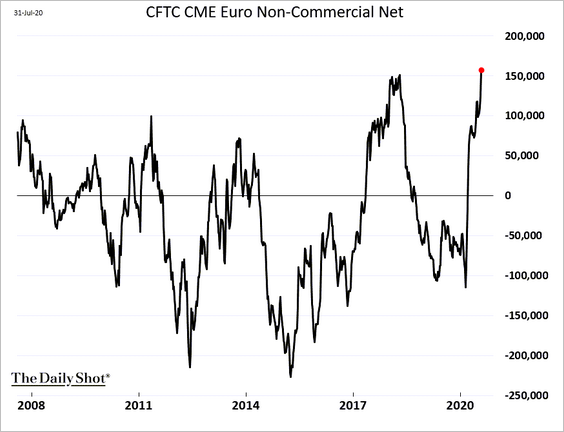
6. Speculative accounts, especially asset managers, continue to boost their bets on the euro.
7. Finally, the Eurosystem balance sheet has now exceeded 60% of the GDP.
 Source: @TheTerminal, @Schuldensuehner
Japan
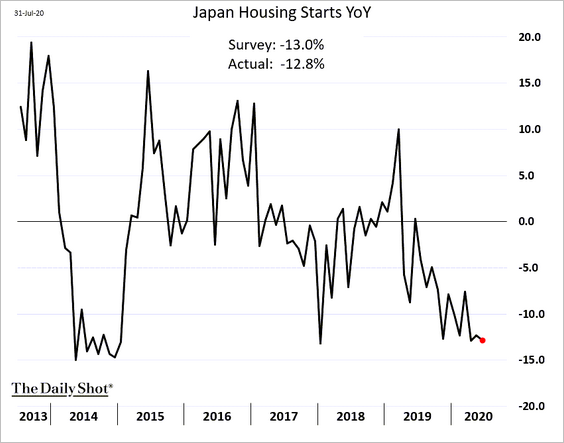
1. Housing starts continue to dwindle.
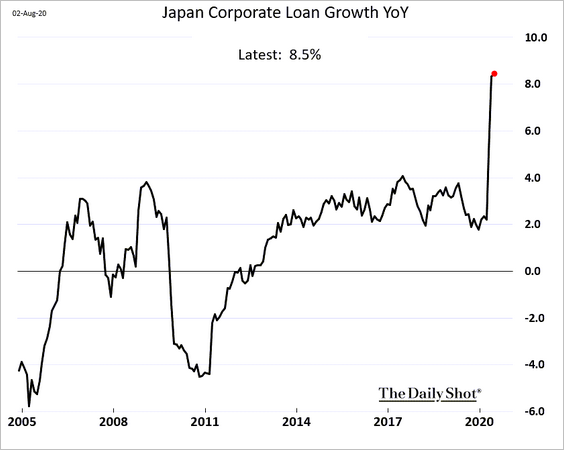
2. Corporate loan growth soared this year as companies tapped credit lines.
Asia – Pacific
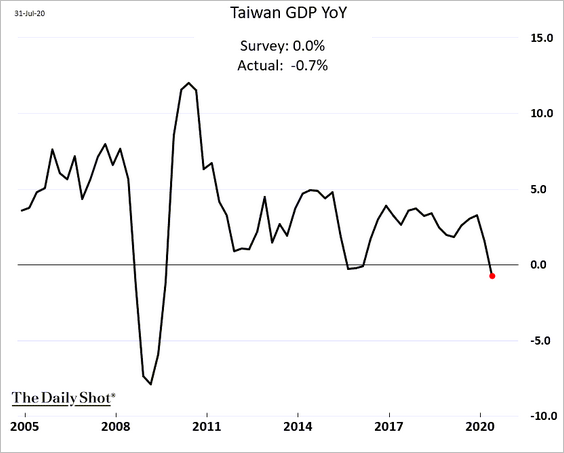
1. Let’s begin with Taiwan.
• Year-over-year GDP growth (through Q2):
• Manufacturing PMI (back in growth territory):
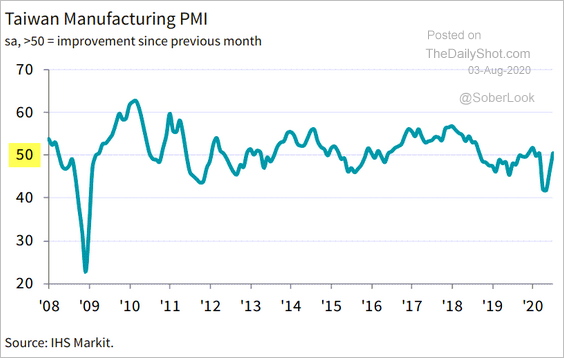 Source: IHS Markit Read full article
• Tech vs. non-tech exports:
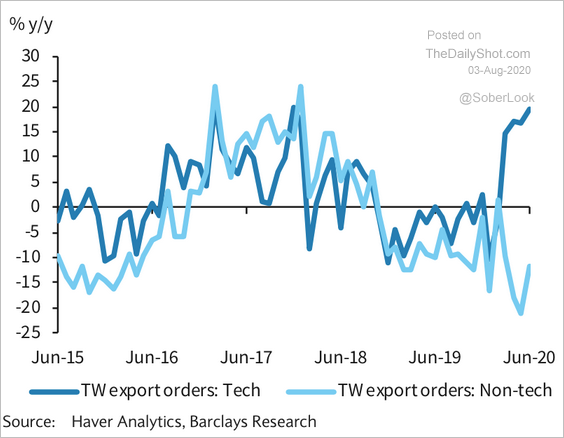 Source: Barclays Research
• Tech exports vs. South Korea:
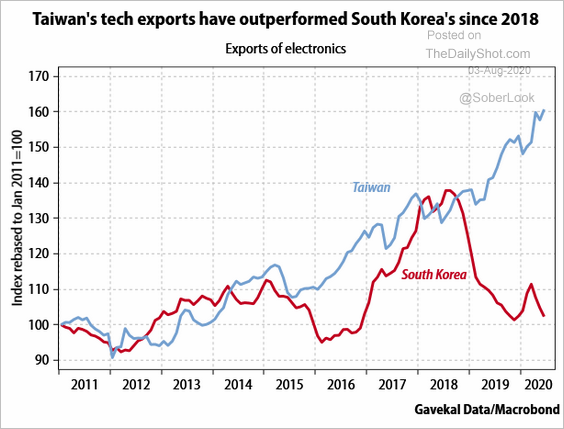 Source: Gavekal Read full article
——————–
2. South Korea’s manufacturing contraction slowed in July, but growth remained elusive.
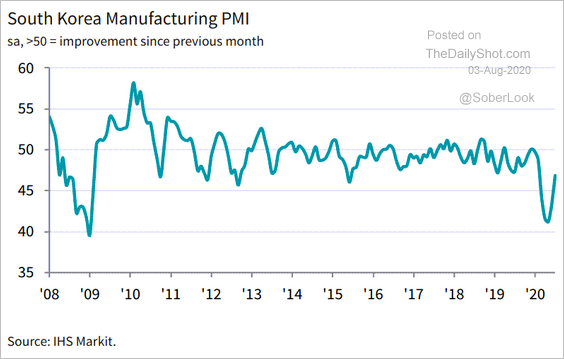 Source: IHS Markit Read full article
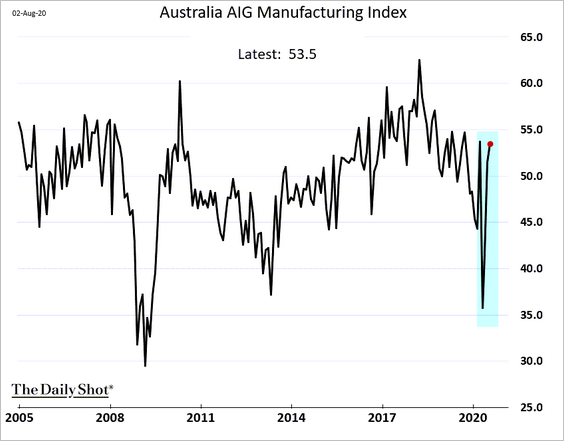
3. Australia’s factory activity accelerated last month.
• Australian business credit has been shrinking as firms pay down their credit facilities.
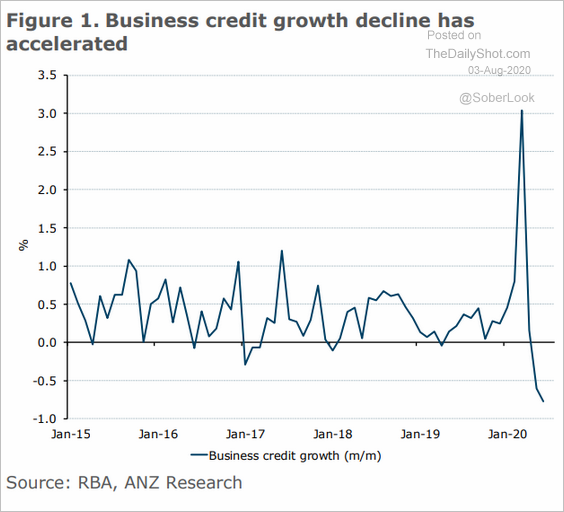 Source: ANZ Research
Housing credit growth has been slowing.
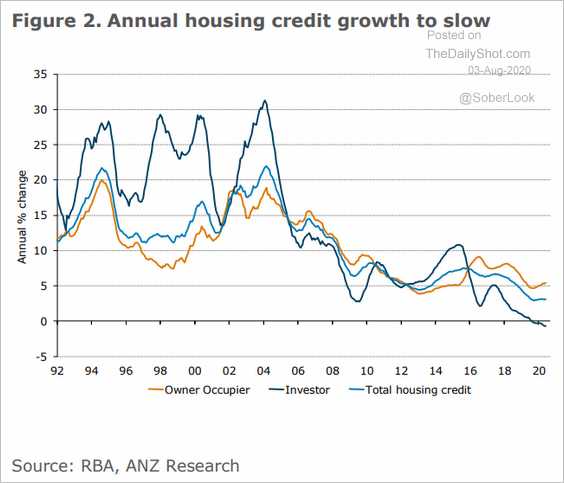 Source: ANZ Research
China
1. The renminbi continues to climb, …
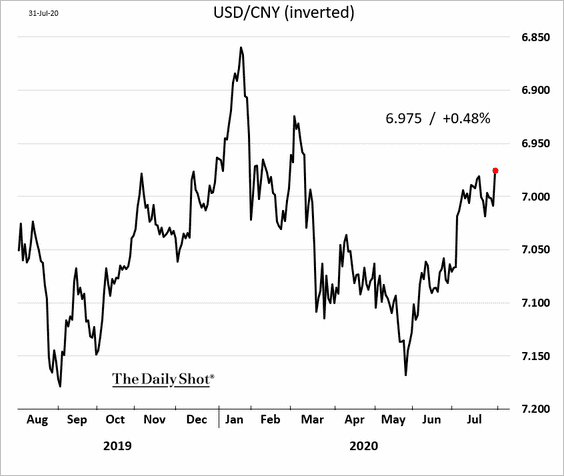
… helped by the US-China rate differential (2 charts).
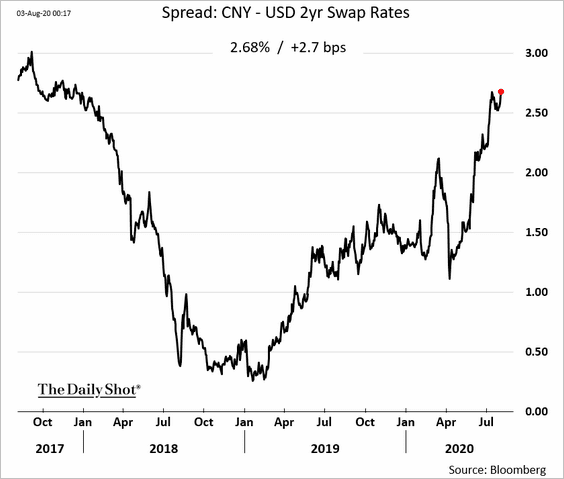
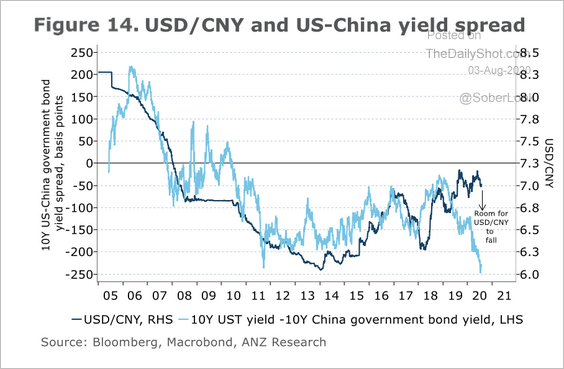 Source: ANZ Research
——————–
2. China is moving ahead to create a state-sponsored digital currency.
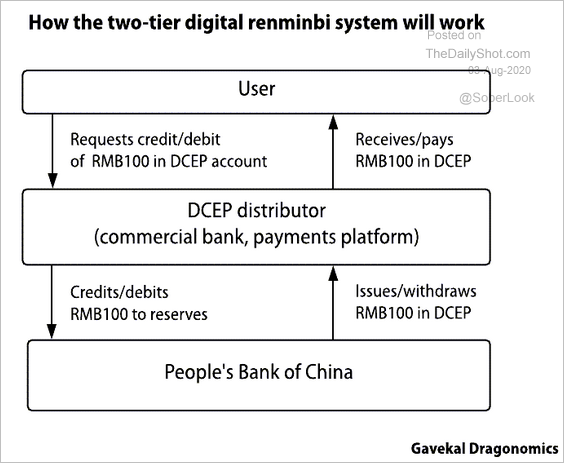 Source: Gavekal Read full article
3. Outward direct investment in the US has been slowing.
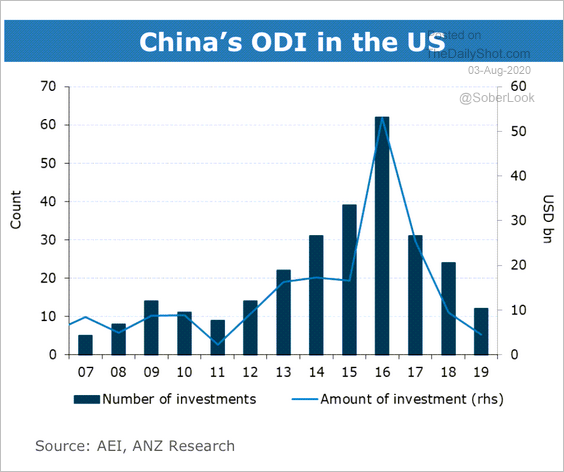 Source: ANZ Research
4. Fund inflows remain robust.
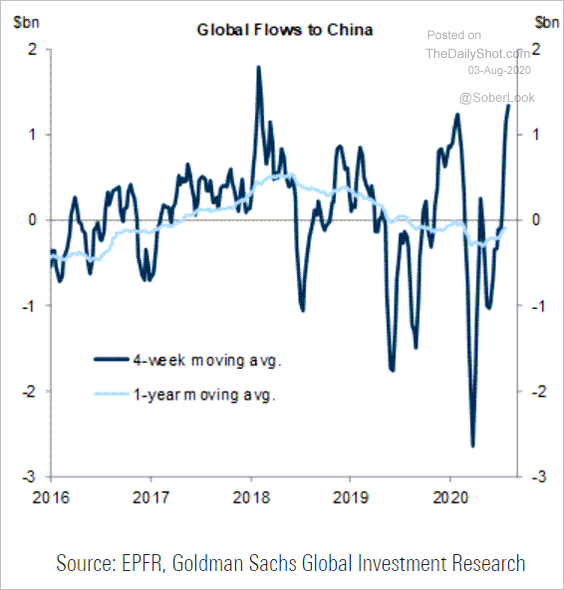 Source: Goldman Sachs
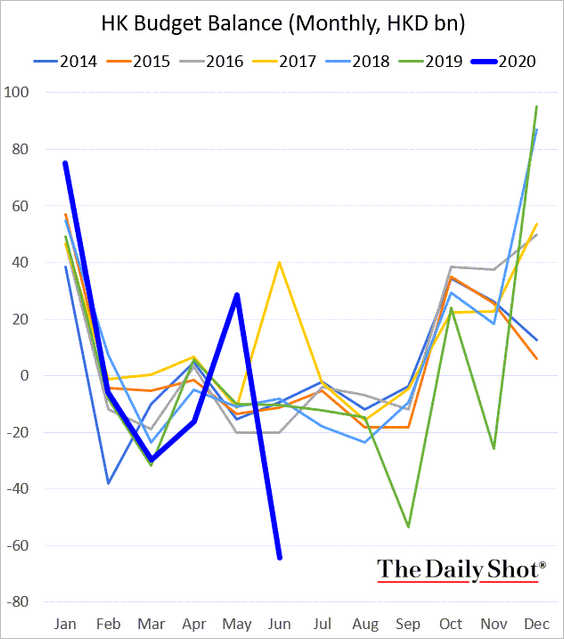
5. Hong Kong’s fiscal situation has deteriorated.
Emerging Markets
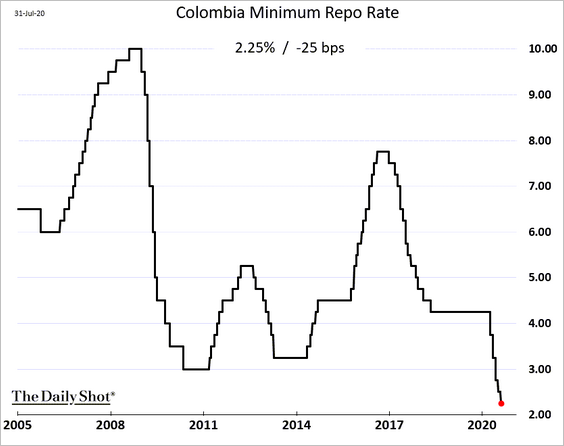
1. Colombia’s central bank cut rates to record lows.
 Source: @markets Read full article
——————–
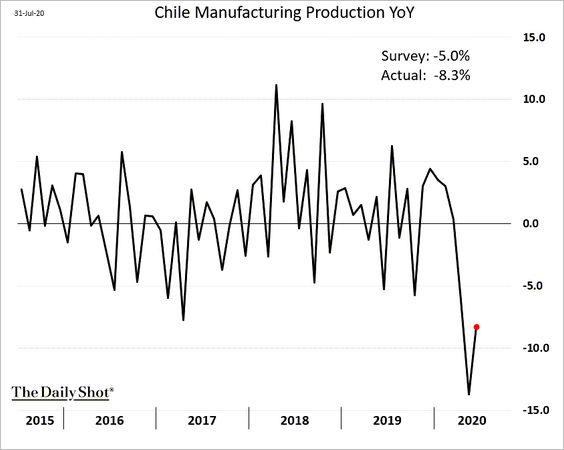
2. Chile’s factory output remained weak in June.
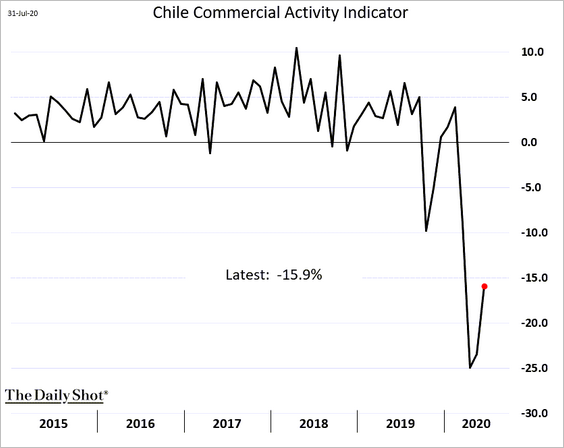
Here is Chile’s commercial activity indicator.
——————–
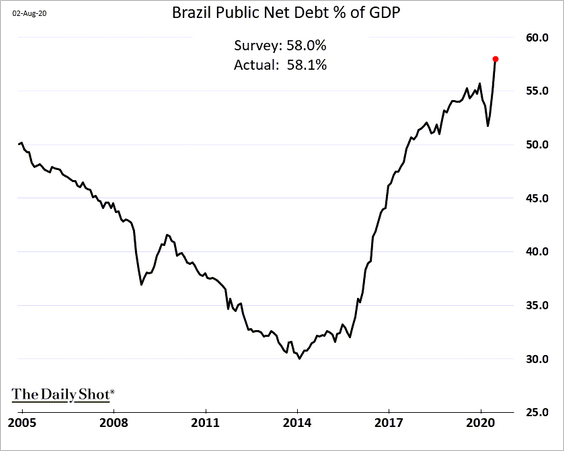
3. Brazil’s fiscal situation is deteriorating (2 charts).
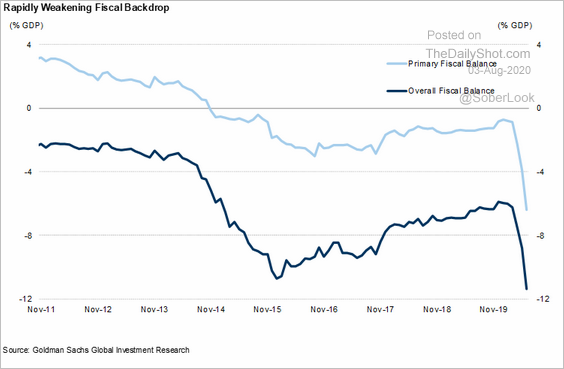 Source: Goldman Sachs
——————–
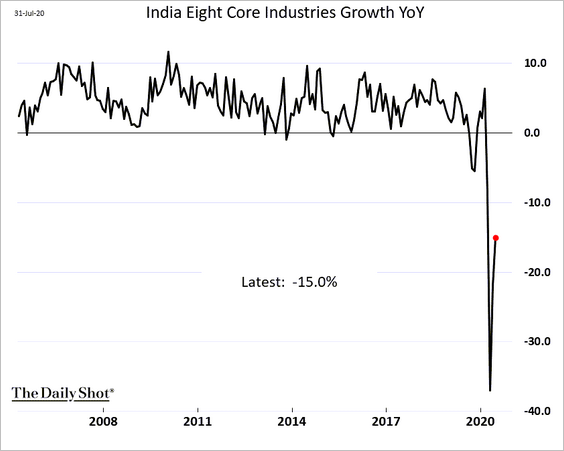
4. India’s core industries’ output is recovering.
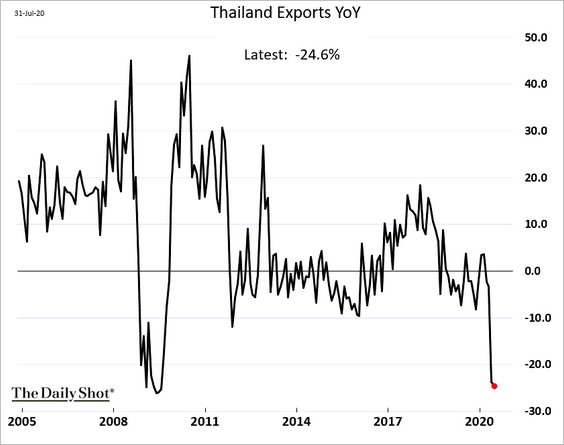
5. Thailand’s exports slowed further in June.
6. Turkey is facing portfolio outflows.
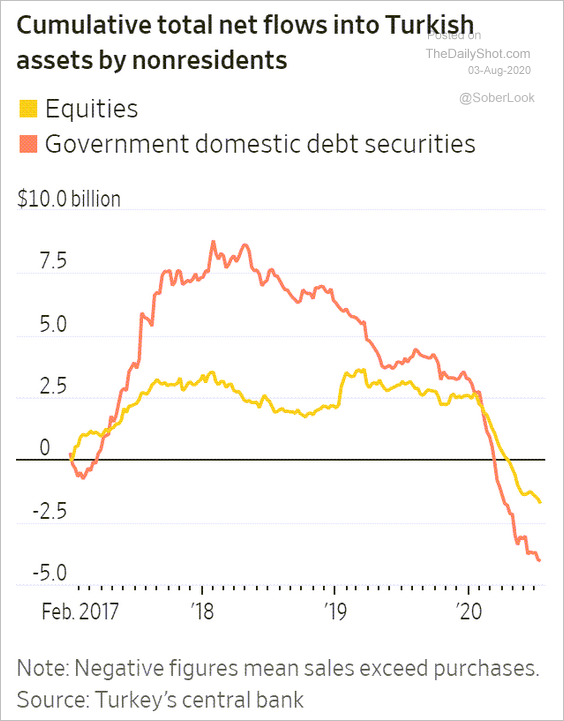 Source: @WSJ Read full article
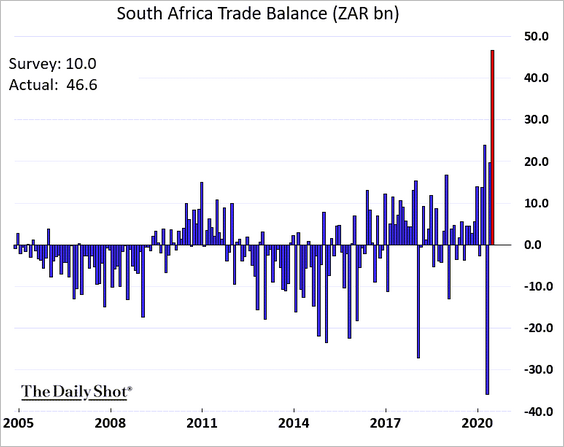
7. South Africa’s trade surplus hit a record high last month.
8. Finally, let’s run through the EM Asia PMI reports, which mostly point to factory activity contraction in July (albeit at a slower pace).
• Thailand:
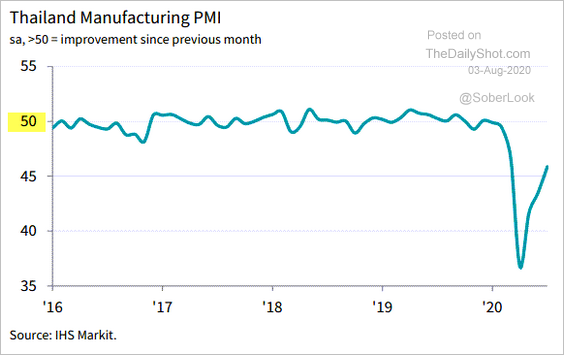 Source: IHS Markit Read full article
• Indonesia:
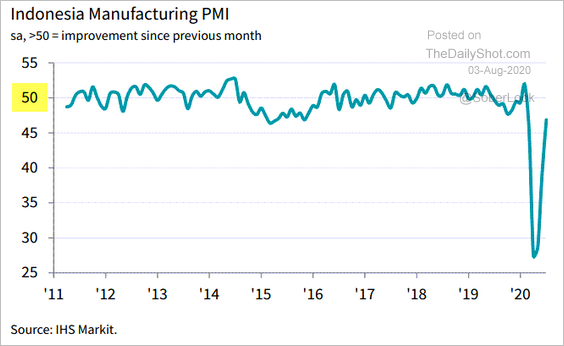 Source: IHS Markit Read full article
• The Philippines:
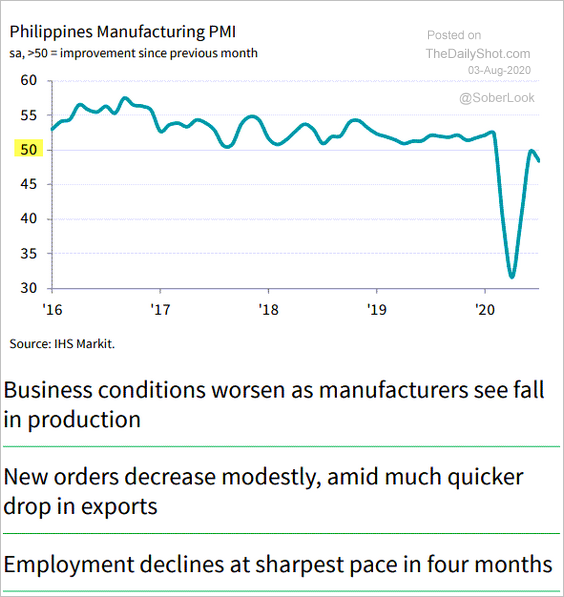 Source: IHS Markit Read full article
• Vietnam:
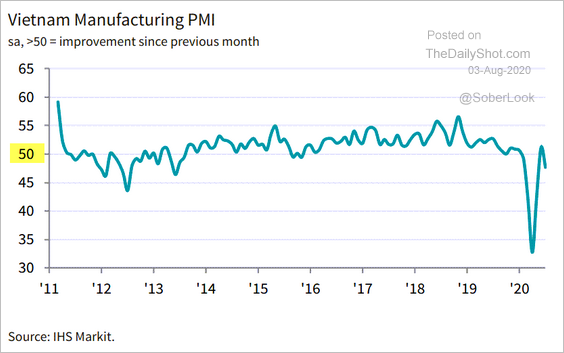 Source: IHS Markit Read full article
Commodities
1. Let’s begin with gold, which hit another record last week.
• Monthly returns:
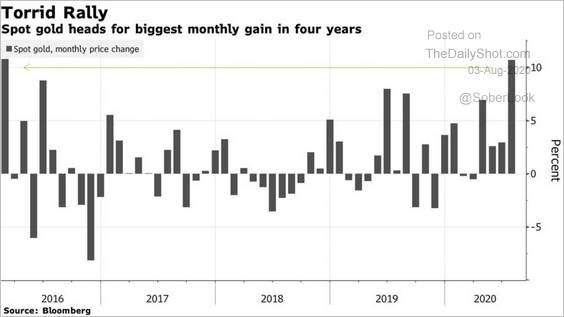 Source: @business Read full article
• Support from falling real rates in the US:
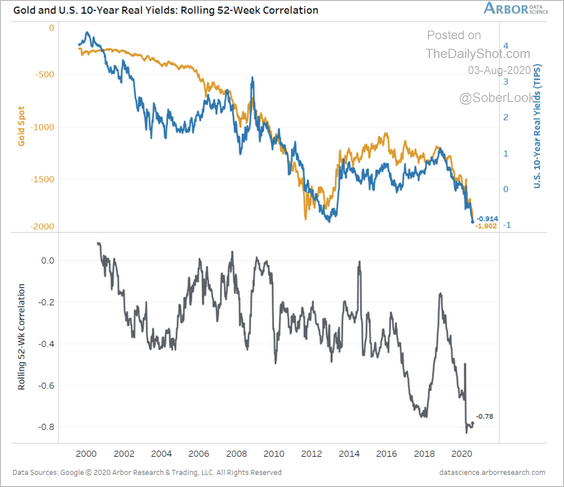 Source: Arbor Research & Trading
• London bullion trading volume:
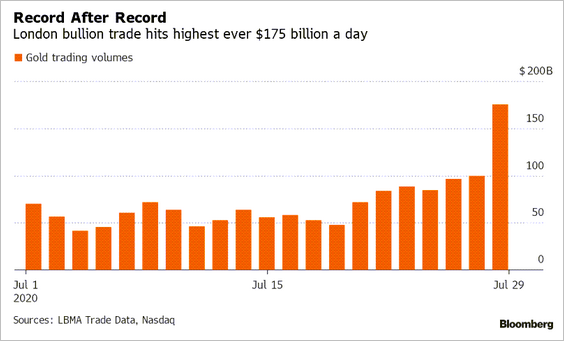 Source: Elena Mazneva, @TheTerminal
• COMEX physical delivery:
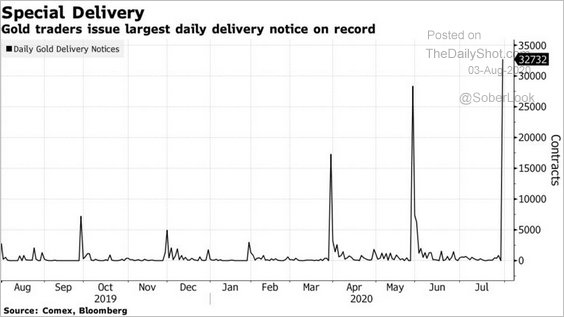 Source: @markets Read full article
• Gold fund flows:
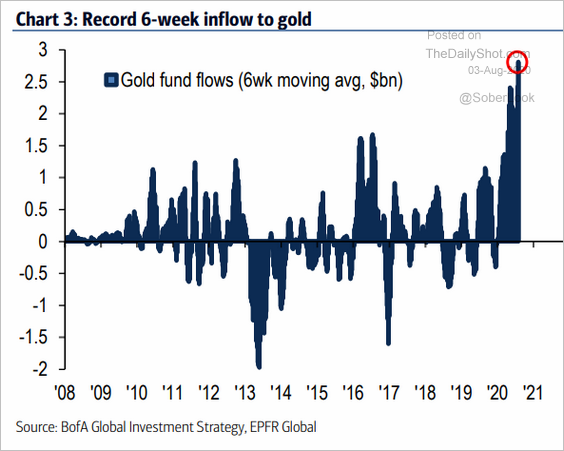 Source: BofA Merrill Lynch Global Research
——————–
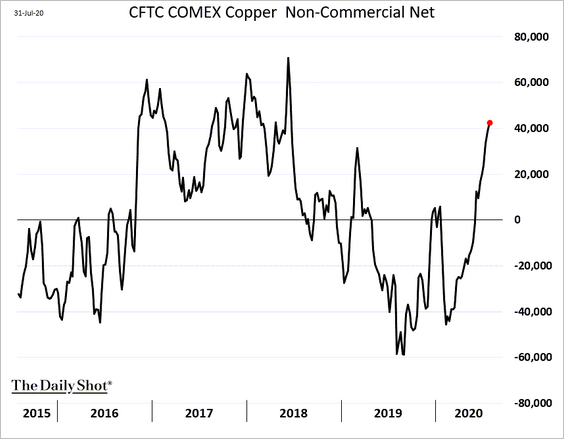
2. Next, we have some trends in copper.
• Speculative bets:
• LME warehouse monthly inventory changes:
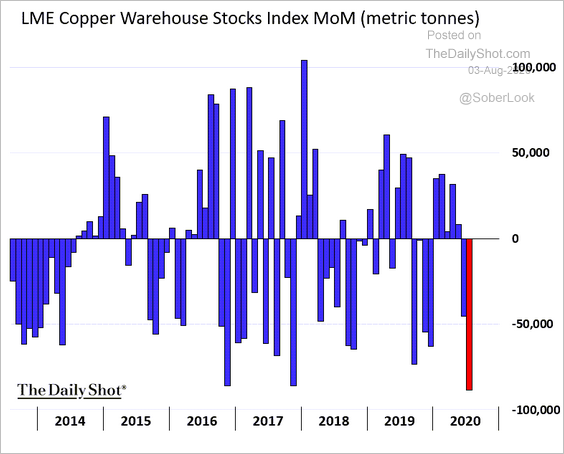 h/t @mburtonmetals
• Mean-reversion risk:
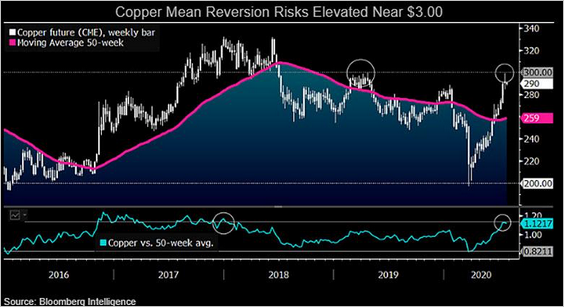 Source: @mikemcglone11
——————–
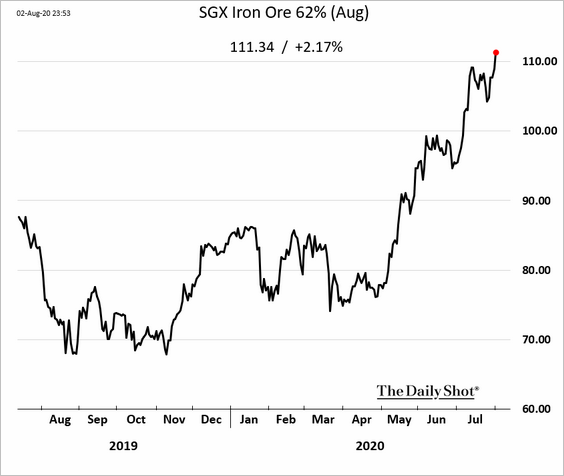
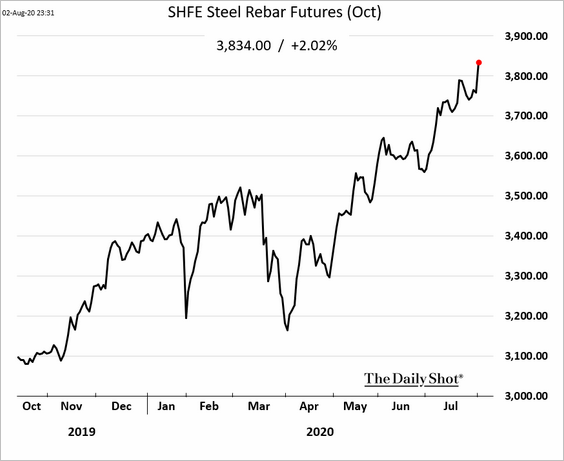
3. Iron ore and steel prices keep climbing.
• Iron ore (Singapore):
• Steel rebar (Shanghai):
——————–
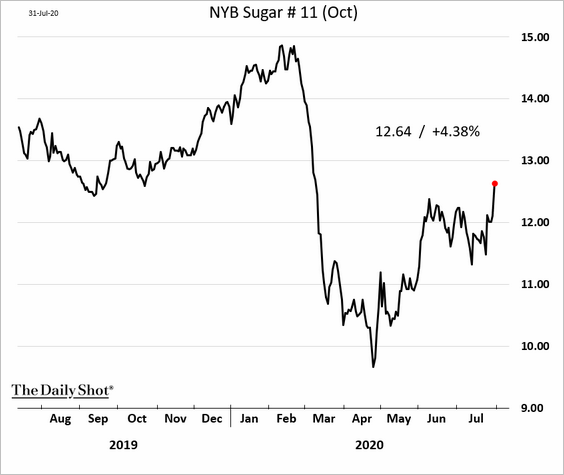
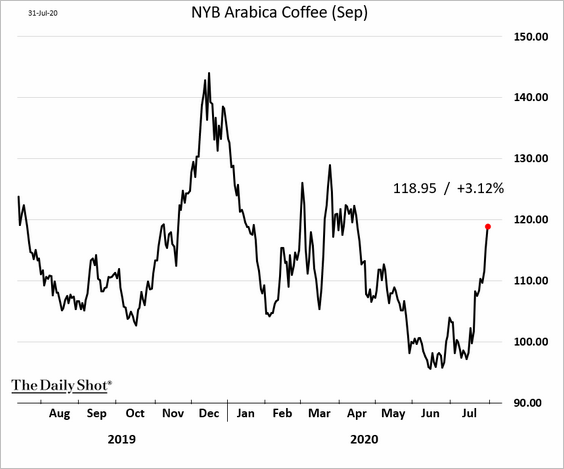
4. Softs have been rebounding.
• Sugar (there is talk that China and Indonesia will boost imports):
 Source:
• Coffee:
Energy
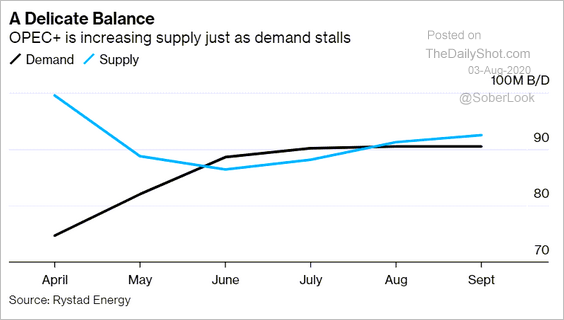
1. OPEC+ is about to boost output.
 Source: @business Read full article
 Source: @WSJ Read full article
——————–
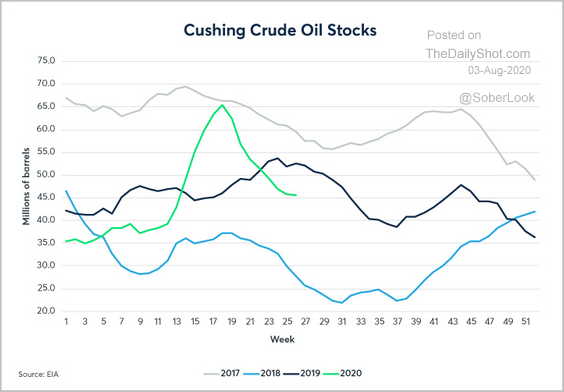
2. Cushing, OK oil inventories are now below last year’s levels.
 Source: CME Group Read full article
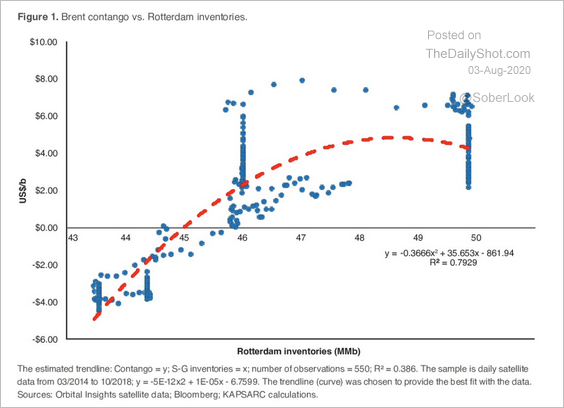
3. This chart shows the relationship between contango and crude oil inventories across time.
 Source: KAPSARC Read full article
Equities
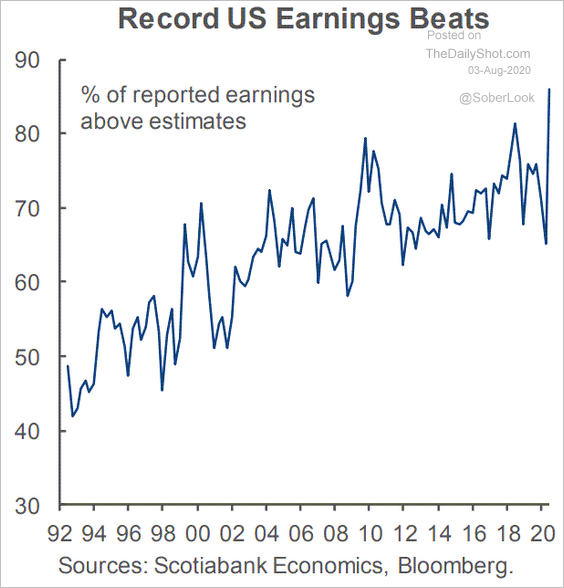
1. Q2 earnings forecasts have been too gloomy.
 Source: Scotiabank Economics
Here is the distribution of earnings and revenue surprises by sector.
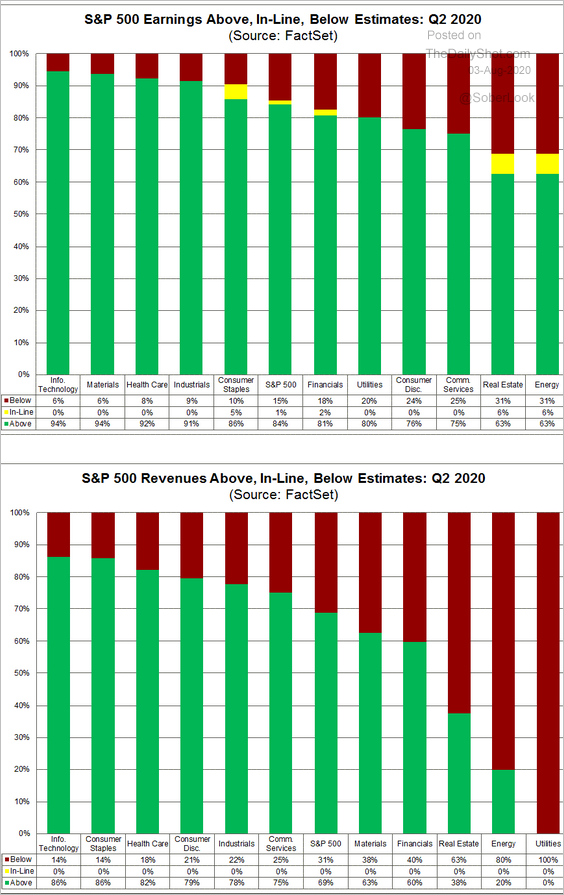 Source: @FactSet Read full article
——————–
2. The market response to earnings surprises has been asymmetric (2nd panel).
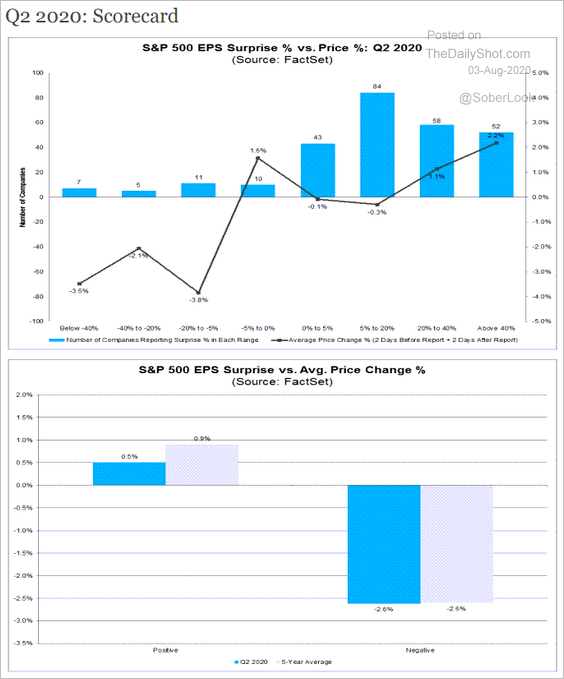 Source: @FactSet Read full article
3. Could we be looking at a bear-market rally (2 charts)?
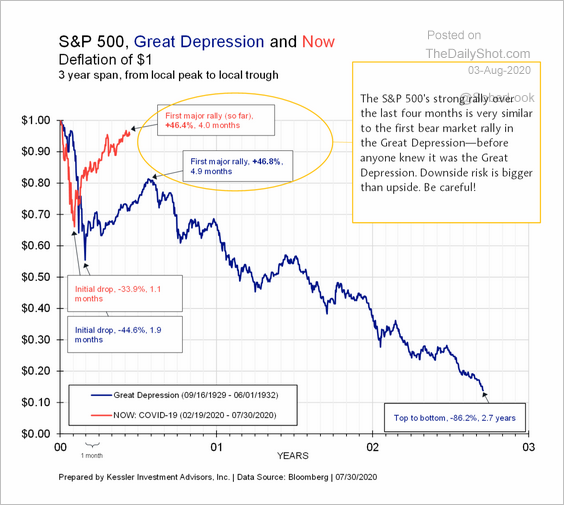 Source: Kessler Companies
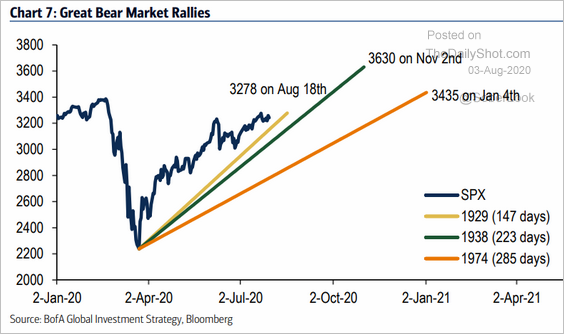 Source: BofA Merrill Lynch Global Research
——————–
4. Fund managers see US tech stocks as the most crowded trade.
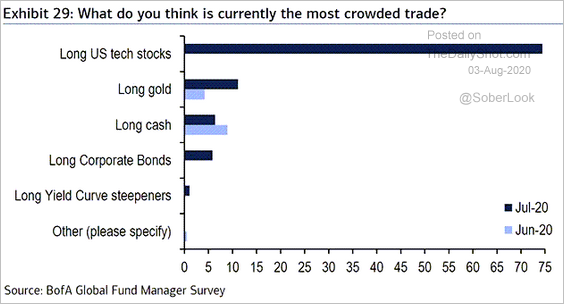 Source: BofA Merrill Lynch Global Research, @Callum_Thomas
5. This chart shows the tech mega-caps’ price/sales ratio vs. revenue growth.
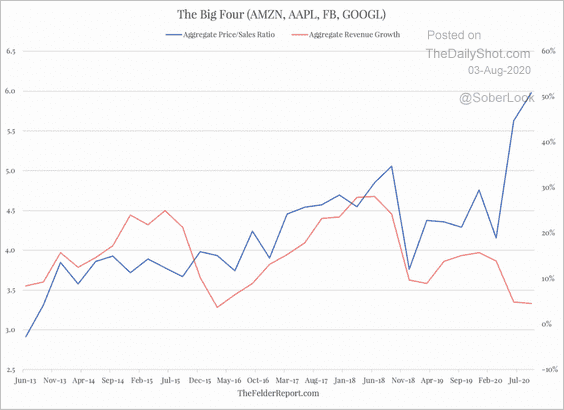 Source: @jessefelder
6. Here is the ratio of US total market capitalization to the GDP. Part (but not all) of this trend is due to US companies’ growing foreign earnings (outpacing US GDP).
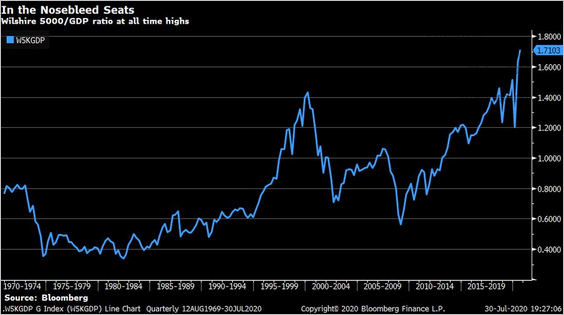 Source: @LizAnnSonders, @Bloomberg
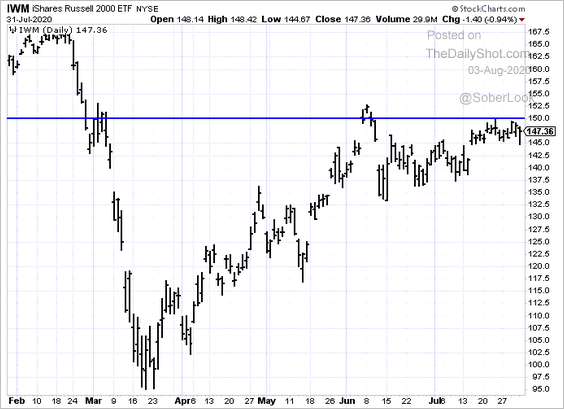
7. Small-cap shares (Russell 2000) have been testing resistance.
Credit
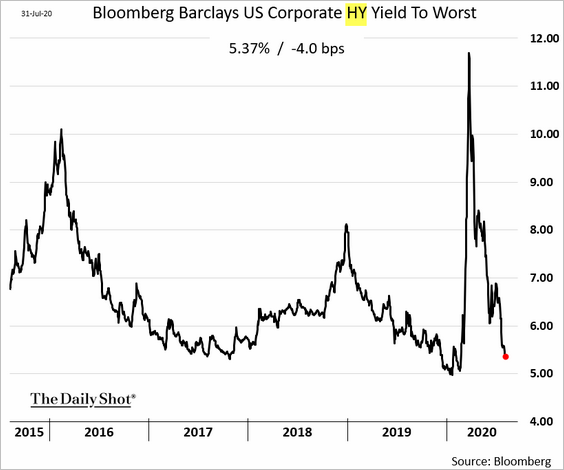
1. US corporate investment-grade yields continue to hit record lows.
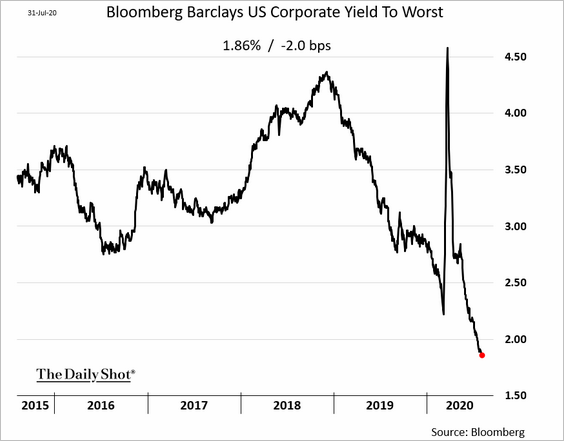
And sub-investment-grade debt yields are heading there as well.
——————–
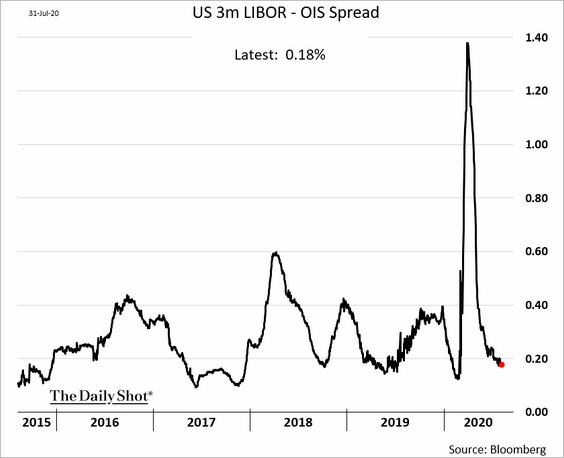
2. The US LIBOR-OIS spread shows normalization in the interbank funding markets.
3. The number of potential fallen angels spiked in the second quarter.
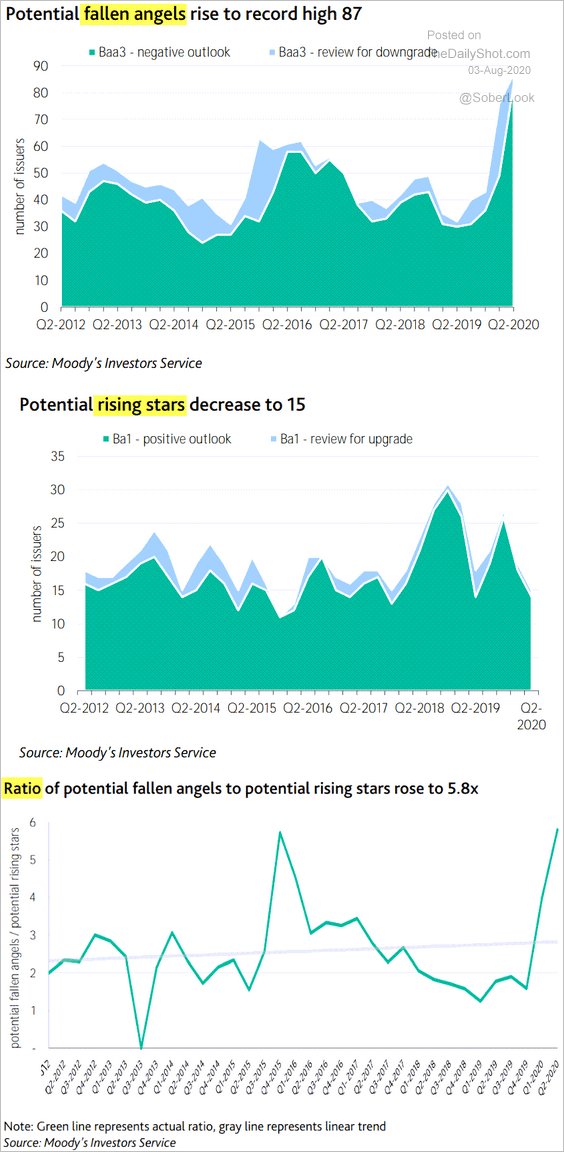 Source: Moody’s Investors Service
4. The default rate in private credit (middle-market companies) was up in Q2 (shown by company size).
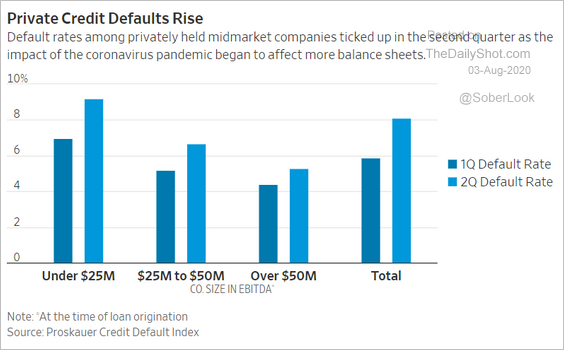 Source: @WSJ Read full article
5. Non-agency (privately issued) resi mortgage bonds show rising delinquencies.
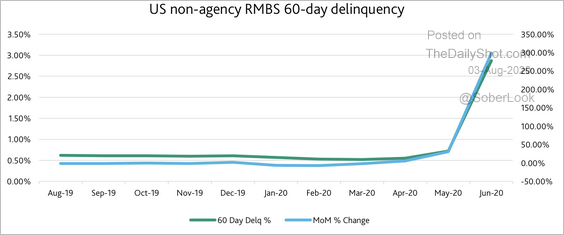 Source: Moody’s Analytics
Rates
1. The 10yr TIPS yield (effective real rate) hit a record low.
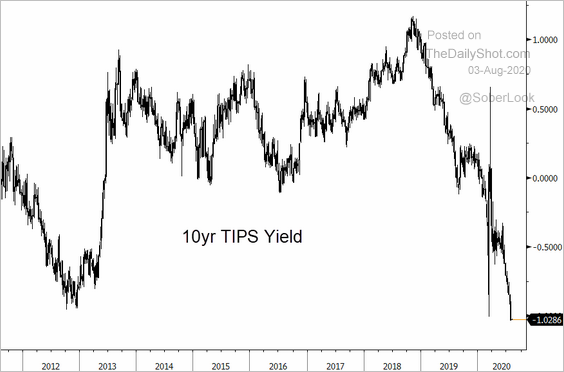 Source: @TheTerminal
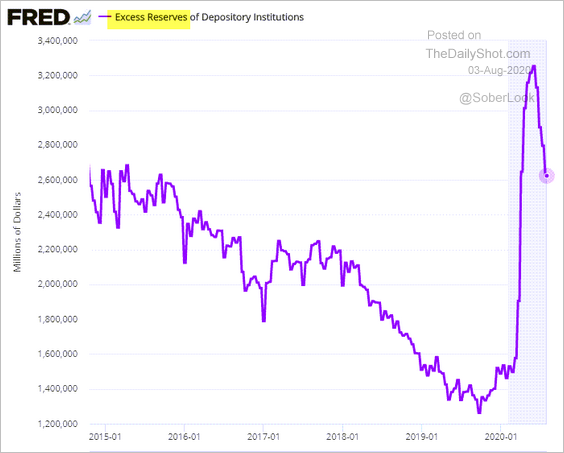
2. US excess reserves have been falling as the Fed’s balance sheet shrunk, and the US Treasury’s deposits at the Fed hit records.
——————–
Food for Thought
1. Connecticut’s economy has underperformed.
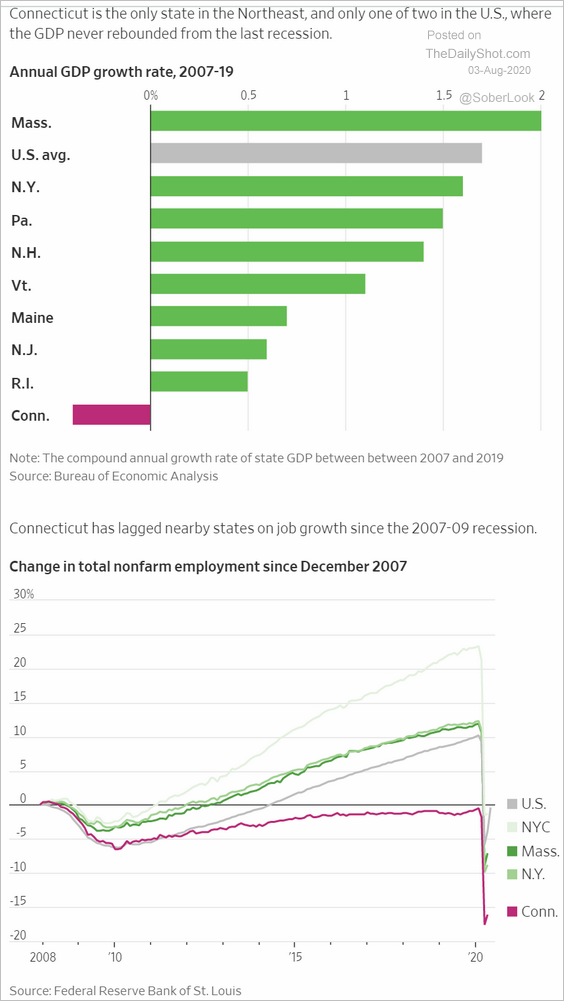 Source: @WSJ Read full article
2. A forecast for US domestic travel:
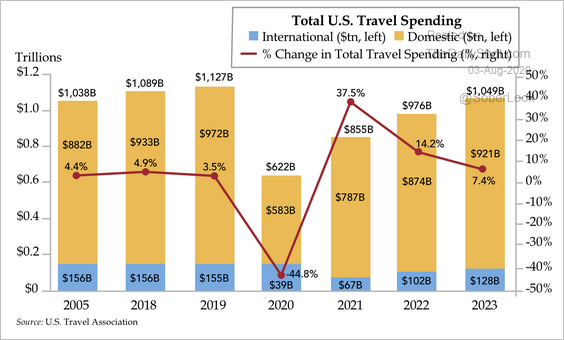 Source: Quill Intelligence
3. US first-time mothers’ age distribution:
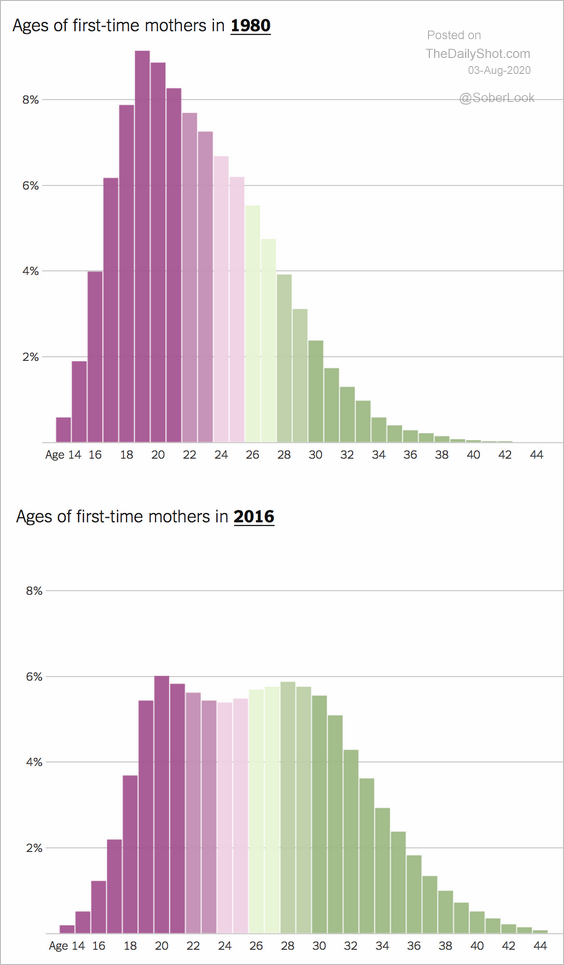 Source: @financialtimes Read full article
4. Delayed elections globally:
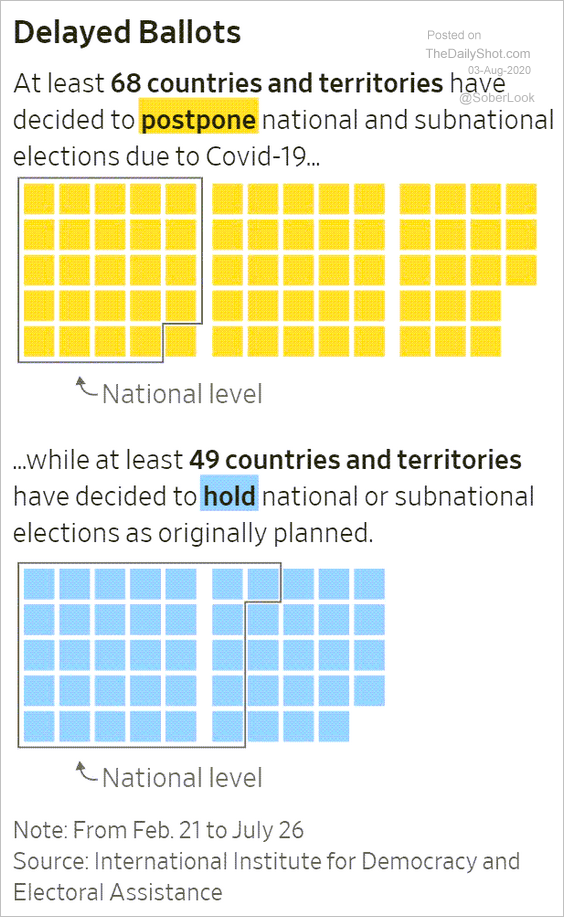 Source: @WSJ Read full article
5. Wearing face masks:
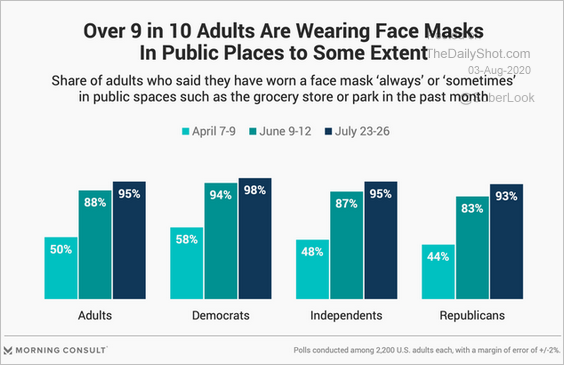 Source: @MorningConsult Read full article
6. Global migration flows over the past decade:
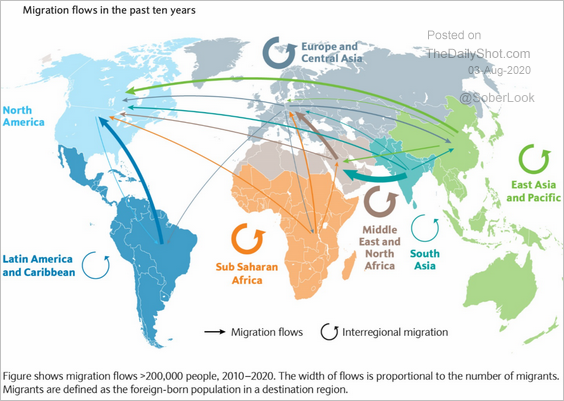 Source: Barclays Research
7. Trump/Biden TV ad spending:
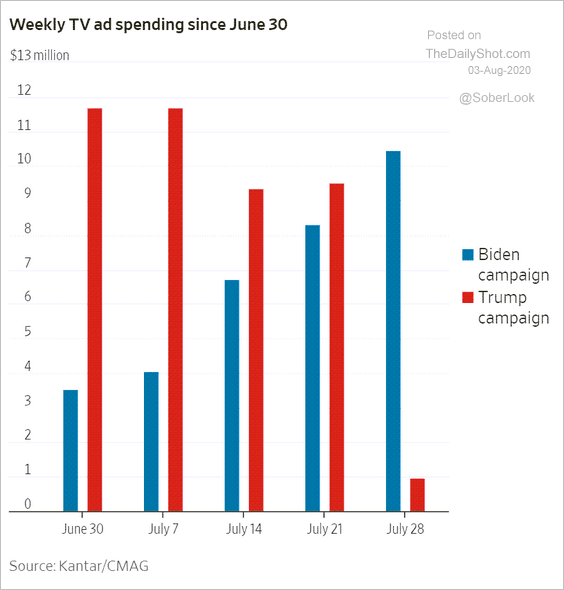 Source: @WSJ Read full article
8. Digital ad revenues, by company:
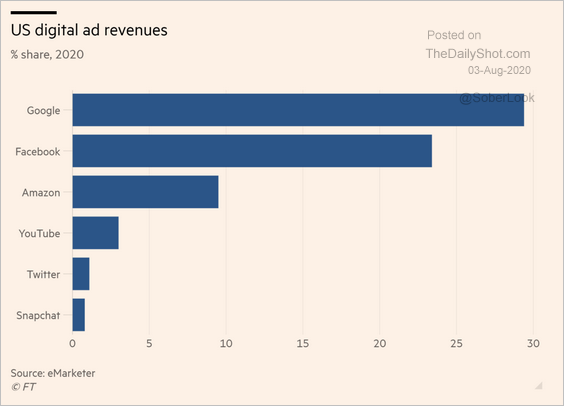 Source: @financialtimes Read full article
9. Earth’s largest tectonic plates:
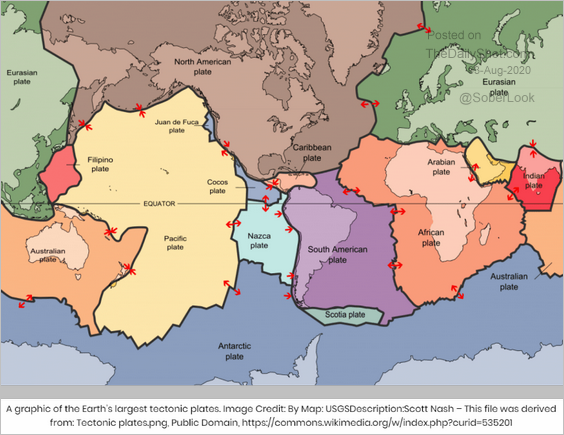 Source: Universe Today Read full article
——————–