The Daily Shot: 10-Aug-20
• The United States
• Canada
• The Eurozone
• Asia – Pacific
• China
• Emerging Markets
• Commodities
• Energy
• Equities
• Credit
• Food for Thought
The United States
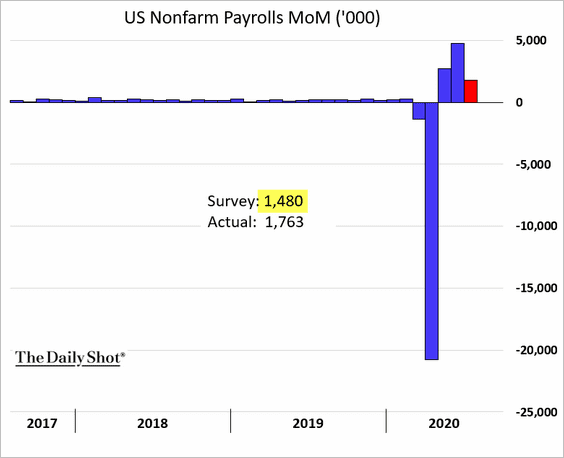
1. Let’s begin with Frady’s payrolls report, which topped economists’ forecasts.
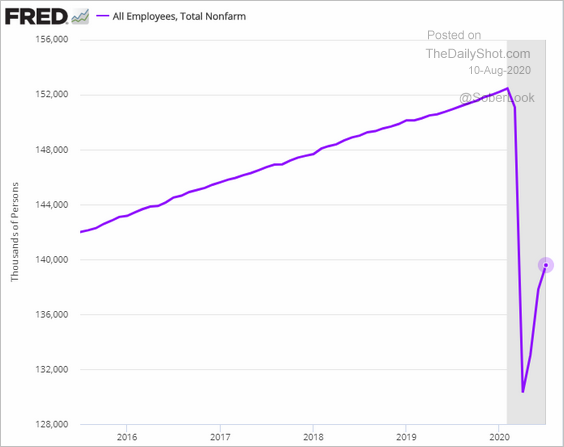
This chart shows the total number of employees.
• Here is the breakdown by sector (2 charts).
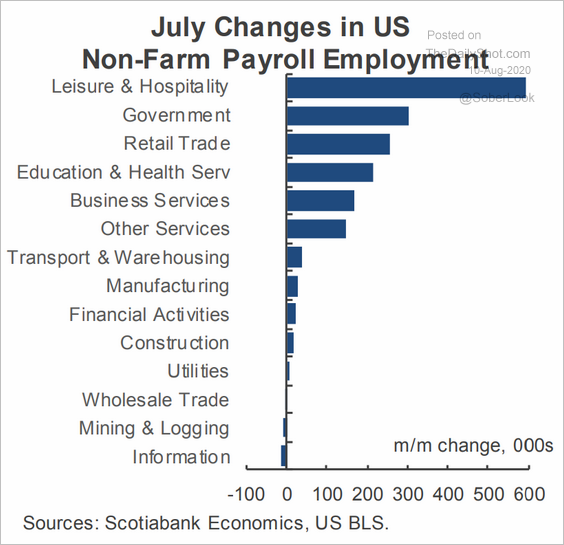 Source: Scotiabank Economics
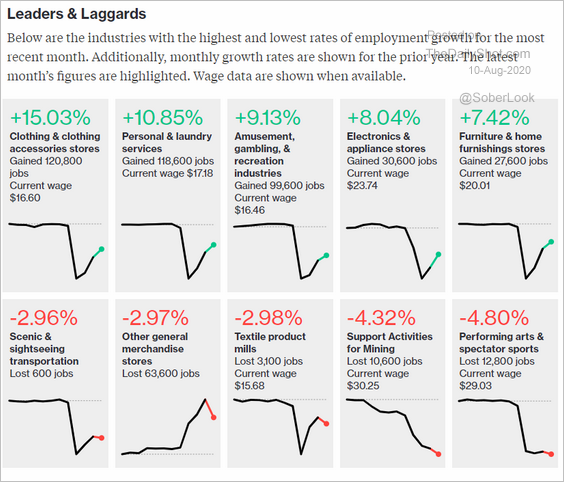 Source: Bloomberg Read full article
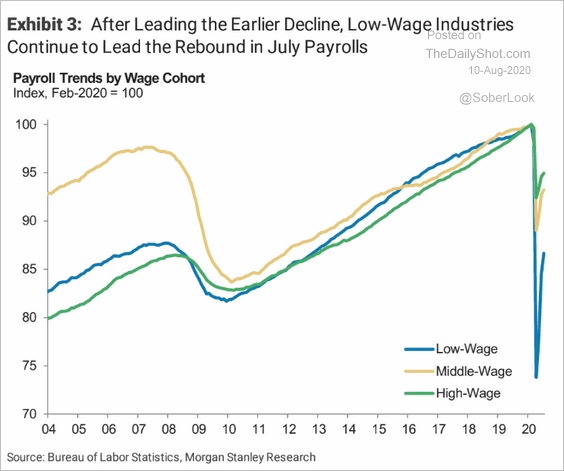
Low-wage sectors are leading the rebound.
 Source: Morgan Stanley Research
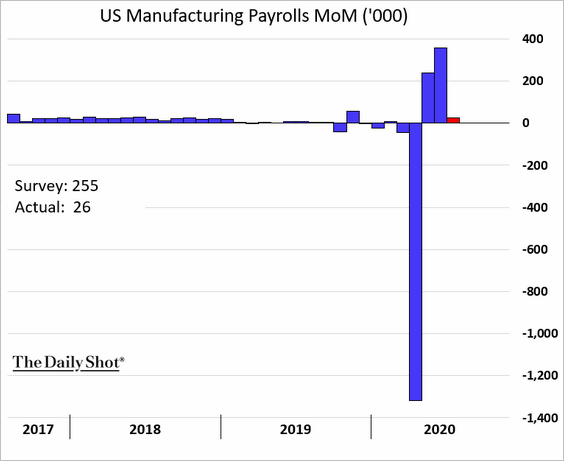
Manufacturing job gains were lower than expected.
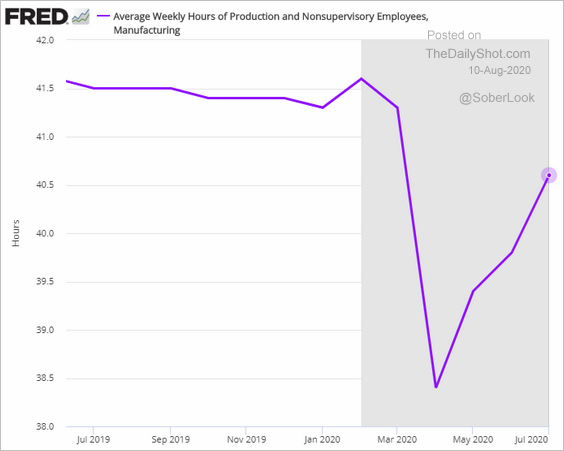
However, weekly hours at US factories continue to recover.
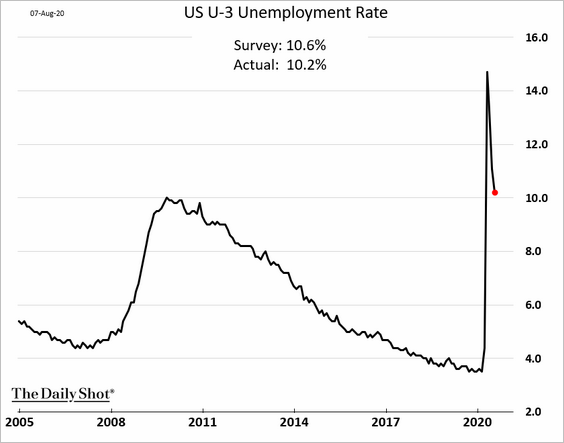
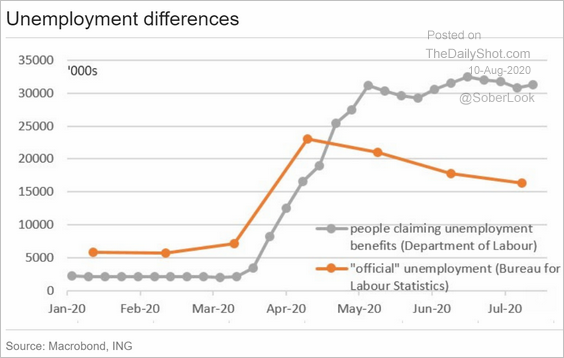
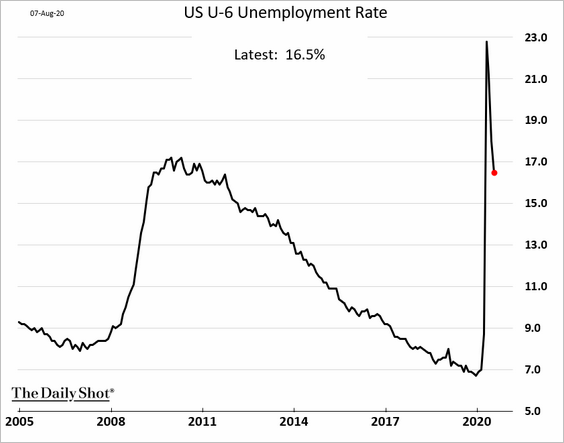
• The unemployment rate is approaching 10%.
– The official unemployment figures have diverged from the number of Americans receiving unemployment benefits.
 Source: ING
– Here is the underemployment index.
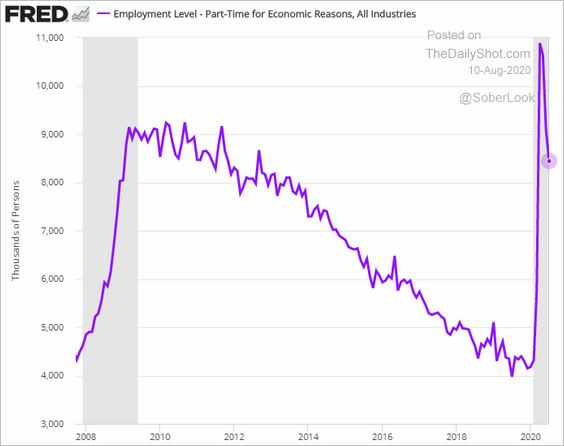
– And this chart shows part-time employment for “economic reasons.”
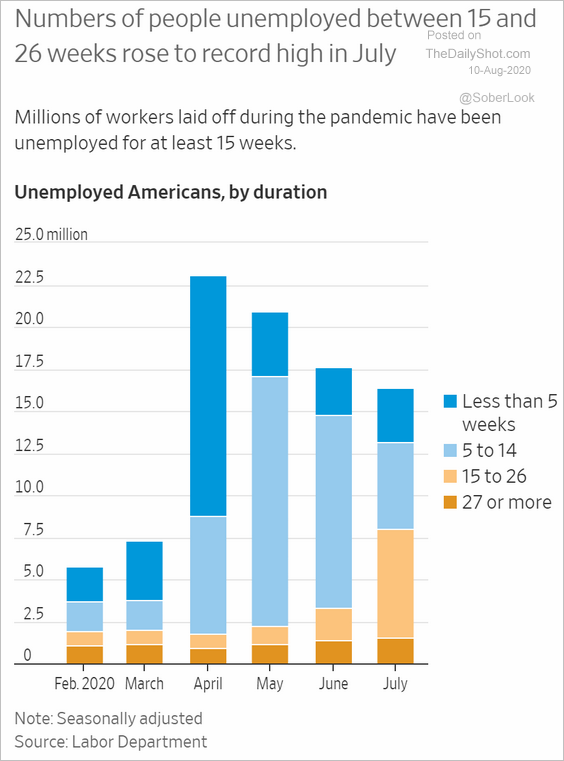
– Long-term unemployment is on the rise.
 Source: @WSJ Read full article
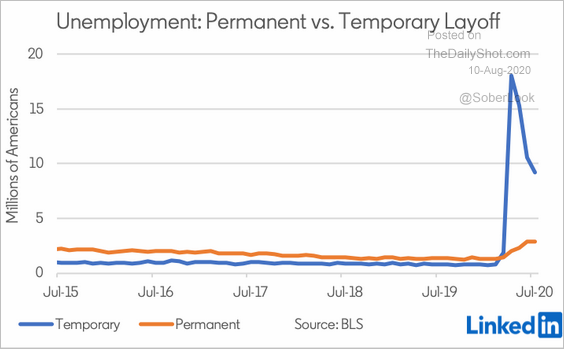
– Growth in permanent unemployment paused in July.
 Source: @EconBerger
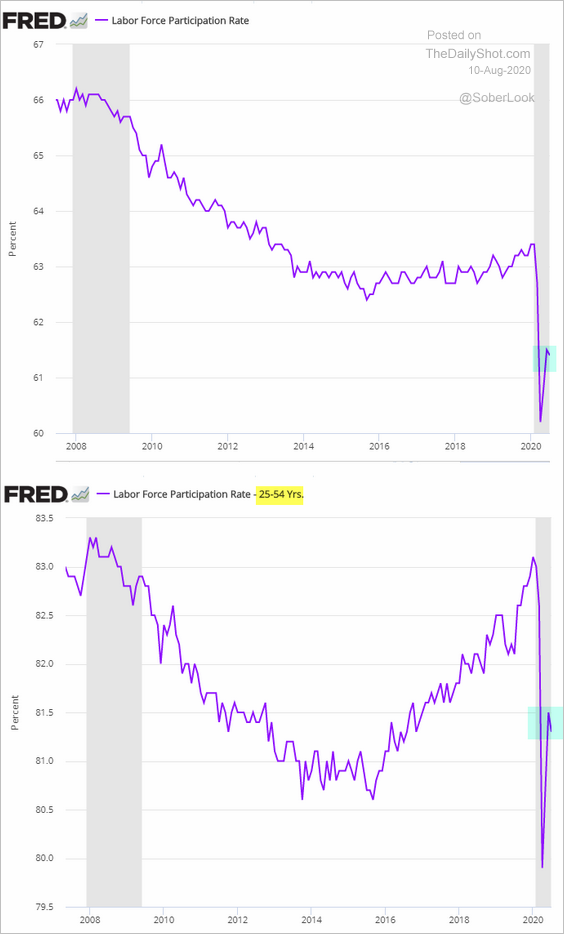
• The rebound in the participation rate stalled in last month (the second chart is the prime-age rate).
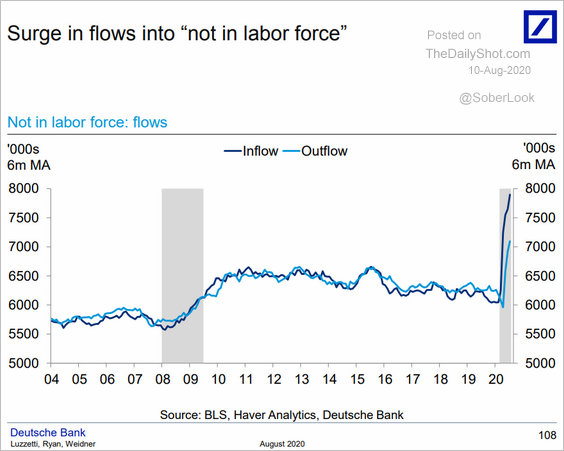
– Flows out of the labor force have been unprecedented.
 Source: Deutsche Bank Research Read full article
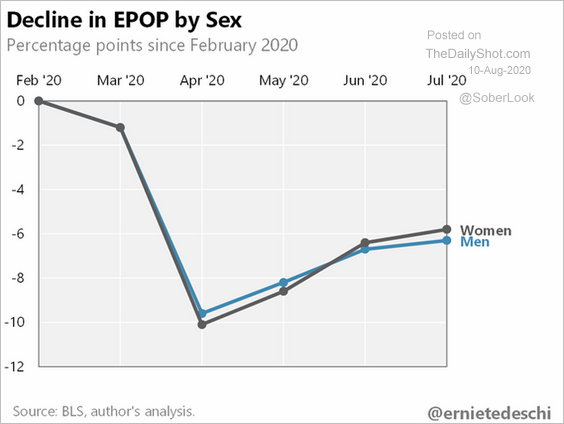
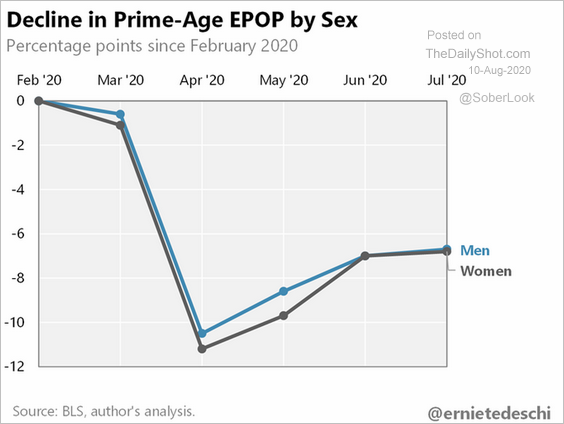
– The two charts below show the employment-to-population ratio for men and women.
 Source: @ernietedeschi
 Source: @ernietedeschi
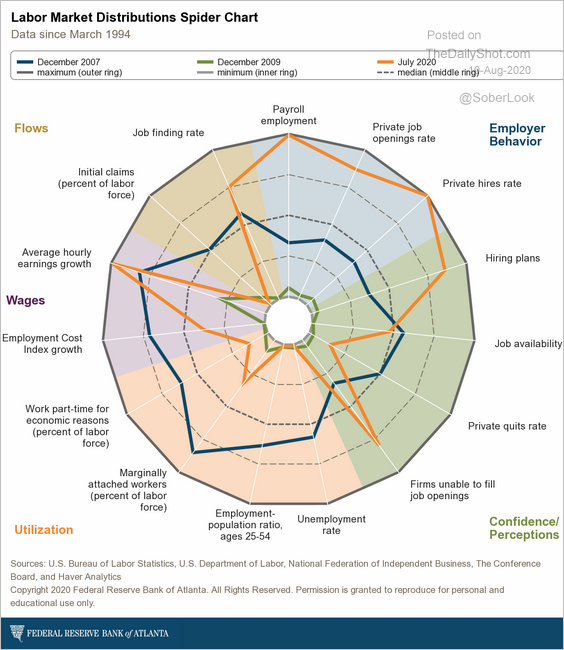
• Here is the Atlanta Fed’s labor market spider chart.
 Source: @AtlantaFed, @BLS_gov Read full article
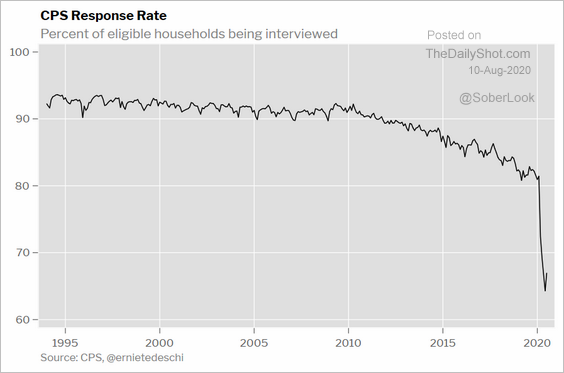
• There is still quite a bit of noise in the payrolls report.
– Survey sample:
 Source: @ernietedeschi
– Seasonal adjustments for teachers:
 Source: Reuters Read full article
——————–
2. Next, we have some high-frequency indicators.
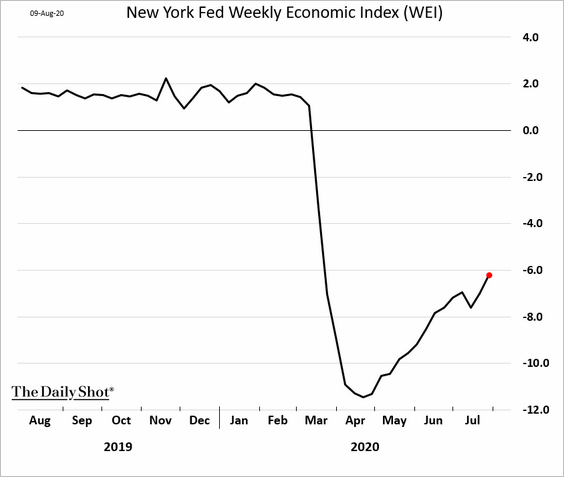
• The NY Fed’s economic activity index:
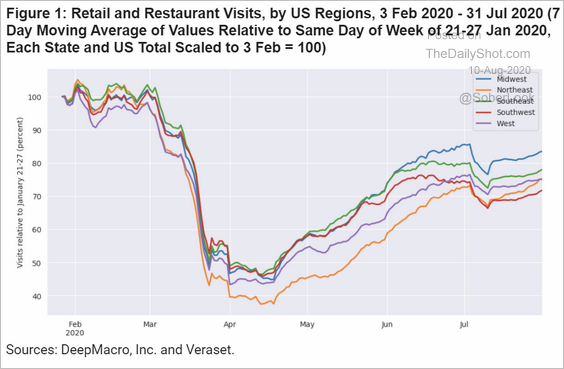
• Restaurant visits:
 Source: DeepMacro
• The ANZ Activity Tracker:
![]() Source: ANZ Research
Source: ANZ Research
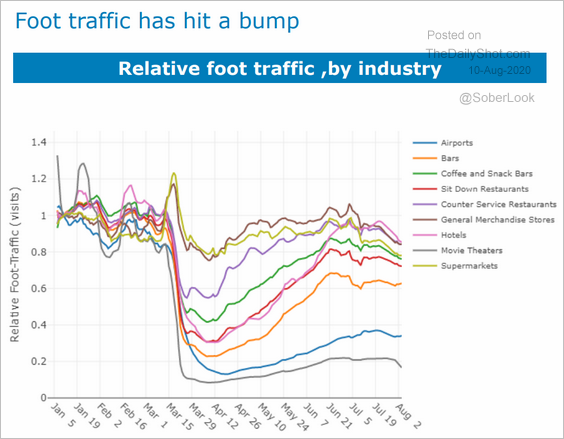
• Foot traffic by sector:
 Source: ANZ Research
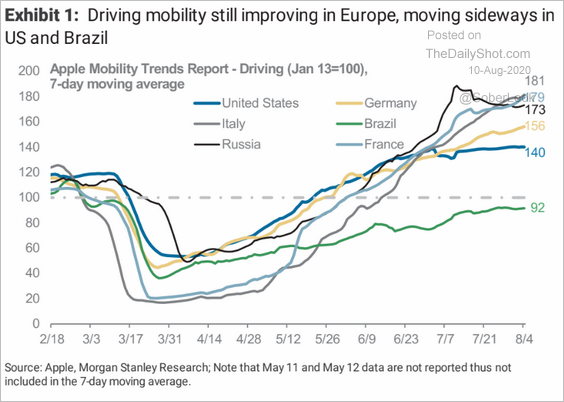
• The US mobility trend vs. other economies:
 Source: Morgan Stanley Research
——————–
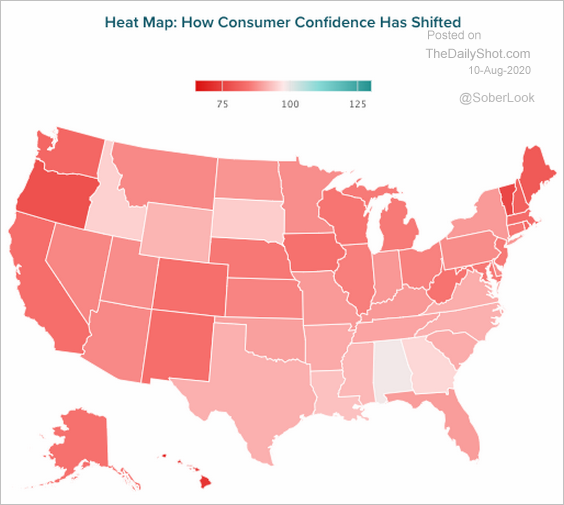
3. Consumer sentiment deteriorated in most states in July.
 Source: Morning Consult Read full article
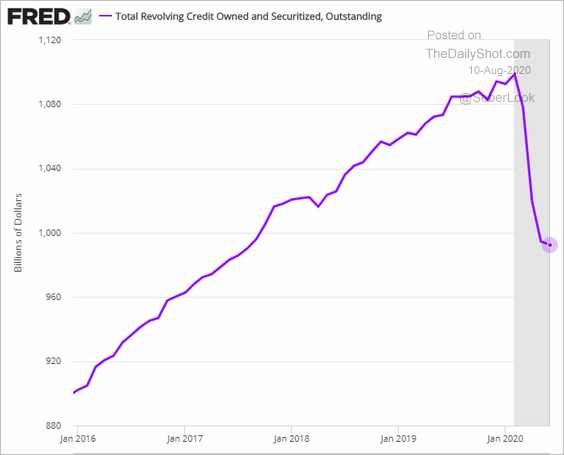
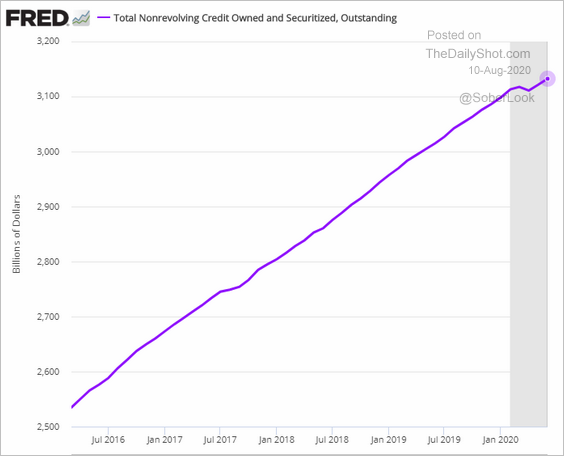
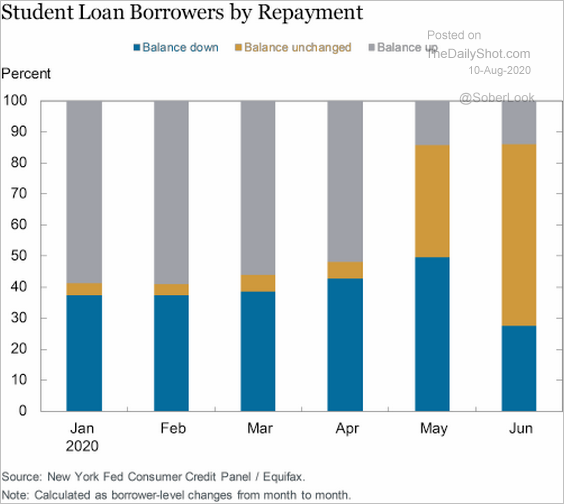
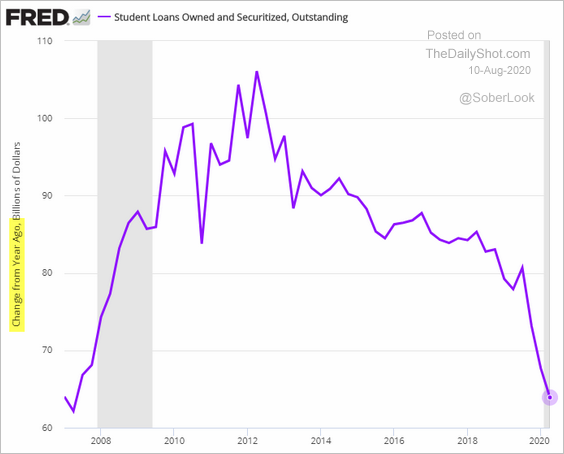
4. Next, we have some updates on consumer credit.
• Revolving credit balance outstanding (credit cards):
• Non-revolving credit (student and auto loans):
• Most student loan balances are no longer declining (payment deferrals).
 Source: Liberty Street Economics Read full article
• Growth in student debt has been slowing.
——————–
5. Mortgage rates hit another record low.

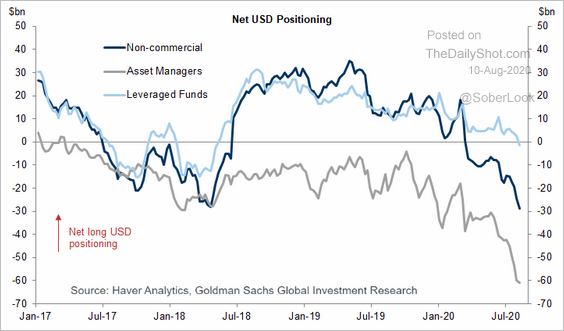
6. Money managers continue to press their bets against the dollar. Is shorting the US currency becoming crowded trade?
 Source: Goldman Sachs
Canada
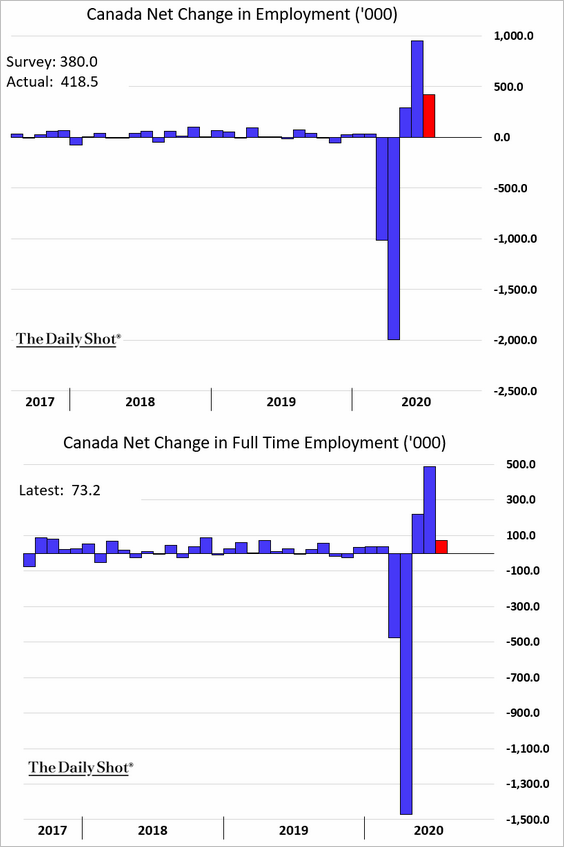
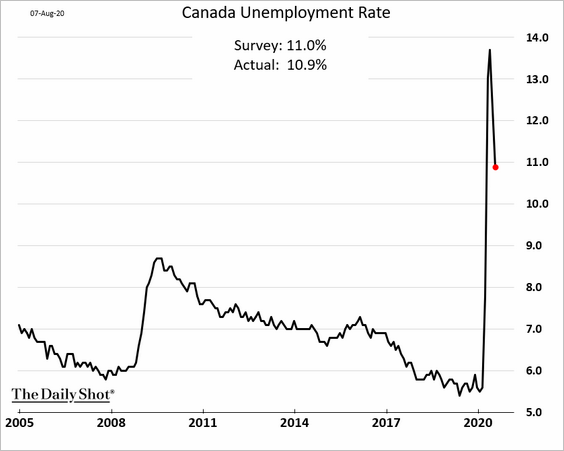
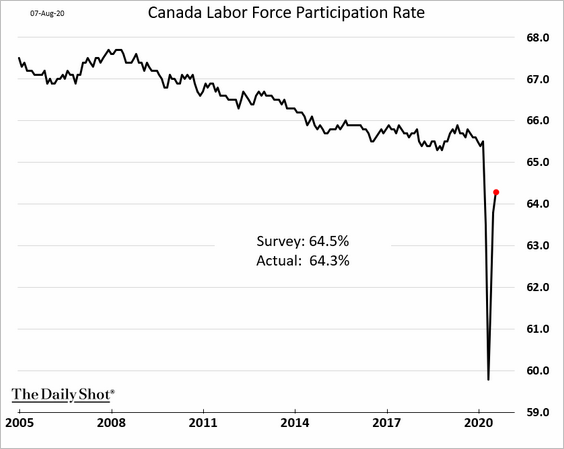
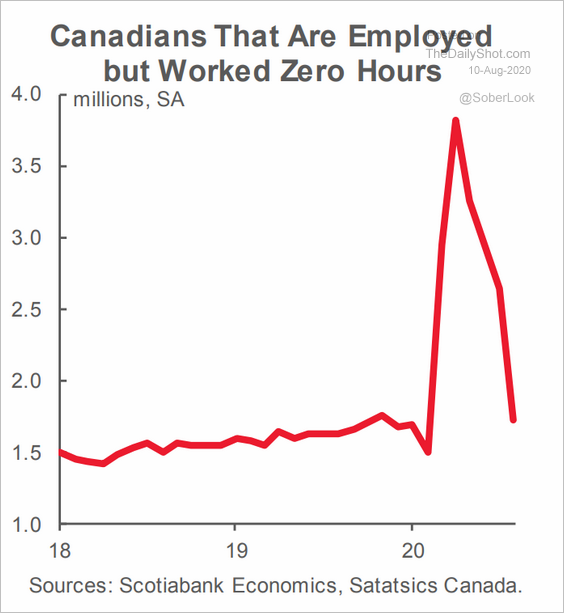
1. Similar to the US, Canada’s jobs report surprised to the upside. However, most of the gains were driven by part-time work. Full-time employment improvements were modest (second chart).
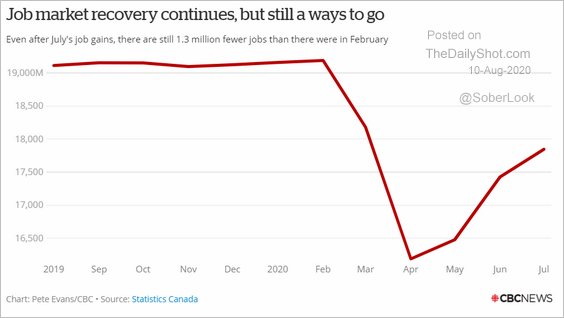
Here is the employment trajectory.
 Source: CBC News Read full article
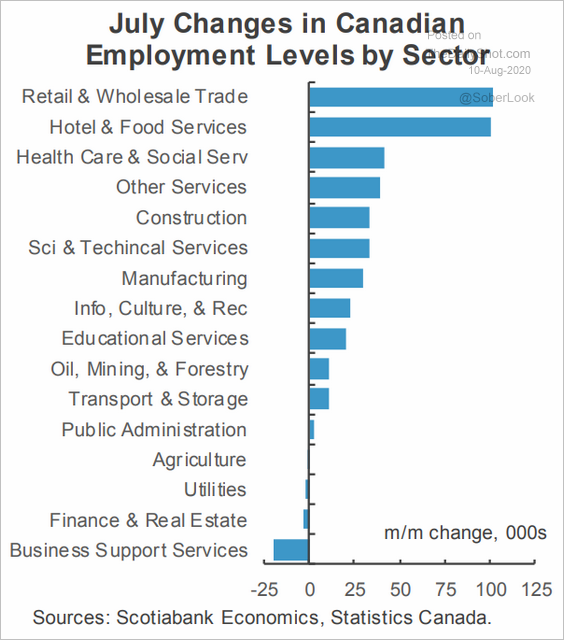
Next, we have some additional trends from Canada’s jobs report.
• Change in employment by sector:
 Source: Scotiabank Economics
• The unemployment rate:
• The labor force participation rate:
• The number of employed Canadians who worked zero hours:
 Source: Scotiabank Economics
——————–
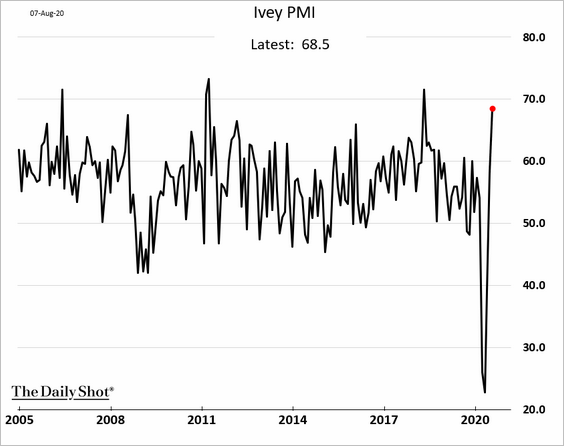
2. The Ivey PMI report showed an acceleration in business activity last month.
 Source: Reuters Read full article
——————–
3. Motor vehicle trade has been rebounding.
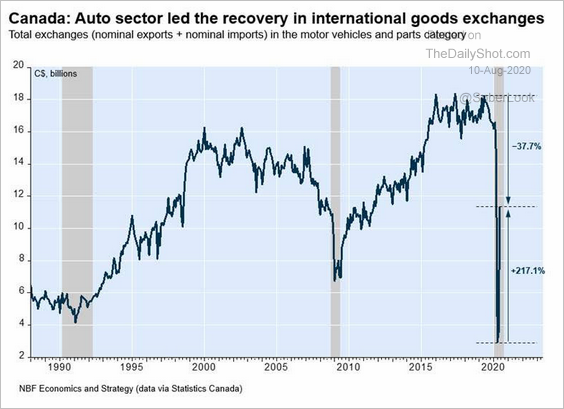 Source: Economics and Strategy Group, National Bank of Canada
4. The Canadian dollar’s gains against USD have lagged other currencies.
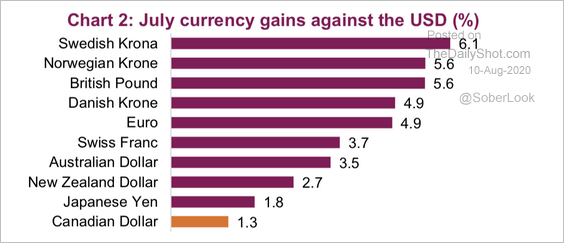 Source: Market Ethos, Richardson GMP
The Eurozone
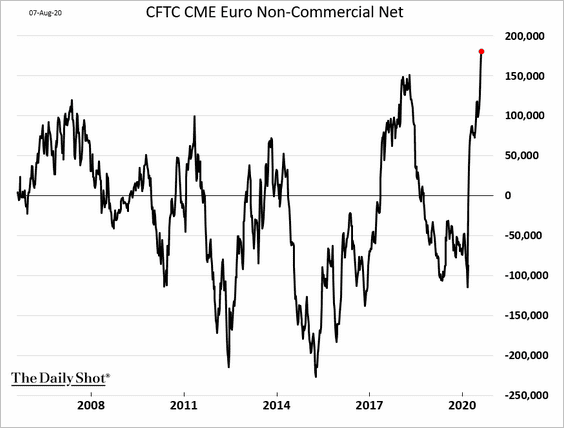
1. Speculative bets on the euro are hitting record highs. A crowded trade?
The euro is at a downtrend resistance.
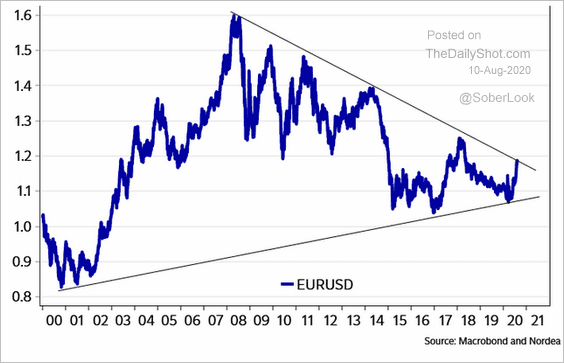 Source: @AndreasSteno Read full article
——————–
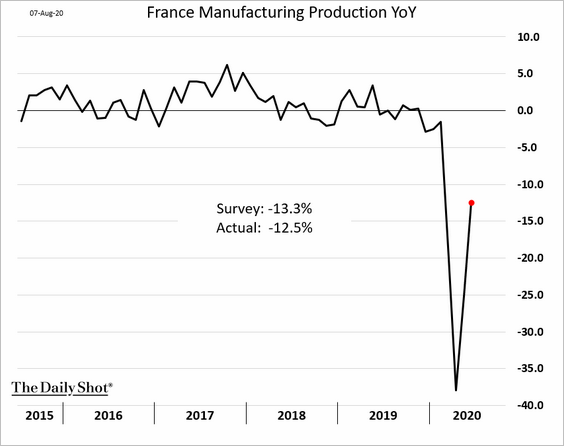
2. French manufacturing output continued to recover in June.
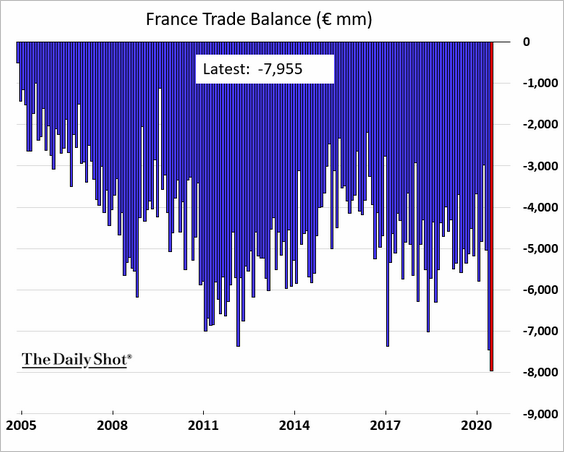
Separately, the nation’s trade deficit hit a record high.
——————–
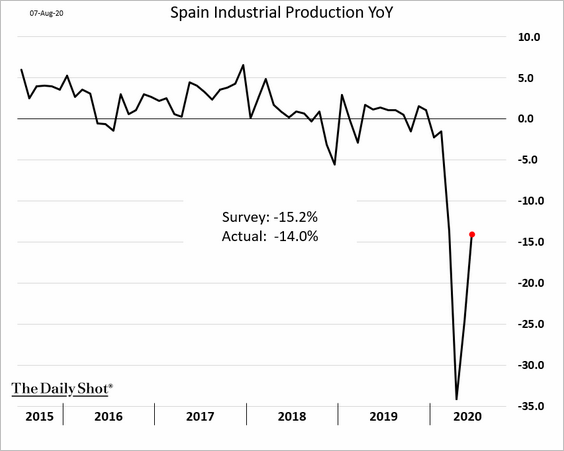
3. Here is Spain’s industrial production (as of June):
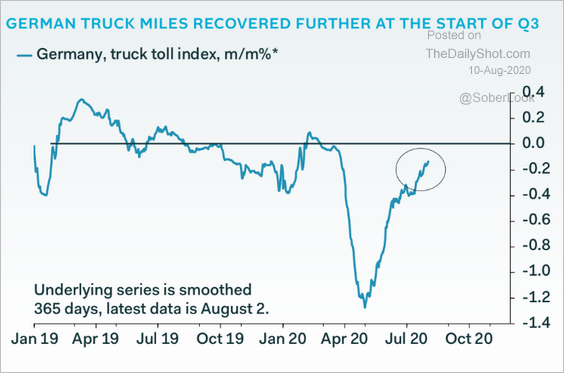
4. Germany’s truck miles are almost back to last year’s levels.
 Source: Pantheon Macroeconomics
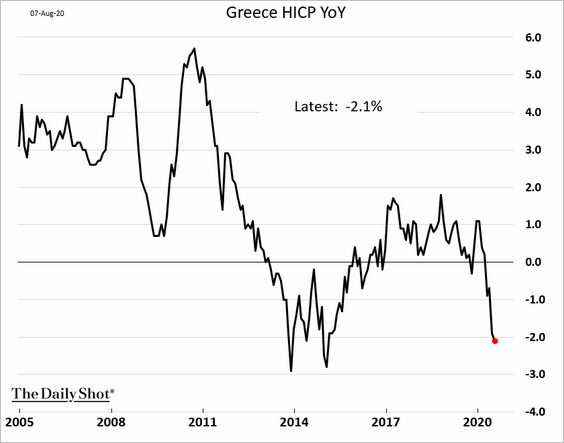
5. Greece is in deflation (as of July):
Asia – Pacific
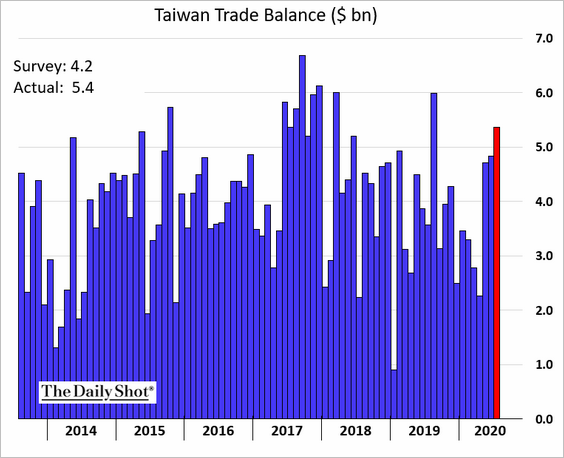
1. Taiwan’s trade surplus has rebounded.
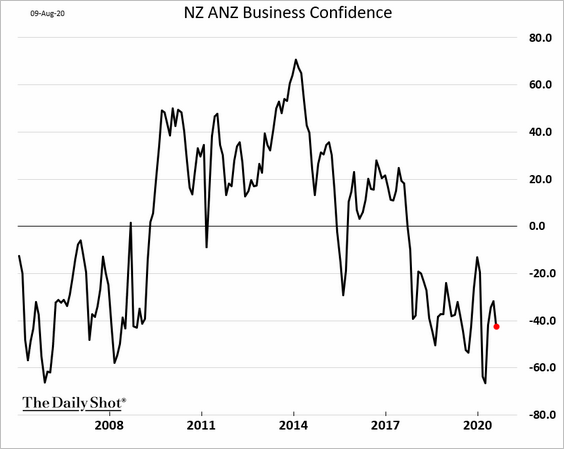
2. New Zealand’s business confidence remains depressed.
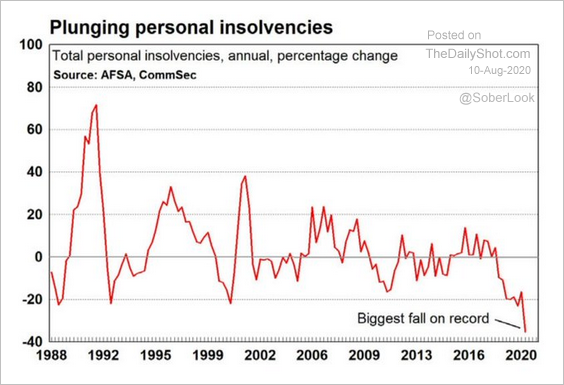
3. Next, we have a couple of updates on Australia.
• Personal insolvencies (helped by rent and loan payment deferrals):
 Source: @Scutty
• Coal exports to China:
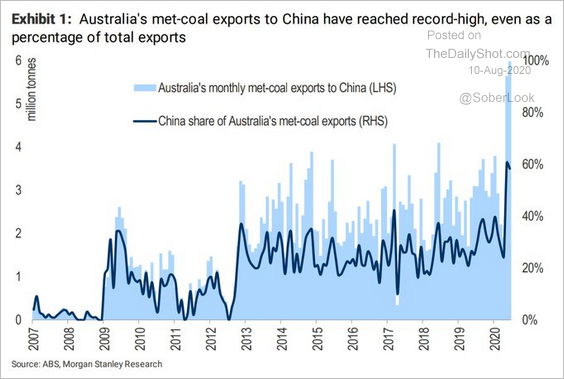 Source: Morgan Stanley Research, @Scutty
China
1. The CPI ticked higher, boosted by food prices.
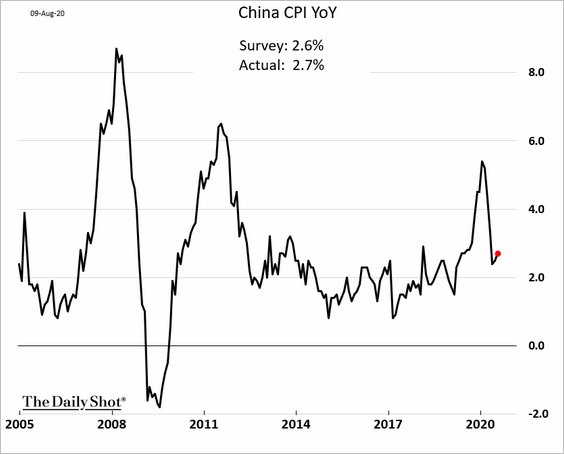
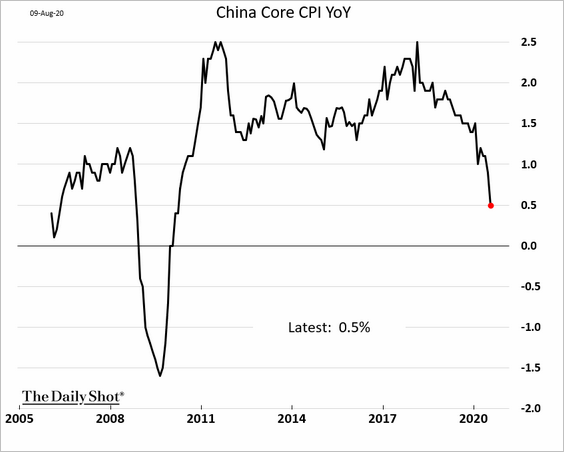
However, China’s core inflation is plummetting,
——————–
2. The producer price index moved higher.
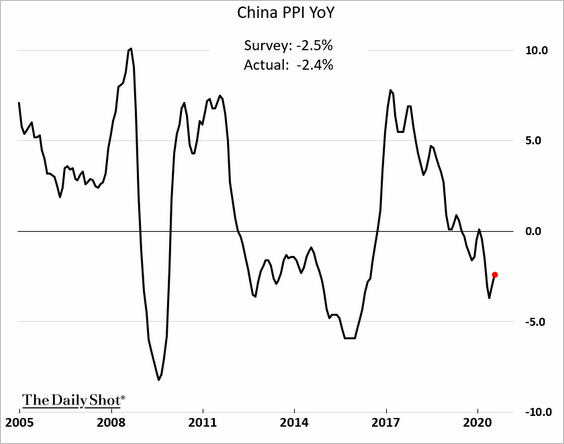
3. The 3-month – 1-month USD/CNH implied volatility spread points to concerns about the US elections.
 Source: @DavidInglesTV
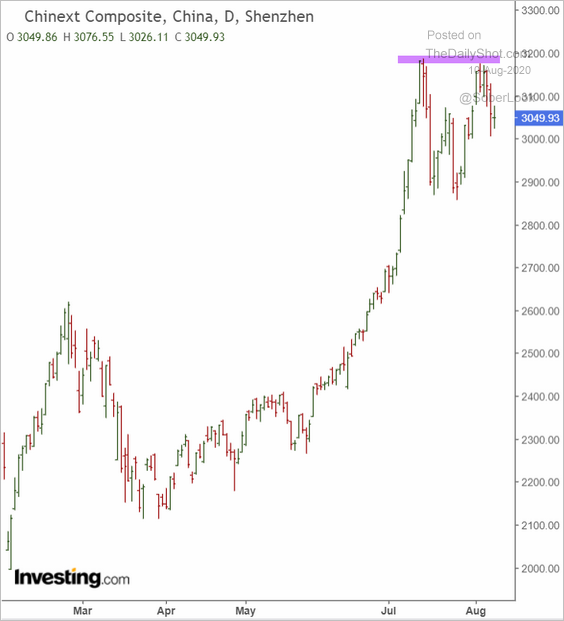
4. The ChiNext index held resistance.
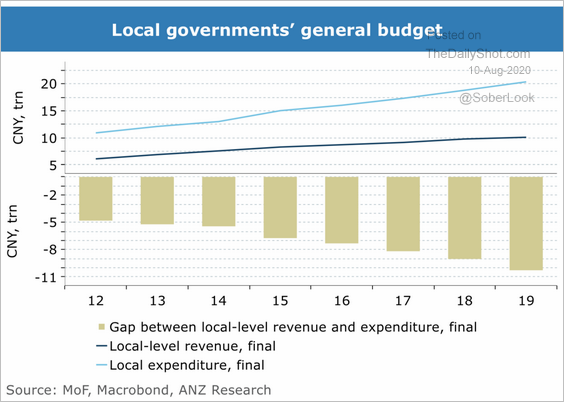
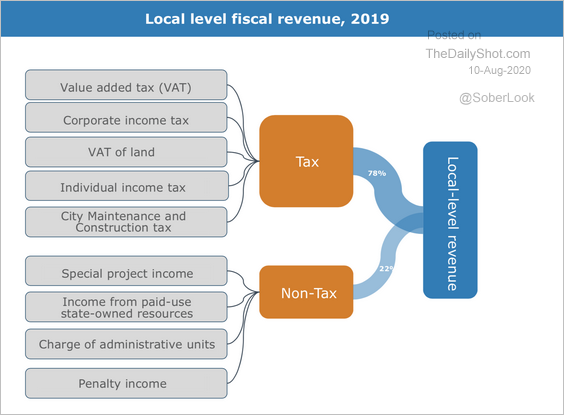
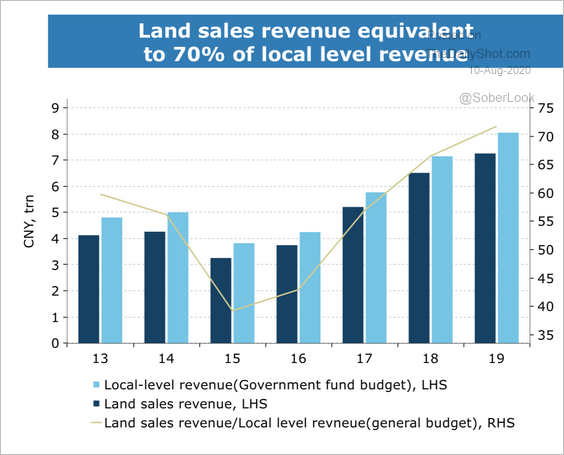
5. Next, we have some updates on local governments’ fiscal trends.
• Budget gaps:
 Source: ANZ Research
• Sources of revenue:
 Source: ANZ Research
• Land sales:
 Source: ANZ Research
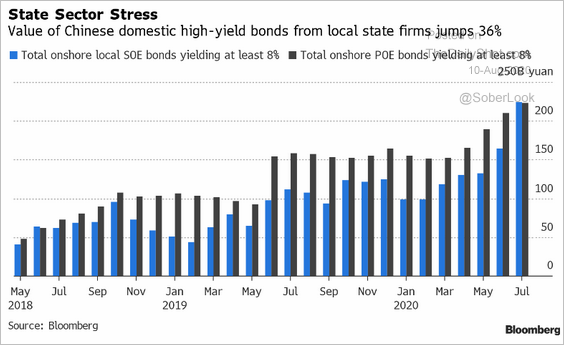
• Local government-owned enterprises’ high-yield bond sales:
 Source: Charlie Zhu
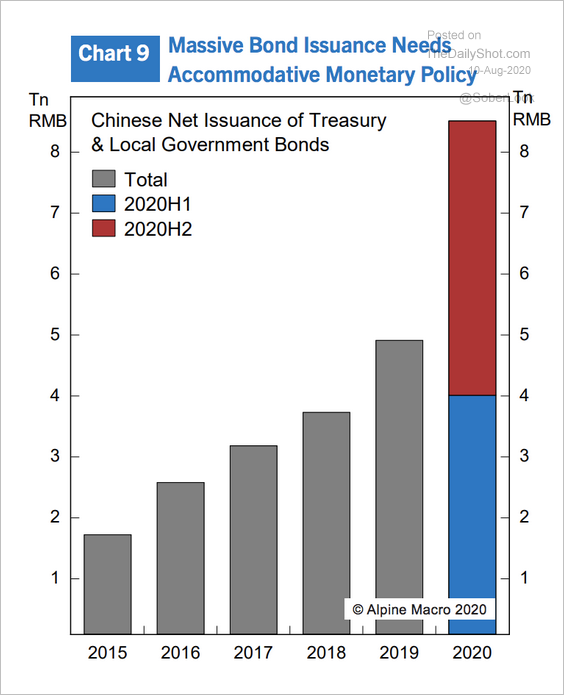
• According to Alpine Macro, “… the government still needs to issue RMB 4.5 trillion bonds both at the central and local levels, a sharp increase from previous years.”
 Source: Alpine Macro
Emerging Markets
1. Let’s begin with Turkey.
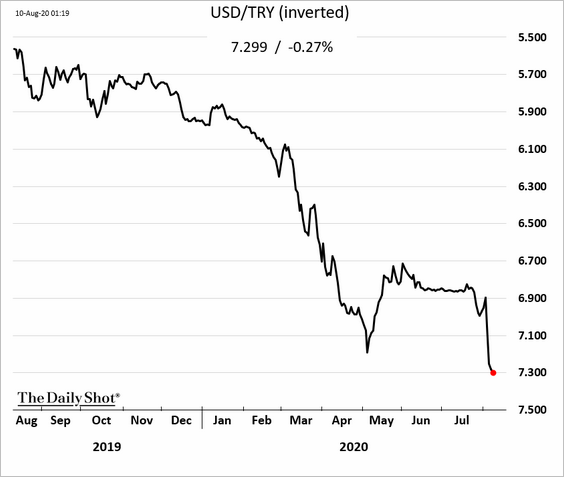
• The lira :
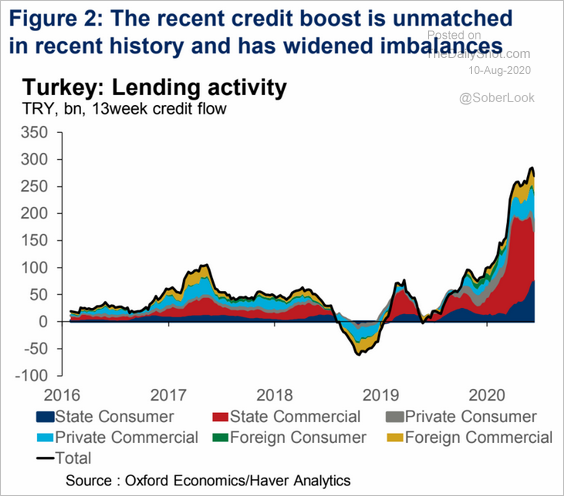
• Credit growth (driven by state-owned lenders):
 Source: Oxford Economics
• External assets:
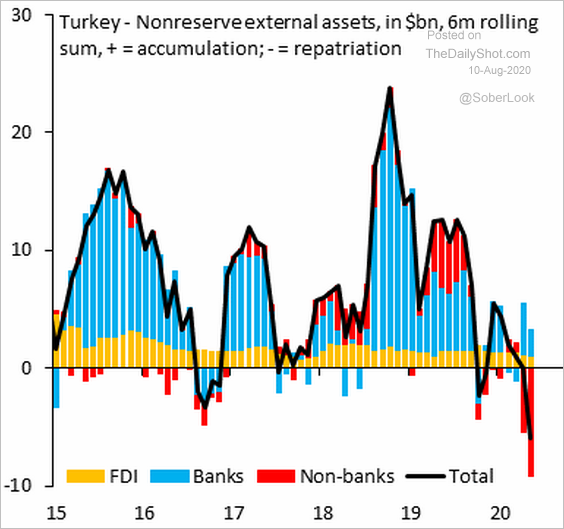 Source: @SergiLanauIIF
• Foreign ownership of local debt:
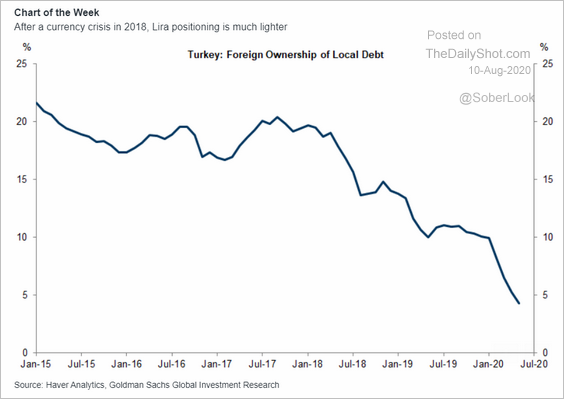 Source: Goldman Sachs
——————–
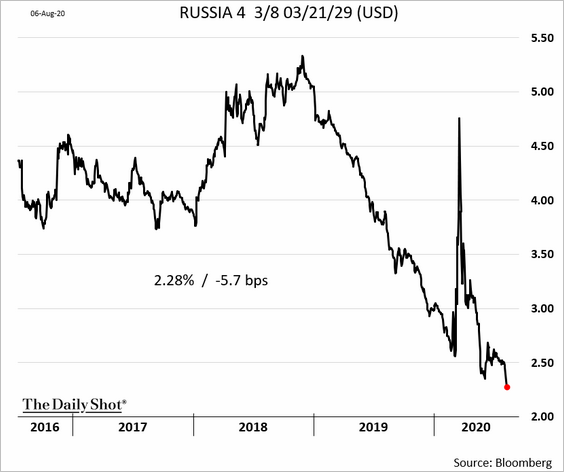
2. Russia’s USD-denominated bond yields continue to trend lower.
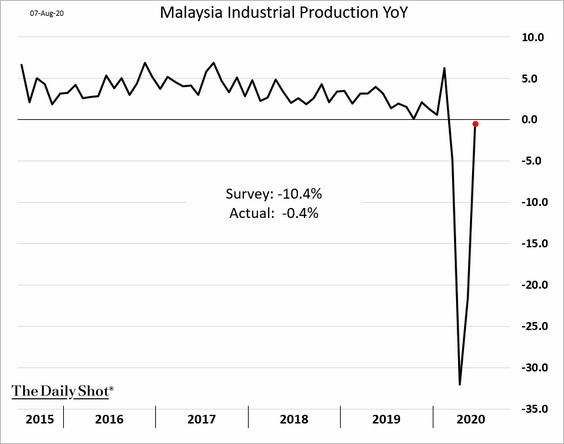
3. Malaysia’s industrial production is now flat on a year-over-year basis.
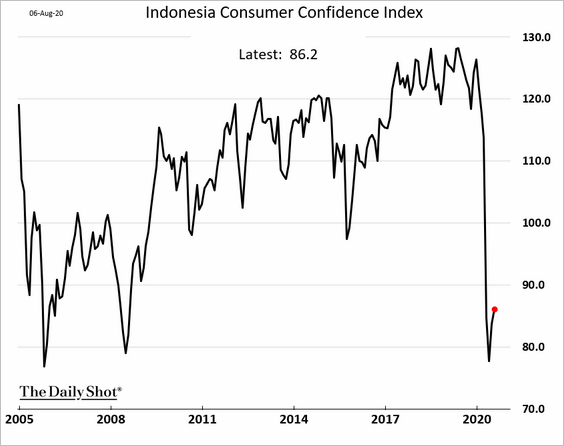
4. Indonesia’s consumer confidence remains depressed.
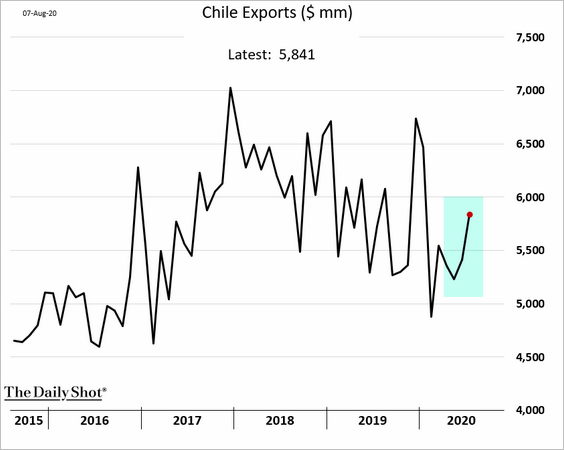
5. Chile’s exports are recovering.
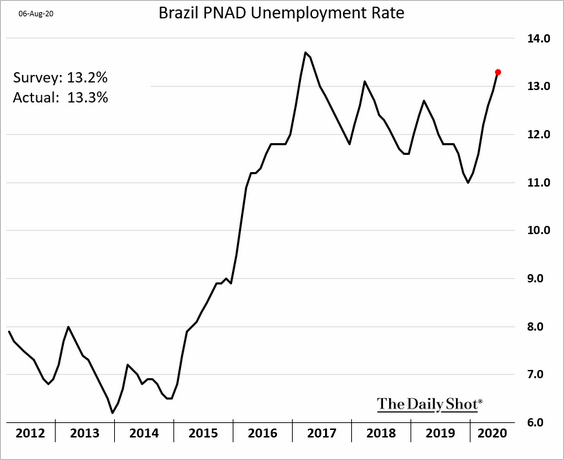
• Brazil’s unemployment rate is climbing:
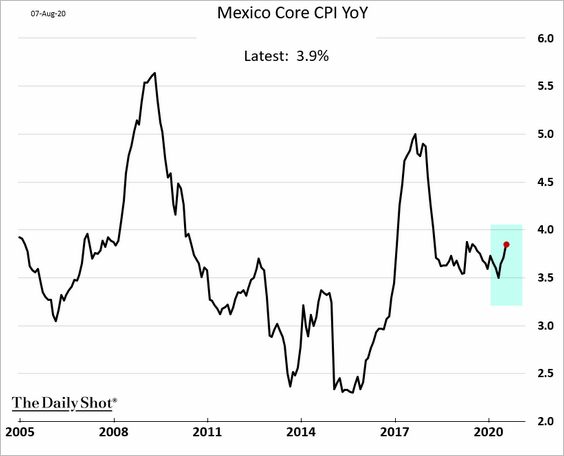
• Mexico’s CPI ticked higher.
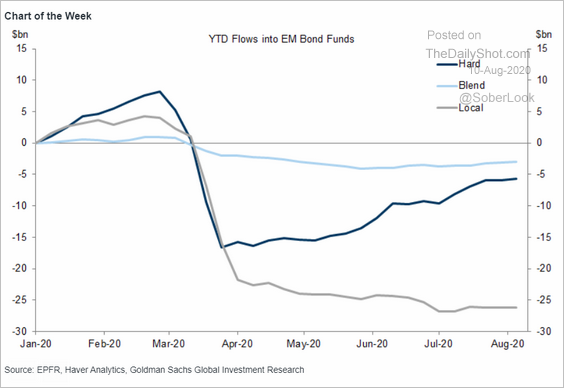
• There is no rebound in local-currency EM bond fund flows.
 Source: Goldman Sachs
Commodities
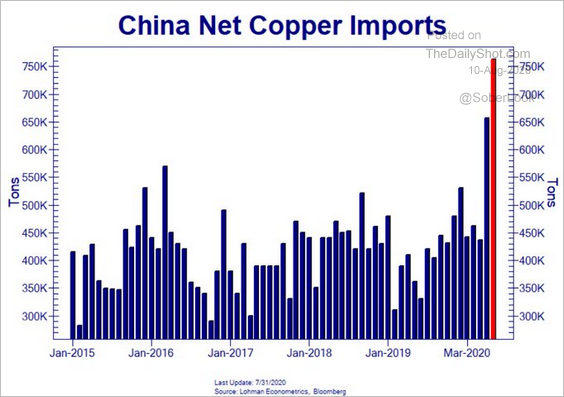
1. Despite China’s record imports, …
 Source: @Not_Jim_Cramer
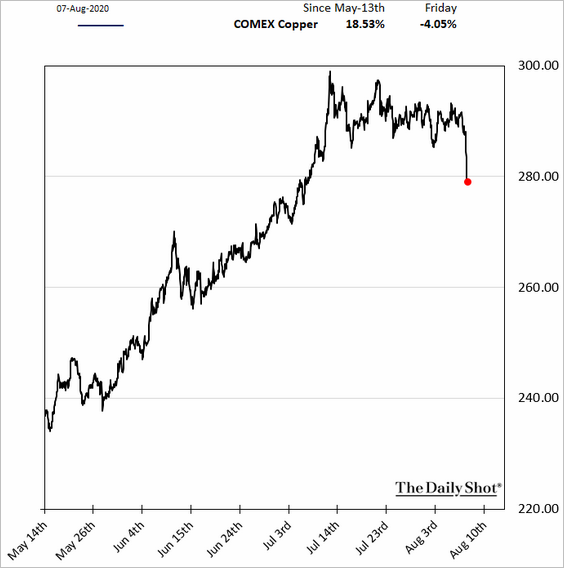
… copper took a spill last week, pressured by the US-China tensions.
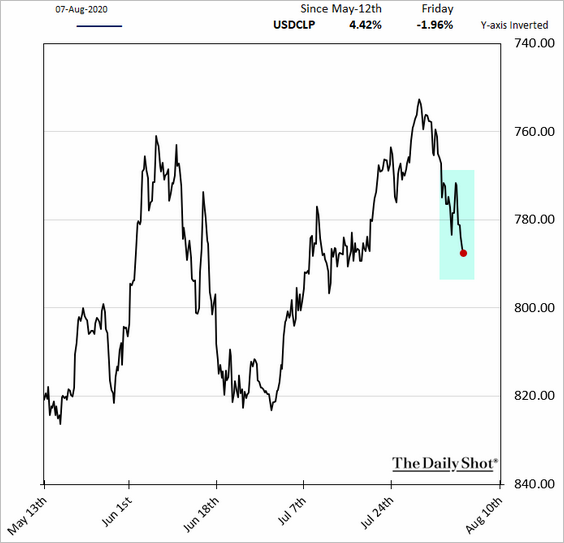
The Chilean peso weakened in response.
——————–
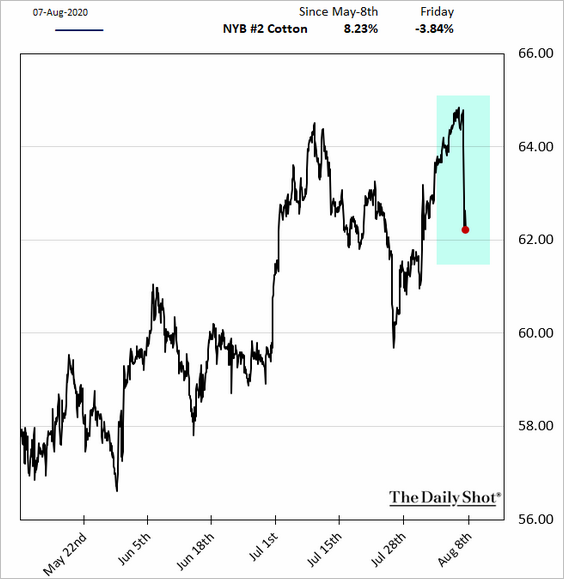
2. US cotton prices also declined sharply in response to the US-China issues.
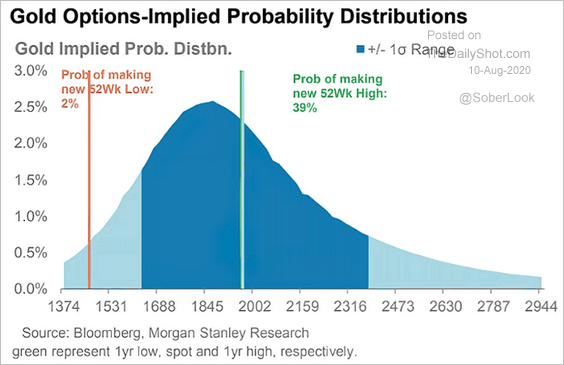
3. This chart shows the option-implied probability distribution of gold prices.
 Source: @ISABELNET_SA, @MorganStanley
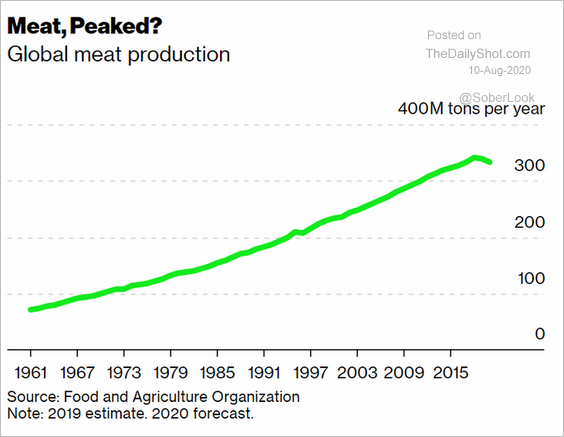
4. Peak meat?
 Source: @NatBullard Read full article
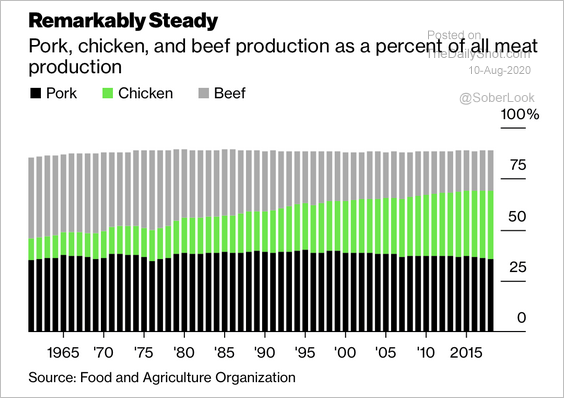
Here is the distribution of pork, chicken, and beef production over time.
 Source: @adam_tooze, @business Read full article
Energy
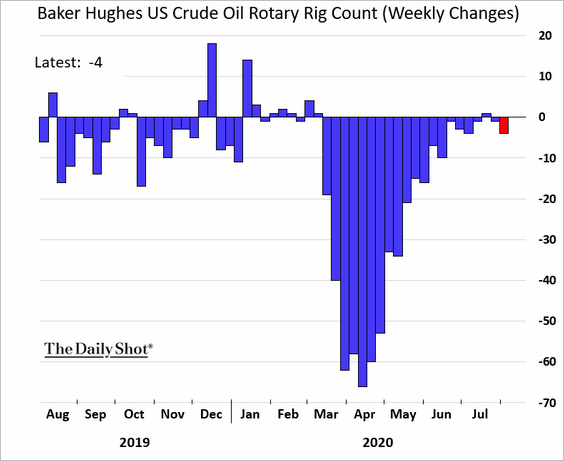
1. The US rig count declined again last week.
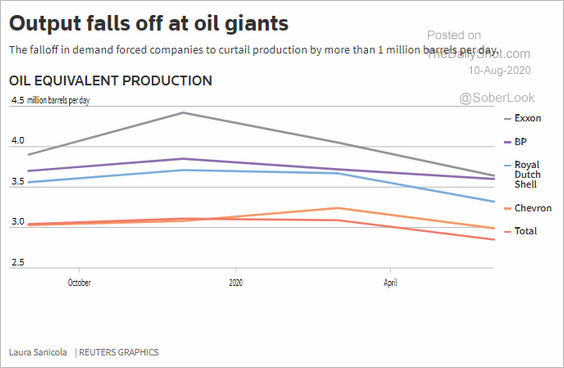
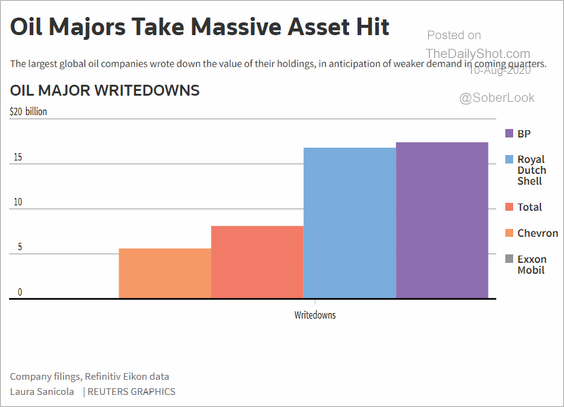
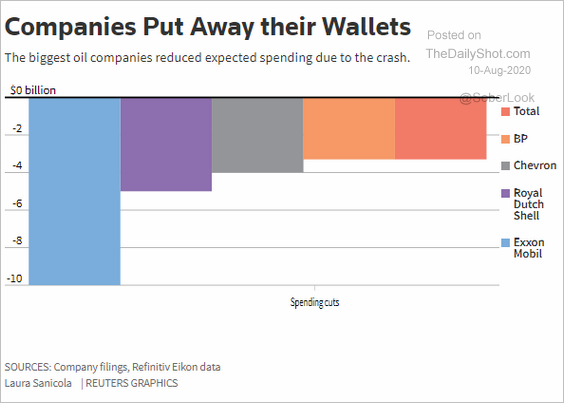
2. Next, we have some updates on “big oil.”
• Production:
 Source: Reuters Read full article
• Asset writedowns:
 Source: Reuters Read full article
• Spending cuts:
 Source: Reuters Read full article
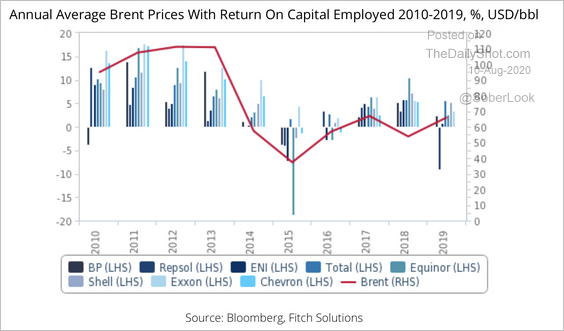
• Fitch Solutions expects that without a boom in oil prices, energy firms will continue to realize low returns on invested capital.
 Source: Fitch Solutions Macro Research
——————–
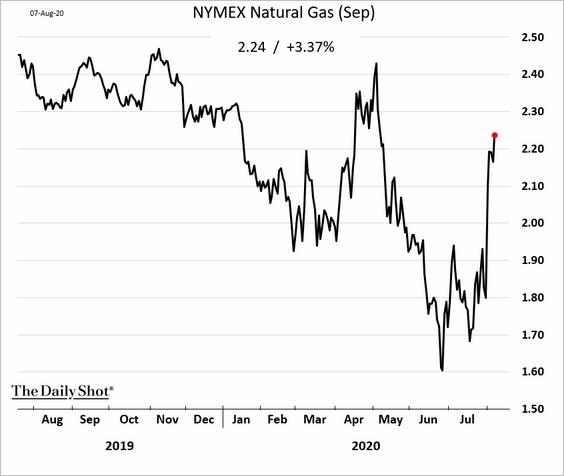
3. US natural gas futures continue to rally.
Equities
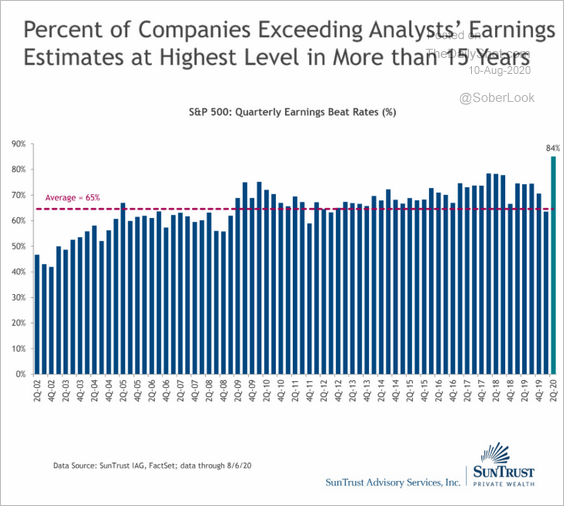
1. Positive earnings surprises are hitting multi-year highs.
 Source: SunTrust Private Wealth Management
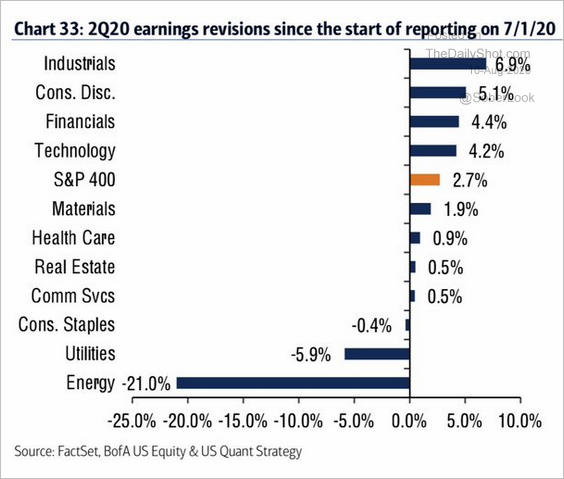
2. This chart shows the Q2 earnings revisions by sector since 7/1/2020.
 Source: BofA Merrill Lynch Global Research, @WallStJesus
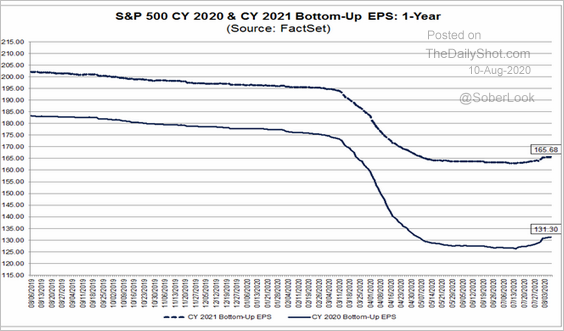
3. Analysts are increasing EPS estimates for S&P 500 companies.
 Source: @FactSet Read full article
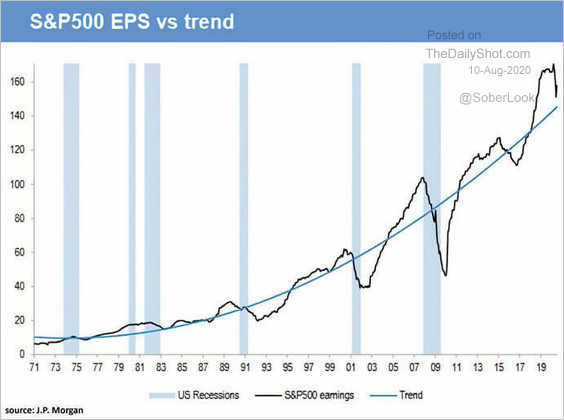
4. Earnings remain above the long-term trend.
 Source: @ISABELNET_SA, @jpmorgan
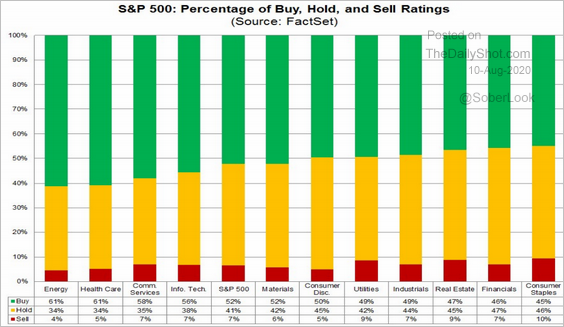
5. Here is the distribution of buy, hold, and sell ratings by sector.
 Source: @FactSet Read full article
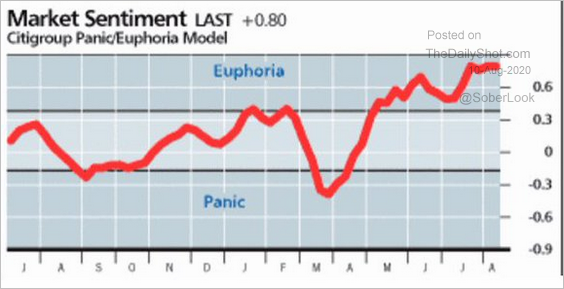
6. The Citi equity market sentiment index remains in “euphoria” mode.
 Source: @jsblokland
7. Fractional trades point to “dumb money” flooding into the market.
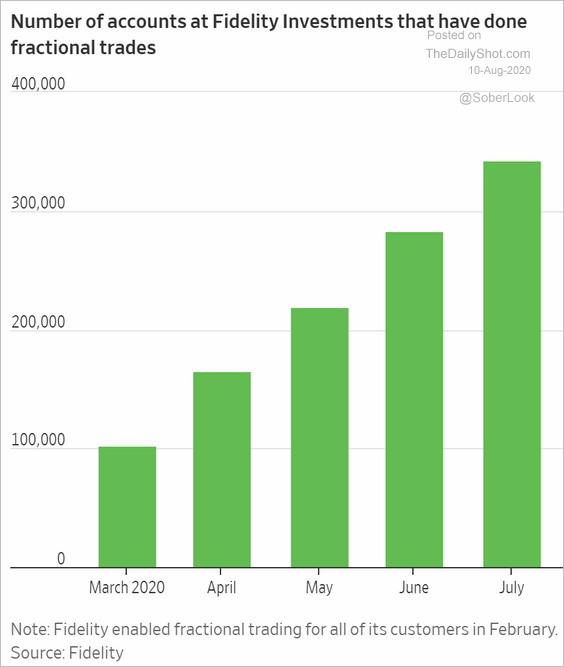 Source: @WSJ Read full article
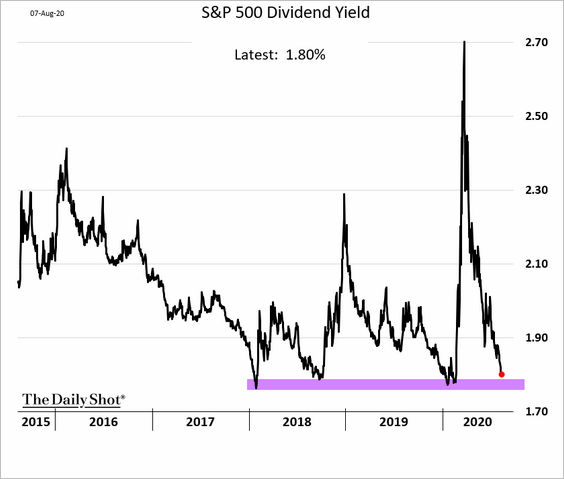
8. How low will the S&P 500 dividend yield go?
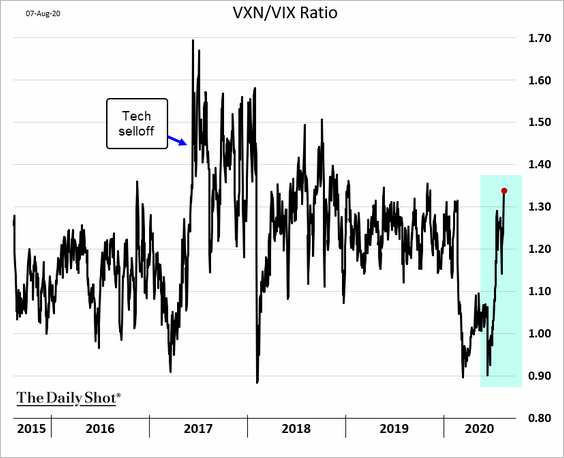
9. The Nasdaq 100 VIX-equivalent (VXN) continues to rebound relative to VIX.
Credit
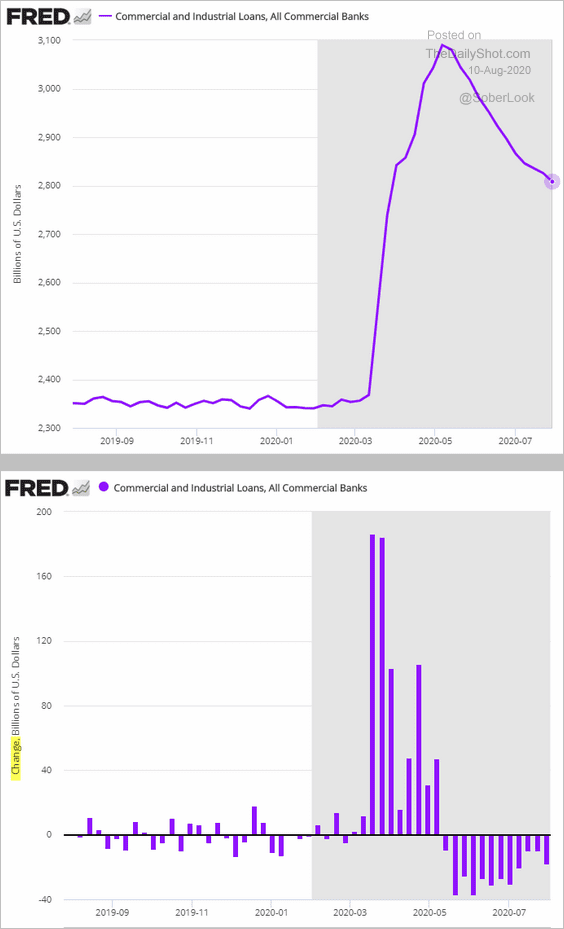
1. US business loan balances at banks keep shrinking.
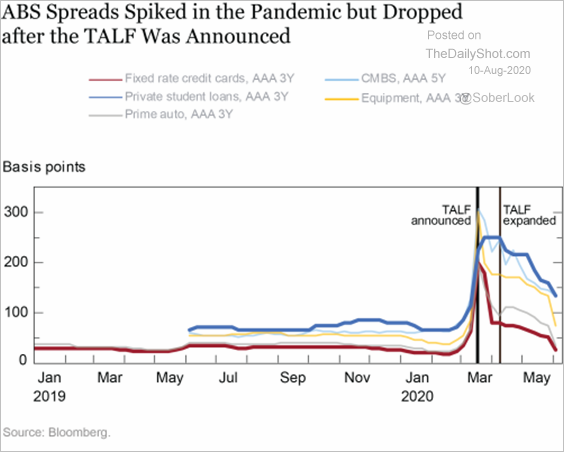
2. ABS debt received substantial support from the Fed’s TALF program.
 Source: Liberty Street Economics Read full article
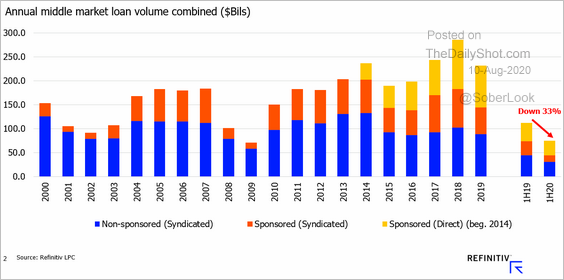
3. Middle-market loan origination slowed this year.
 Source: @LPCLoans
——————–
Food for Thought
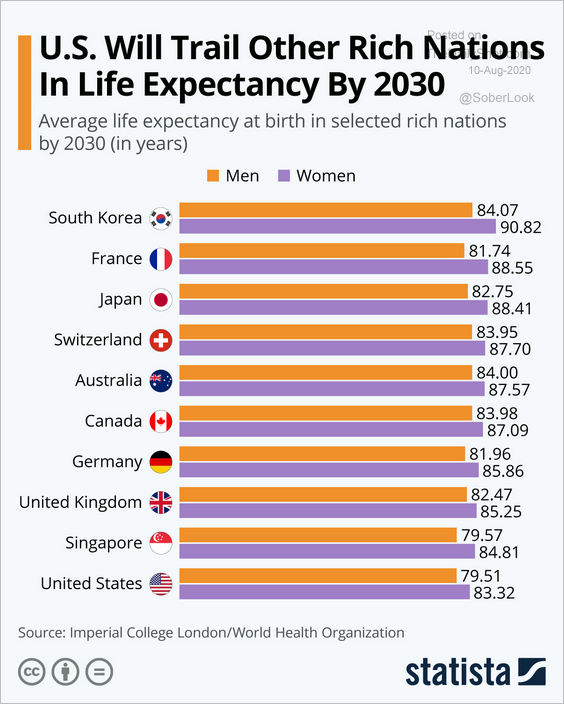
1. Life expectancy by 2030:
 Source: Statista
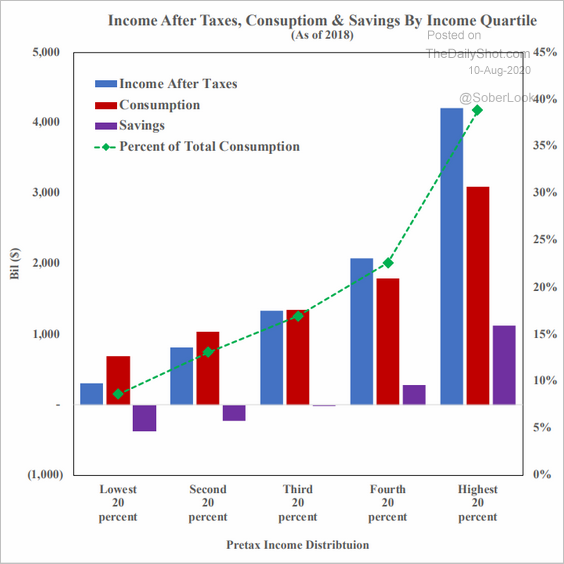
2. Income, consumption, and savings, by income category:
 Source: SOM Macro Strategies
3. Millennial homeownership rates:
 Source: Porch.com Read full article
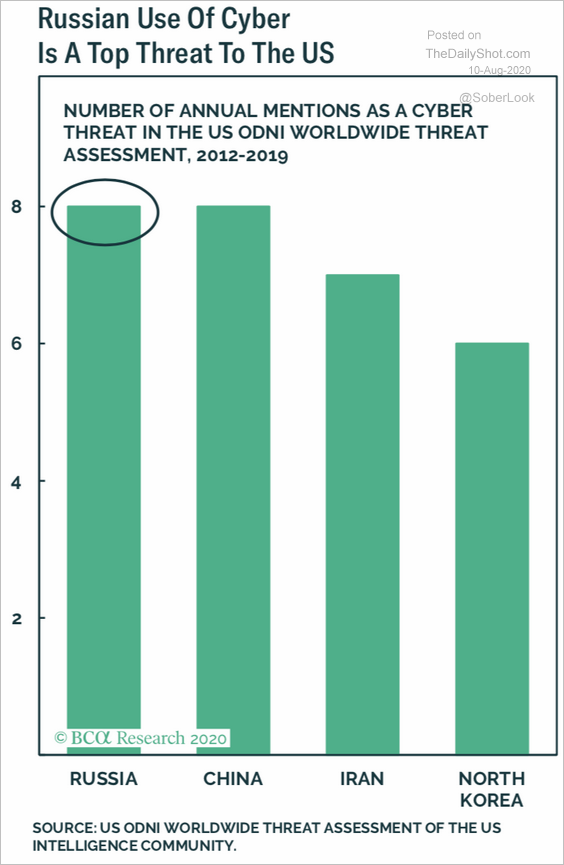
4. Cyber threats:
 Source: BCA Research
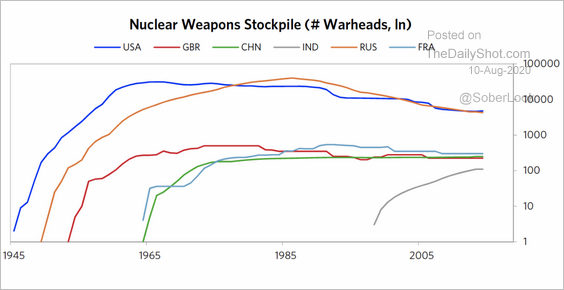
5. Nuclear weapons stockpiles:
 Source: Ray Dalio Read full article
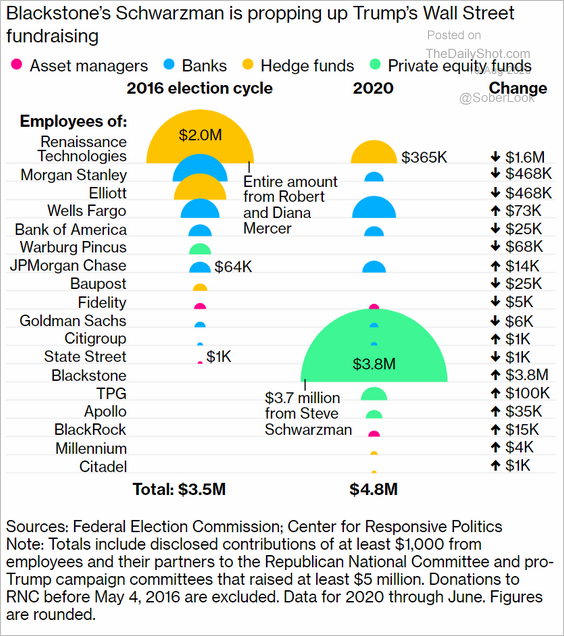
6. Wall Street’s political donations:
 Source: @bpolitics Read full article
7. Digital ad revenues:
 Source: @FactTank Read full article
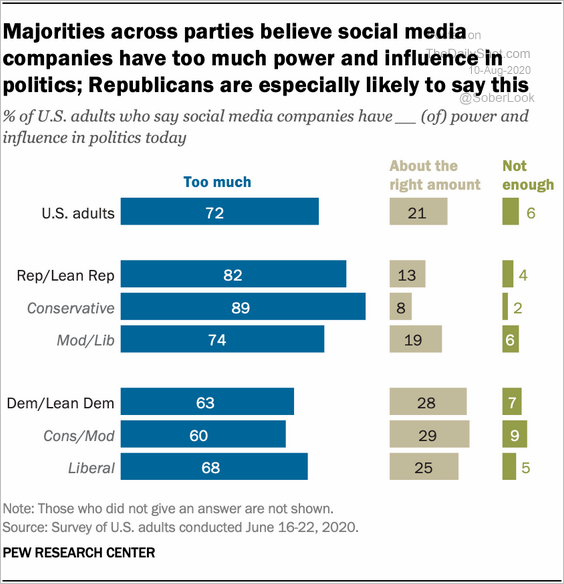
8. How Americans view social media companies:
 Source: @FactTank Read full article
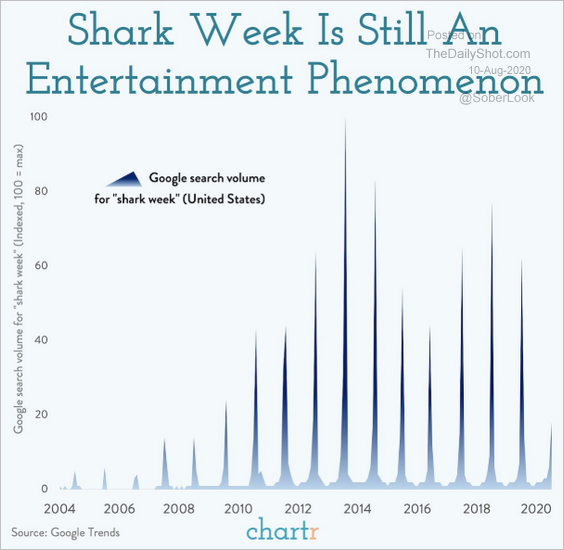
9. Search activity for “shark week”:
 Source: @chartrdaily
——————–
