The Daily Shot: 12-Aug-20
• The United States
• The United Kingdom
• The Eurozone
• Europe
• Asia – Pacific
• China
• Emerging Markets
• Commodities
• Energy
• Equities
• Credit
• Rates
• Global Developments
• Food for Thought
The United States
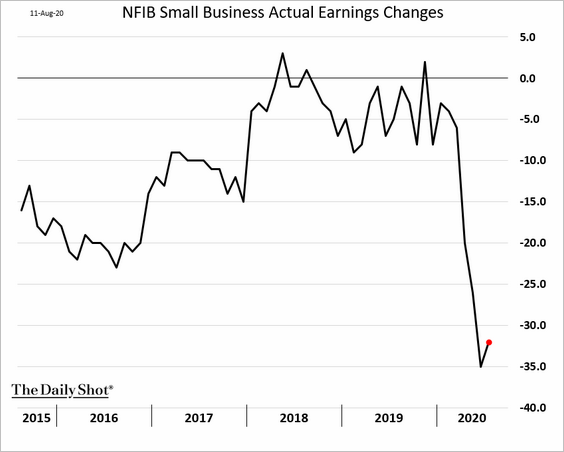
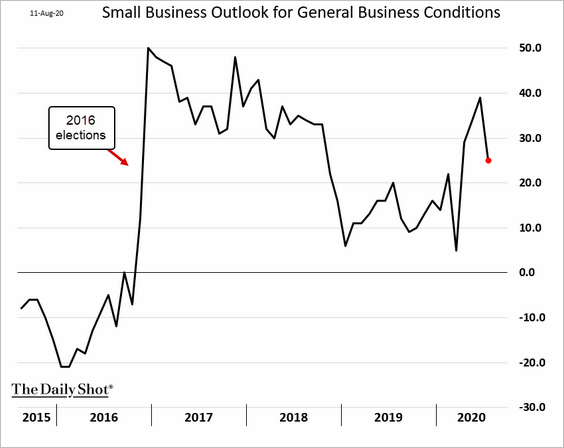
1. The NFIB small business sentiment index declined in July as the recovery slowed.
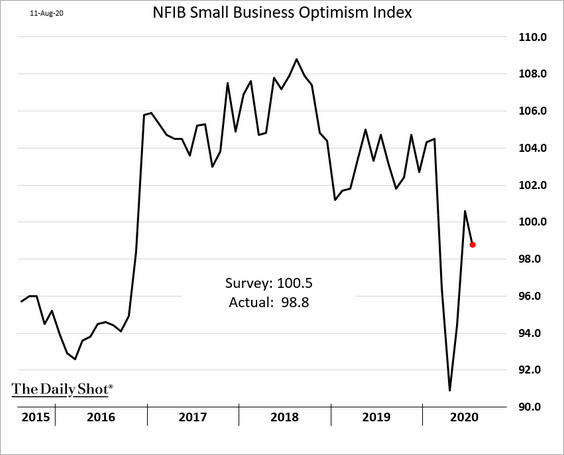
Below are some elements of the NFIB report.
• Employment recovery has been soft, …
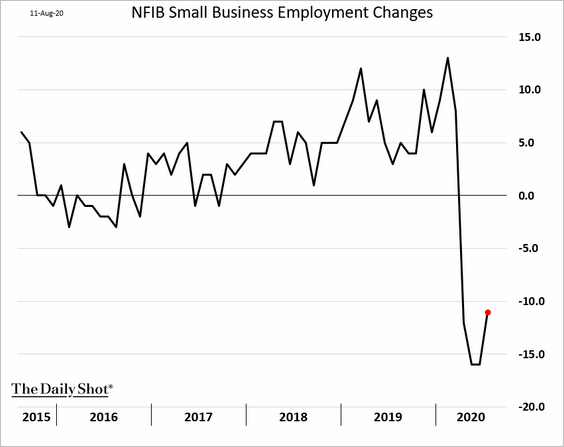
… but hiring plans have rebounded.
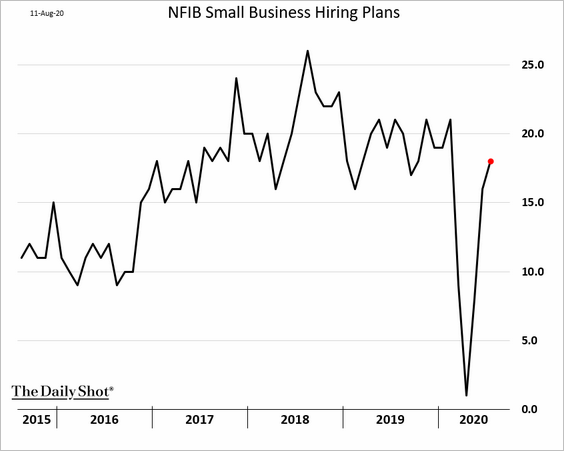
• The compensation index remains depressed.
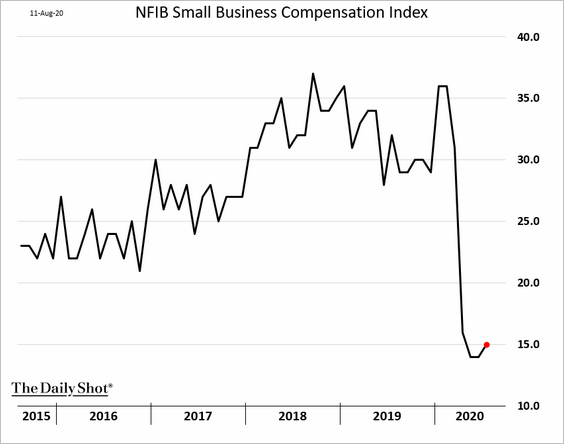
• Businesses continue to face weak earnings.
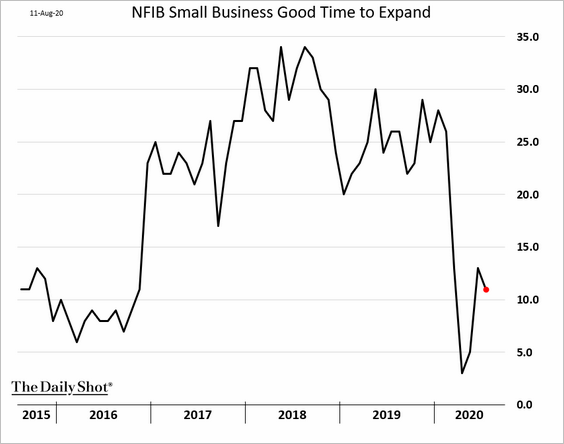
• Forward-looking indicators were lower.
– Outlook for business conditions:
• Good time to expand:
——————–
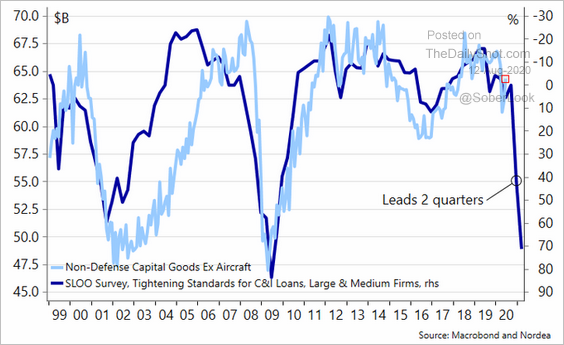
2. Small business CapEx expectations are improving.
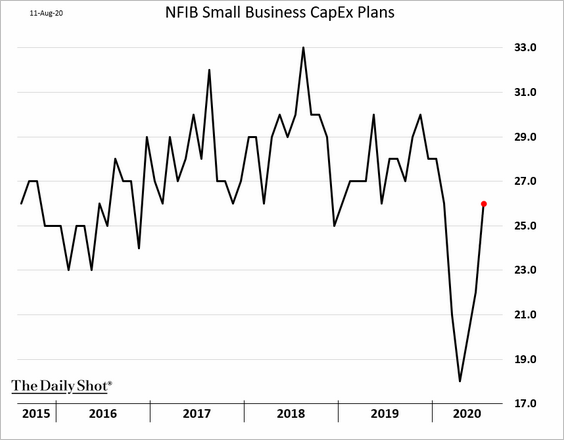
But will tighter lending standards hold back business investment?
 Source: @meremortenlund
——————–
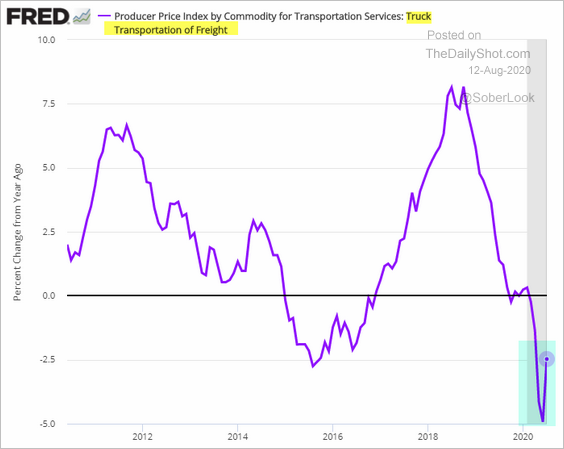
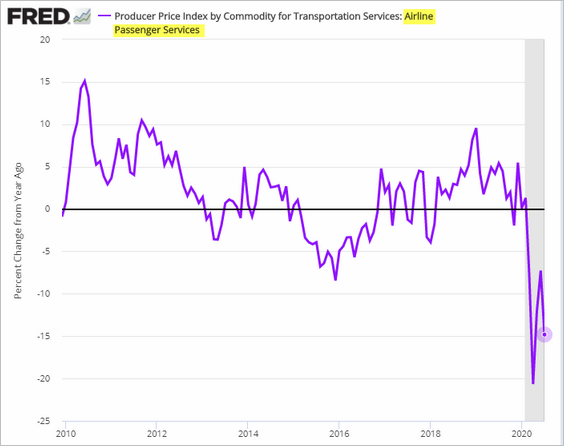
3. Producer price inflation ticked higher in July.
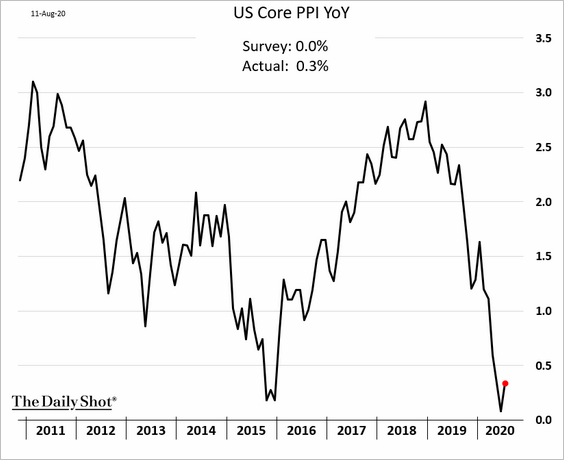
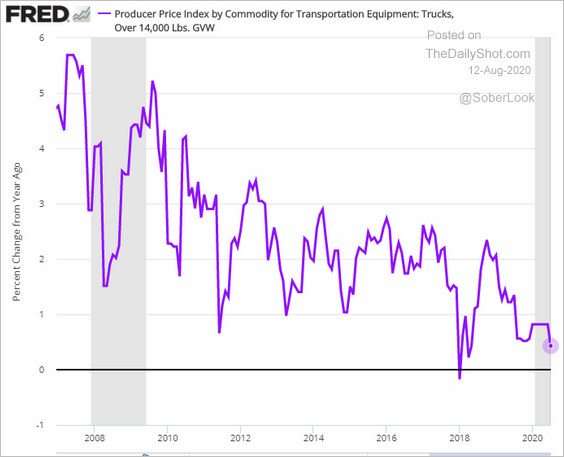
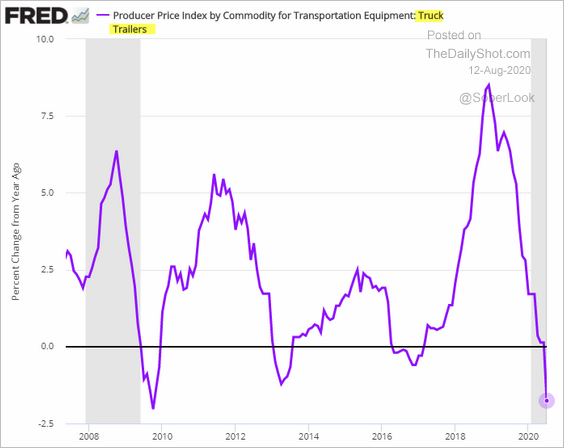
Below are some transportation-related PPI trends.
• Heavy trucks:
• Semi-trailer trucks:
• Truck transportation of freight:
• Airline passenger services:
——————–
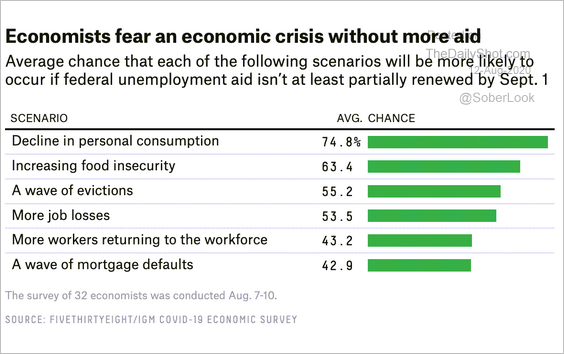
4. With pandemic aid on hold, economists are concerned about the looming income cliff.
 Source: @FiveThirtyEight Read full article
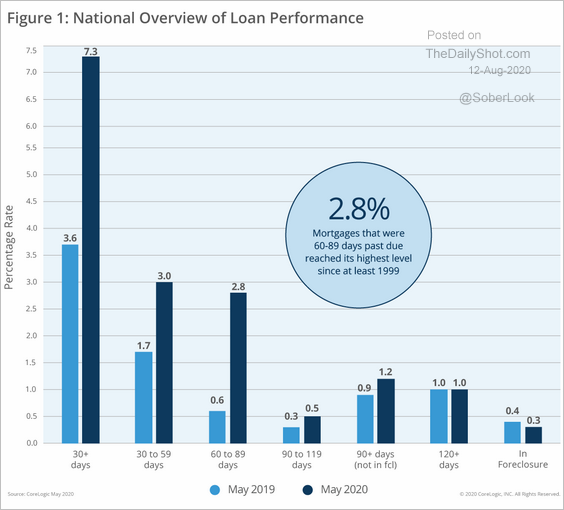
• Mortgage payment delays have skyrocketed.
 Source: CoreLogic
• Eviction numbers could be massive.
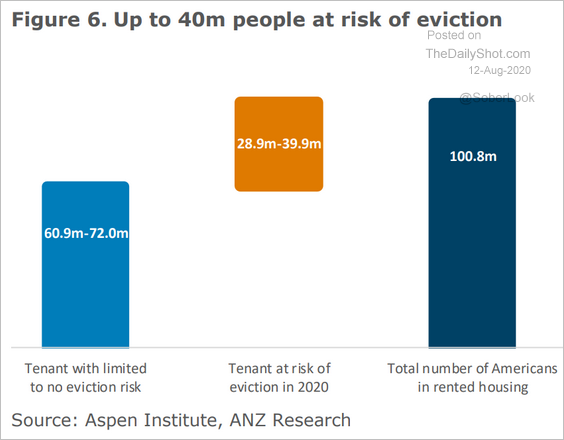 Source: ANZ Research
• Missed rent and mortgage payments continued into August.
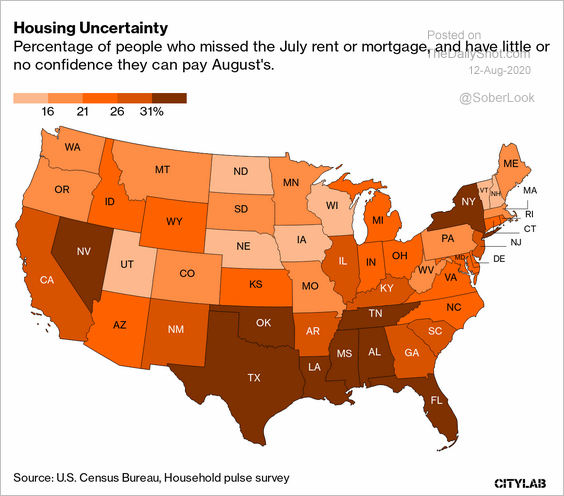 Source: @citylab Read full article
• Moreover, US consumer delinquency rates could rise sharply as banks become risk-averse.
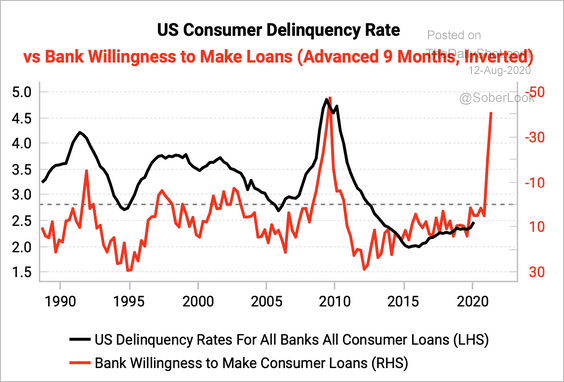 Source: Variant Perception
——————–
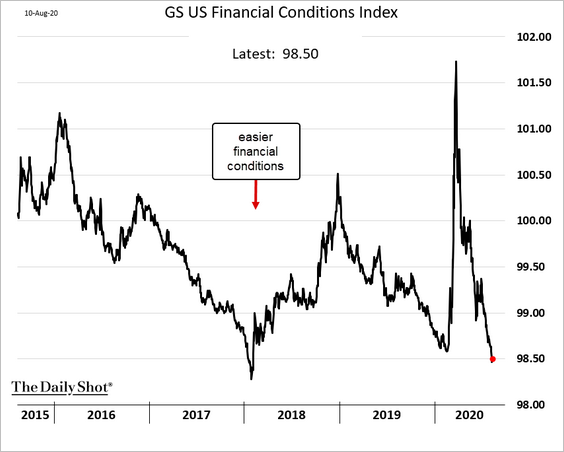
5. US financial conditions are now easier than before the start of the crisis (low rates, tight spreads, a massive stock market rally, and a weaker dollar).
6. Lumber futures hit a record high amid COVID-driven demand for housing.
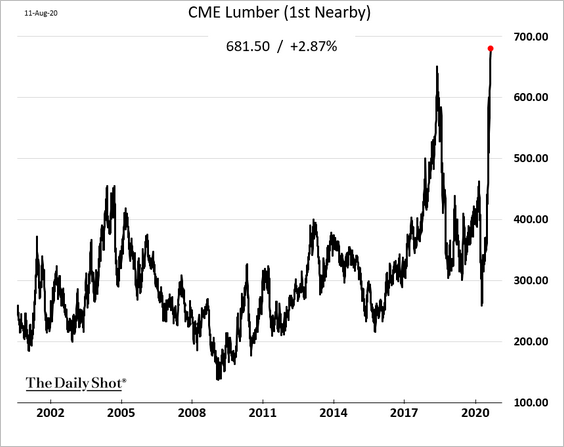
We could see an acceleration in new home prices.
 Source: Builder Read full article
——————–
7. Goldman Sachs expects a vaccine approval late this year to boost GDP growth.
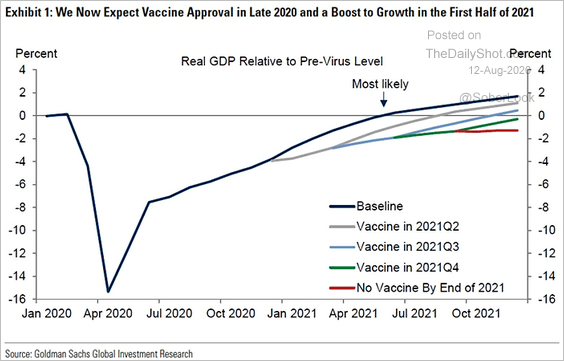 Source: @ISABELNET_SA, @GoldmanSachs
Here is the GDP trajectory forecast from Nuveen.
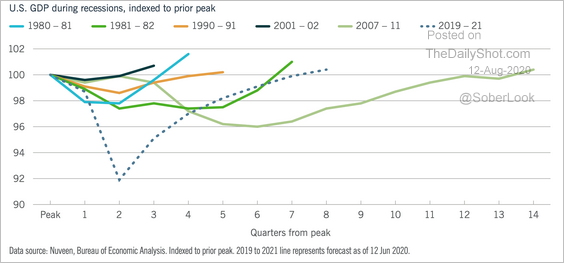 Source: Nuveen Read full article
The United Kingdom
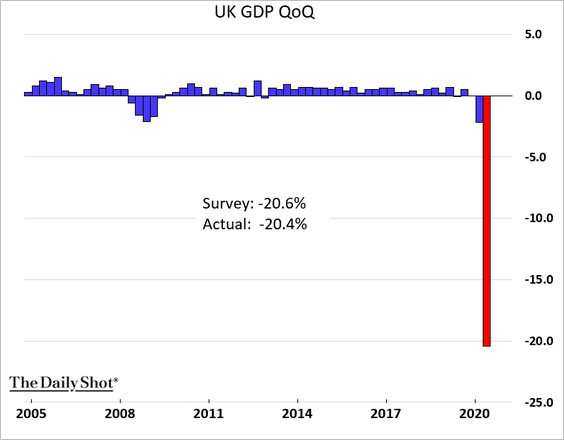
1. As expected, the GDP dipped by over 20% in Q2 (a record). More on the GDP report tomorrow.
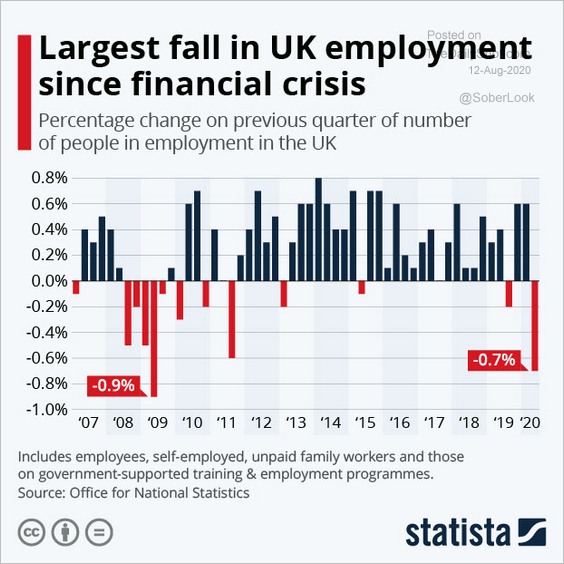
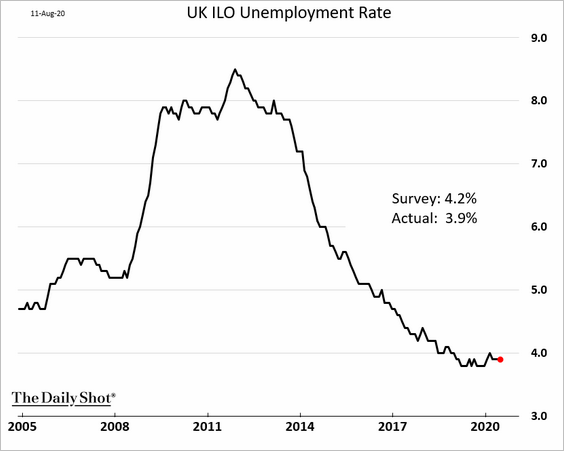
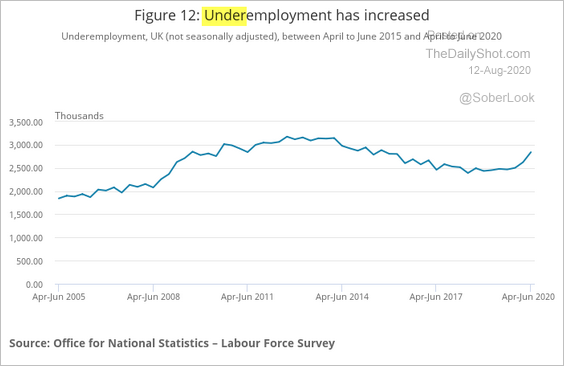
2. Now let’s take a look at the latest jobs report (through June). It’s not a great story.
• Employment decline (not as severe as feared):
 Source: Statista
• The unemployment rate (remarkably stable):
• Underemployment:
 Source: ONS
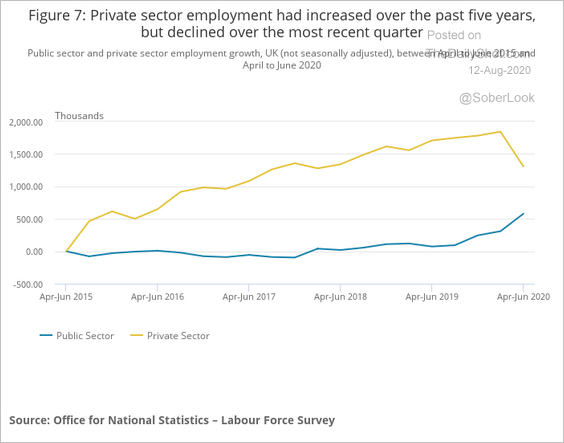
• Employment trajectories by category:
– Private vs. public sectors:
 Source: ONS
– By age:
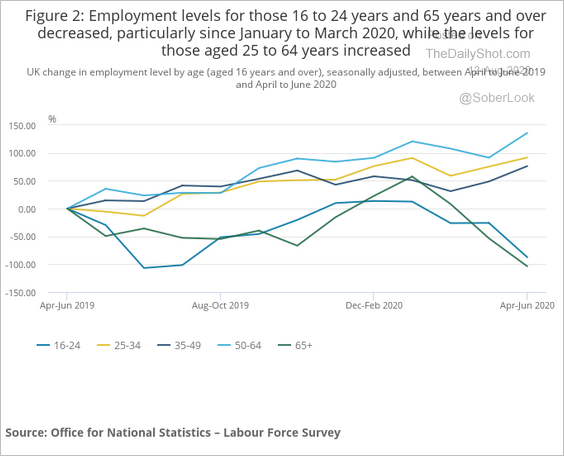 Source: ONS
– Type of employment:
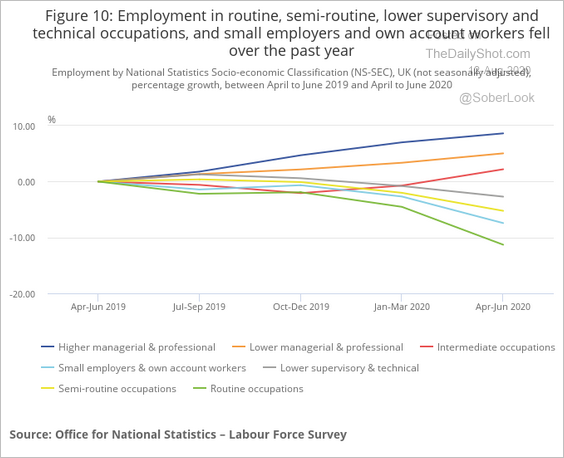 Source: ONS
– Full-time vs. part-time:
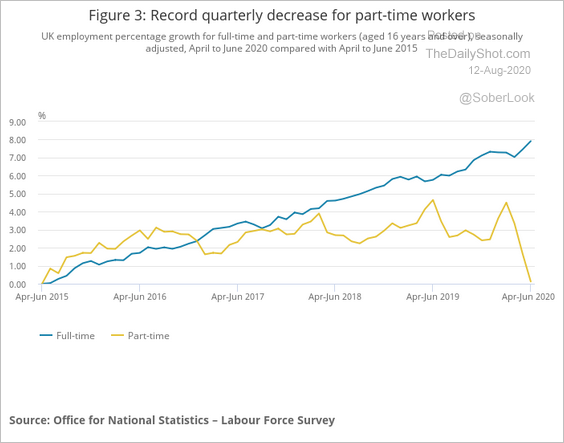 Source: ONS
– Self-employed:
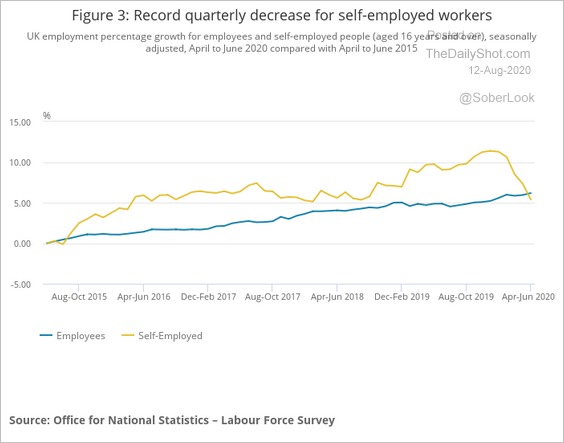 Source: ONS
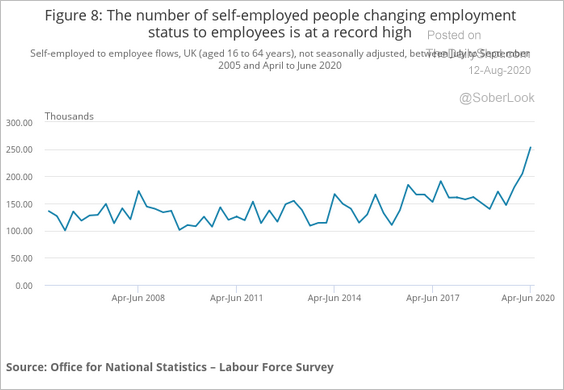
• Flows from self-employed to employed:
 Source: ONS
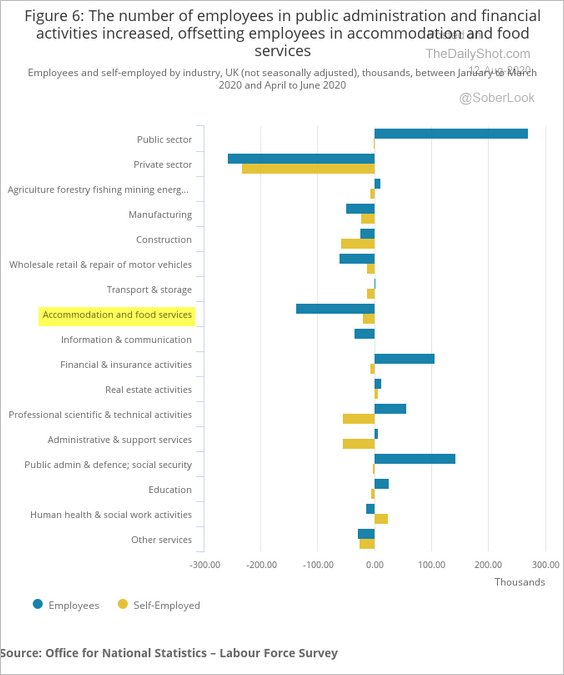
• Employment changes by sector:
 Source: ONS
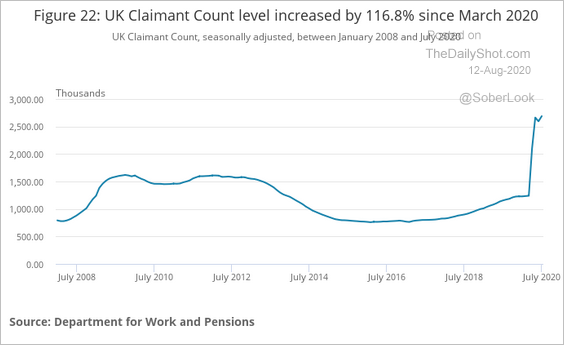
• Total unemployment claims:
 Source: ONS
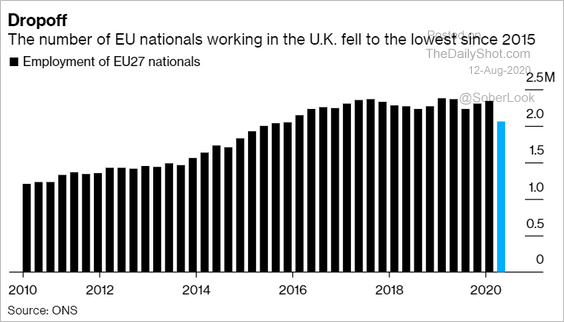
• EU nationals:
 Source: @business Read full article
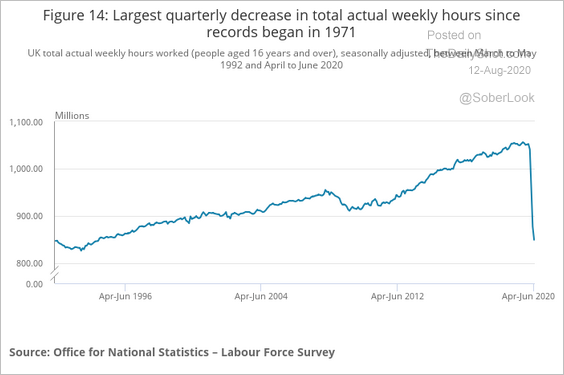
• Hours worked:
 Source: ONS
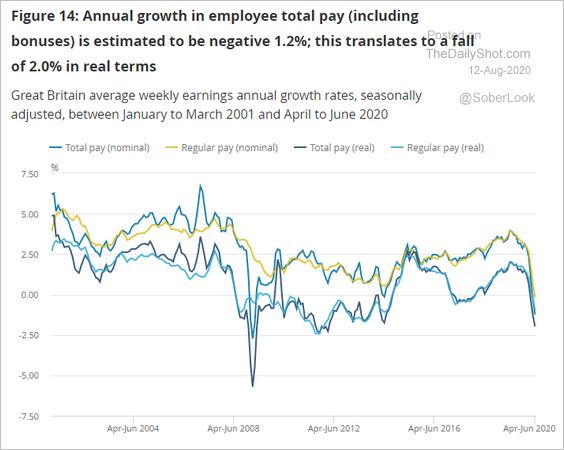
• Earnings growth:
 Source: ONS
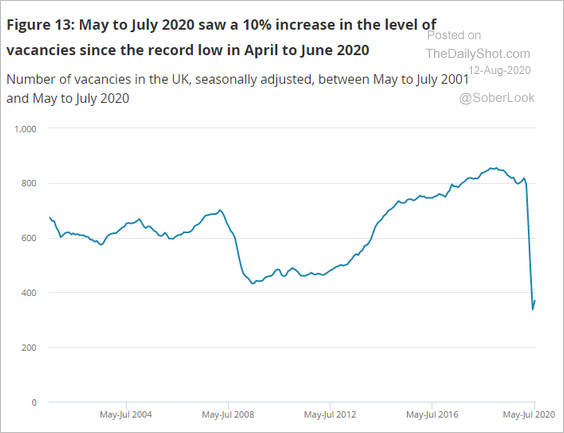
• Job openings:
 Source: ONS
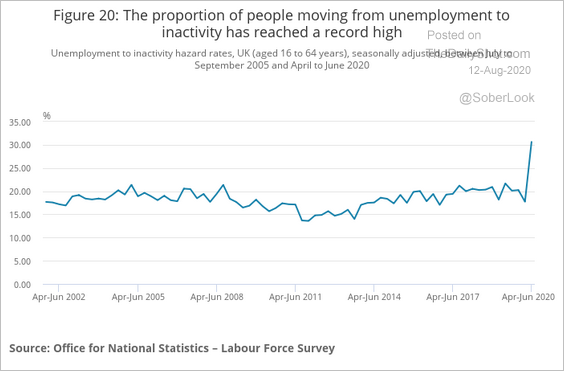
• Leaving the labor force:
 Source: ONS
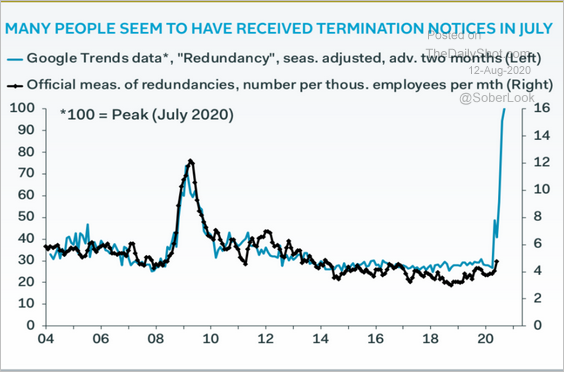
• Termination notices (through July):
 Source: Pantheon Macroeconomics
The Eurozone
1. Germany’s ZEW economic expectations index was shockingly strong this month, diverging massively from the current conditions index.
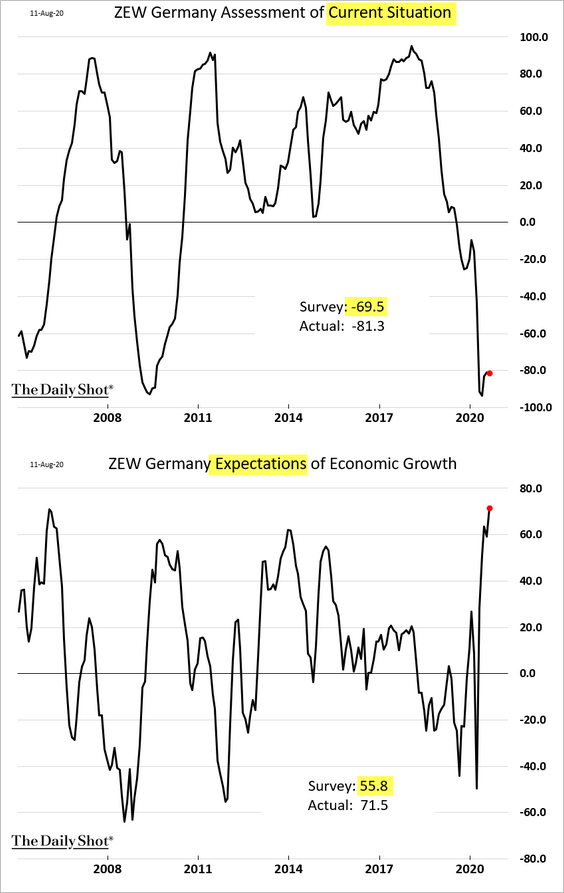
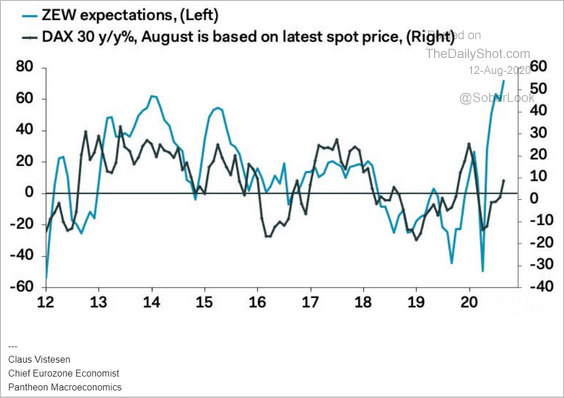
Will this optimism convert into higher stock prices?
 Source: Pantheon Macroeconomics
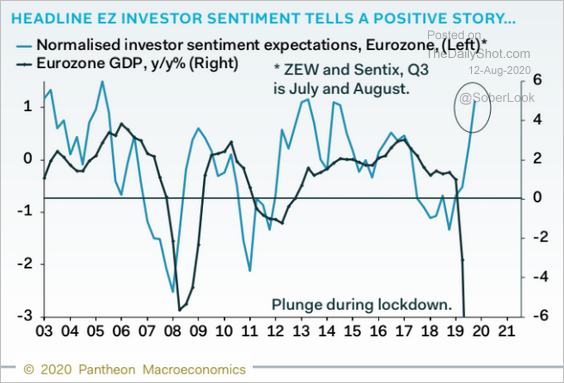
It certainly points to a sharp rebound in growth.
 Source: Pantheon Macroeconomics
——————–
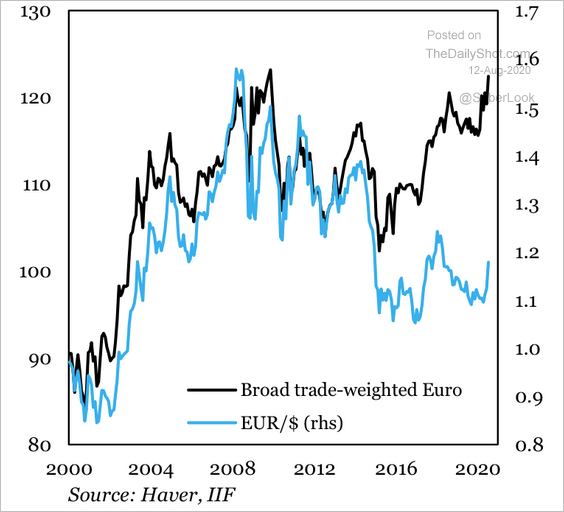
2. The broad trade-weighted euro had diverged from EUR/USD in 2016.
 Source: IIF
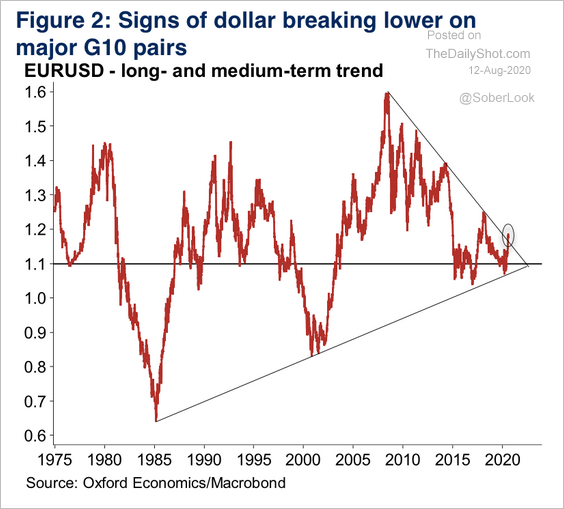
EUR/USD is attempting a break above its decade-long downtrend.
 Source: Oxford Economics
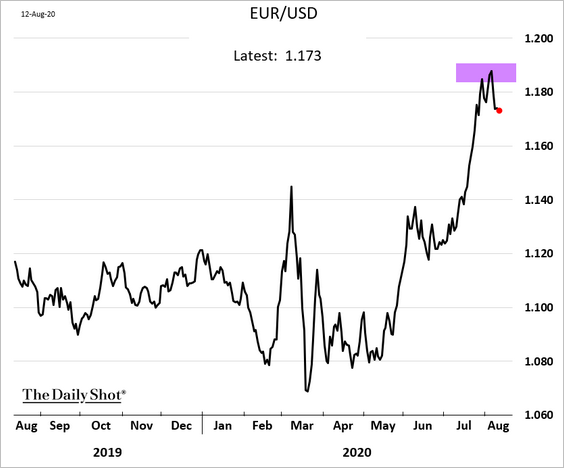
For now, the euro is back below $1.18.
——————–
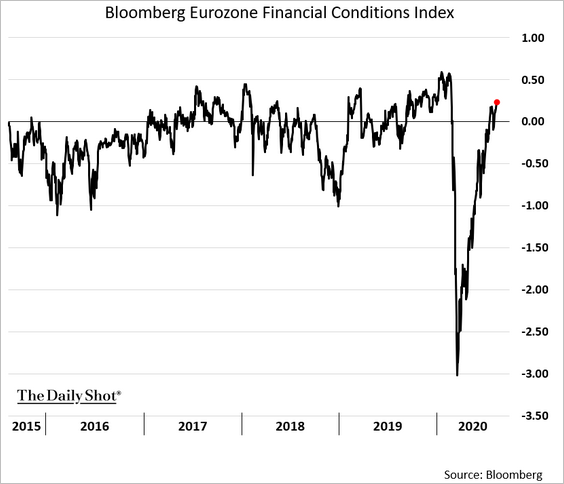
3. Financial conditions continue to ease.
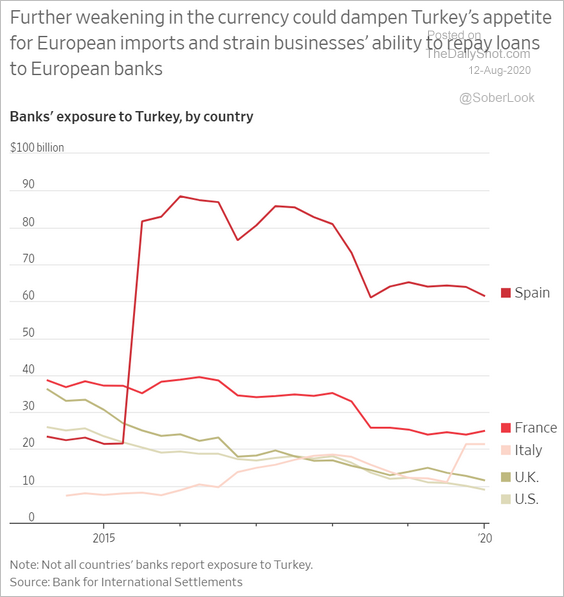
4. Some Eurozone banks have substantial exposure to Turkey.
 Source: @WSJ Read full article
Europe
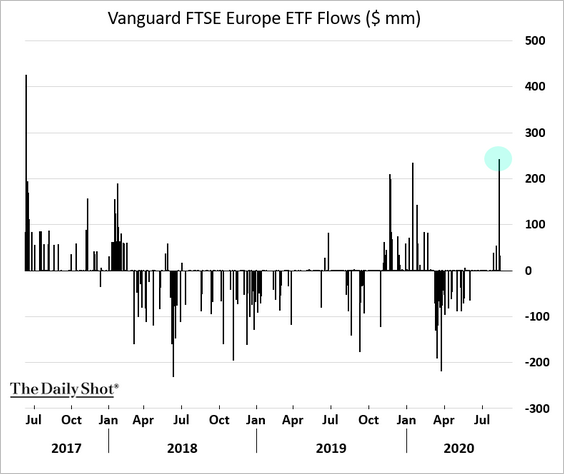
1. Vanguard’s dollar-denominated Europe ETF got some inflows recently.
 Source: @ksengal
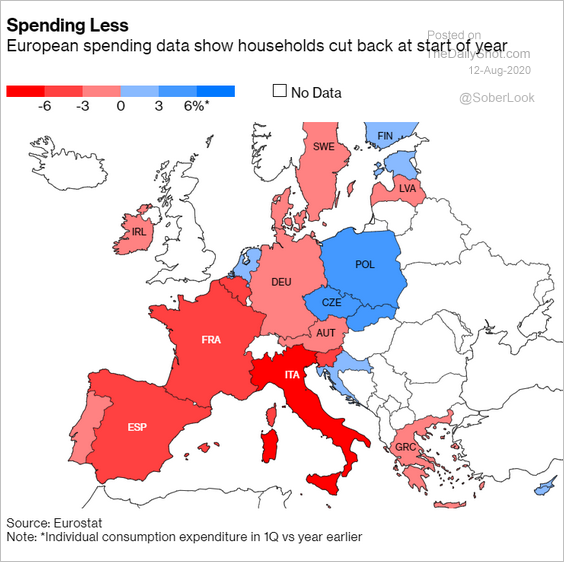
2. This map shows consumer spending changes in Q1.
 Source: @markets Read full article
Asia – Pacific
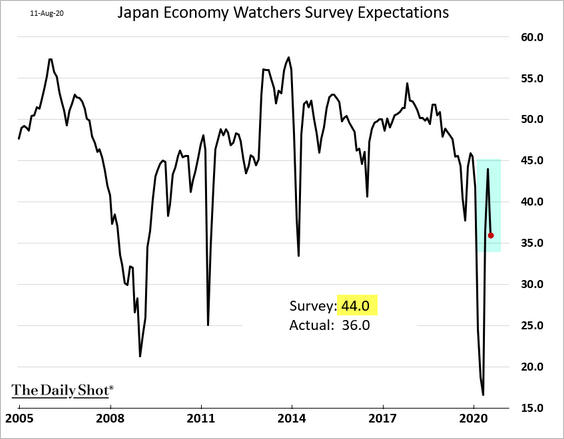
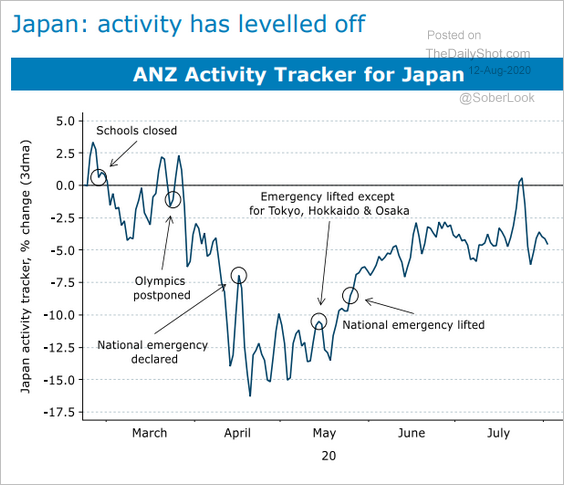
1. Japan’s Economy Watchers Expectations index unexpectedly tumbled again in July.
Here is ANZ’s activity tracker.
 Source: ANZ Research
——————–
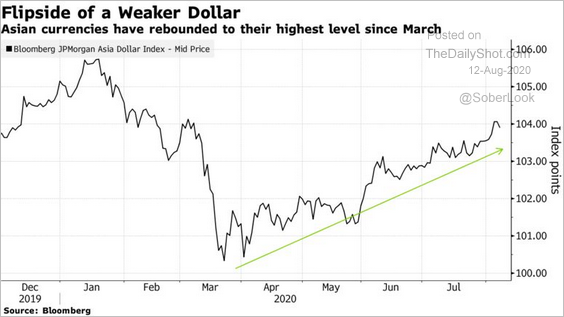
2. Asian currencies have been trending higher.
 Source: @markets Read full article
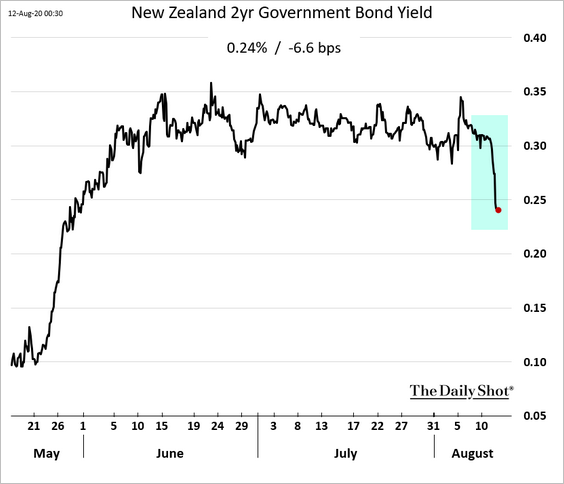
3. New Zealand’s central bank is expanding bond purchases, sending yields lower.
 Source: @markets Read full article
——————–
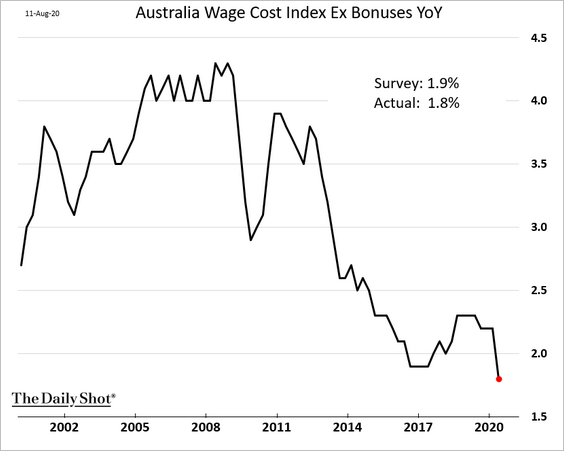
4. Australia’s wage growth fell sharply this year.
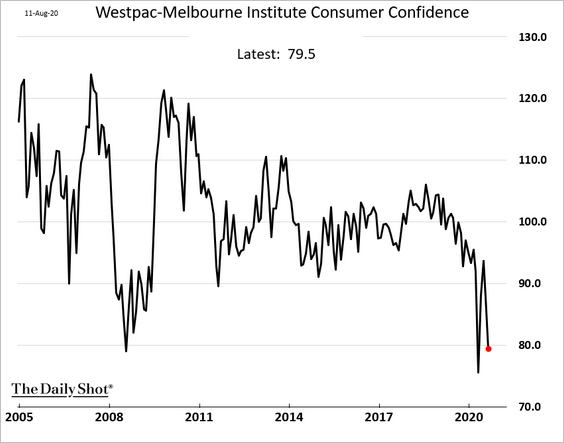
Australia’s economic confidence is back near extreme lows.
China
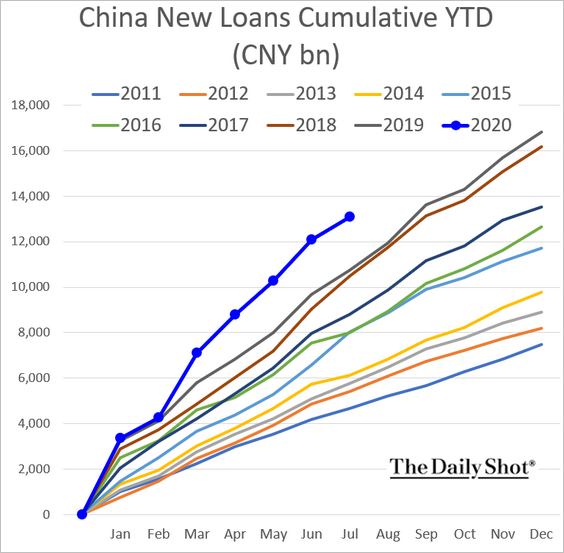
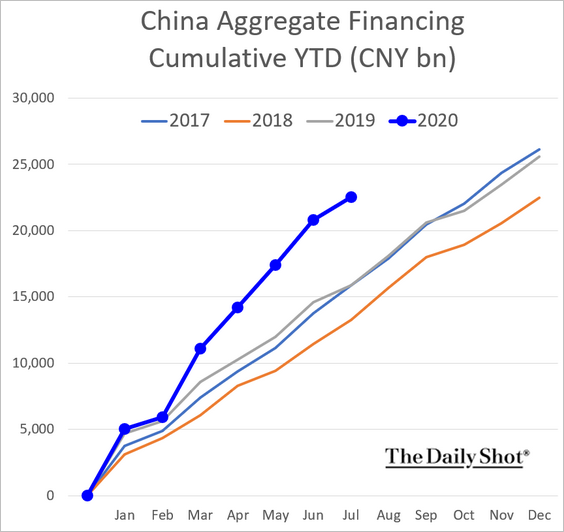
1. Loan growth slowed somewhat last month, but the cumulative year-to-date credit expansion remains well above last year’s.
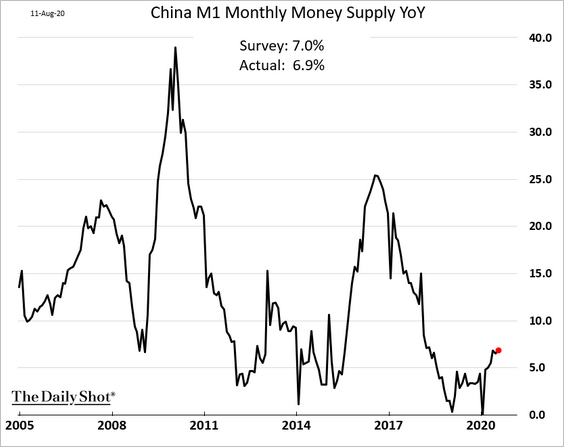
Money supply growth has been sluggish relative to other periods of Beijing’s stimulus injections.
——————–
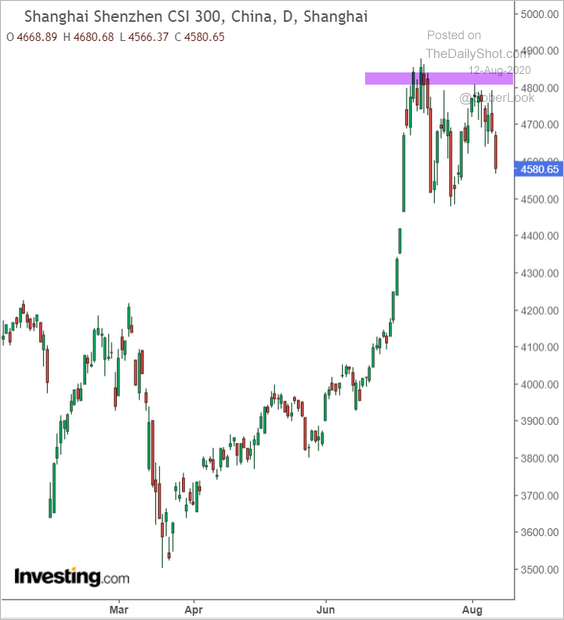
2. The stock market rally has stalled.
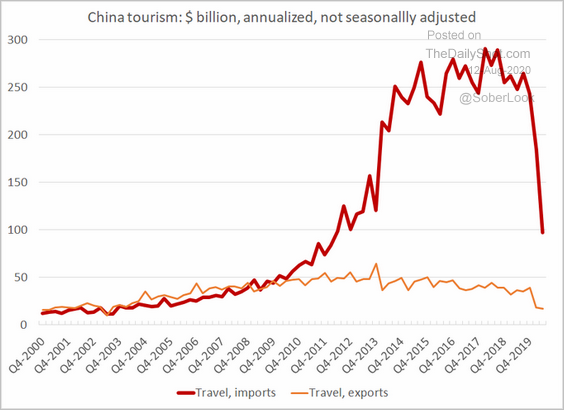
3. This chart shows China’s inbound and outbound tourism.
 Source: @Brad_Setser
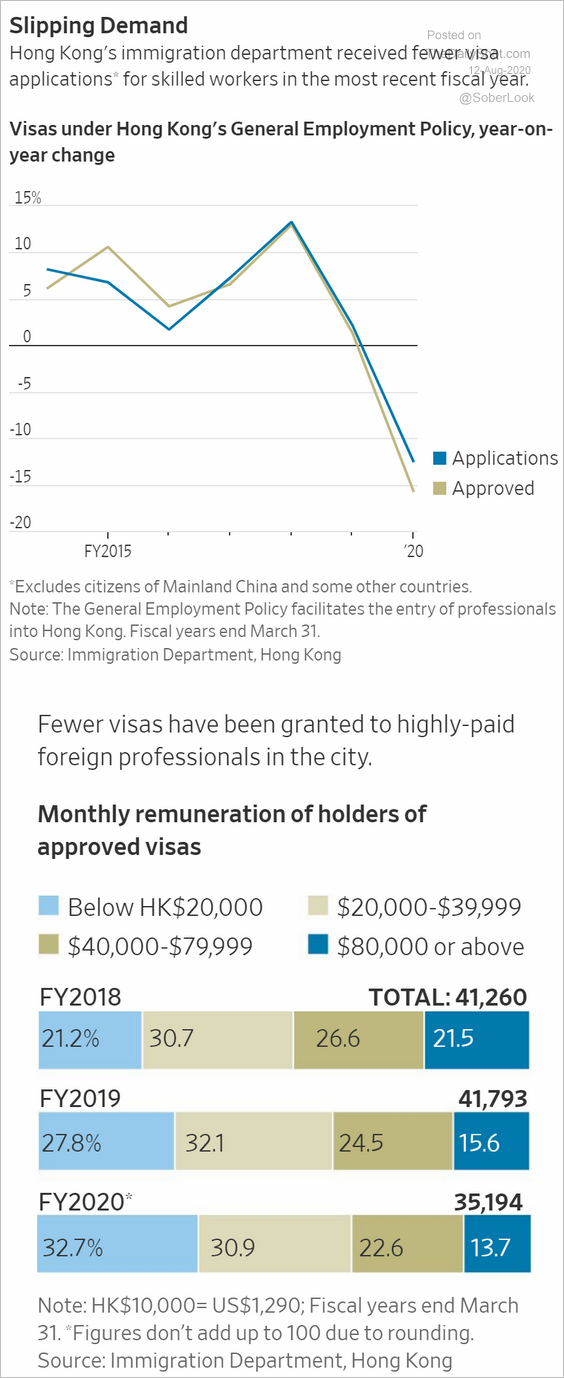
4. Skilled foreign workers are shying away from Hong Kong.
 Source: @WSJ Read full article
Emerging Markets
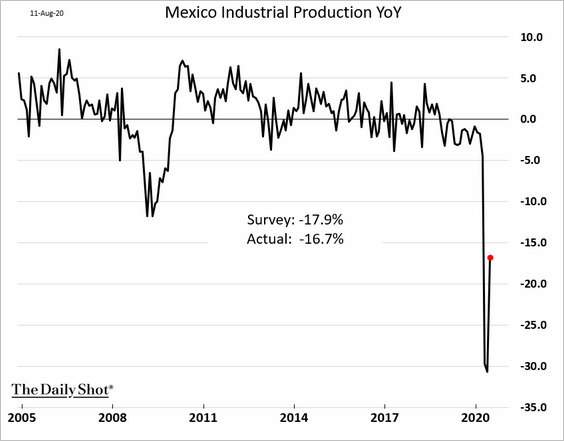
1. Mexico’s industrial production firmed up in June, boosted by US demand for vehicles.
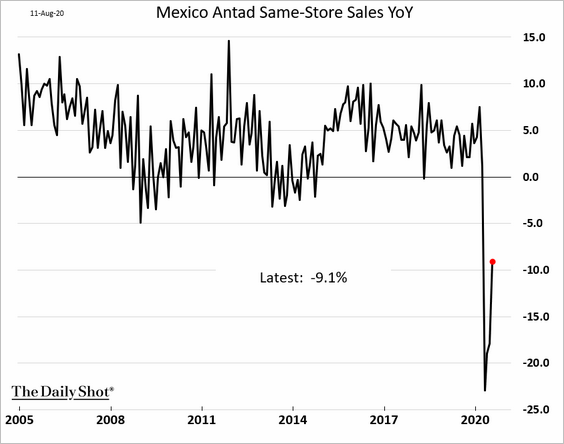
Same-store sales improved last month but remained well below normal levels.
——————–
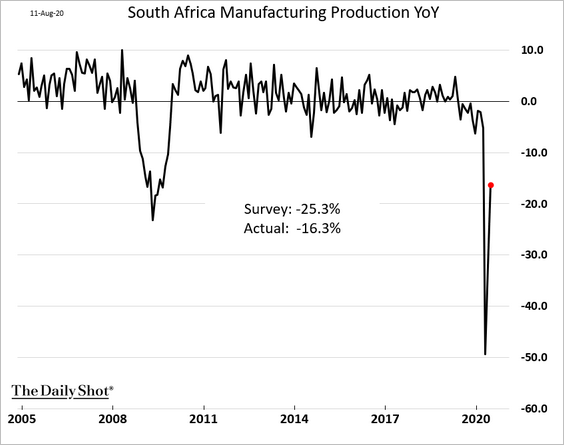
2. South Africa’s factory output is rebounding rapidly (as of June).
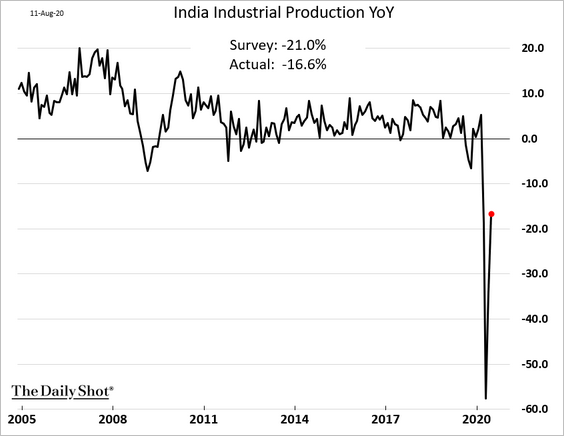
3. India’s industrial production surprised to the upside.
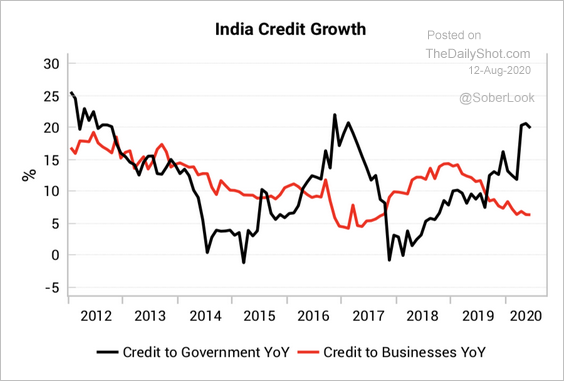
Separately, this chart shows government vs. business credit growth.
 Source: Variant Perception
Commodities
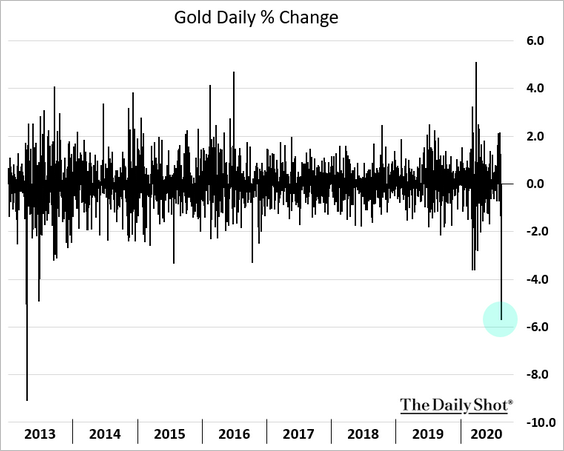
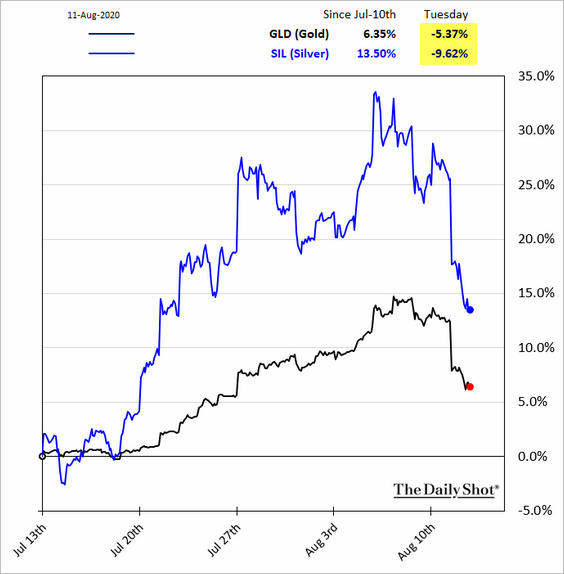
1. Precious metals took a hit on Tuesday as Treasury yields jumped (see the rates section).
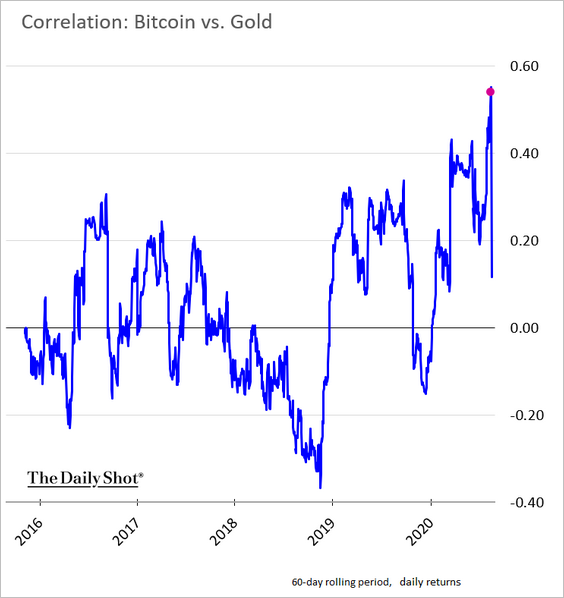
Separately, the correlation between Bitcoin and gold rose to a multi-year high.
——————–
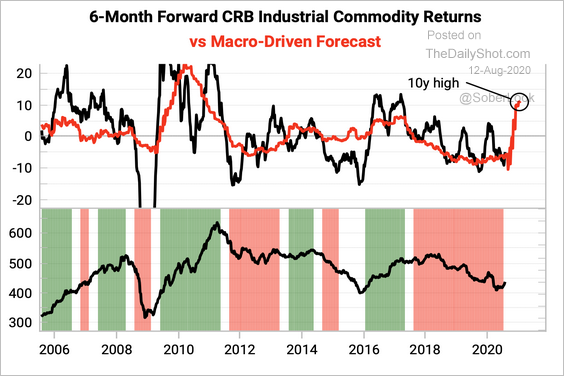
2. Variant Perception forecasts higher industrial commodity prices, mostly driven by the expansion of liquidity in China.
 Source: Variant Perception
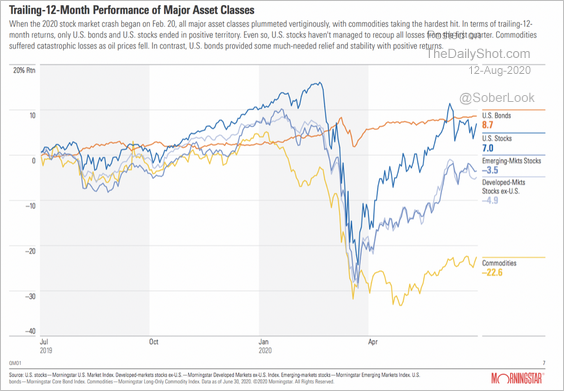
Commodities have been hit especially hard this year, and have lagged the risk-on rally since March.
 Source: Morningstar
——————–
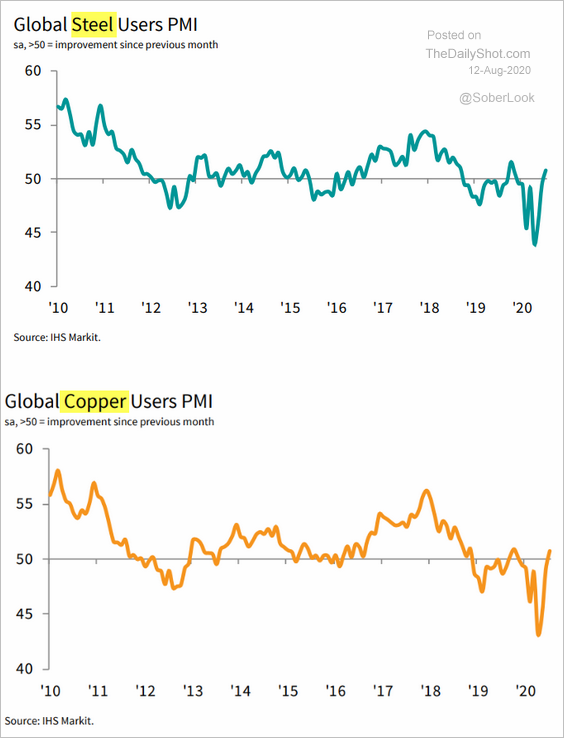
3. Purchasing activity in steel and copper is back in growth mode.
 Source: IHS Markit Read full article
Energy
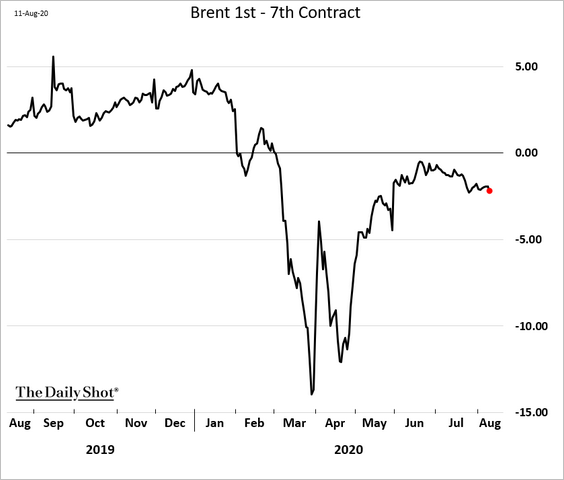
1. Brent crude is moving further into contango.
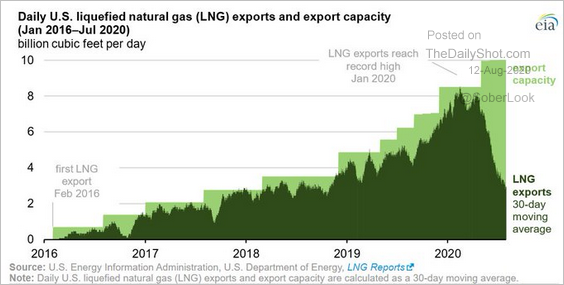
2. The decline in US LNG exports has been extraordinary.
 Source: @EIAgov Read full article
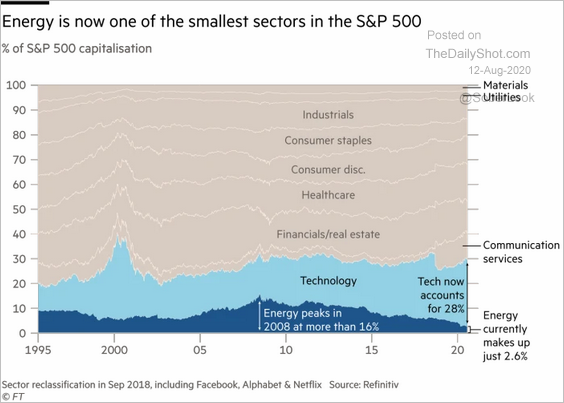
3. Energy is now one of the smallest sectors in the S&P 500.
 Source: @financialtimes Read full article
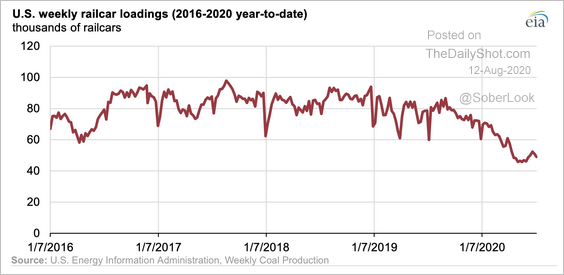
4. The decline in US weekly railcar loadings this year reflects less demand for coal internationally and less generation at domestic coal-fired plants, according to the EIA.
 Source: EIA Read full article
Equities
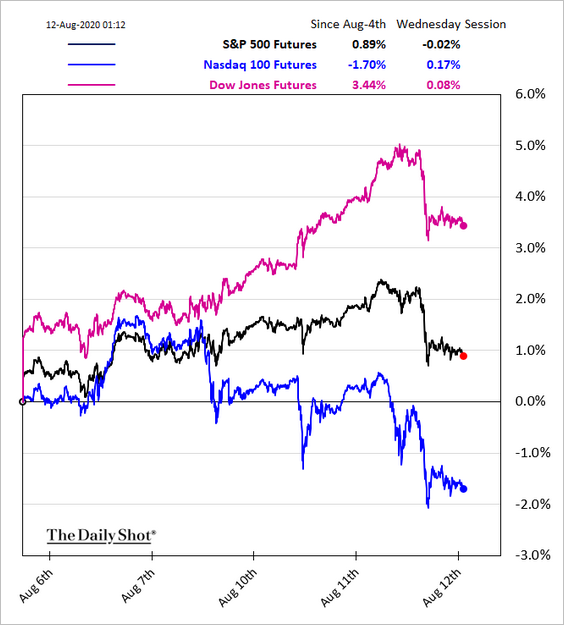
1. Stock investors were spooked by rising Treasury yields (see the rates section) and the pandemic aid impasse. Tech shares continue to underperform.
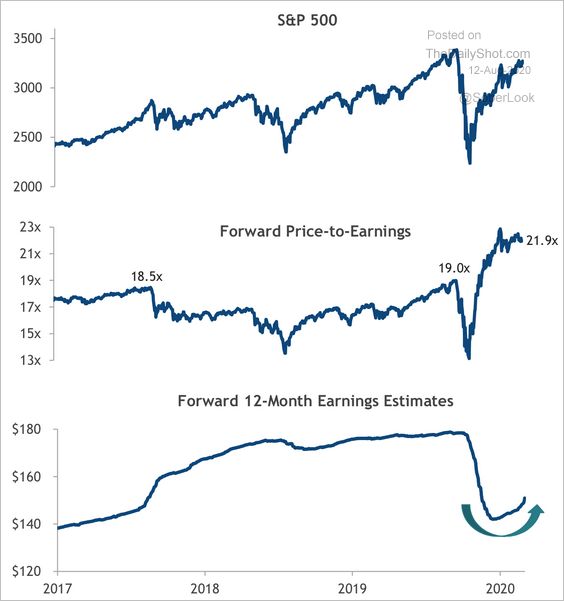
2. S&P 500 valuations are stretched, although earnings estimates are now rising.
 Source: SunTrust Private Wealth Management
3. How much of the pandemic losses have the various markets/indices now recovered?
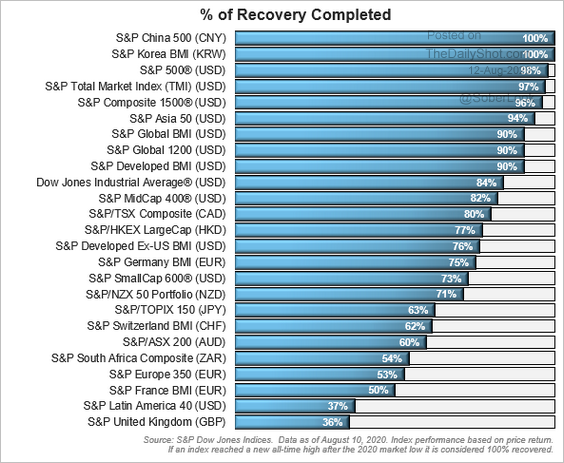 Source: S&P Global Market Intelligence
4. There are quite a few “zombie” companies in the US now.
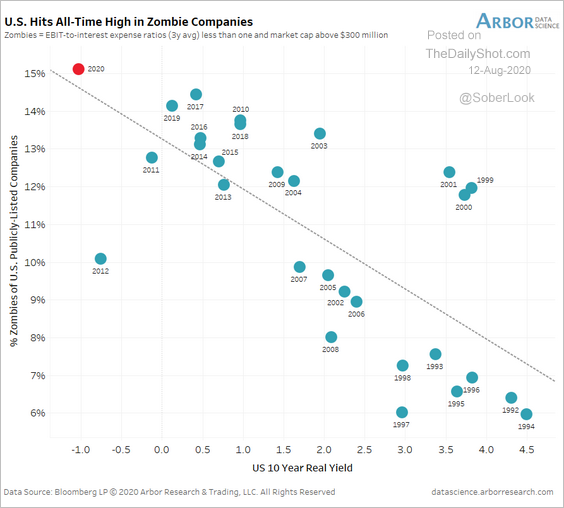 Source: Arbor Research & Trading
5. US equities tend to struggle three months prior to a presidential election.
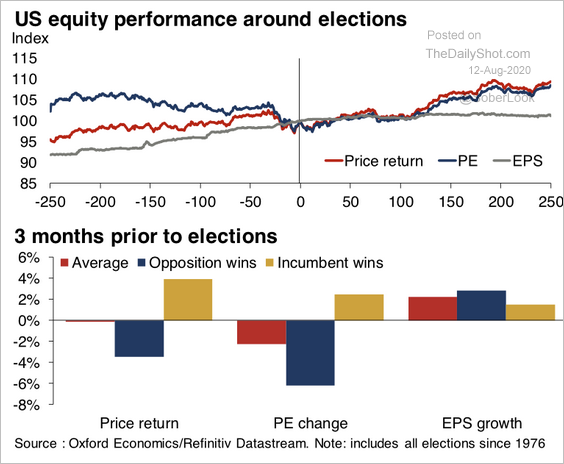 Source: Oxford Economics
6. This chart shows the long-term relative performance of the S&P 500 and Russell 2000.
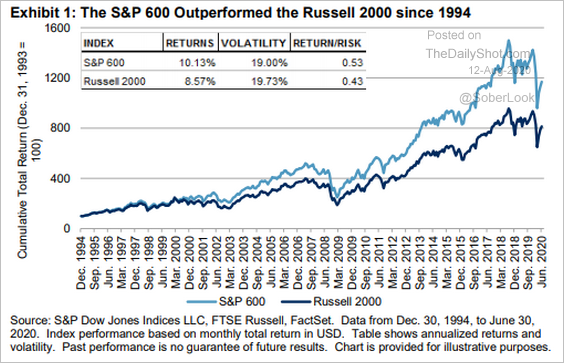 Source: S&P Global Market Intelligence
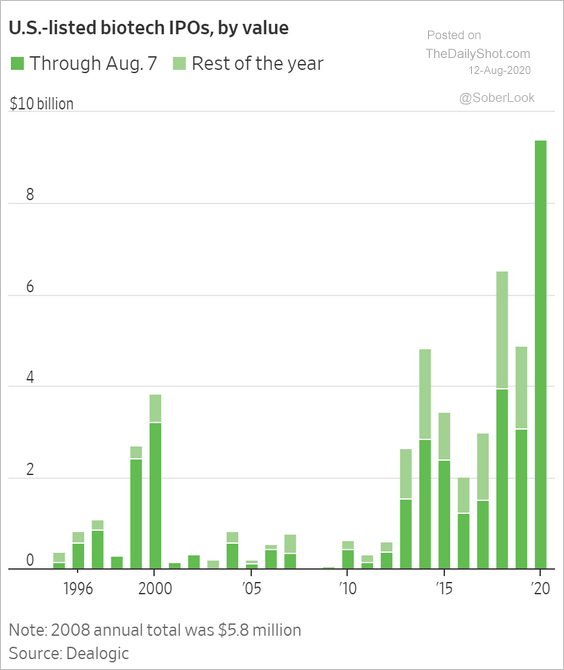
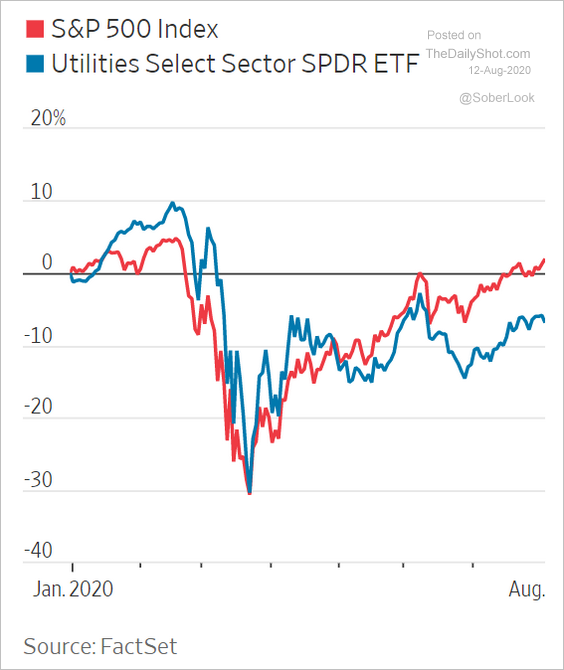
7. Finally, we have a couple of sector updates.
• Biotech IPOs:
 Source: @WSJ Read full article
• Utilities underperforming:
 Source: @WSJ Read full article
Credit
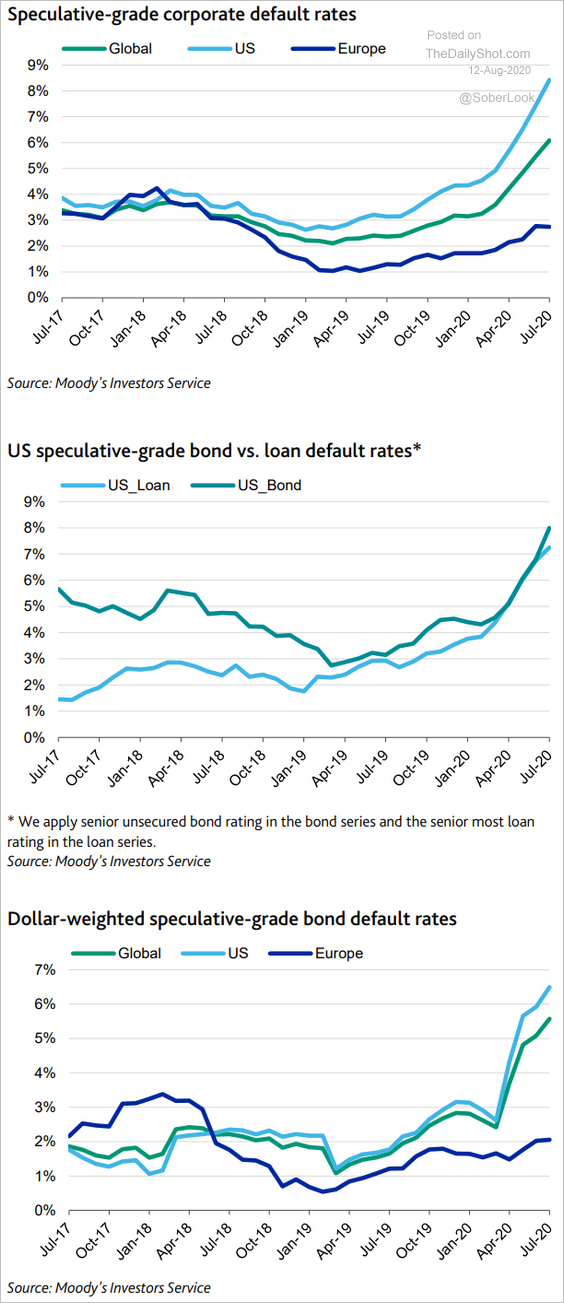
1. Speculative-grade default rates are grinfing higher.
 Source: Moody’s Investors Service
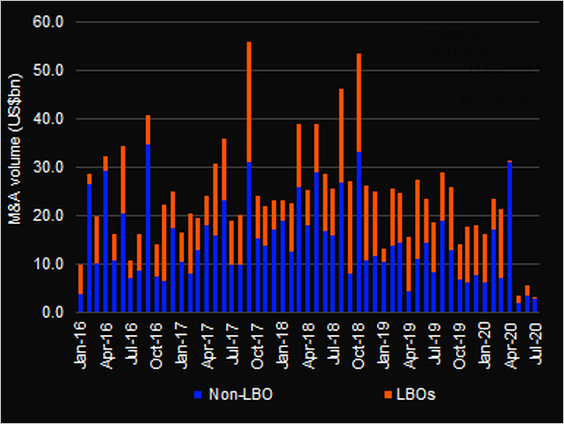
2. LBO activity has slowed.
 Source: @LPCLoans, @refinitiv
3. Here are two charts on business defaults/closures by sector.
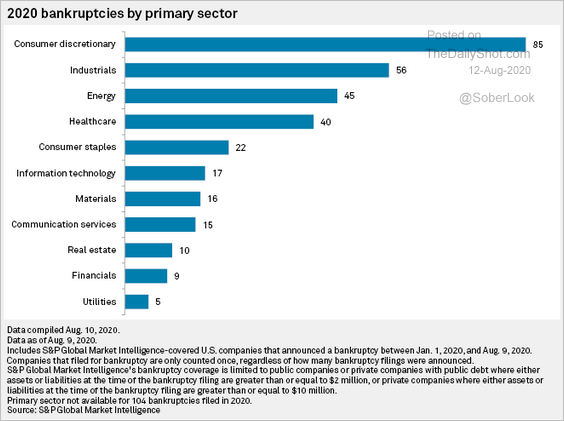 Source: S&P Global Market Intelligence
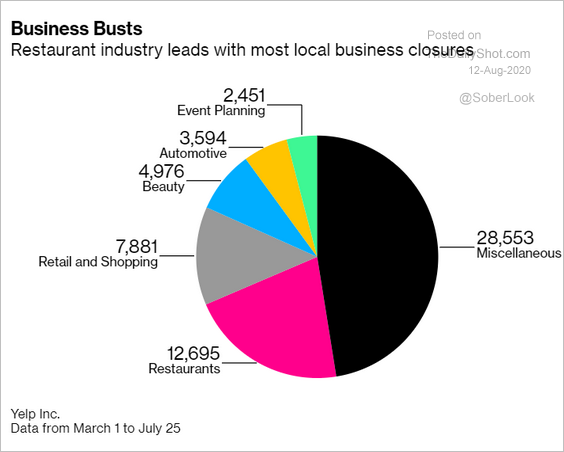 Source: @business Read full article
Rates
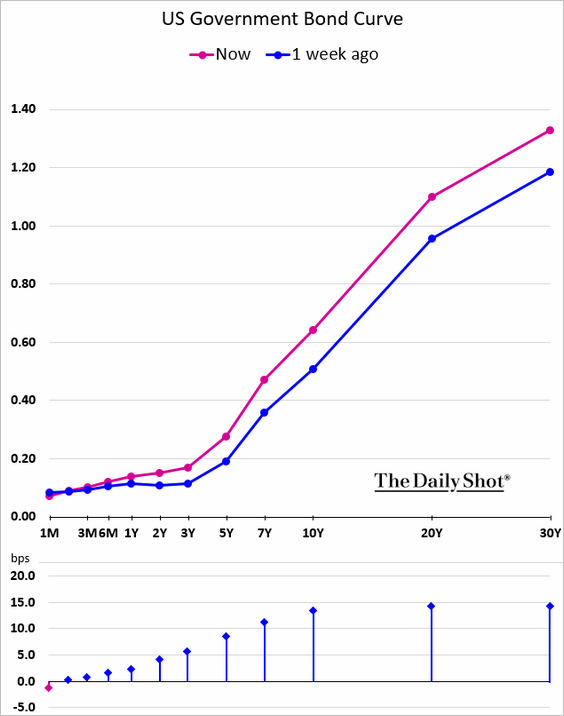
1. Treasury yields rose sharply on Tuesday, sending shockwaves through equity and precious metals markets.
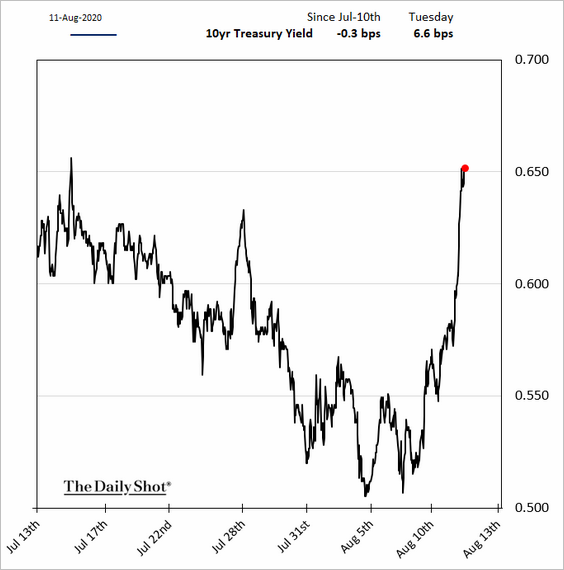
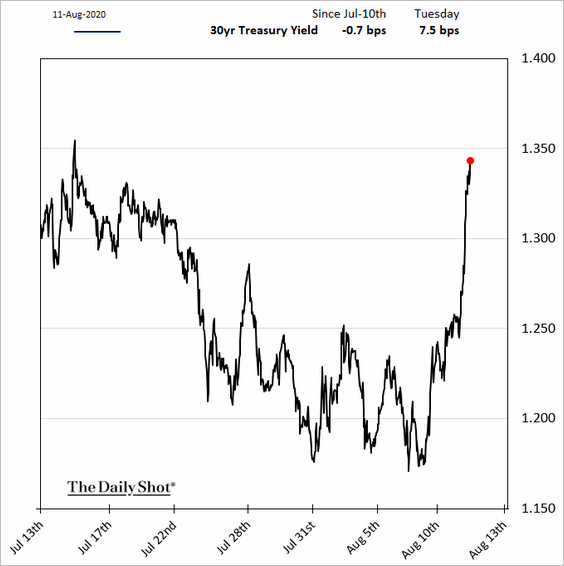
The curve steepened.
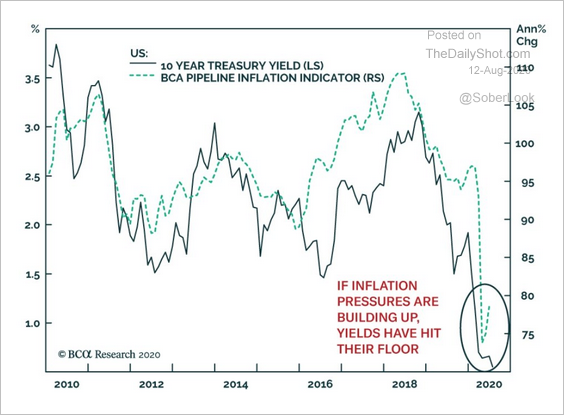
• Bond investors are nervous about inflation.
 Source: @Scutty, @bcaresearch
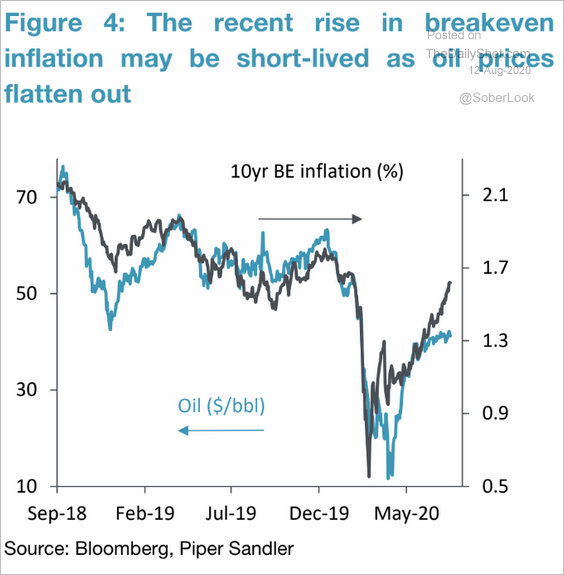
• However, given the sideways movements in crude oil, have inflation expectations overshot?
 Source: Piper Sandler
——————–
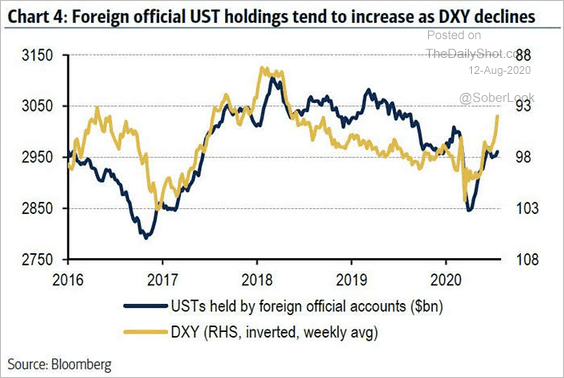
2. Foreigners tend to boost their Treasury holdings when the dollar weakens.
 Source: @ISABELNET_SA, @BofAML
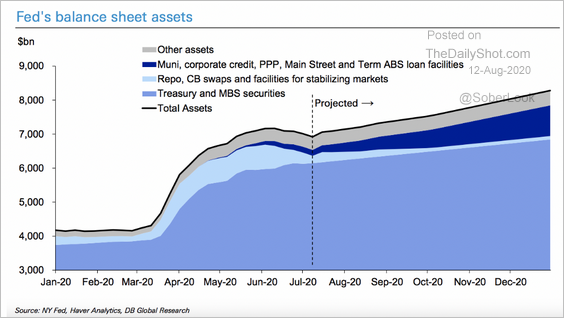
3. Here is Deutschebank’s forecast for the Fed’s balance sheet.
 Source: Deutsche Bank Research
Global Developments
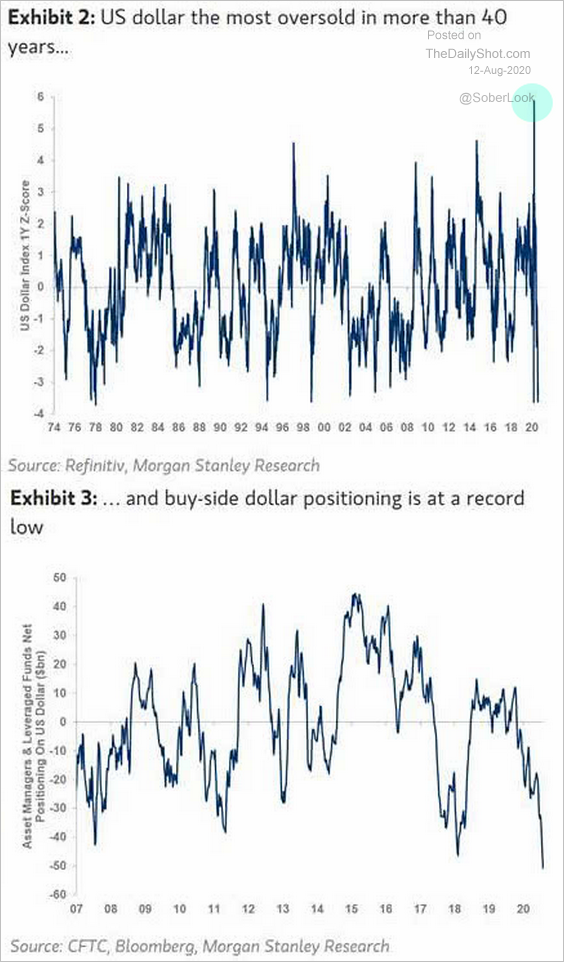
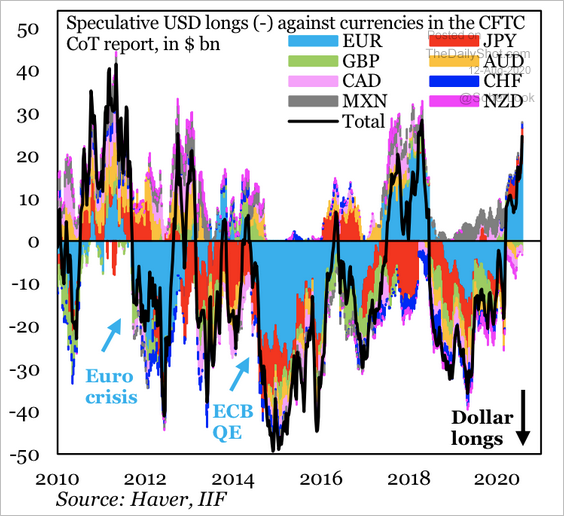
1. Betting against the US dollar has become a crowded trade.
 Source: Morgan Stanley Research, @BofAML
 Source: IIF
——————–
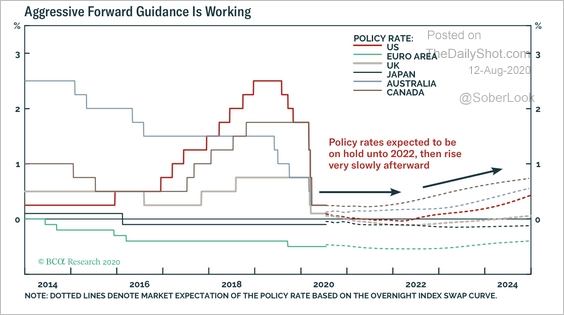
2. BCA Research expects policy rates to rise very slowly after 2022.
 Source: BCA Research
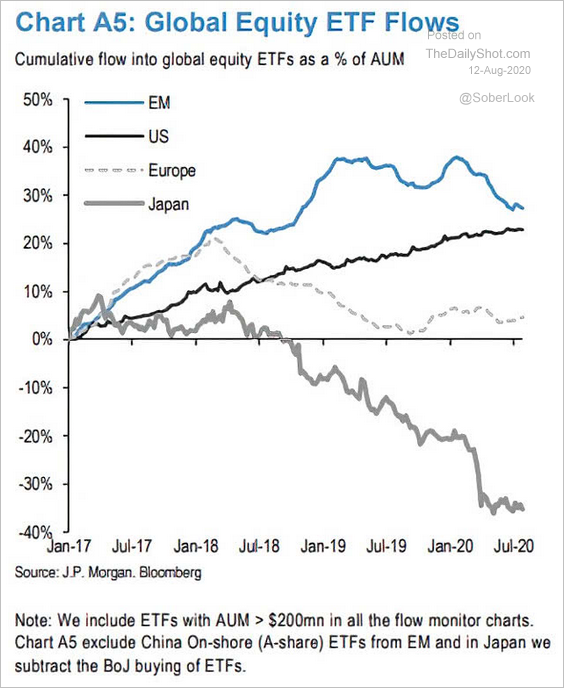
3. Finally, this chart shows global equity ETF flows.
 Source: @ISABELNET_SA, @jpmorgan
——————–
Food for Thought
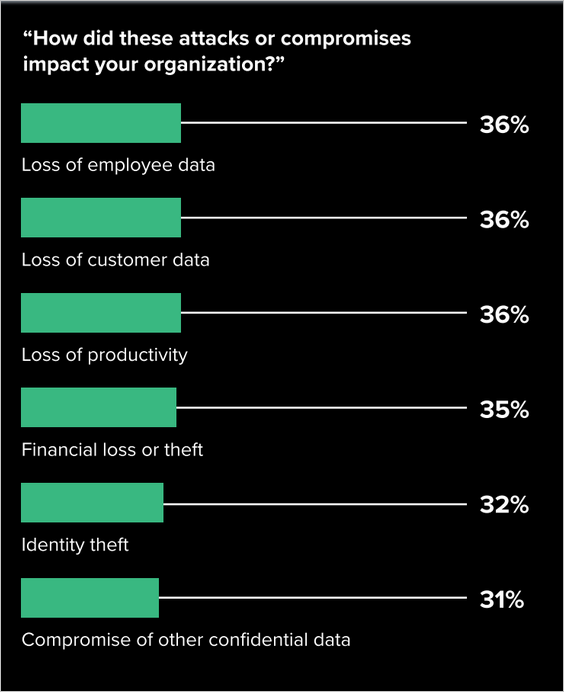
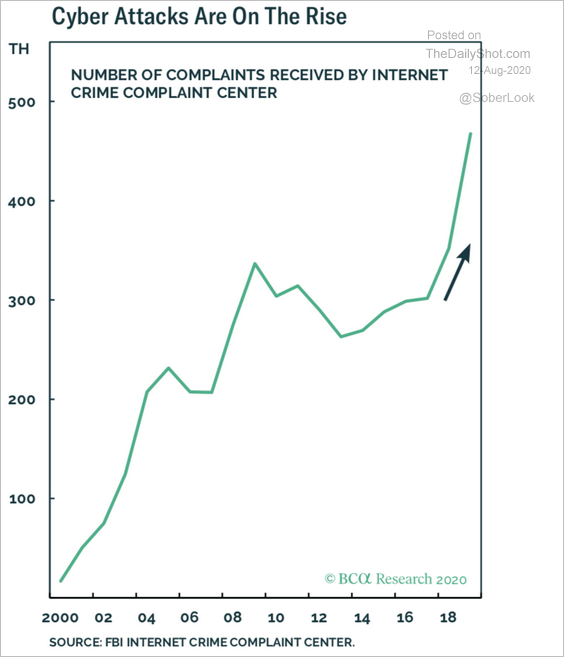
1. Cyberattacks during the pandemic (2 charts):
 Source: Forrester Consulting Read full article
 Source: Forrester Consulting Read full article
A longer-term trend:
 Source: BCA Research
——————–
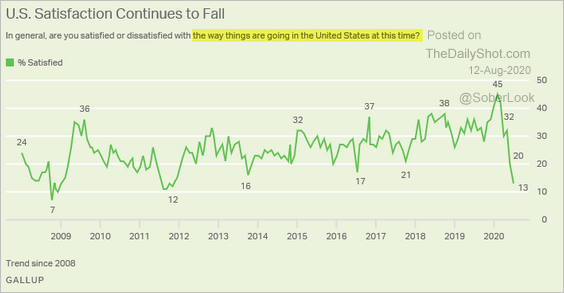
2. Satisfaction with the way things are going in the US:
 Source: Gallup
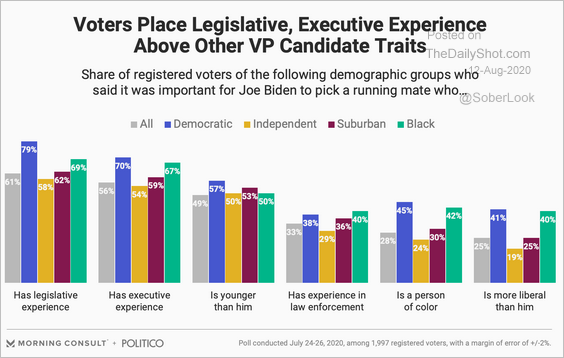
3. Voters’ views on VP candidate traits:
 Source: Morning Consult
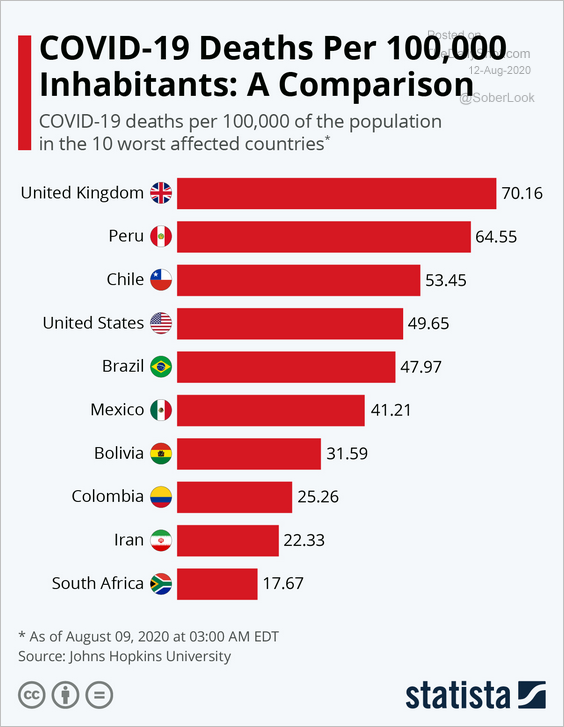
4. COVID deaths:
 Source: Statista
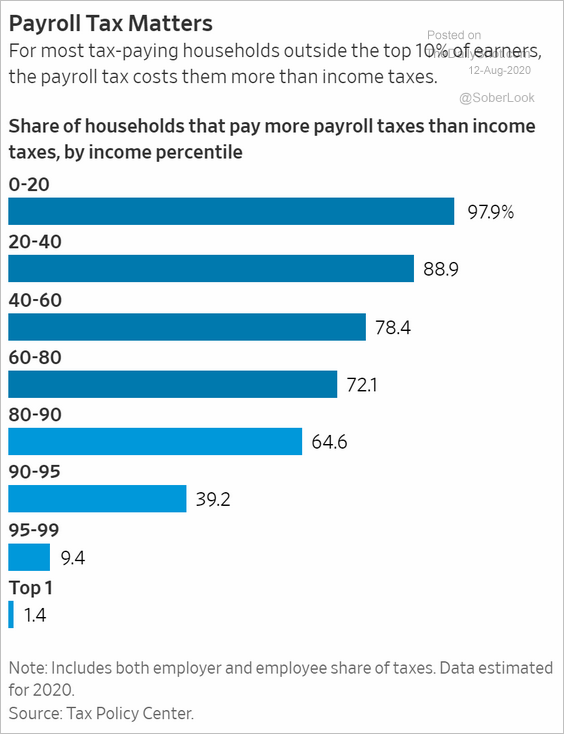
5. Payroll taxes vs. income taxes:
 Source: @WSJ Read full article
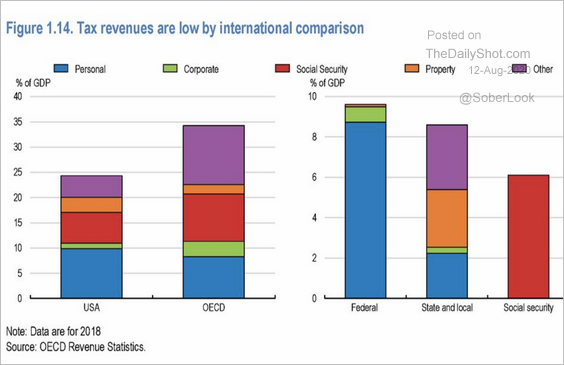
6. Tax revenues:
 Source: OECD Read full article
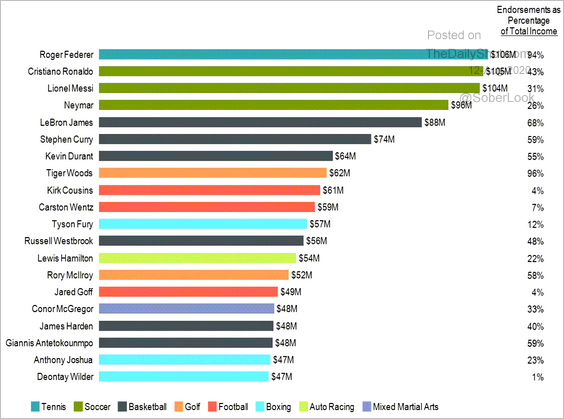
7. Highest-paid athletes:
 Source: Mekko Graphics
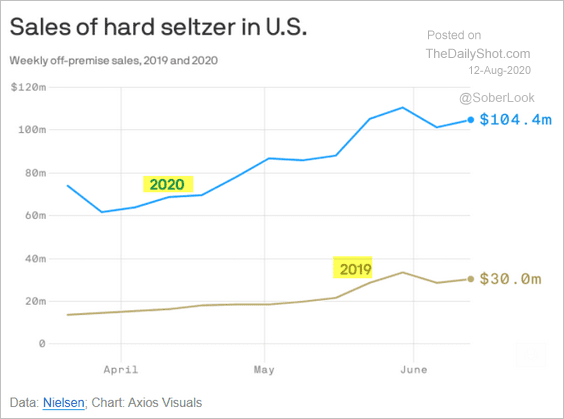
8. Sales of hard seltzer:
 Source: @axios Read full article
——————–
