The Daily Shot: 25-Aug-20
• Equities
• Commodities
• Rates
• Emerging Markets
• China
• Asia – Pacific
• Canada
• The United States
• Global Developments
• Food for Thought
Equities
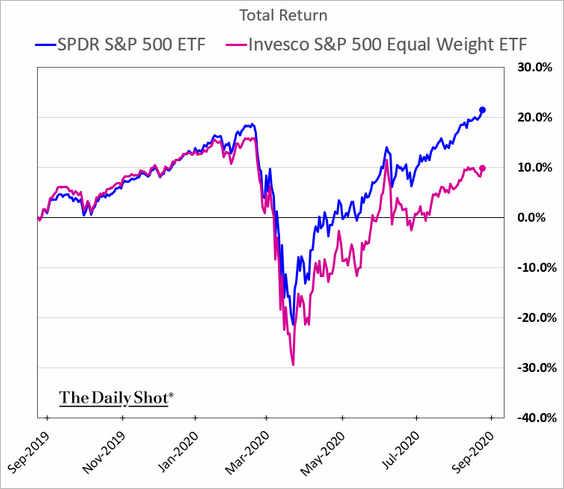
1. As the S&P 500 hits a new record, the equal-weight S&P 500 index continues to lag. Performance remains driven by the tech mega-caps.
Here is an illustration of this “split” performance.
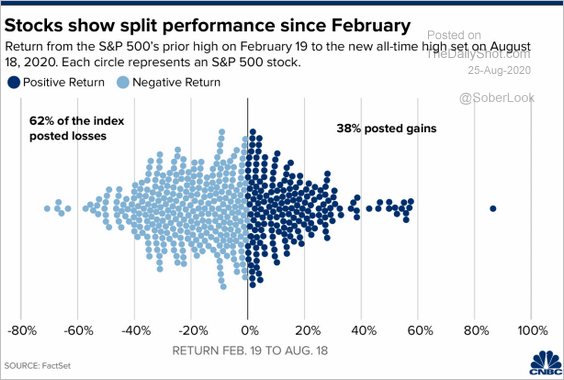 Source: CNBC Read full article
The S&P 500 correlation with the equal-weighted index has declined sharply.
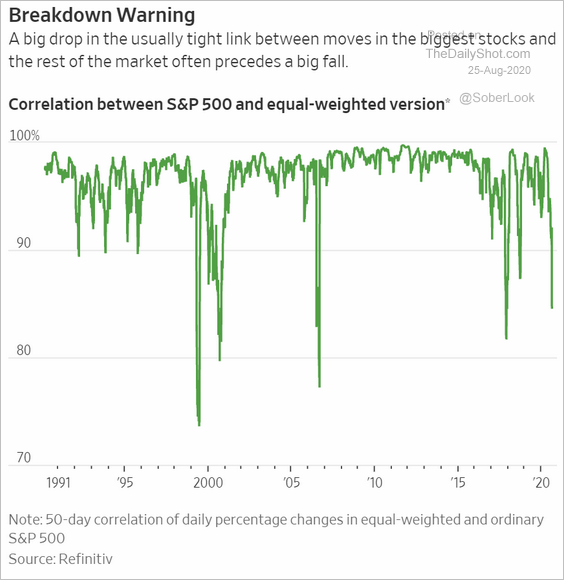 Source: @WSJ Read full article
——————–
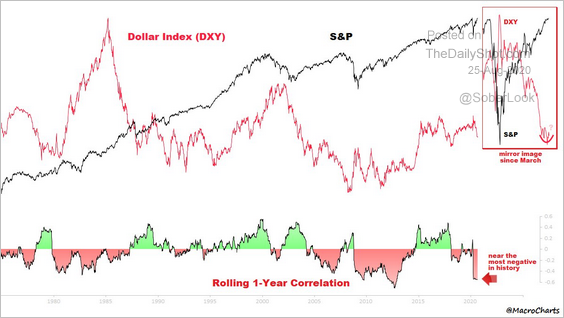
2. Here are a couple of other correlation charts.
• The correlation between the dollar and the S&P 500 is the most negative in years.
 Source: @MacroCharts
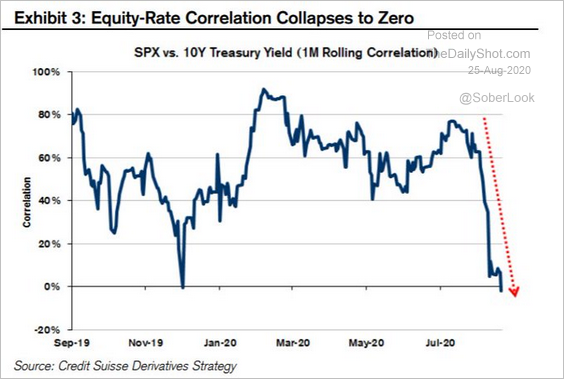
• The correlation with Treasury yields has collapsed.
 Source: Credit Suisse, @GunjanJS
——————–
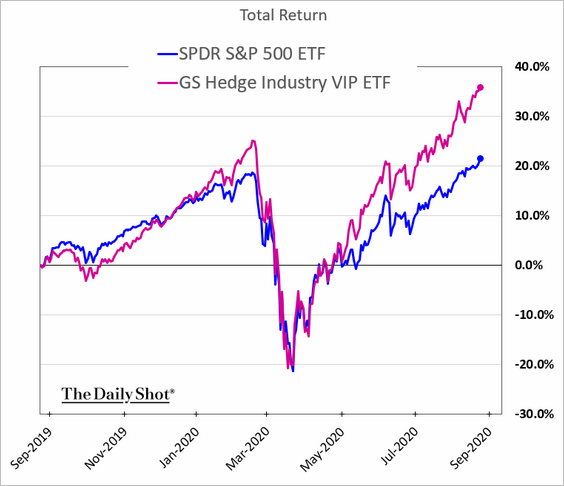
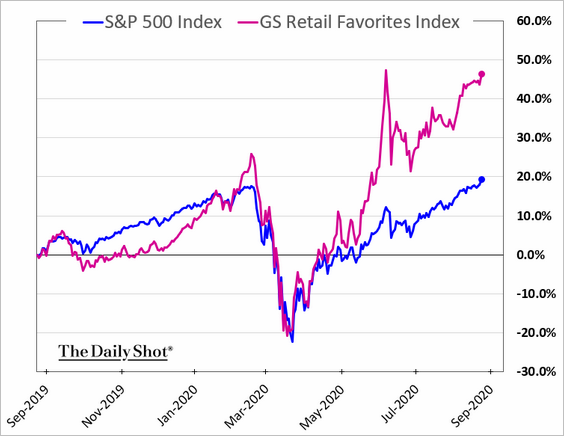
3. Hedge funds’ and retail investors’ picks keep outperforming the broader market.
• Hedge funds’ stock picks:
• Retail investors’ favorites:
——————–
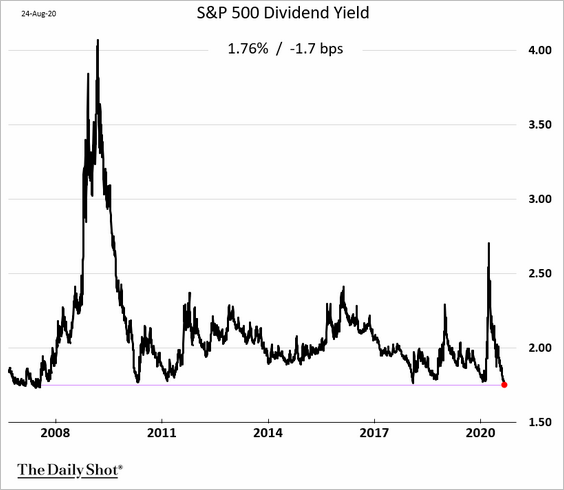
4. The S&P 500 dividend yield hit the lowest level since 2007.
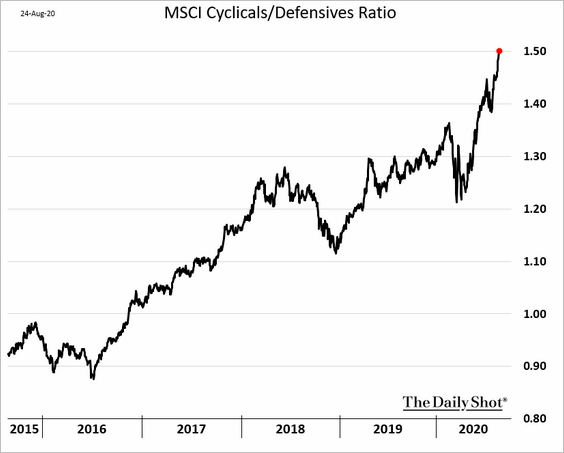
5. Cyclical shares are soaring relative to defensives.
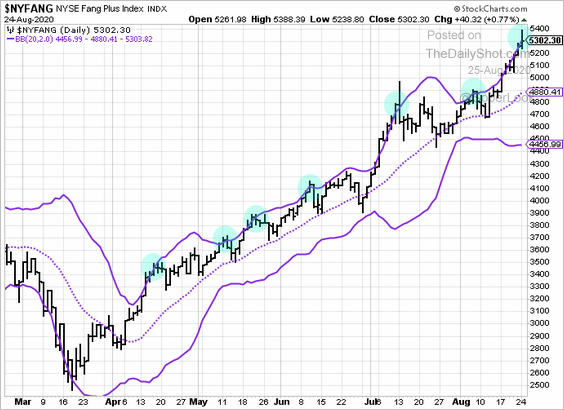
6. FANG+ stocks are above the upper Bollinger band, which often signals a pullback.
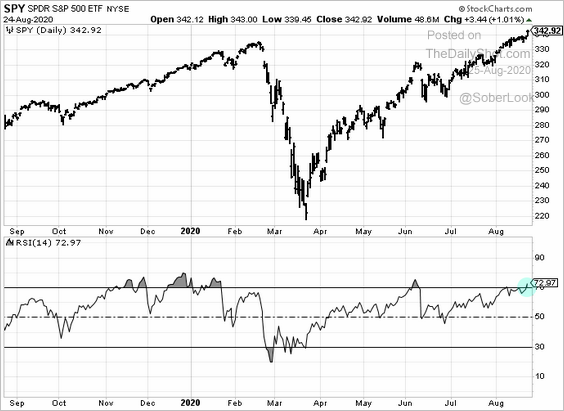
7. The RSI measure now has the S&P 500 in the overbought territory.
43% of S&P 500 stocks are overbought, according to MarketDesk Research.
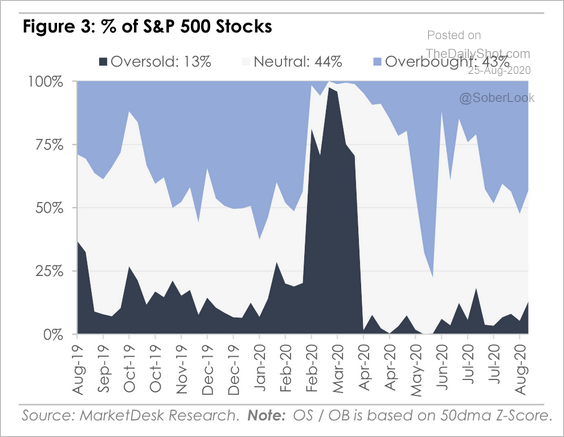 Source: MarketDesk Research
——————–
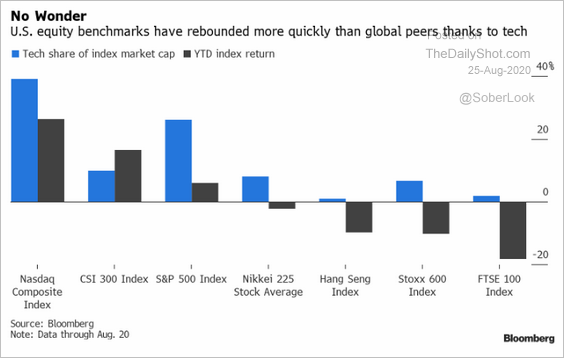
8. Being overweight in tech shares helped US indices outperform other markets this year.
 Source: Sophie Caronello, @TheTerminal, Bloomberg Finance L.P.
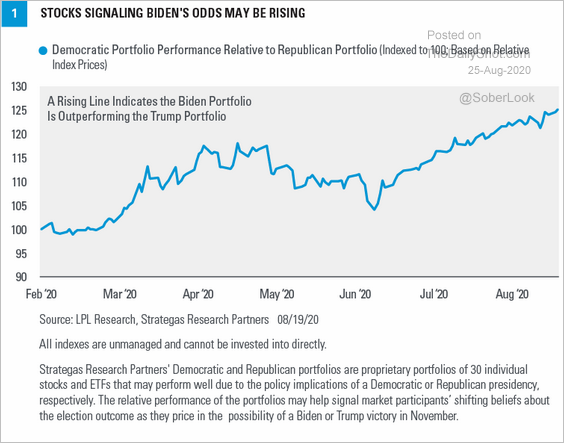
9. Here is the relative performance of “Democratic” vs. “Republican” portfolios (from LPL Research).
 Source: LPL Research
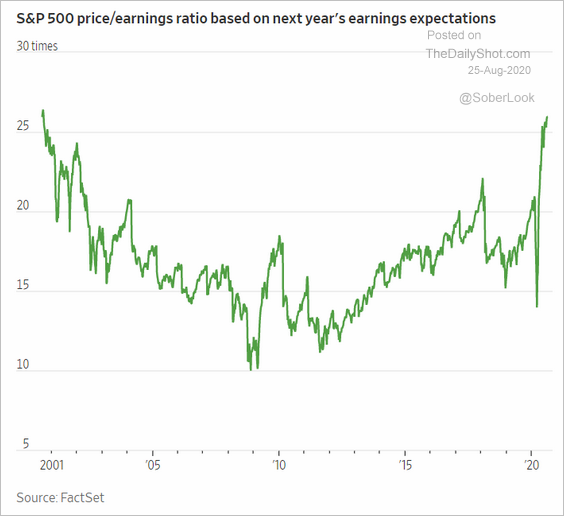
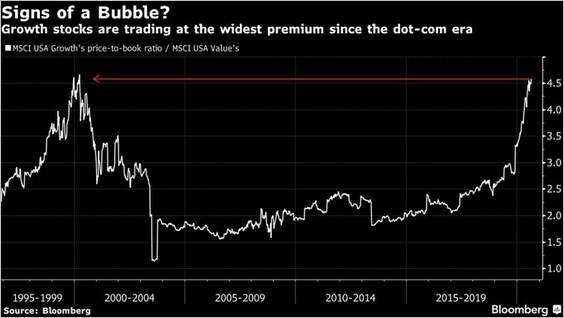
10. Next, we have a couple of valuation charts.
• Forward P/E ratio:
 Source: @WSJ Read full article
• Growth vs. value price-to-book ratios:
 Source: @jessefelder, @markets Read full article
——————–
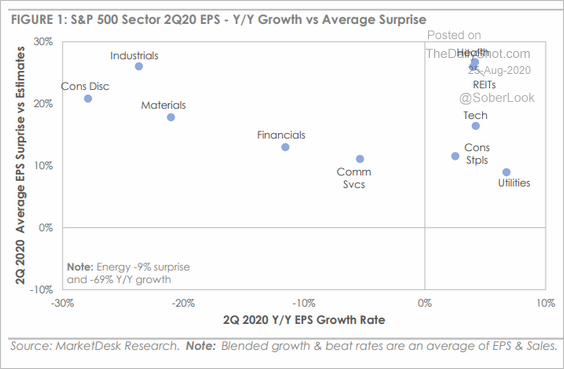
11. Finally, this scatterplot shows the average earnings surprise for Q2 vs. the year-over-year earnings growth rate (by sector).
 Source: MarketDesk Research
Commodities
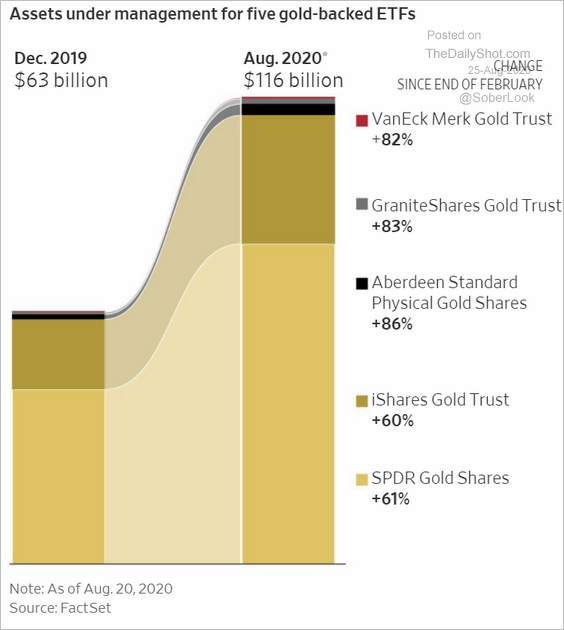
1. Here is the AUM for the largest gold ETFs.
 Source: @WSJ Read full article
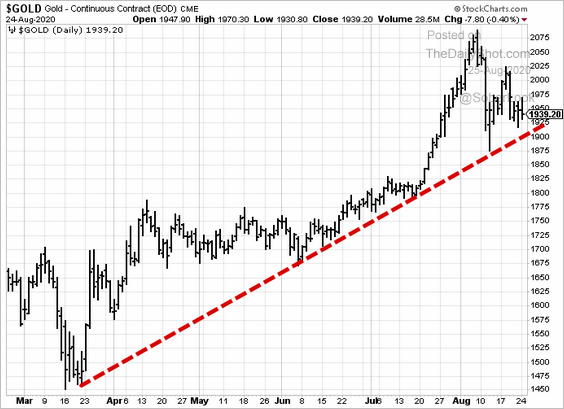
Will gold test the uptrend support again?
——————–
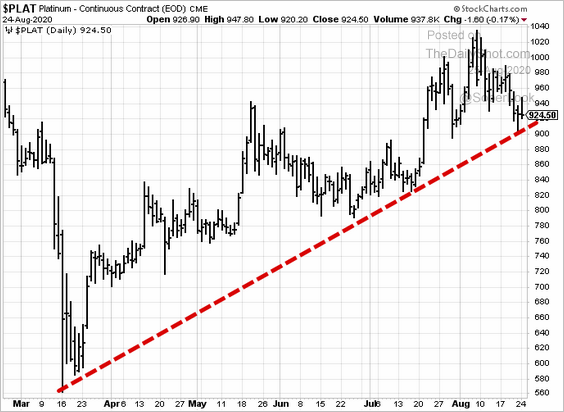
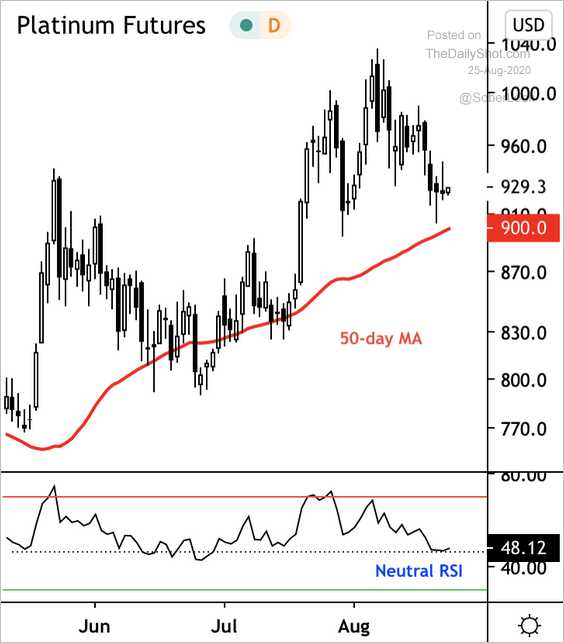
2. Platinum has been holding support (2 charts).
 Source: @DantesOutlook
——————–
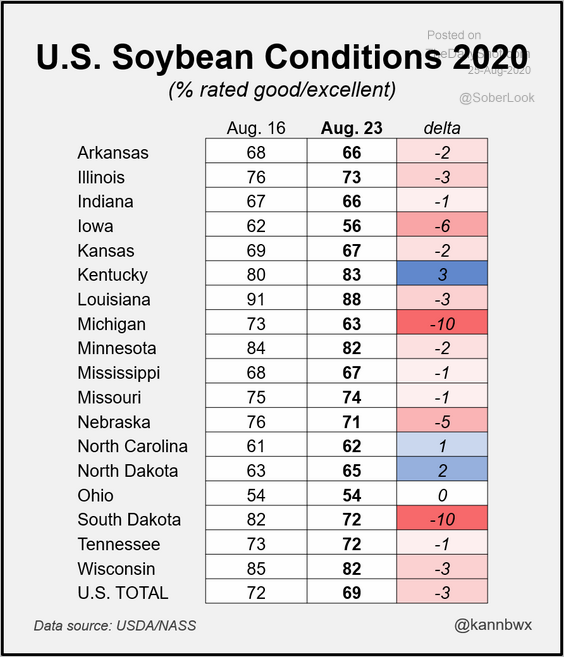
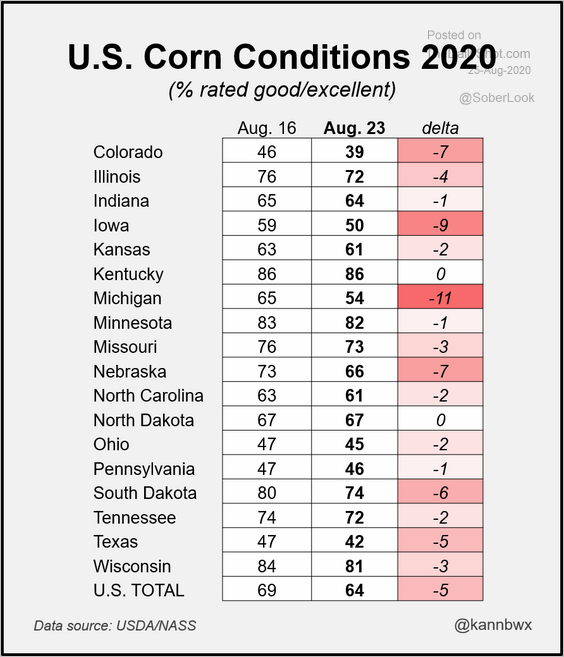
3. Dry weather in the US Midwest has caused soybean and corn growing conditions to worsen over the past week.
 Source: @kannbwx
 Source: @kannbwx
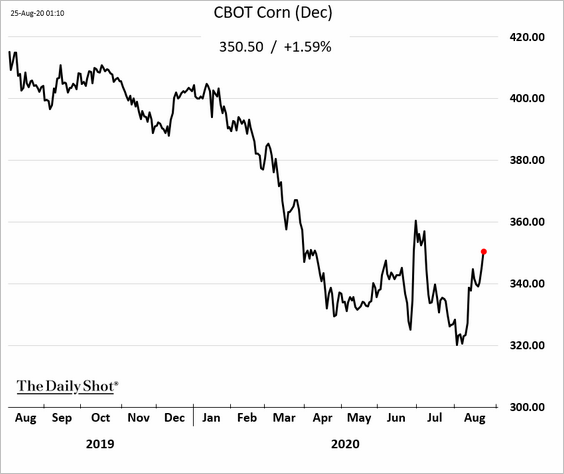
• Corn futures are rebounding.
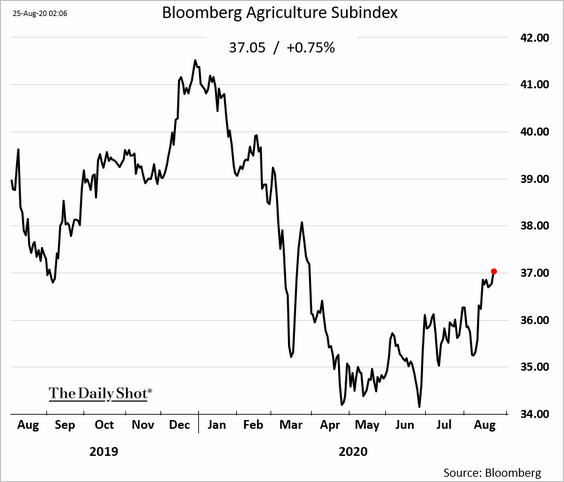
• Here is Bloomberg’s agricultural commodities index.
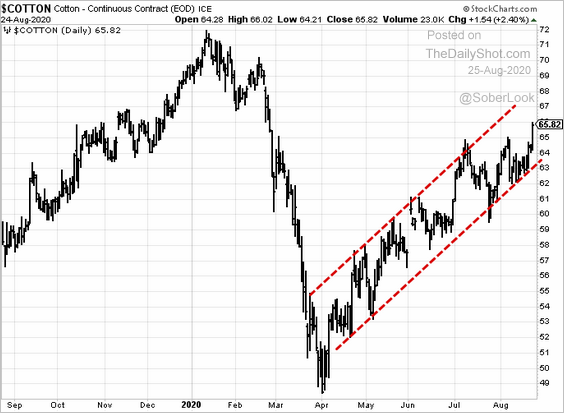
• Separately, US cotton futures continue to trend higher.
——————–
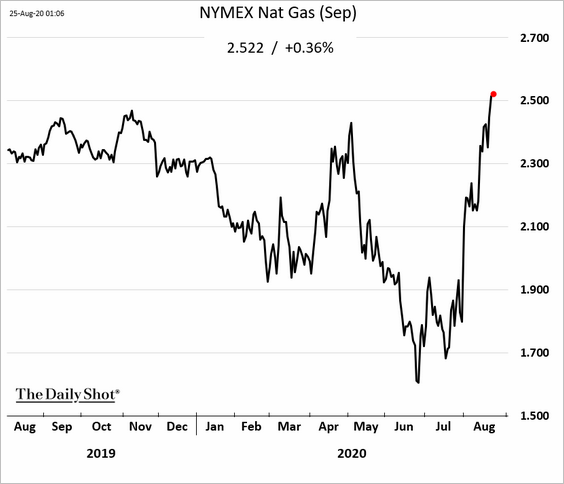
4. US natural gas futures keep climbing.
Rates
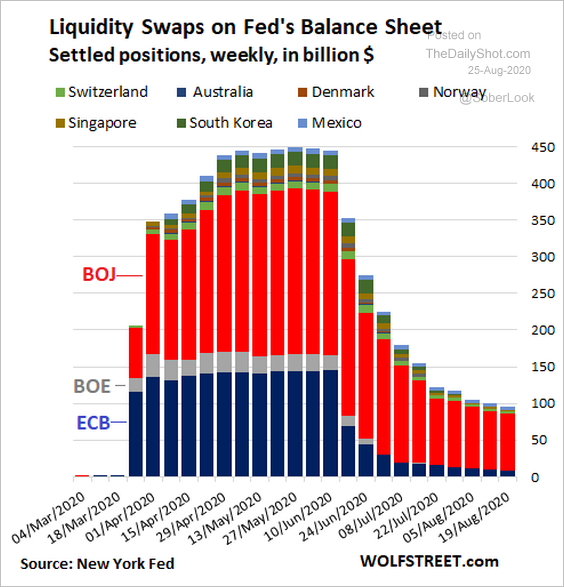
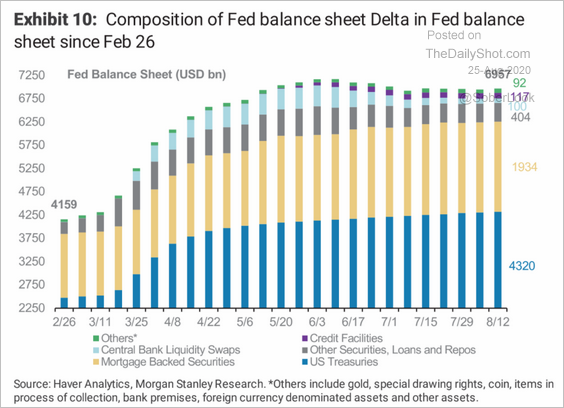
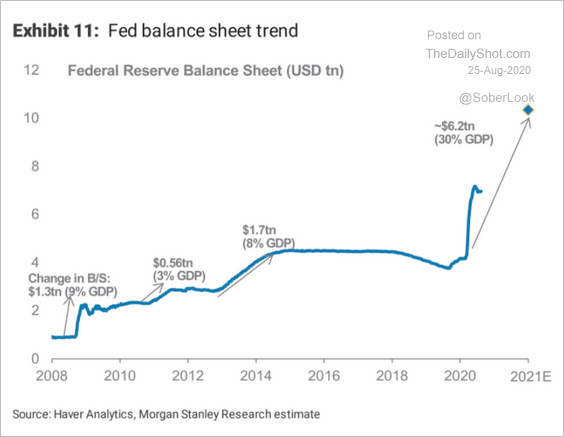
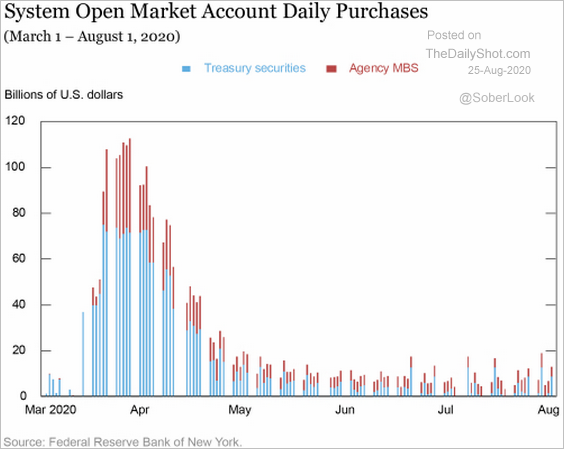
1. Let’s take a look at the Fed’s balance sheet trends.
• We had an increase in the balance sheet last week, …
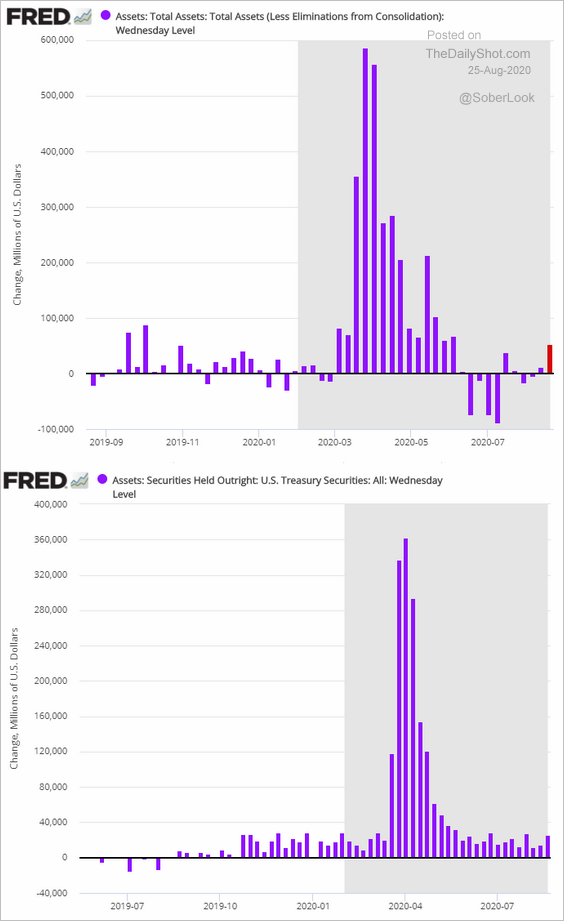
… now that the impact of liquidity swaps has moderated.
 Source: @wolfofwolfst Read full article
• The balance sheet composition:
 Source: Morgan Stanley Research
• Morgan Stanley’s forecast:
 Source: Morgan Stanley Research
• Securities purchases over time:
 Source: Liberty Street Economics Read full article
• Will slower growth in the Fed’s balance sheet boost the dollar?
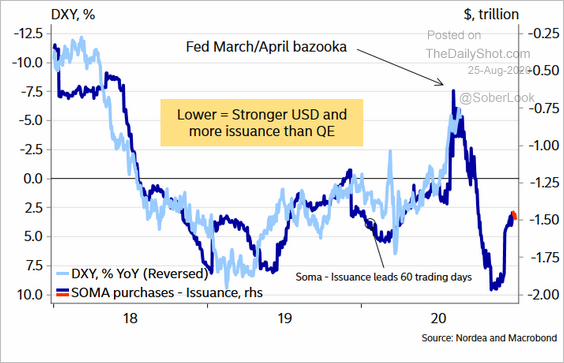 Source: @AndreasSteno Read full article
• Reserve balances increased (chart below), helped by the reduction in the Treasury’s account at the Fed (2nd chart).
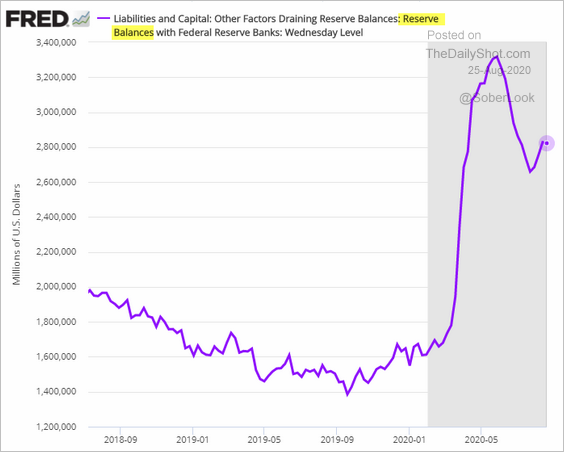
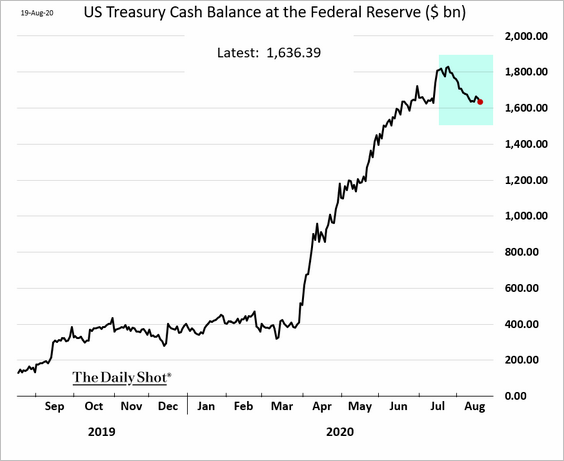
——————–
2. Next, we have some liquidity trends in the US.
• Rates on money market funds:
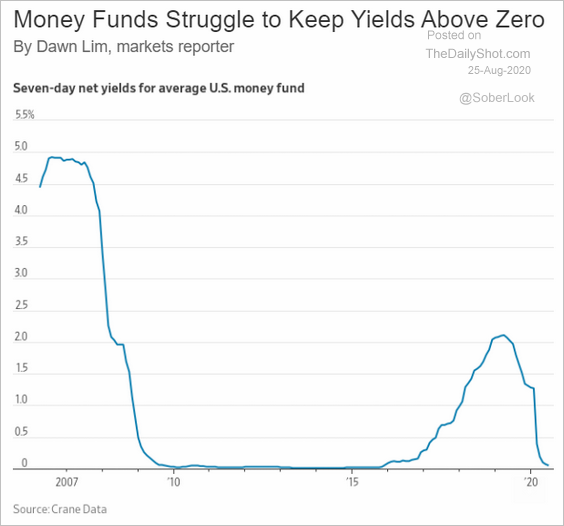 Source: @WSJ Read full article
• Money market funds’ AUM:
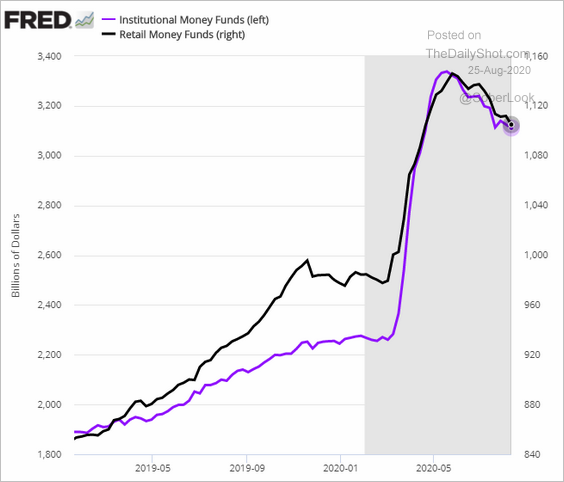
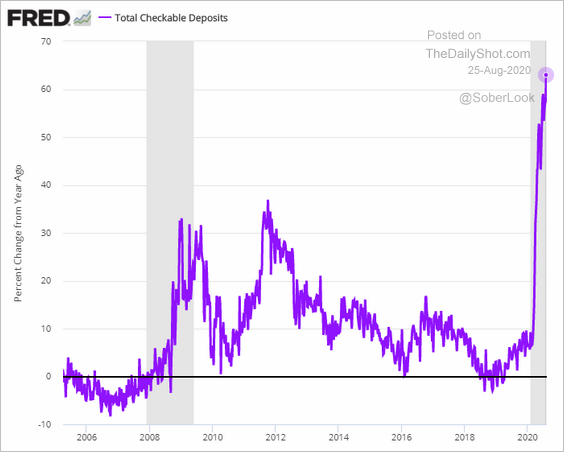
• US checkable deposits (up over 60% from a year ago):
——————–
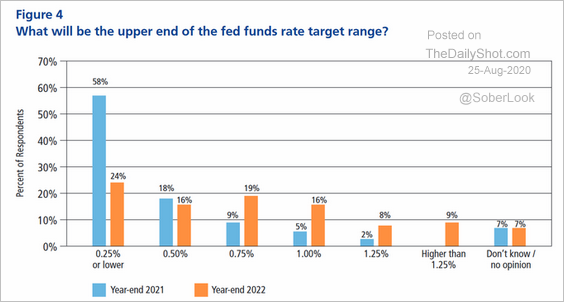
3. Will the Fed hike rates next year? How about in 2022?
 Source: @GregDaco
Emerging Markets
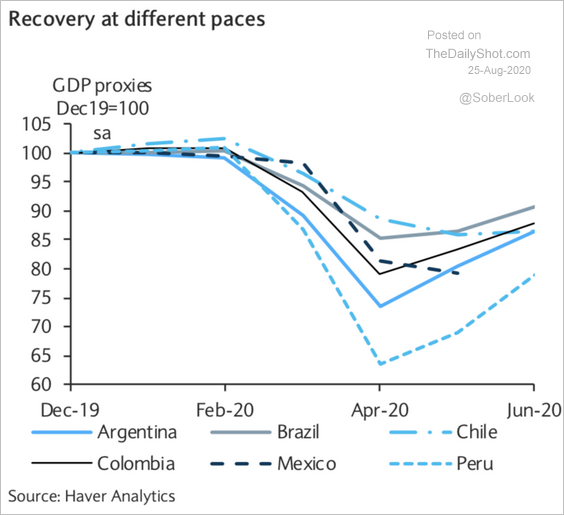
1. LatAm economic recovery has been uneven.
 Source: Barclays Research
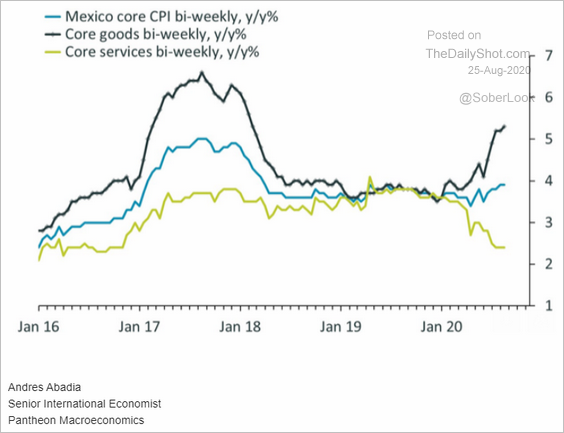
2. Mexico’s core CPI surprised to the upside, driven by core goods.
 Source: Pantheon Macroeconomics
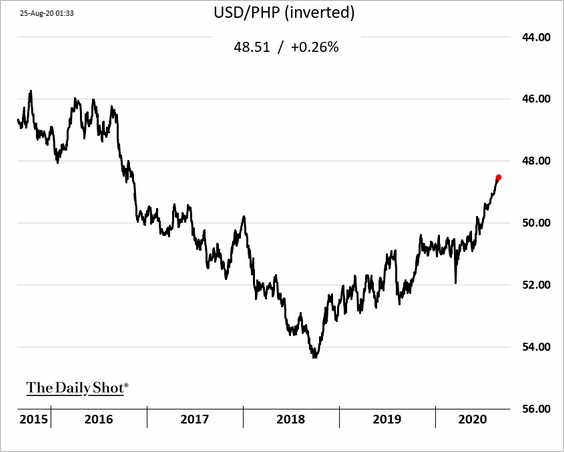
3. The Philippine peso is recovering after years of declines.
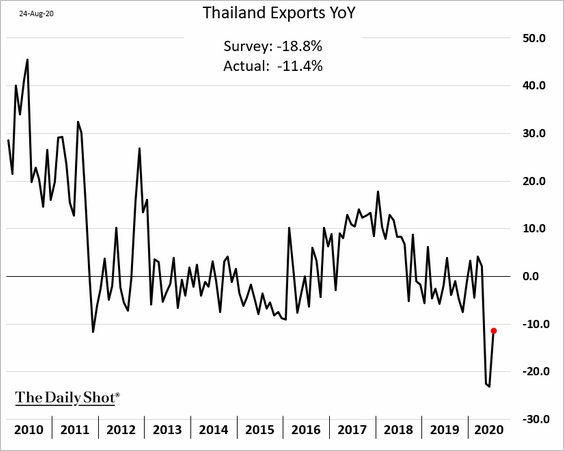
4. Thai exports were stronger than expected last month.
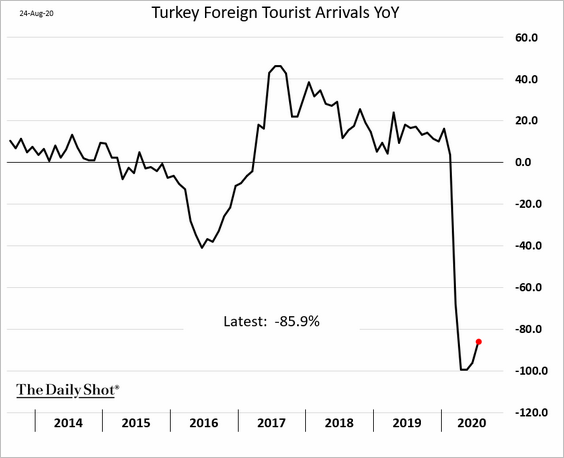
5. Turkey’s tourism business remains dead.
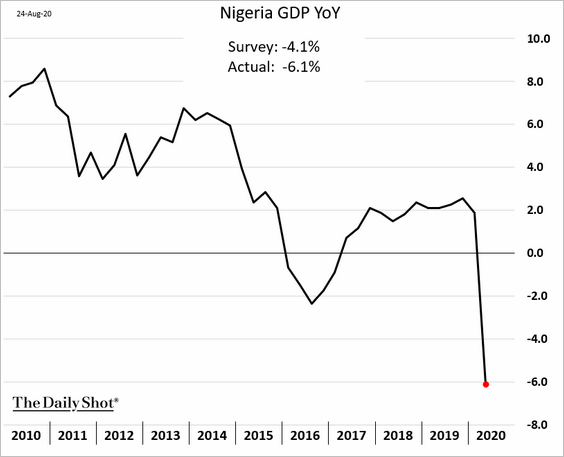
6. Nigeria’s GDP tumbled more than expected in Q2.
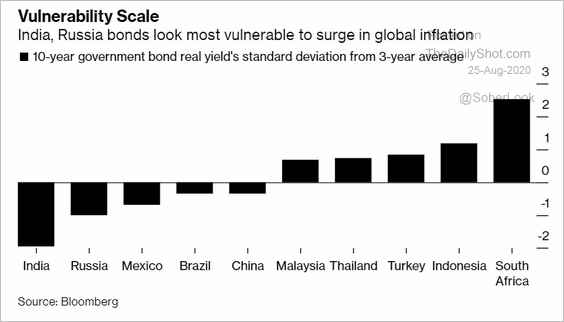
7. Which bonds are most vulnerable to global inflation?
 Source: @markets Read full article
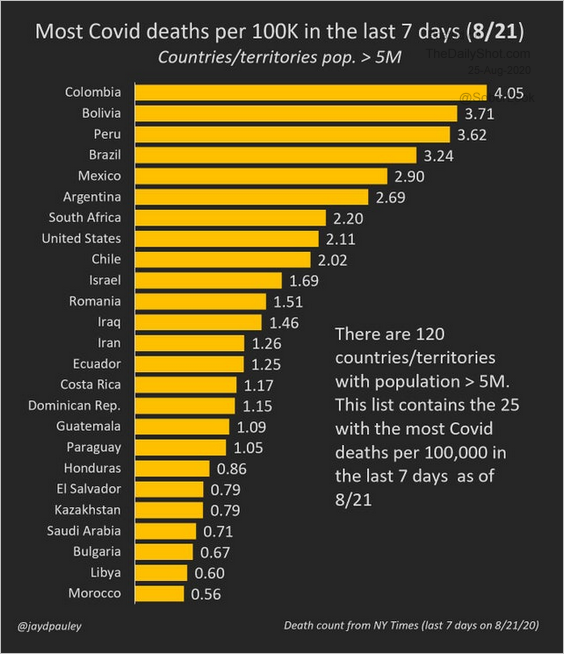
8. Which countries have the highest COVID-related death rates?
 Source: @jaydpauley
China
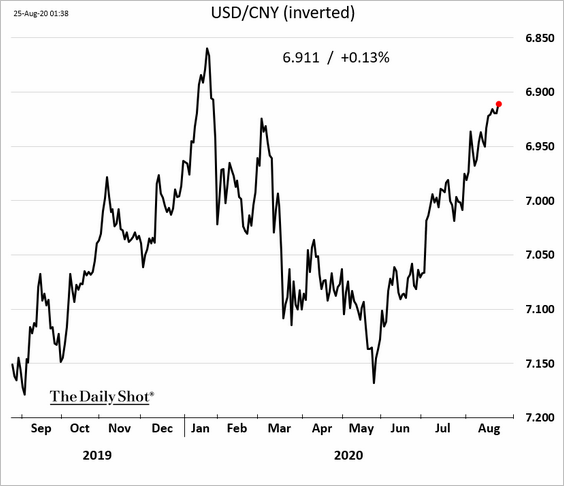
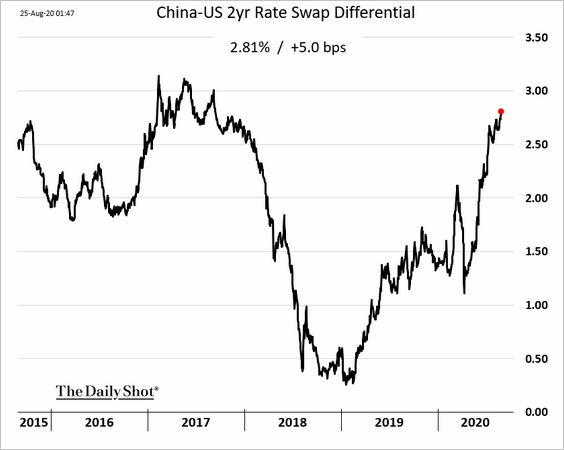
1. The renminbi continues to climb against the dollar, helped by widening rate differentials with the US (second chart).
 Source: @TheTerminal, Bloomberg Finance L.P.
——————–
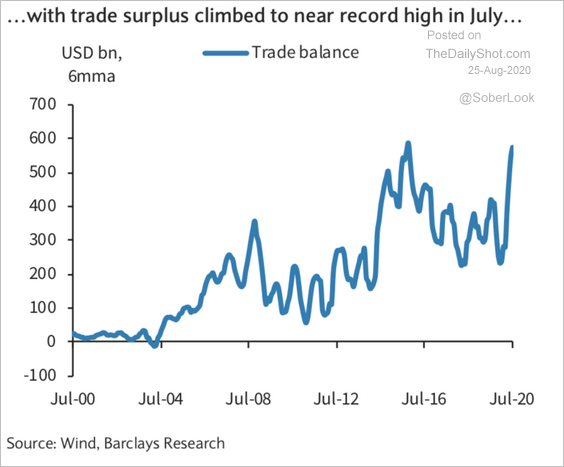
2. China’s trade surplus is near record levels.
 Source: Barclays Research
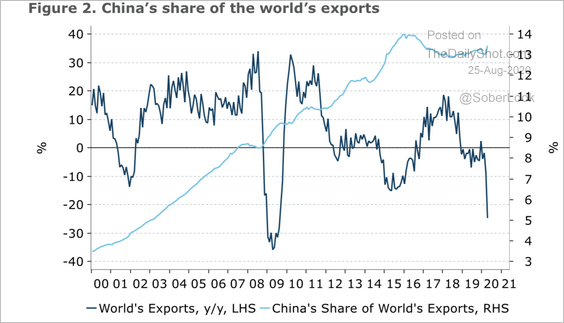
China’s share of the world’s exports held up this year.
 Source: ANZ Research
——————–
3. Next, we have a couple of updates on Hong Kong.
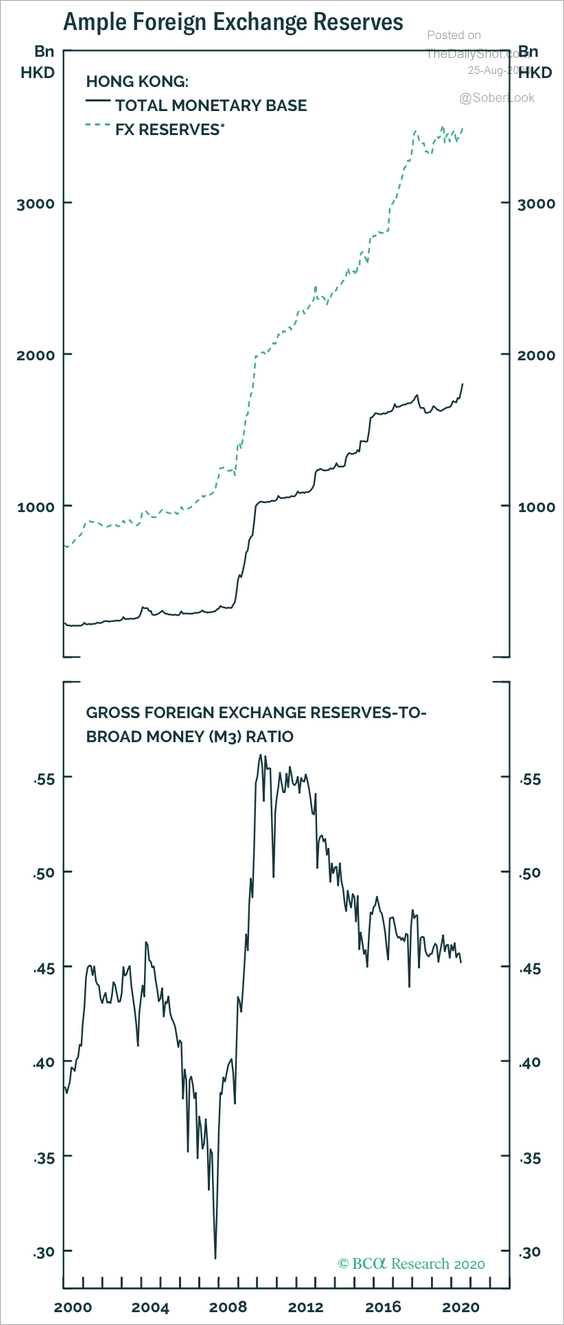
• The Hong Kong dollar peg remains credible since the entire monetary base is backed by rising FX reserves, according to BCA Research.
 Source: BCA Research
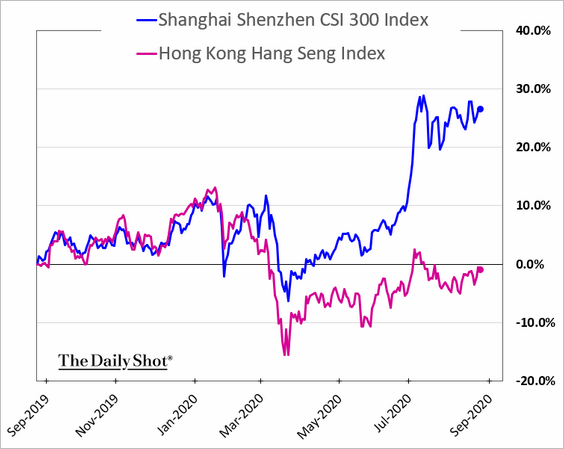
• Hong Kong’s shares have underperformed mainland stocks by over 25% this year.
Asia – Pacific
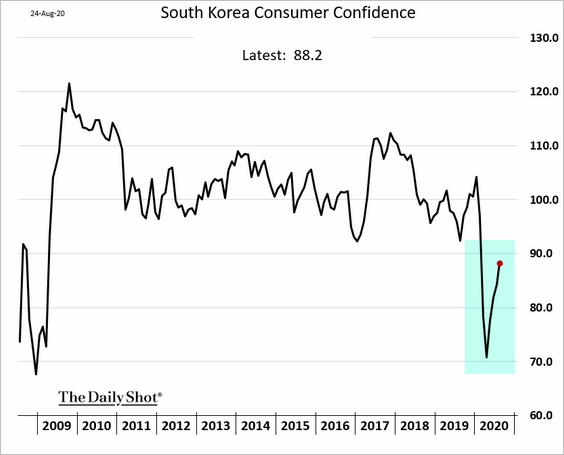
1. South Korea’s consumer confidence is recovering but remains well below pre-crisis levels.
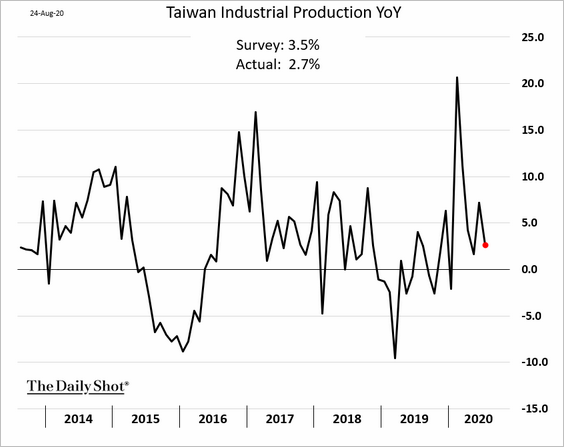
2. Taiwan’s industrial production has been robust.
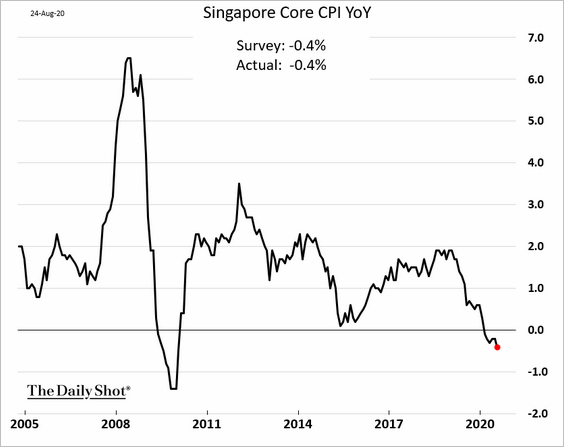
3. Singapore’s economy is still in deflation.
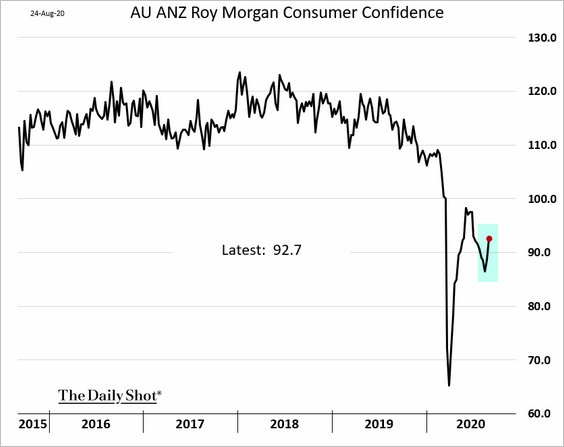
4. Australia’s consumer confidence is rebounding.
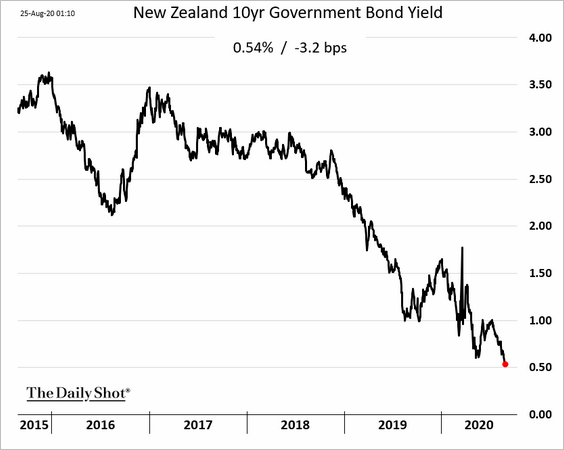
5. New Zealand’s bond yields are hitting record lows.
Canada
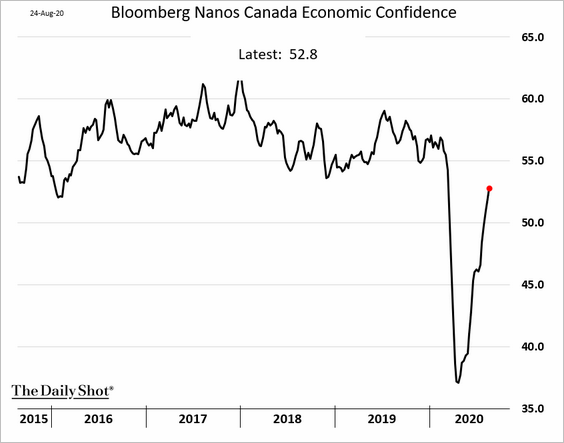
1. Consumer confidence is nearing pre-crisis levels.
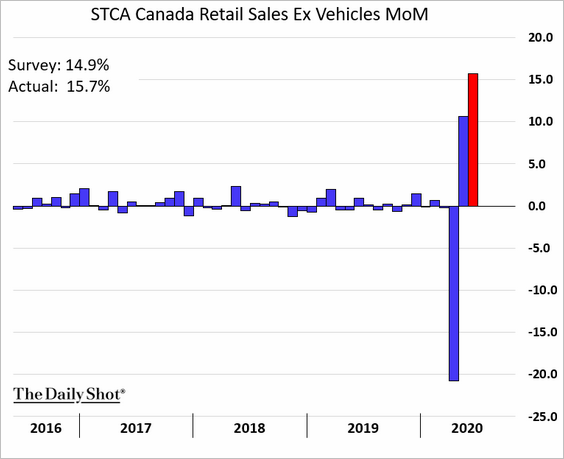
2. Retail sales rose sharply in June.
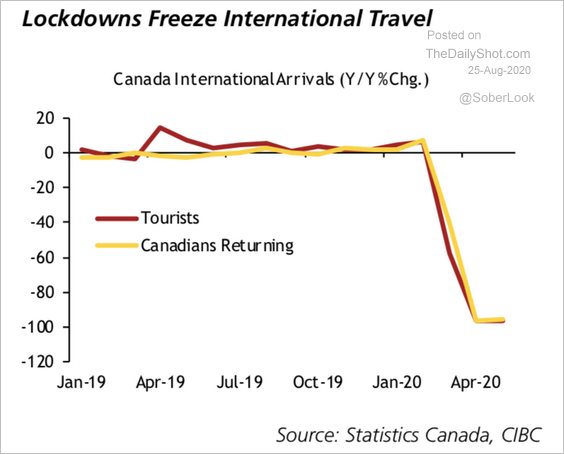
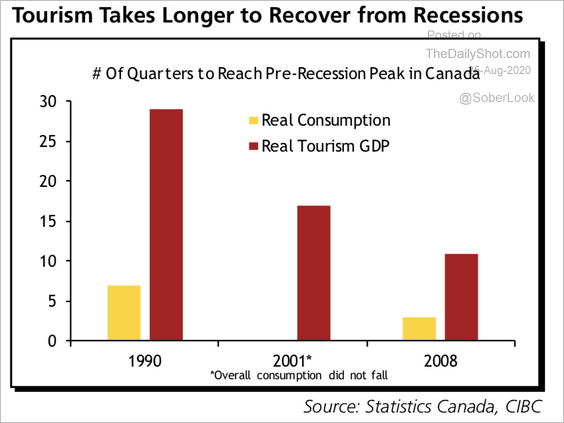
3. Next, we have some updates on Canada’s tourism (from CIBC).
• International travel:
 Source: CIBC Capital Markets
• Caution about visitors:
 Source: CIBC Capital Markets
• Historically slow recovery in tourism (vs. consumer spending):
 Source: CIBC Capital Markets
The United States
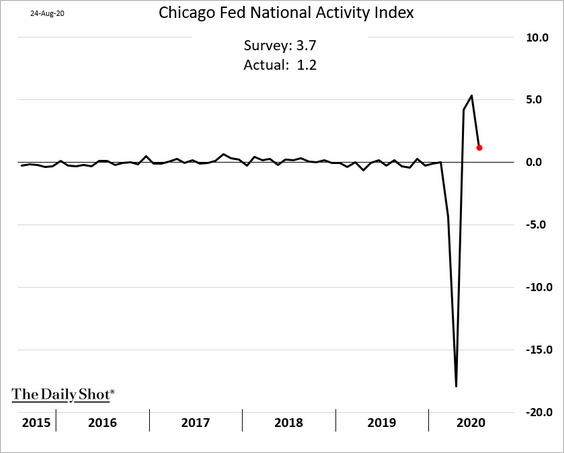
1. The Chicago Fed’s national activity index pulled back last month.
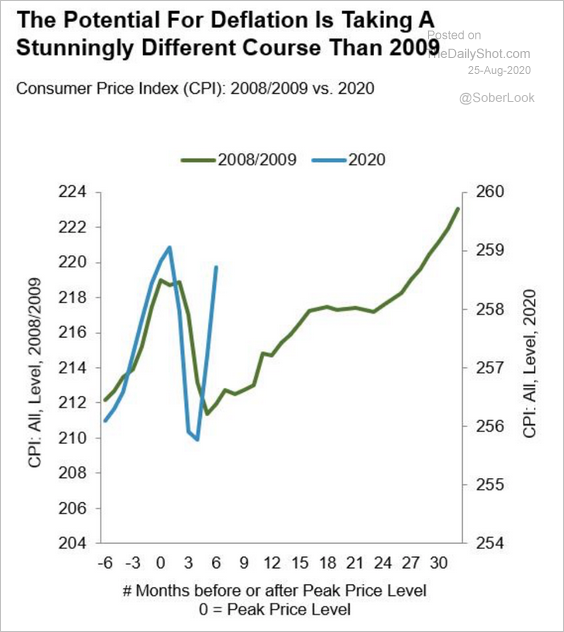
2. Here are some updates on inflation.
• The CPI rebounded quickly compared to the 2008-2009 trend.
 Source: Denise Chisholm; Fidelity Investments
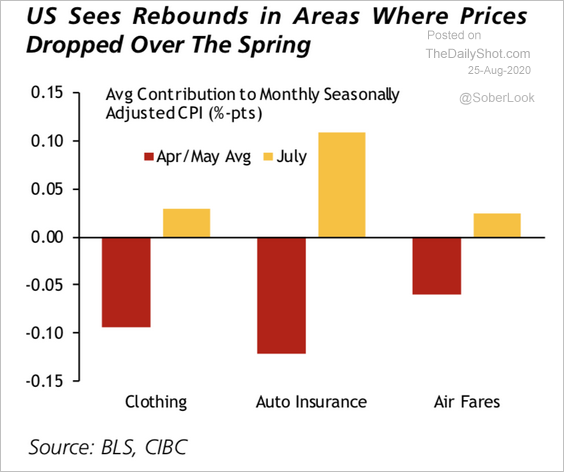
• Some of the rebound was driven by sectors that were hit the hardest during the lockdowns.
 Source: CIBC Capital Markets
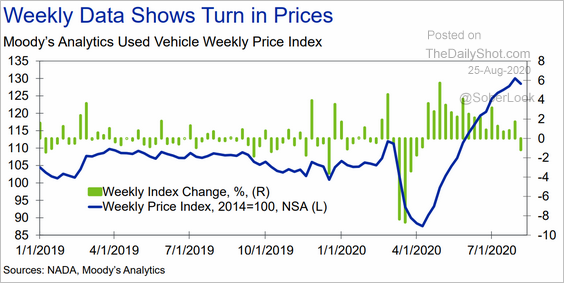
• Used vehicle prices spiked over the past couple of months.
 Source: Moody’s Analytics
But the increases appear to be slowing.
 Source: Moody’s Analytics
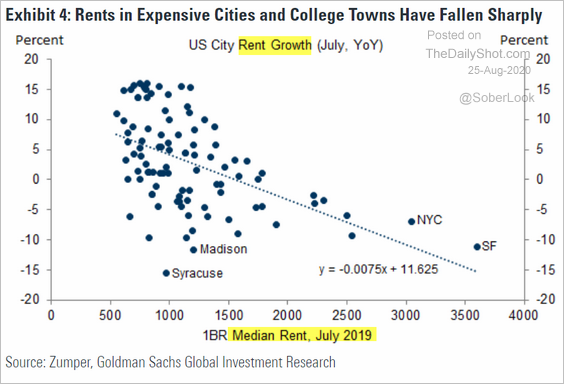
• College towns and expensive cities saw the largest declines in rents.
 Source: Goldman Sachs
——————–
3. Next, we have some updates on housing finance.
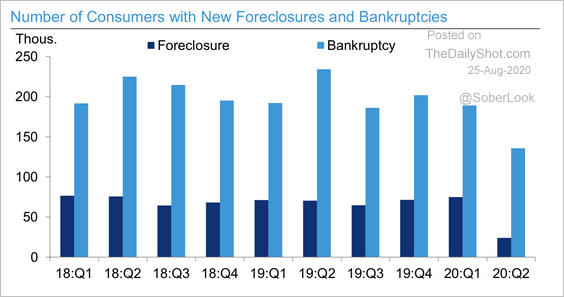
• Foreclosures are expected to rise.
 Source: Deutsche Bank Research
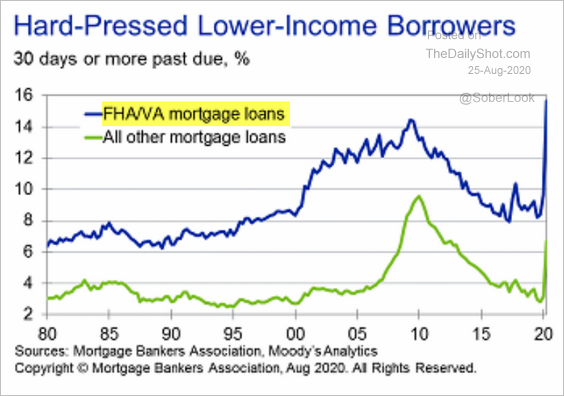
• Low-income borrowers’ past-due mortgages are at record levels.
 Source: Moody’s Analytics
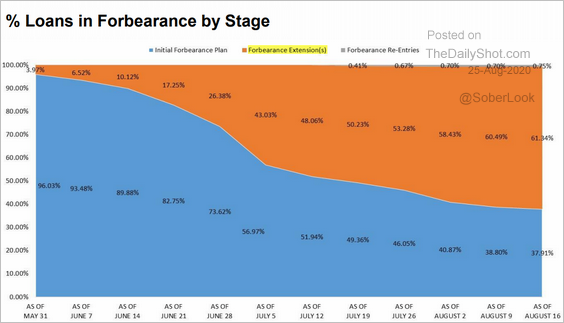
• Many homeowners are getting forbearance extensions:
 Source: Mortgage Bankers Association
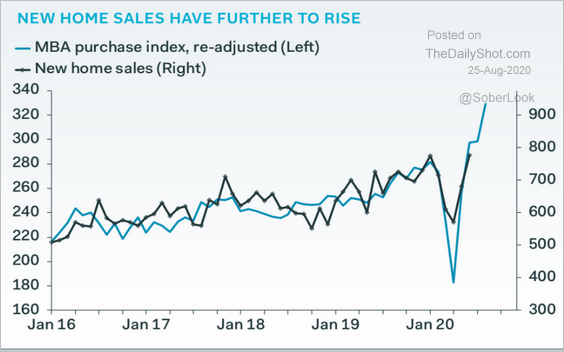
• The spike in mortgage applications points to further increases in new home sales.
 Source: Pantheon Macroeconomics
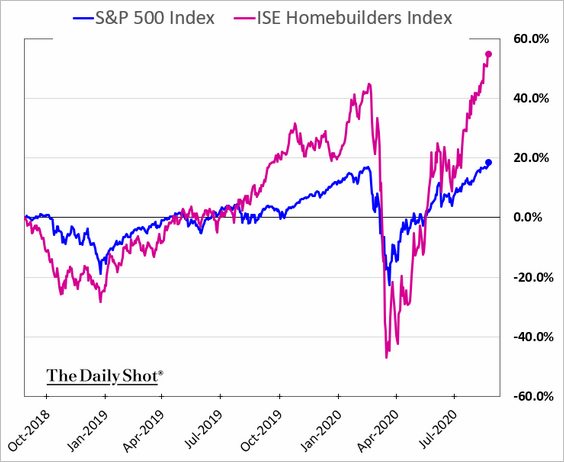
That’s why homebuilder shares are soaring.
——————–
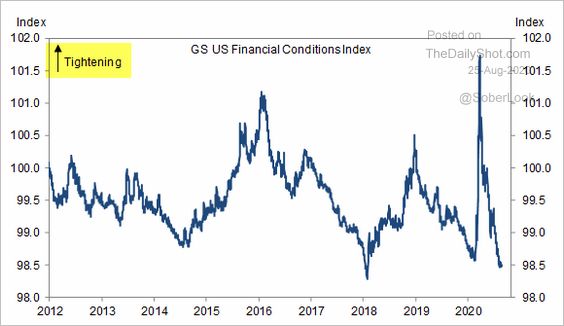
4. US financial conditions continue to ease.
 Source: Goldman Sachs
Global Developments
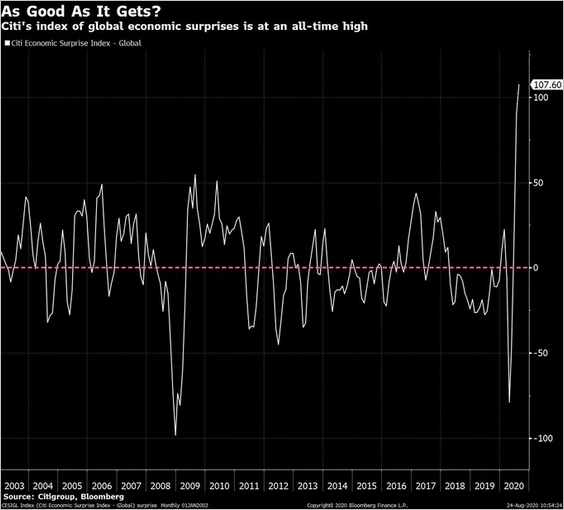
1. The Global Citi Economic Surprise Index hit a record high.
 Source: @tracyalloway
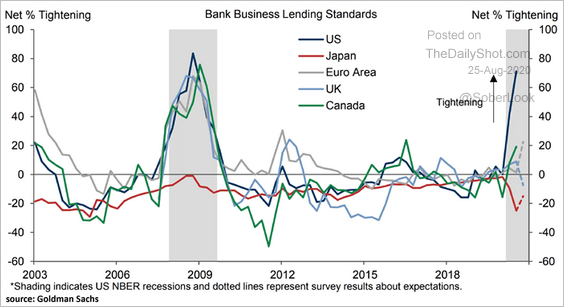
2. This chart shows bank lending standards for advanced economies.
 Source: @ISABELNET_SA, @GoldmanSachs
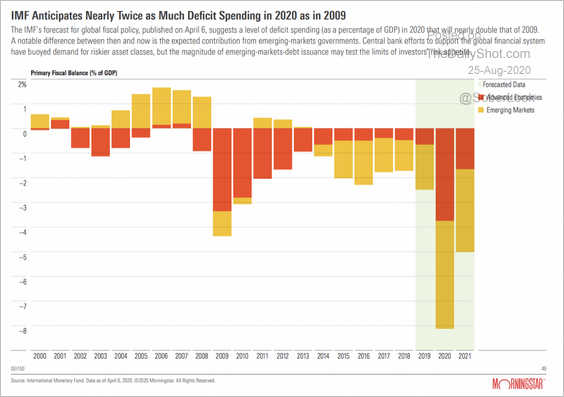
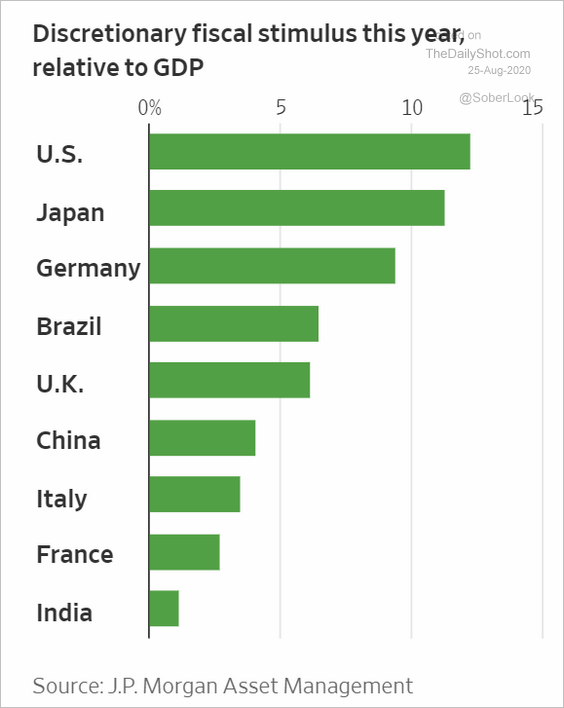
3. The IMF projects that fiscal deficits will more than triple this year.
 Source: Morningstar
This chart shows discretionary fiscal stimulus by country.
 Source: @WSJ Read full article
——————–
Food for Thought
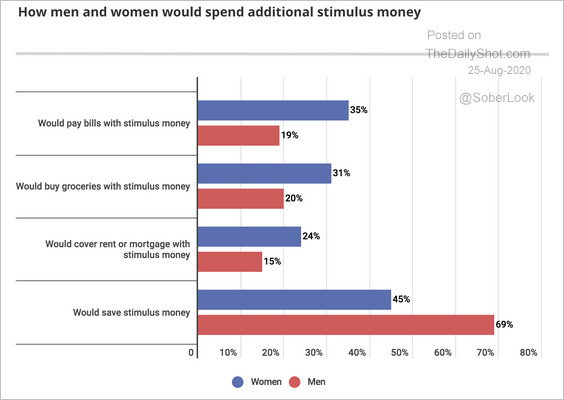
1. How would you spend additional fiscal stimulus?
 Source: MagnifyMoney Read full article
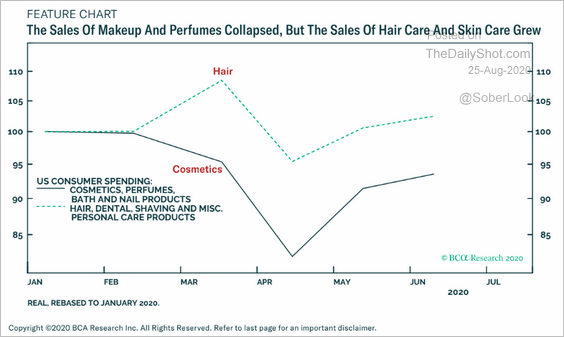
2. US sales of hair products vs. cosmetics:
 Source: BCA Research
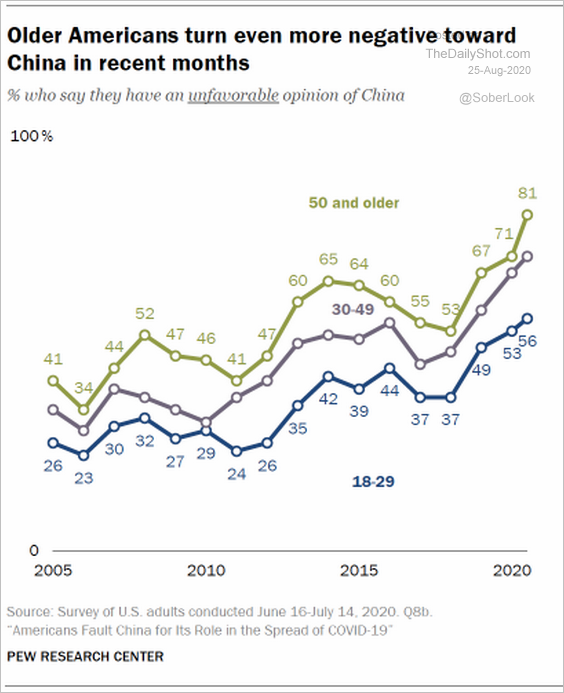
3. Americans’ views on China, by age:
 Source: @pewglobal Read full article
4. The evolution of US and Russian nuclear arsenals:
 Source: Statista
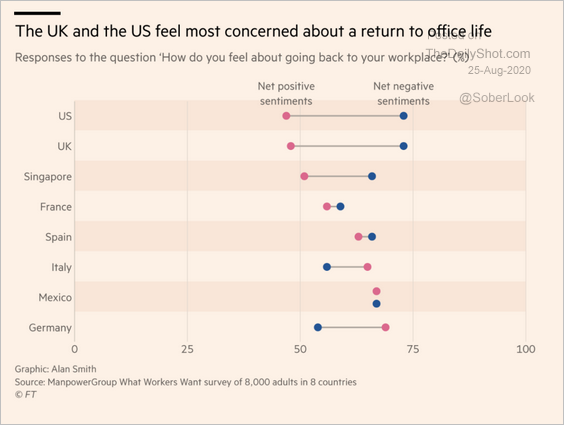
5. Fears about returning to office life:
 Source: @financialtimes Read full article
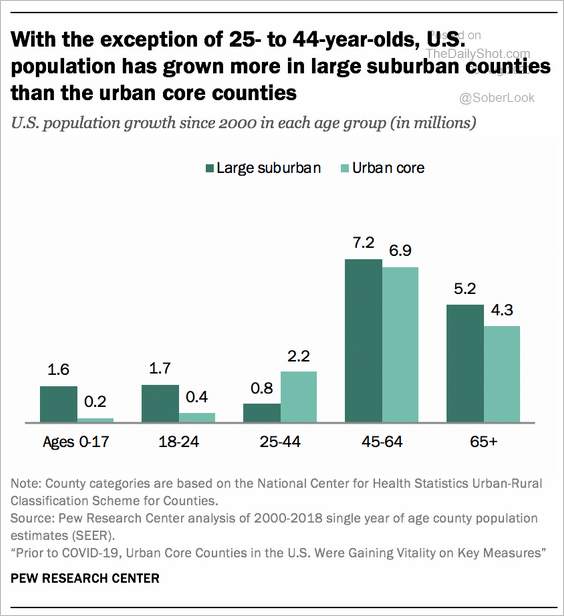
6. US population growth:
 Source: @pewresearch Read full article
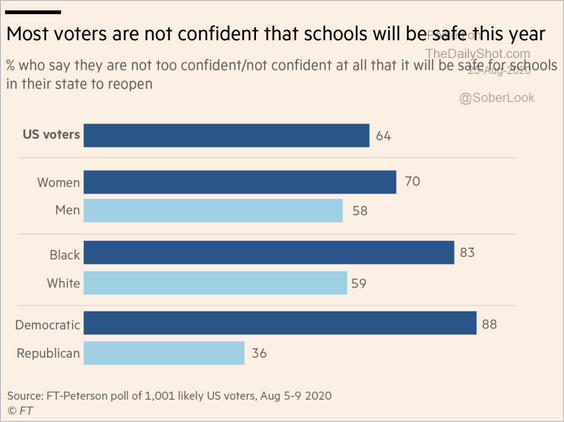
7. Confidence in schools’ safety:
 Source: @financialtimes Read full article
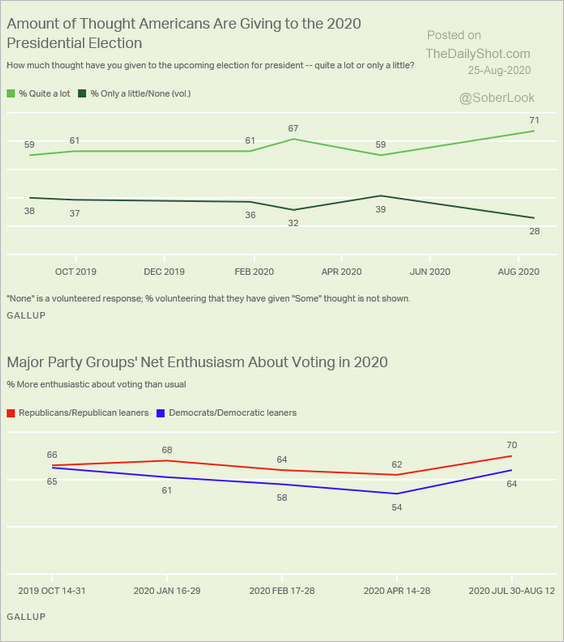
8. Enthusiasm for the 2020 election:
 Source: Gallup Read full article
9. The most bizarre foods in the world:
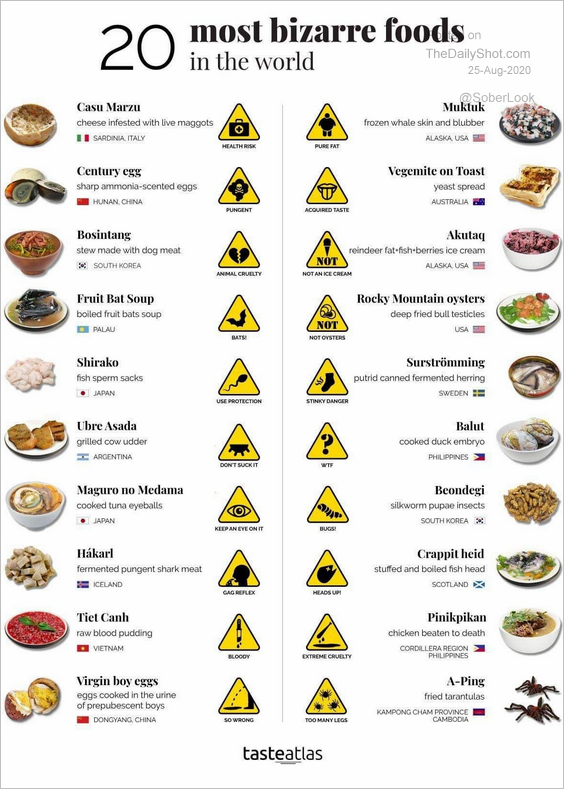 Source: @simongerman600, @TasteAtlas
——————–
