
The Daily Shot: 02-Sep-20
• The United States
• Canada
• The United Kingdom
• The Eurozone
• Europe
• Asia – Pacific
• China
• Emerging Markets
• Cryptocurrency
• Commodities
• Energy
• Equities
• Credit
• Rates
• Food for Thought
The United States
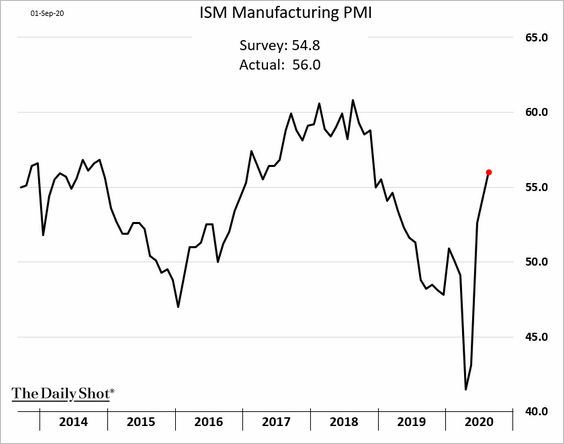
1. The ISM manufacturing report surprised to the upside as the nation’s factory activity accelerated last month (PMI > 50 = expansion).
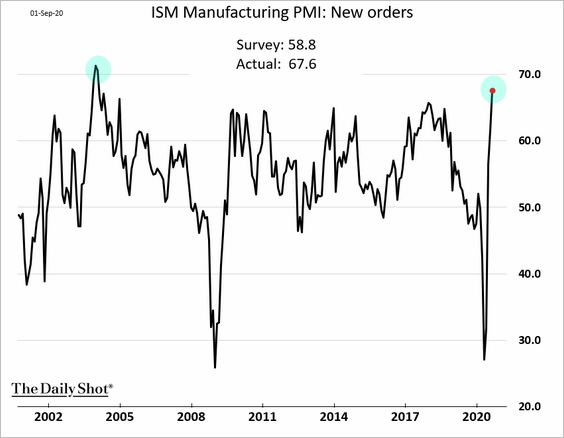
• Manufacturing orders are growing at the fastest pace since 2004.
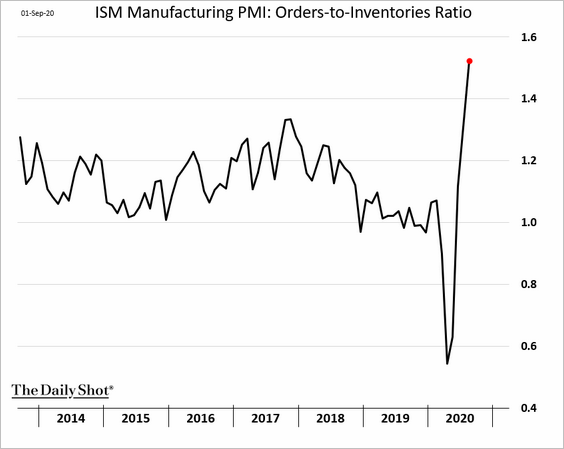
Here is the orders-to-inventories ratio.
The spike in new orders points to further gains in manufacturing output.
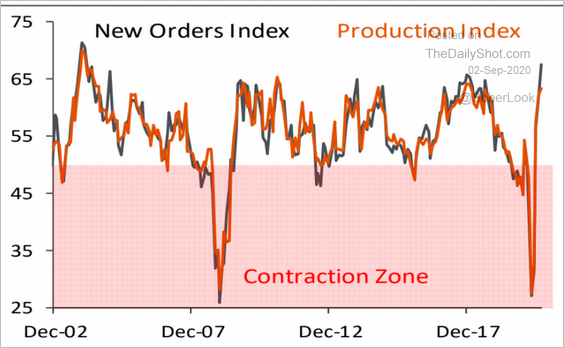 Source: Piper Sandler
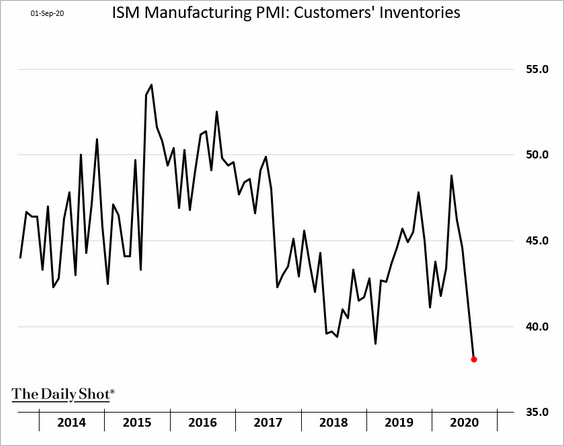
• Manufacturers are reporting that their customers’ inventories are much too low.
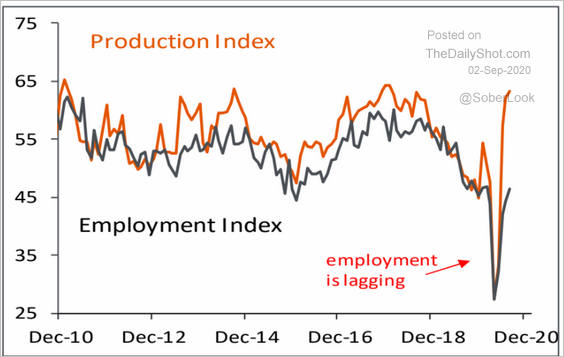
• Factory hiring is still lagging (2 charts).
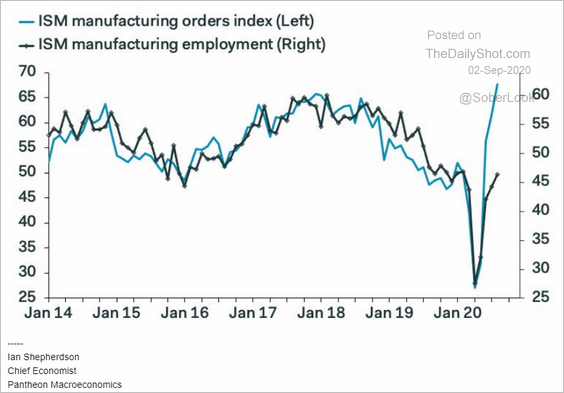 Source: Pantheon Macroeconomics
 Source: Piper Sandler
——————–
2. Next, we have some updates on the labor markets.
• Permanent layoffs have been relatively low.
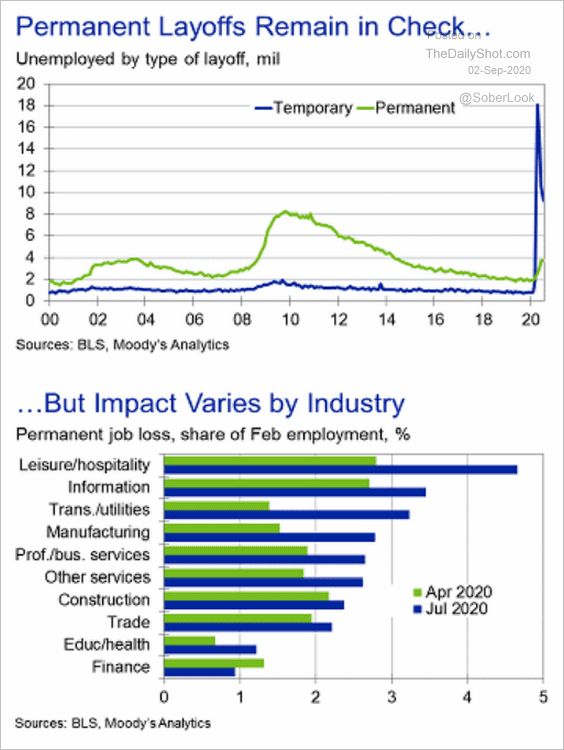 Source: Moody’s Analytics
But Americans are quite concerned about losing their job.
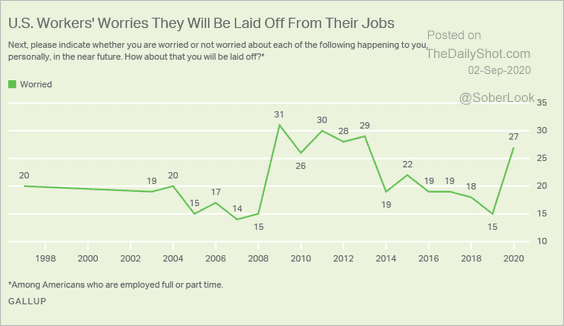 Source: Gallup Read full article
• The BLS measure of wage gains has been elevated because companies disproportionally shed low-wage jobs, boosting the average.
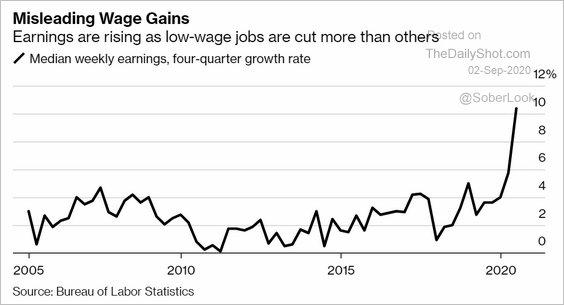 Source: @markets Read full article
• Small business employment is not recovering.
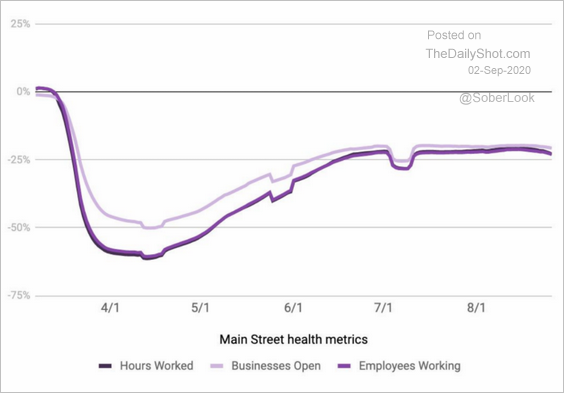 Source: Homebase
——————–
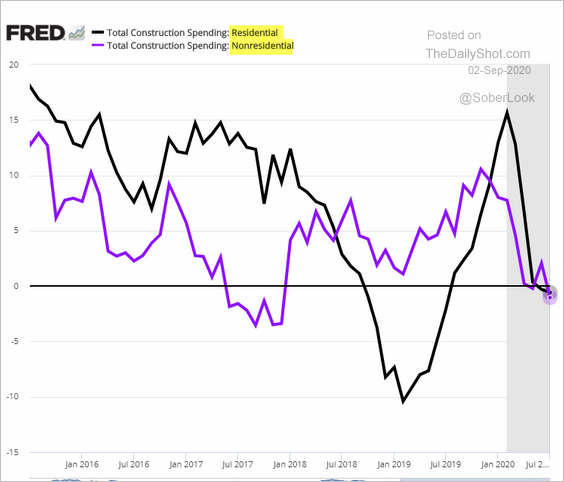
3. Despite a spike in housing demand, construction spending remains soft.
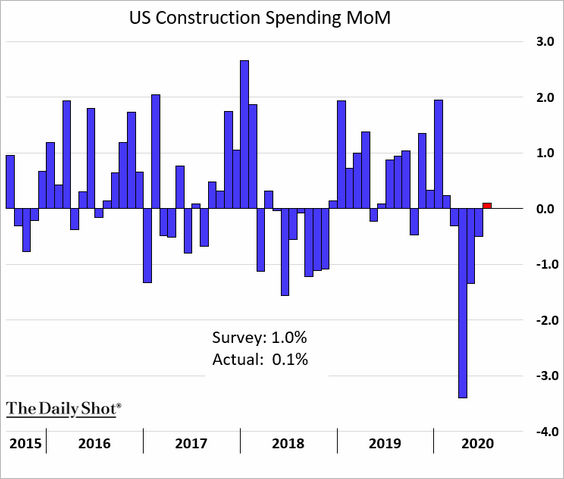
Both residential and non-residential expenditures are below last year’s levels.
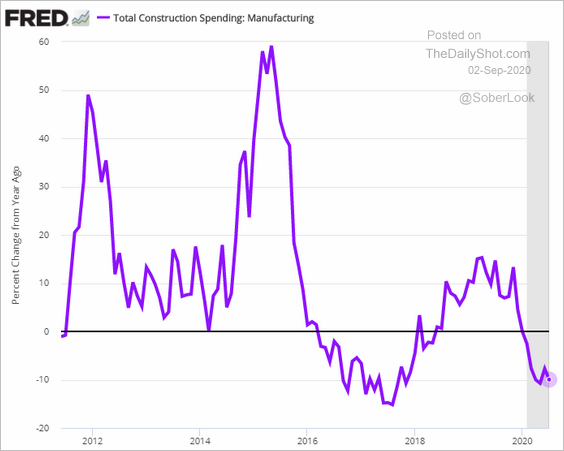
Spending on factory construction is down 10% from a year ago.
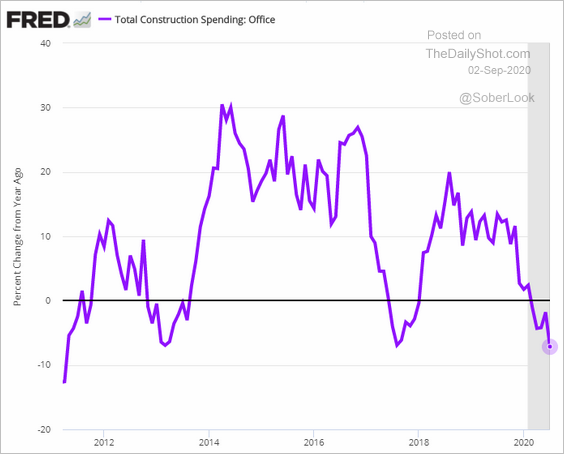
Office construction spending has declined by most since 2011.
——————–
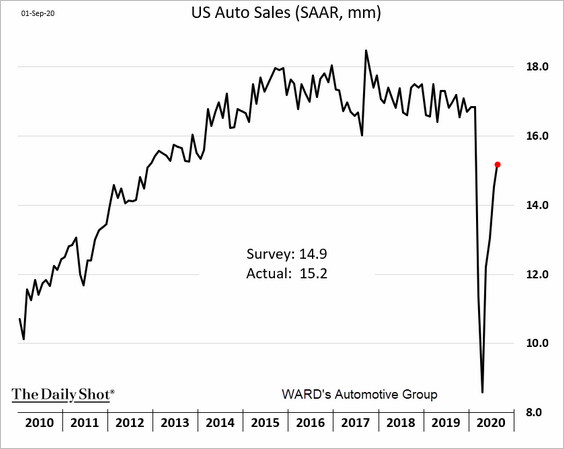
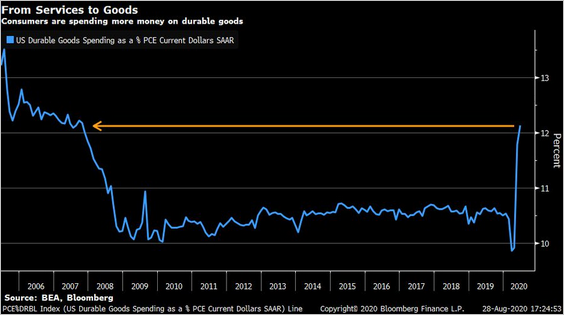
4. Auto sales have rebounded sharply.
We can see this demand for autos in consumer spending on durables (chart shows durables as % of total spending).
 Source: @TheTerminal, Bloomberg Finance L.P., @LizAnnSonders
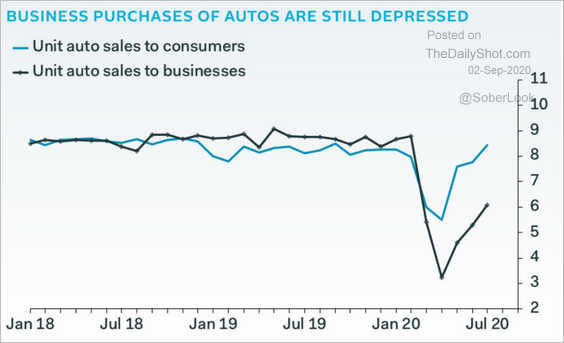
However, auto sales to businesses are lagging.
 Source: Pantheon Macroeconomics
——————–
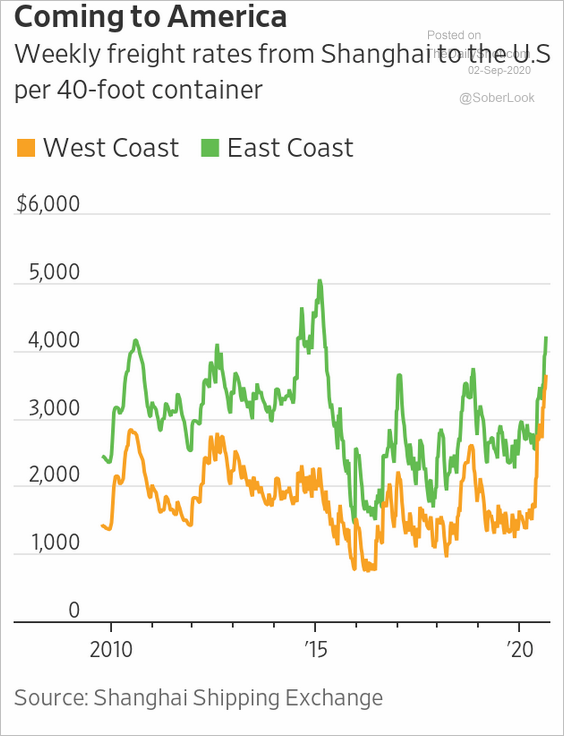
5. US imports from China are picking up, boosting freight rates.
 Source: @WSJ Read full article
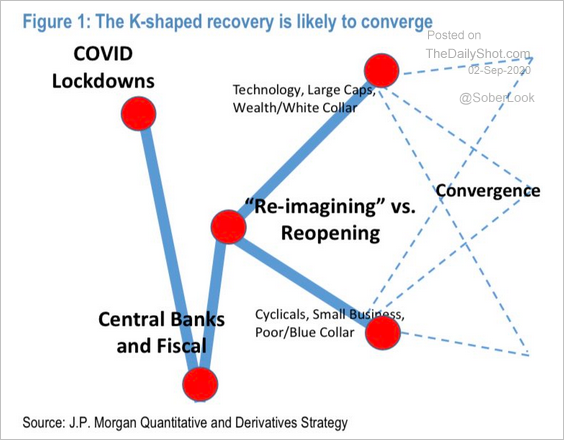
6. Here is an illustration of Peter Atwater’s concept of the “K-shaped” recovery in the US.
 Source: @Peter_Atwater
Canada
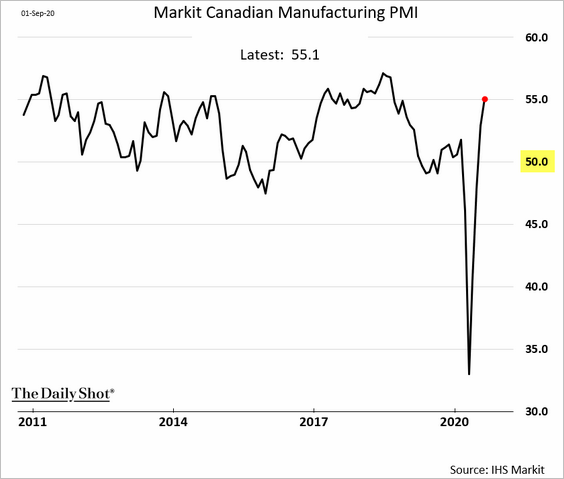
1. Manufacturing activity is now firmly in growth mode.
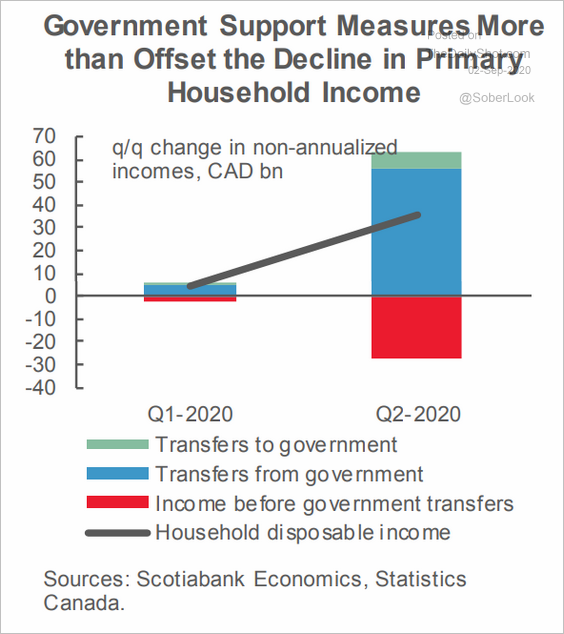
2. Government support more than offset the loss of household income.
 Source: Scotiabank Economics
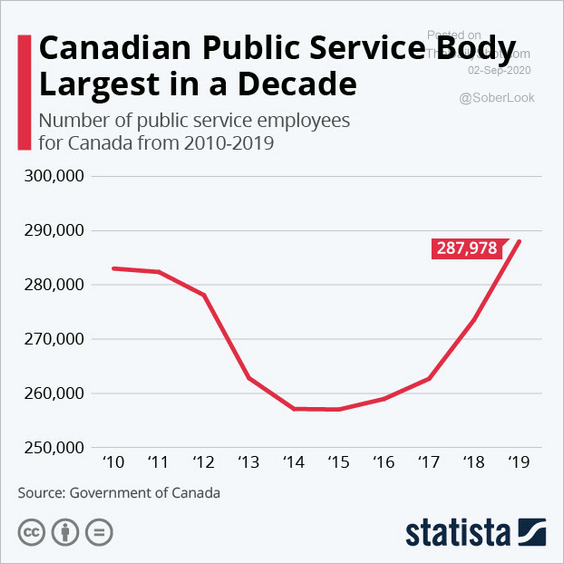
3. This chart shows the number of Canada’s public service employees.
 Source: Statista
The United Kingdom
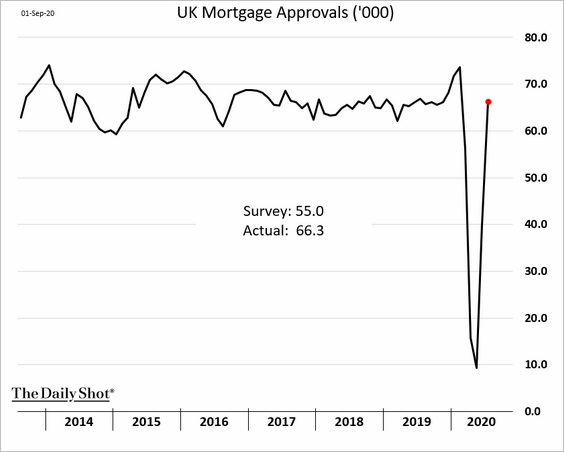
1. Mortgage approvals topped economists’ forecasts, returning to pre-crisis levels.
 Source: @financialtimes Read full article
——————–
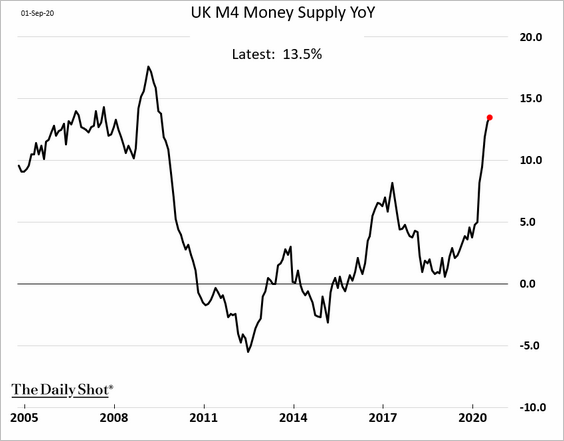
2. The broad money supply growth is the highest in a decade.
3. The Eat Out to Help Out program has been highly beneficial for the UK’s restaurant businesses.
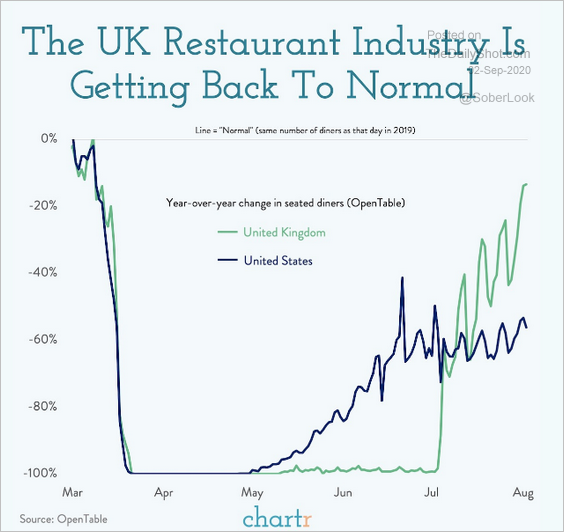 Source: @chartrdaily
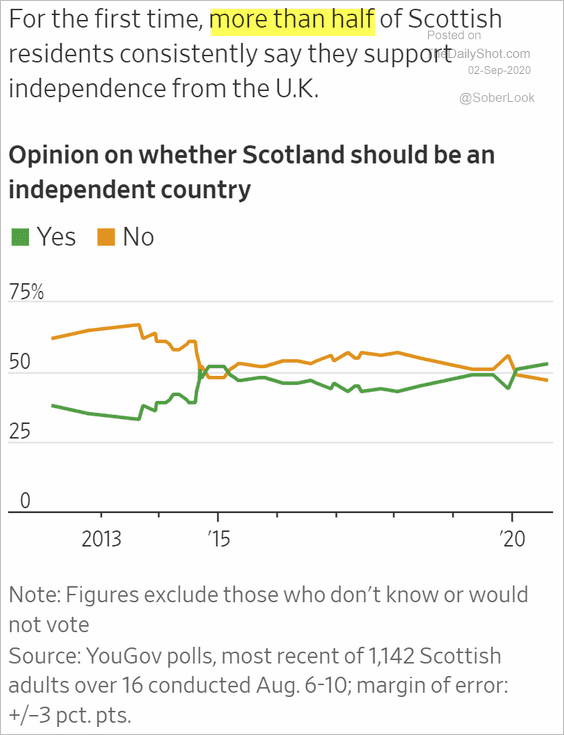
4. A majority of Scottish residents now support independence from the UK (mostly due to Brexit).
 Source: @WSJ Read full article
The Eurozone
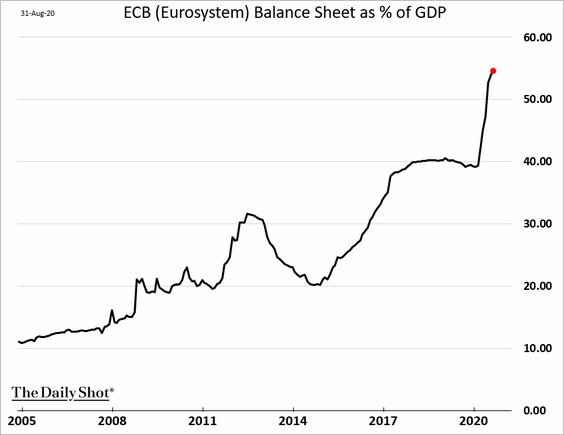
1. Inflation at the Eurozone level surprised to the downside, with the headline CPI moving into negative territory.
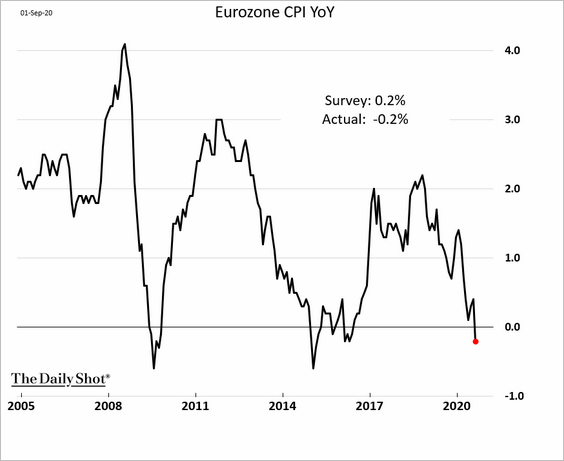
At least for now, the spike in the ECB’s balance sheet has not been effective in boosting inflation. Perhaps it helped avoid Japan-style deflationary pressures.
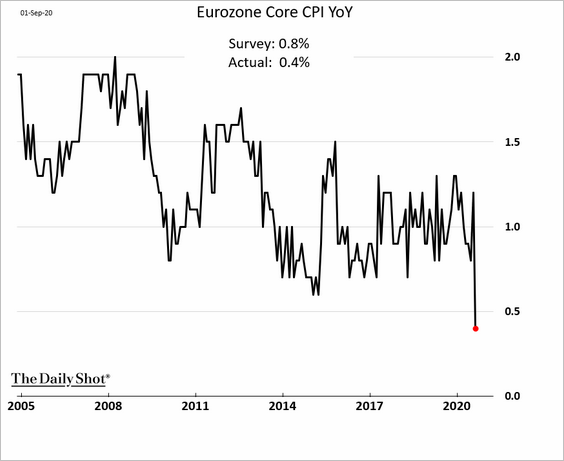
The core CPI hit a new low.
Vacation packages, which tend to be volatile, have been a drag on the core CPI.
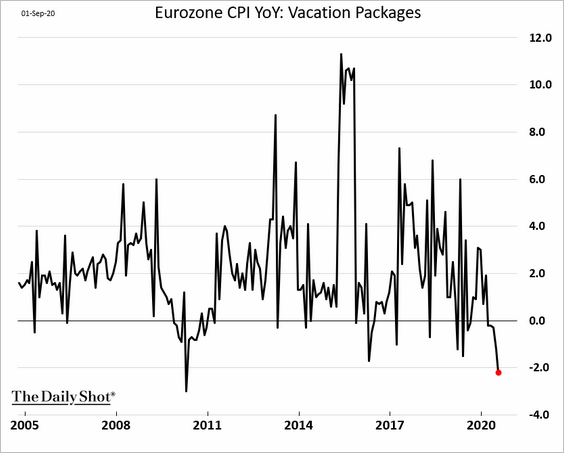
However, other factors have also contributed to the recent decline.
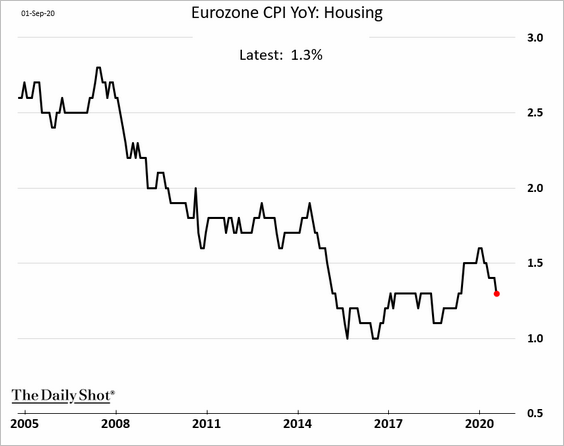
• Housing:
• Transportation:
![]()
• Services inflation:
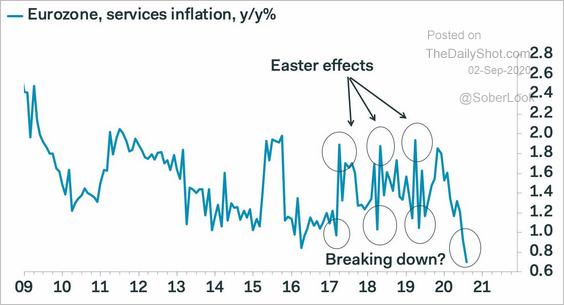 Source: Pantheon Macroeconomics
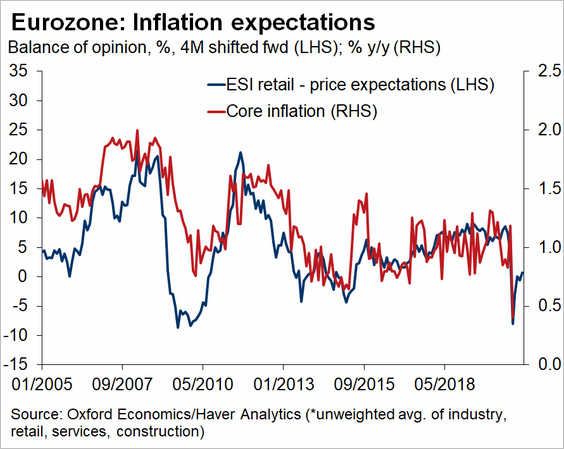
Inflation expectations point to a modest rebound.
——————–
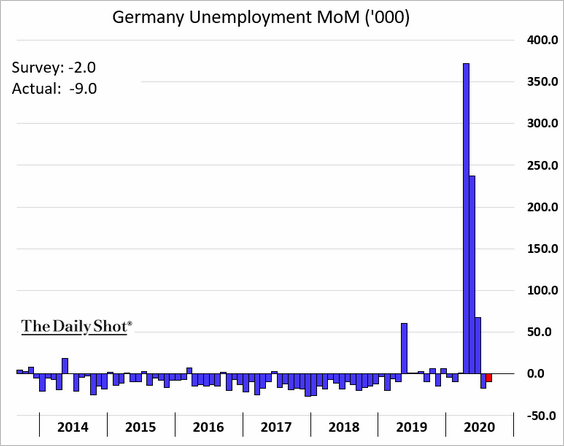
2. Germany’s unemployment declined for the second month.
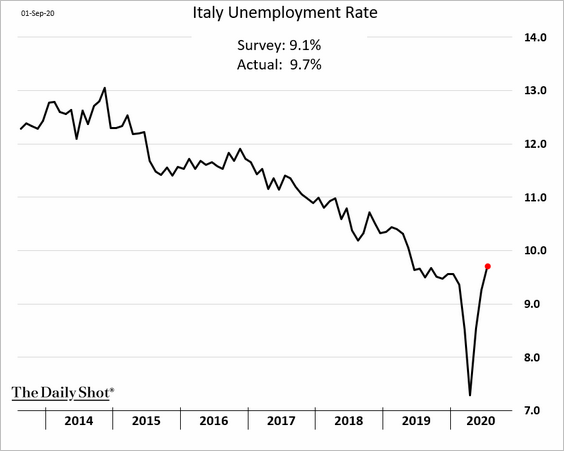
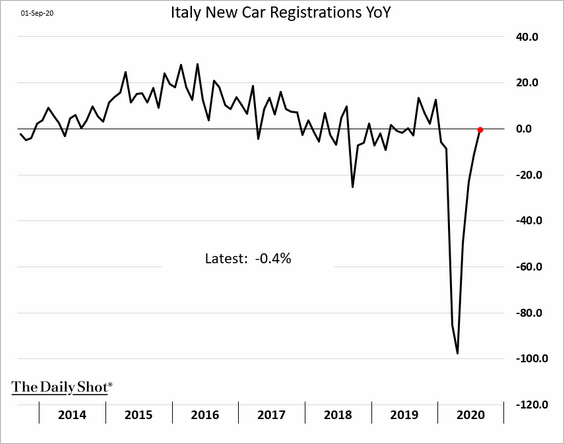
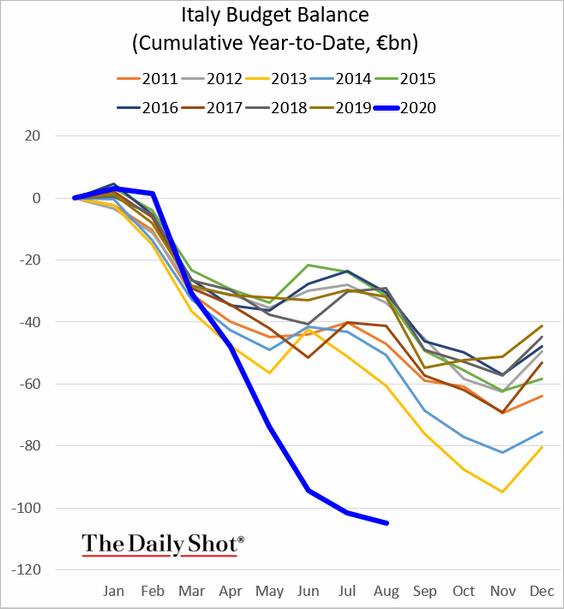
3. Next, we have some updates on Italy.
• The unemployment rate surprised to the upside.
• Manufacturing activity has accelerated.
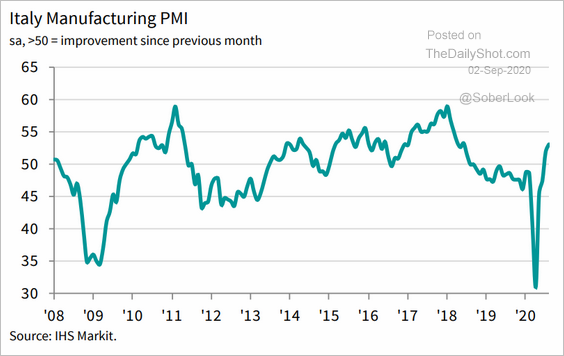 Source: IHS Markit
• Car registrations are back to pre-crisis levels.
• The budget gap has widened sharply this year.
——————–
4. Spain’s manufacturing growth has stalled again.
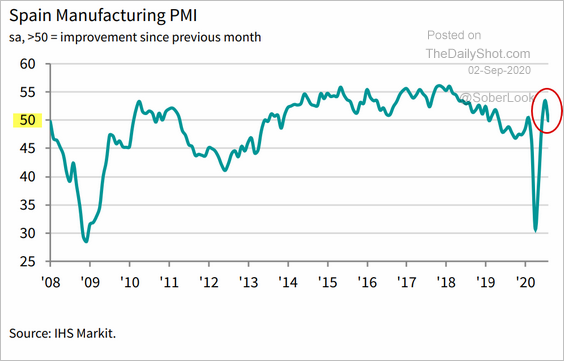 Source: IHS Markit
The euro-area PMI measure points to a rebound in factory output.
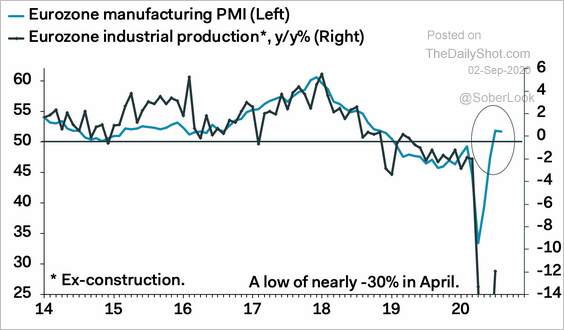 Source: Pantheon Macroeconomics
——————–
5. The euro failed to break the resistance at 1.2.
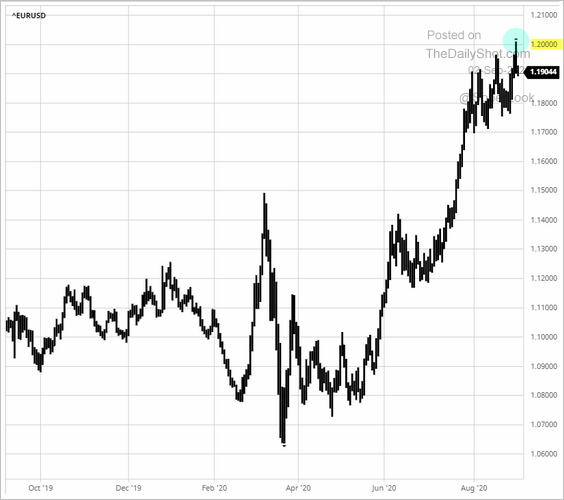 Source: barchart.com
Europe
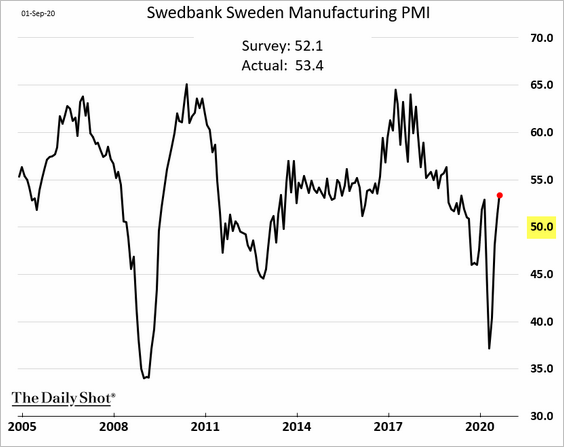
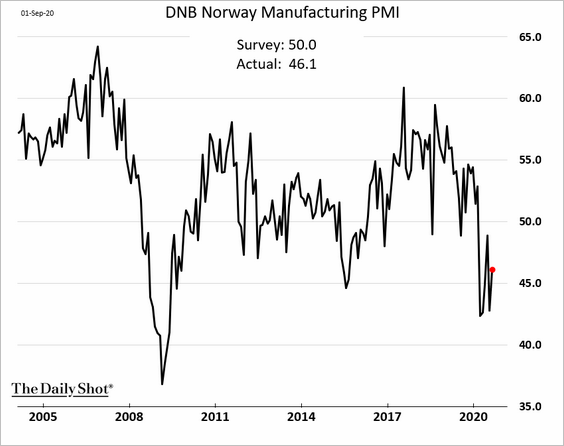
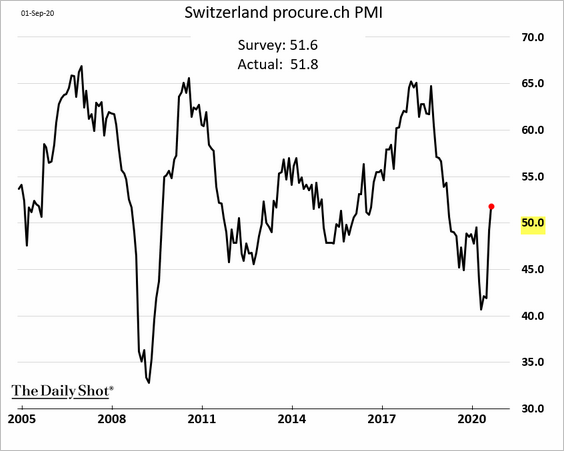
1. Let’s run through some manufacturing PMI indices.
• Sweden (expanding):
• Norway (still weak):
• Switzerland (back in growth mode):
• The Czech Republic (stabilizing):
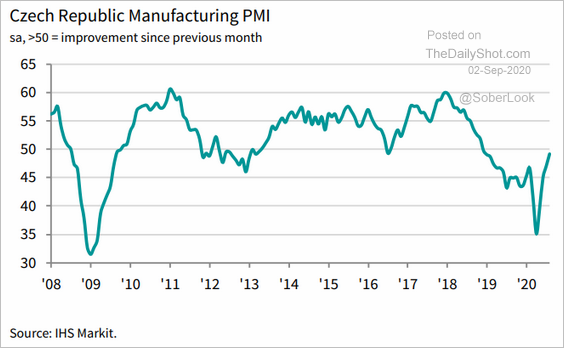 Source: IHS Markit
• Poland (growth stalling):
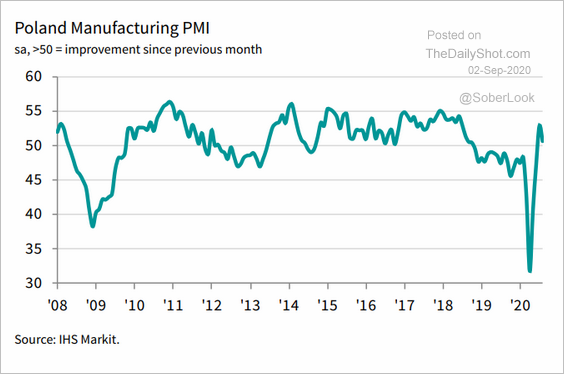 Source: IHS Markit
——————–
2. Here is the relative performance of Europe’s key equity indices.
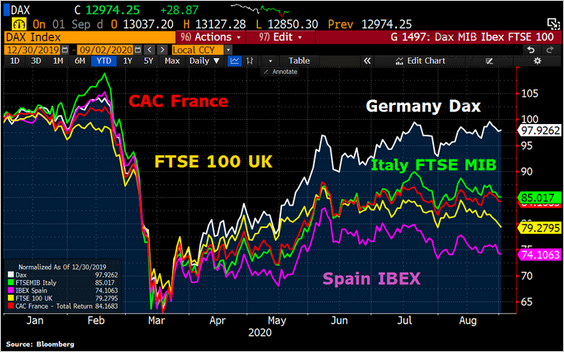 Source: @Schuldensuehner
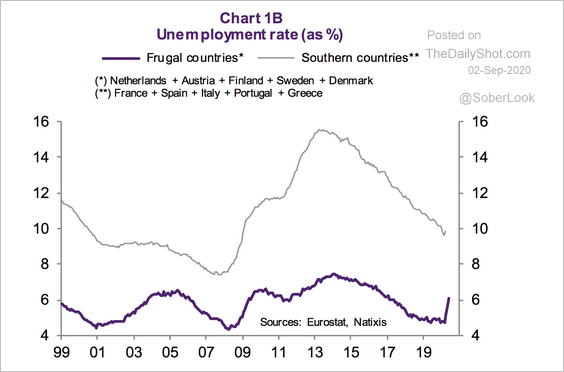
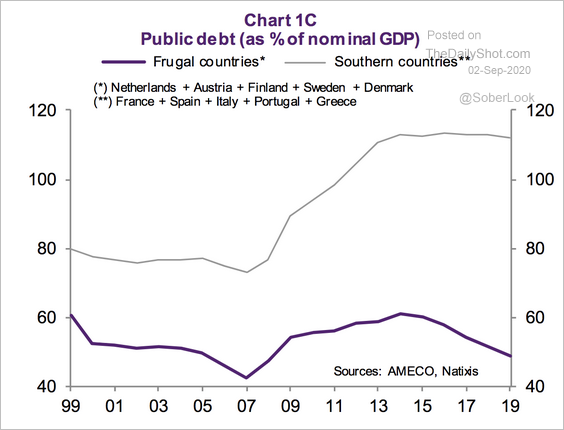
3. These charts show the economic trends in northern vs. southern Western European economies.
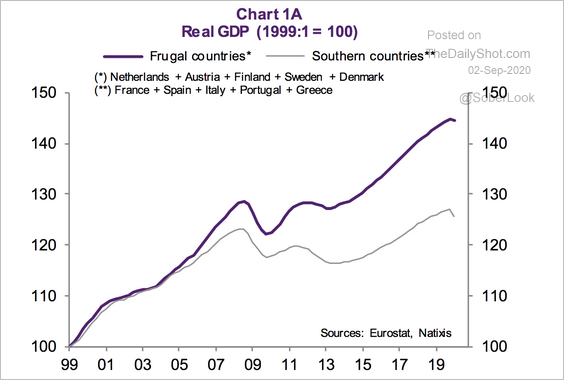 Source: Natixis
 Source: Natixis
 Source: Natixis
Asia – Pacific
1. The Bank of Japan has stepped up its ETF purchases just as overseas investors retreated.
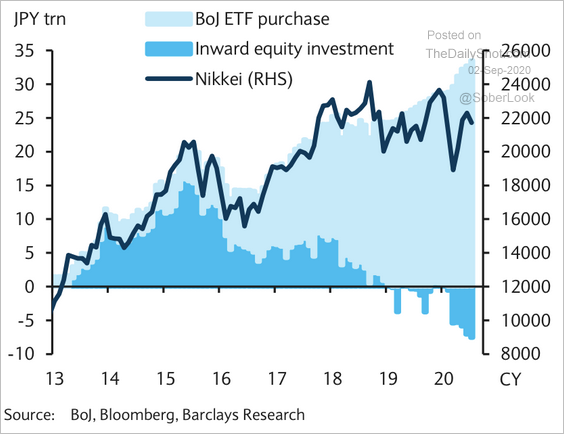 Source: Barclays Research
2. Abenomics was helpful for Japan’s corporate earnings.
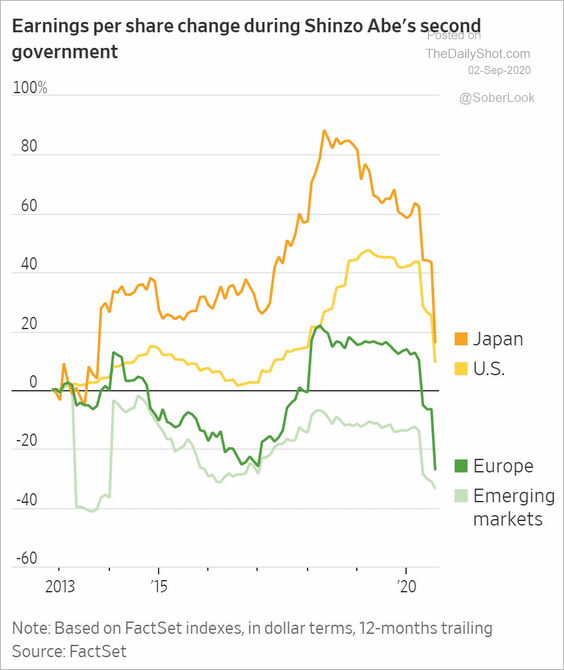 Source: @WSJ Read full article
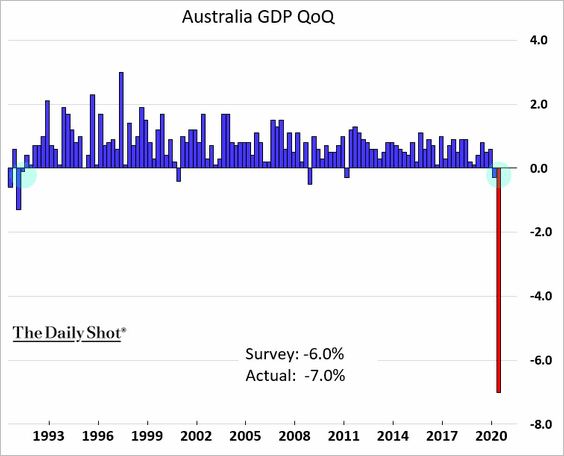
3. For the first time in almost two decades, Australia is officially in recession.
China
1. Bond defaults may hit a record high this year.
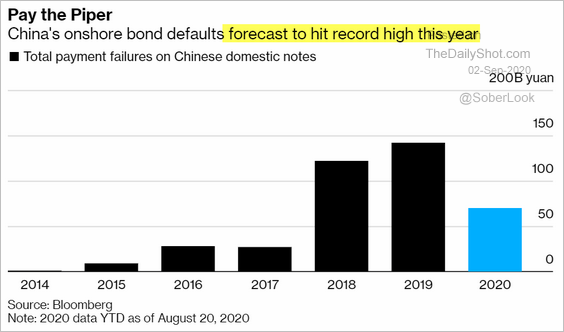 Source: @markets Read full article
2. China’s dollar bond issuers have been bypassing US investors. Who needs all that regulation?
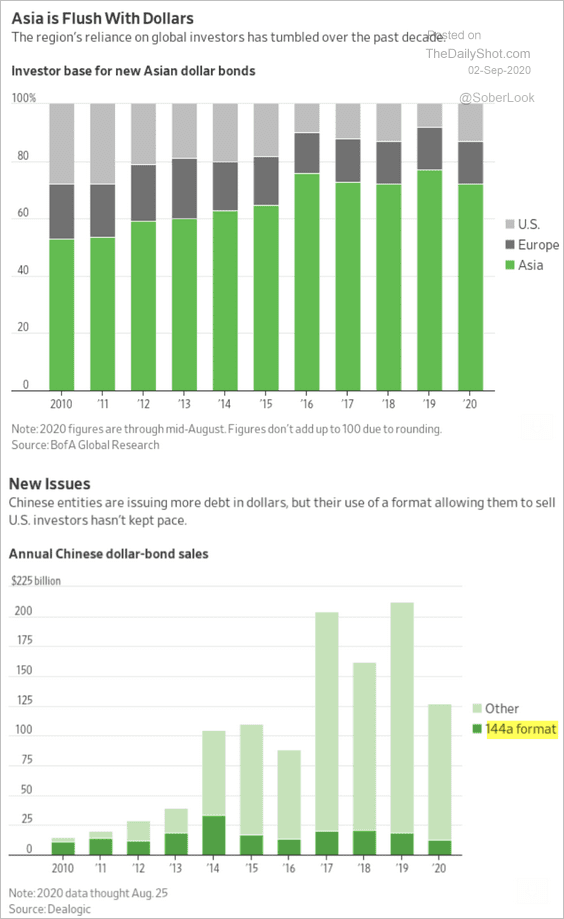 Source: @WSJ Read full article
3. China has been shedding US assets.
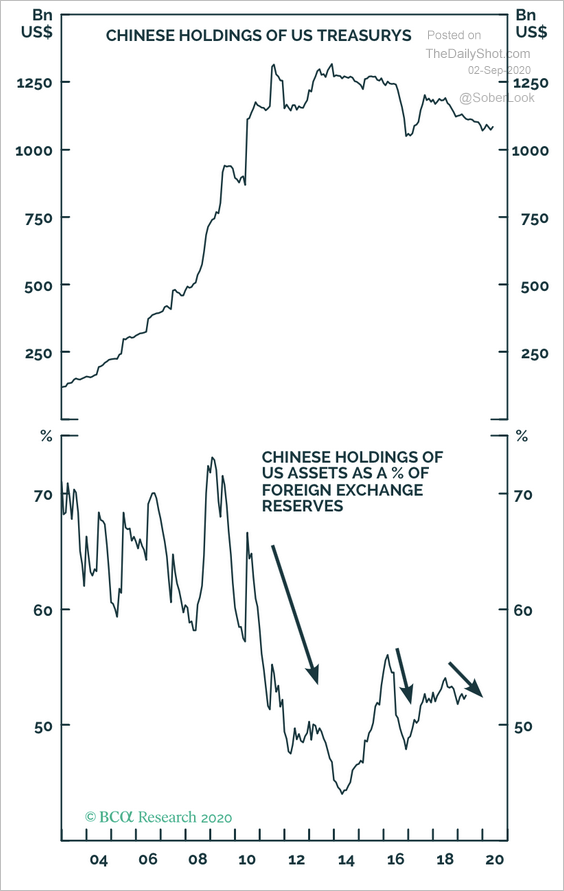 Source: BCA Research
4. State banks have been lending below the prime rate to support the economy.
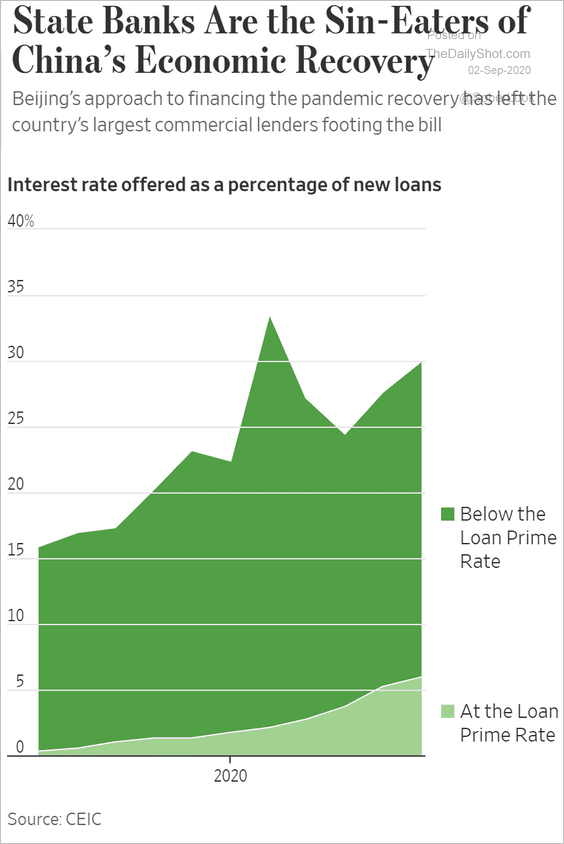 Source: @WSJ Read full article
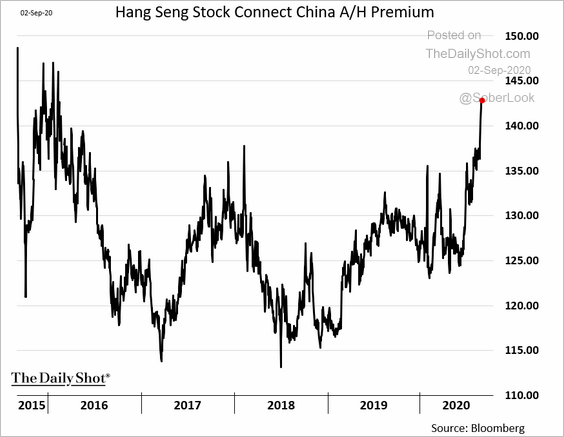
4. Mainland shares are trading at a substantial premium to Hong Kong.
 h/t @JeannyYu
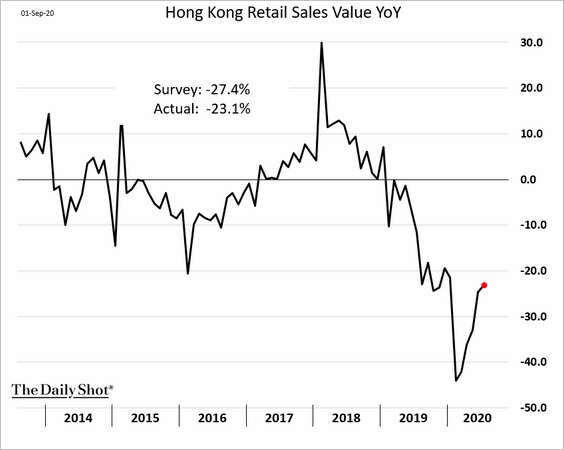
5. Hong Kong retail sales are gradually recovering
Emerging Markets
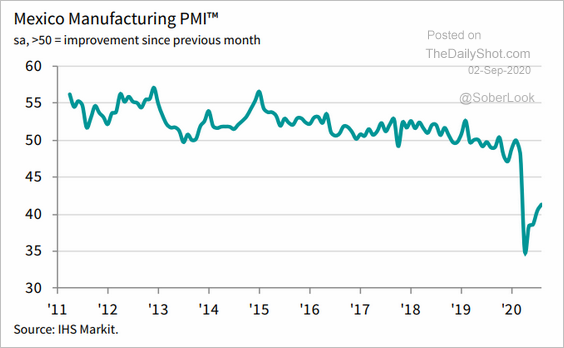
1. Let’s begin with some manufacturing PMI updates.
• The divergence between Brazil and Mexico is remarkable.
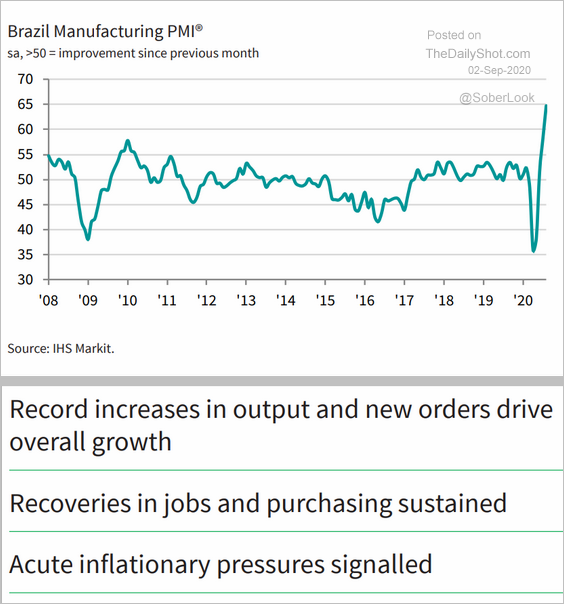 Source: IHS Markit
 Source: IHS Markit
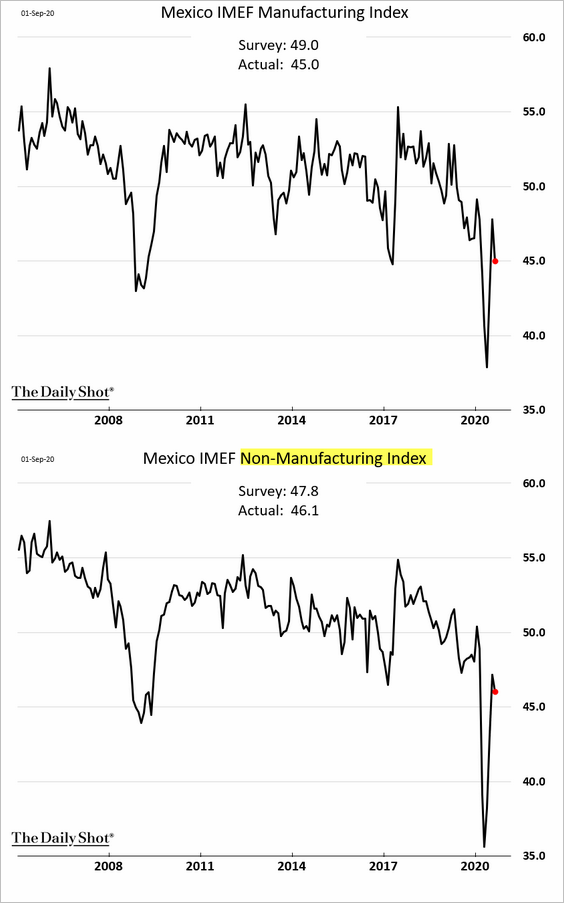
Here is an alternative business activity index for Mexico.
• Below are several other trends in factory activity.
– Colombia (stalling):
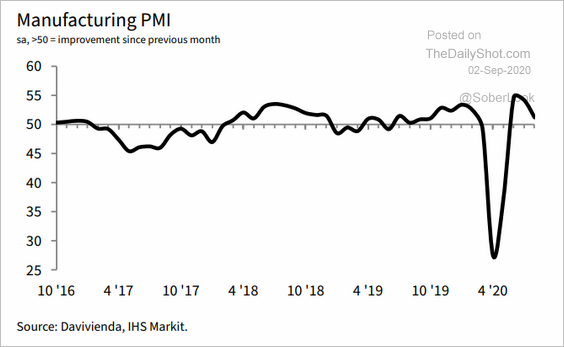 Source: IHS Markit
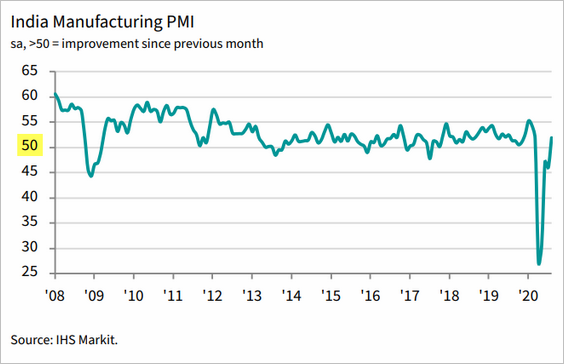
– India:
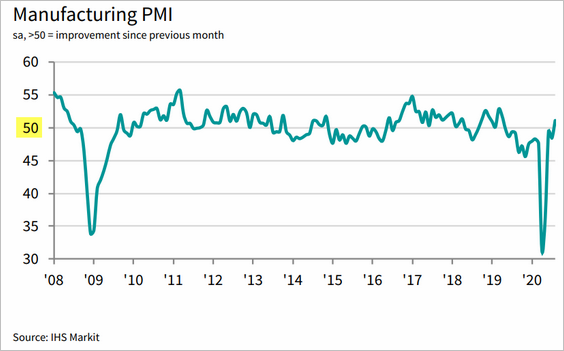
– Russia:
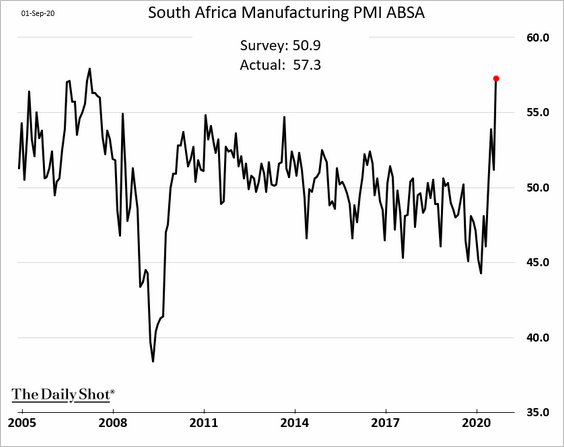
– South Africa (a sharp recovery):
——————–
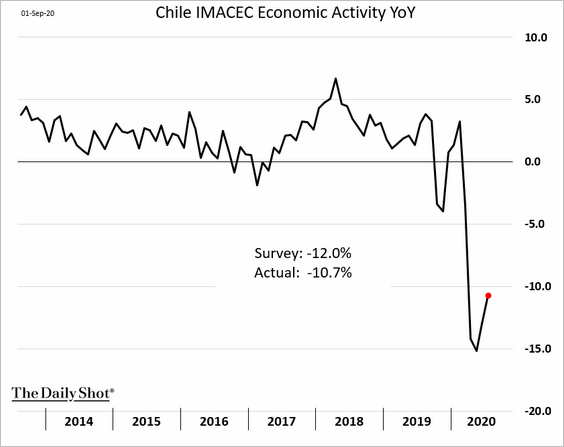
2. Chile’s economic activity remained weak in July.
3. This chart shows Russia’s external debt by sector.
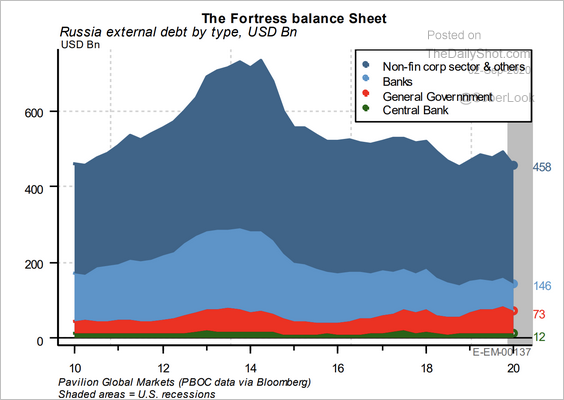 Source: Pavilion Global Markets
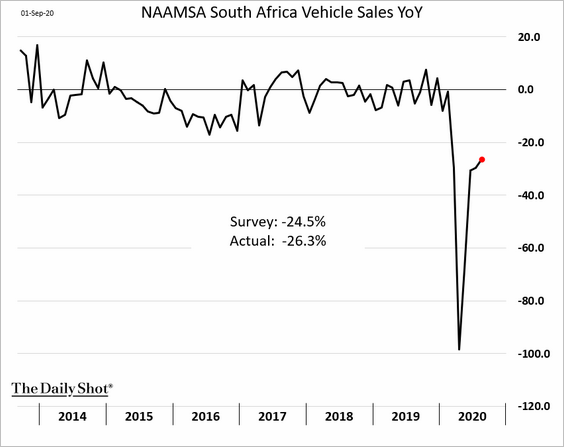
4. South Africa’s vehicle sales remain soft.
5. Thailand generates higher exports for travel services relative to neighboring countries.
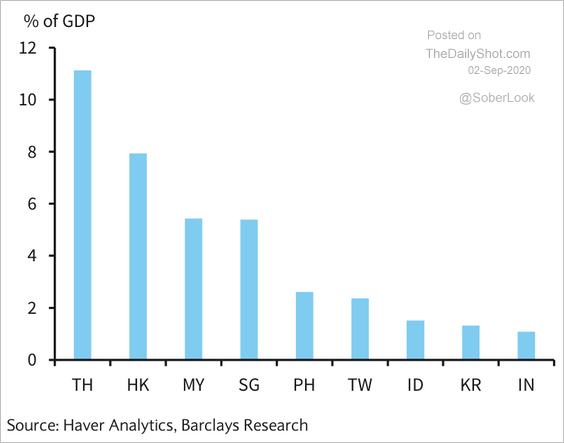 Source: Barclays Research
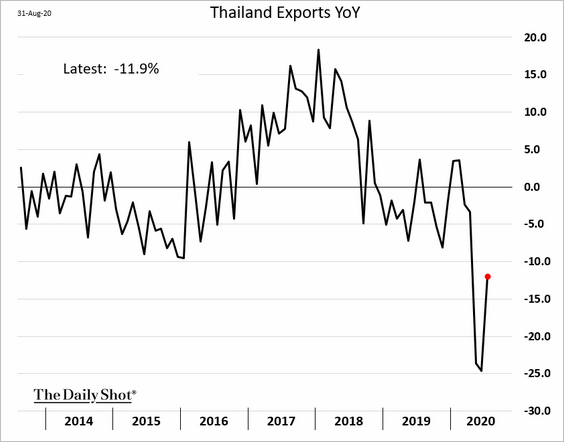
Here is the overall export trend.
——————–
6. Foreign direct investment in Vietnam nearly doubled from 2010 to 2019.
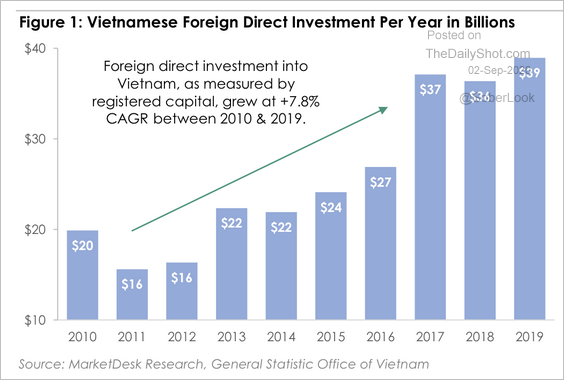 Source: MarketDesk Research
Vietnamese equities could begin to outperform the rest of the world (ex-US).
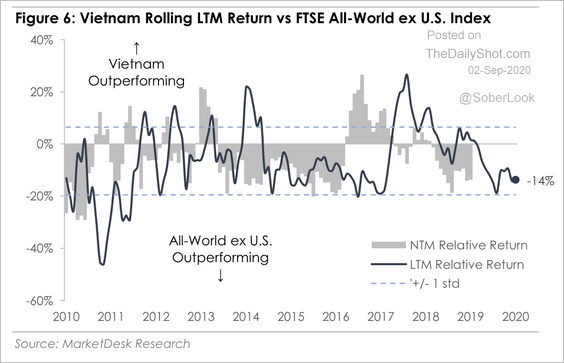 Source: MarketDesk Research
——————–
7. India’s Q2 GDP decline stands out.
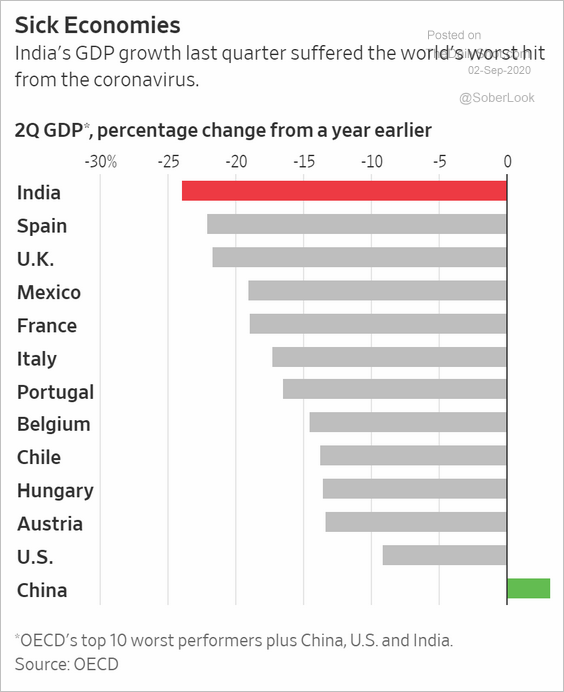 Source: @WSJ Read full article
8. Credit default swap spreads on EM dollar-denominated debt are the lowest in a year.
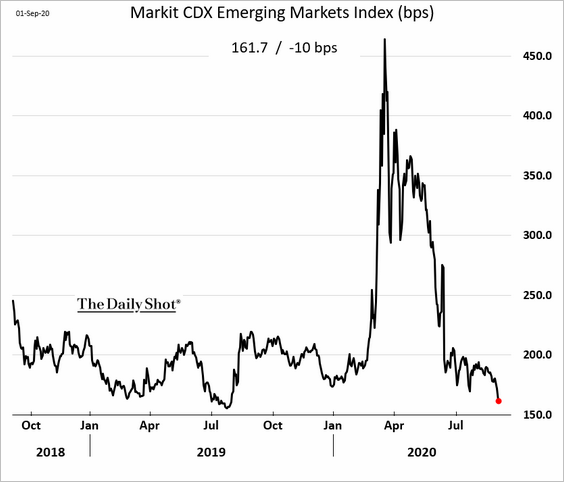 Source: @TheTerminal, Bloomberg Finance L.P.
Cryptocurrency
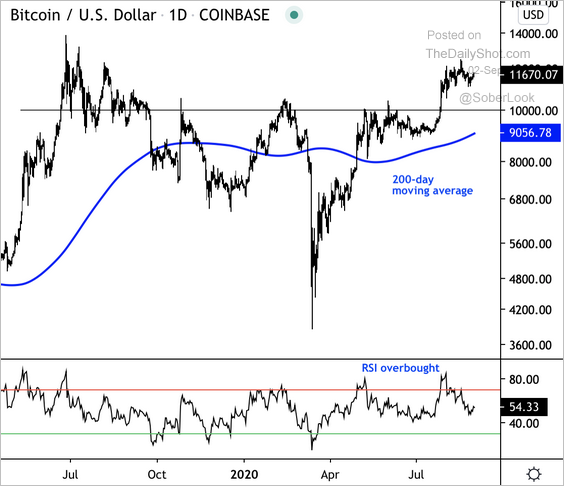
1. Bitcoin is testing resistance at $12k.
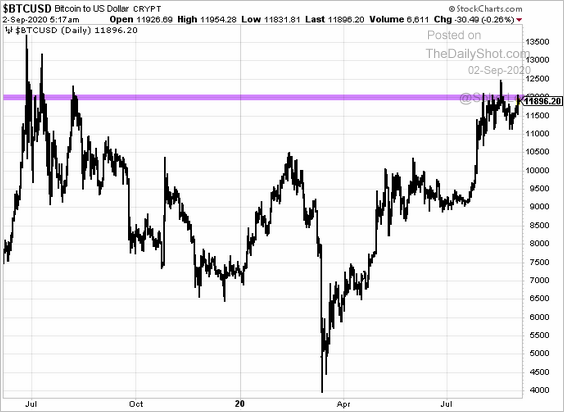
BTC/USD appears to be overbought but remains above its 200-day moving average.
 Source: @DantesOutlook
——————–
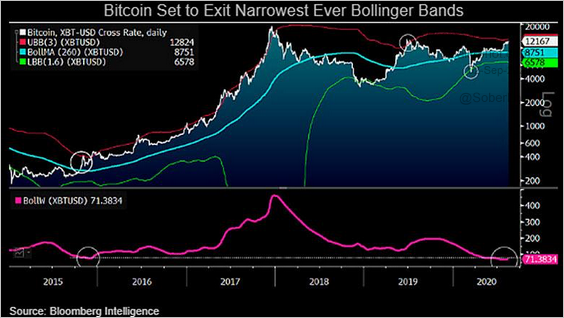
2. Bitcoin has traded in the narrowest volatility range since late 2015, which occurred before a strong breakout.
 Source: @mikemcglone11
Commodities
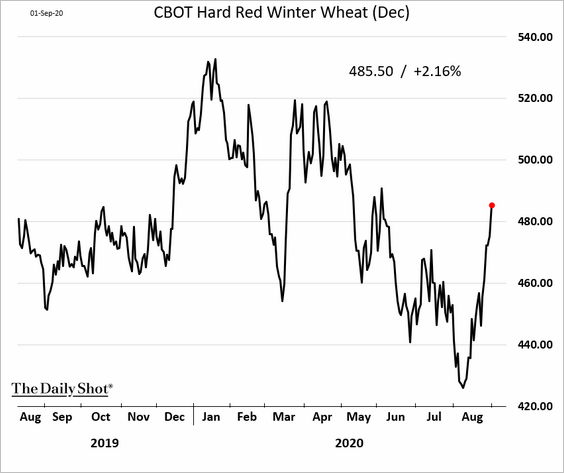
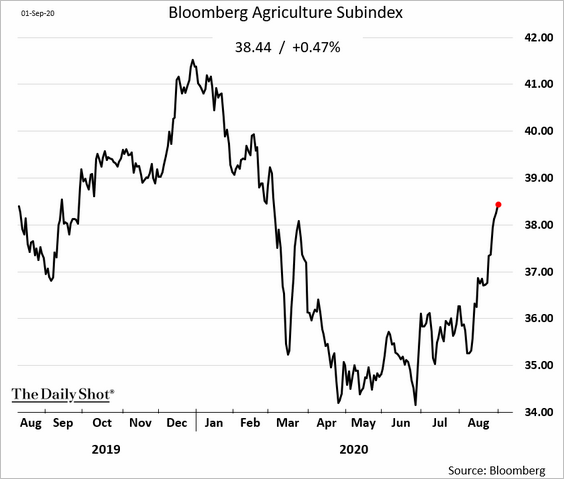
1. US wheat futues are soaring.
 Source: Reuters Read full article
Here is Bloomberg’s agriculture index.
——————–
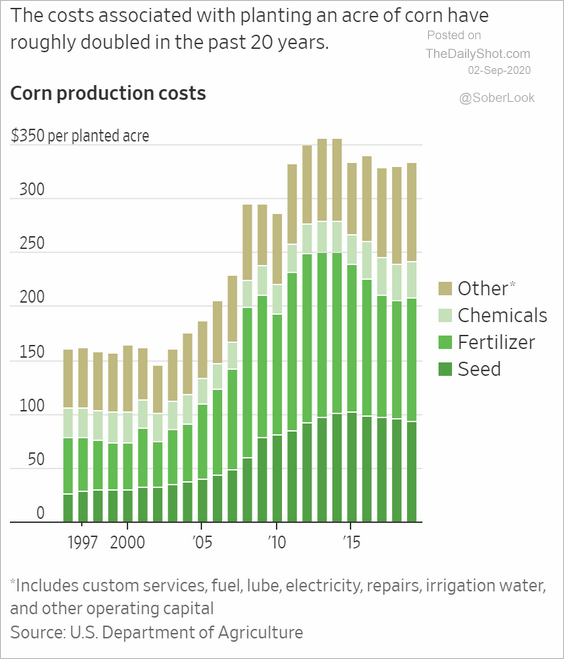
2. How much does it cost to plant an acre of corn in the US?
 Source: @WSJ Read full article
Energy
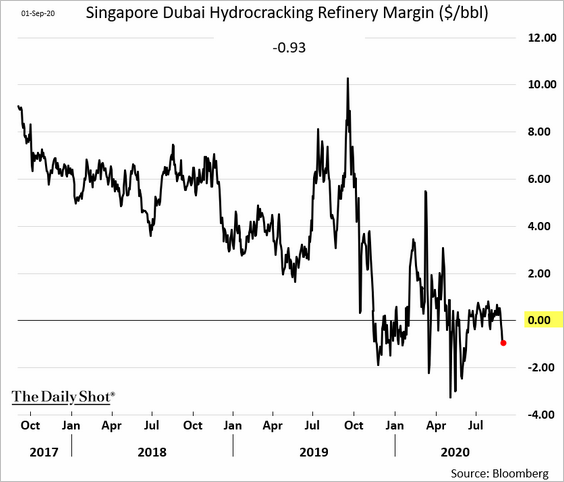
1. Global refinery margins remain weak.
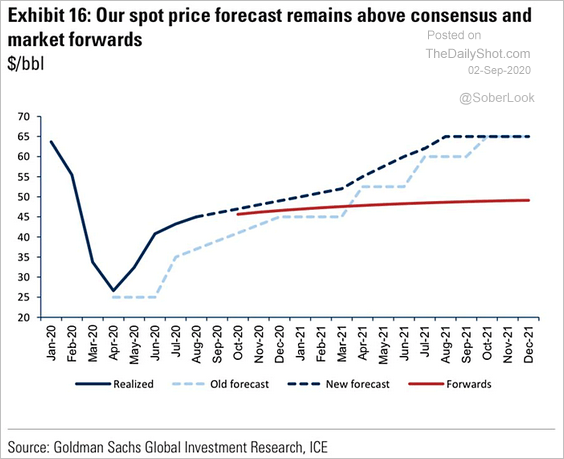
2. Here is Goldman’s forecast for crude oil prices.
 Source: @ISABELNET_SA, @GoldmanSachs Read full article
3. US fracking businesses continue to face challenges.
 Source: Reuters Read full article
4. Asia leads in renewable-energy capacity.
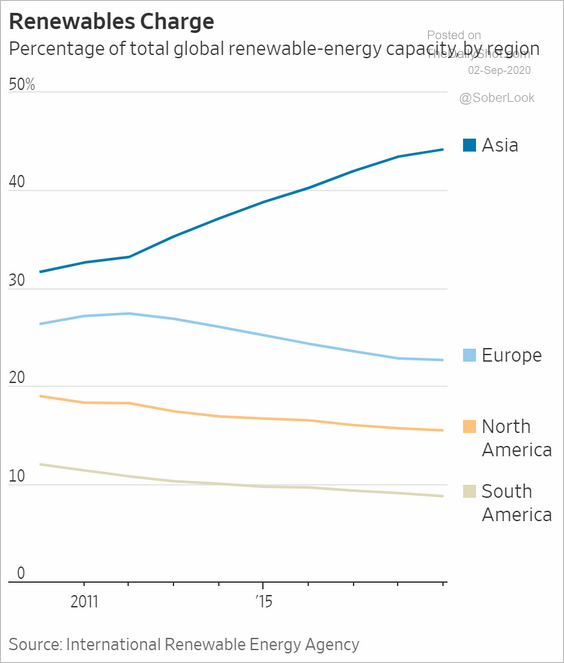 Source: @WSJ Read full article
Equities
1. Individual investors have become more influential, …
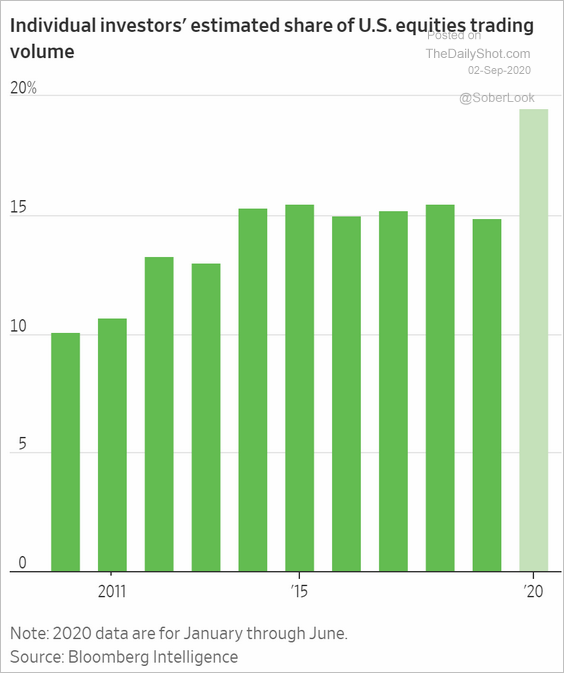 Source: @WSJ Read full article
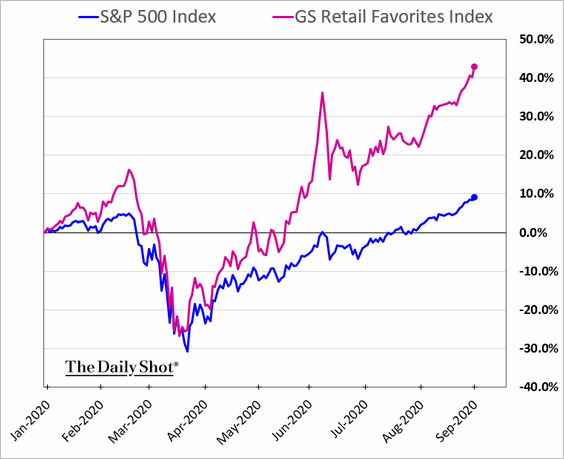
… pushing their favorite stocks to new highs.
——————–
2. Investors are paying a high premium for risky stocks.
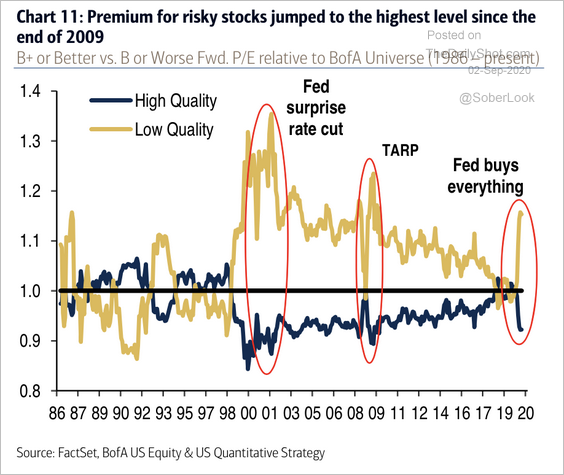 Source: BofA Securities
3. The least profitable US stocks have significantly outperformed the most profitable companies when weighted equally.
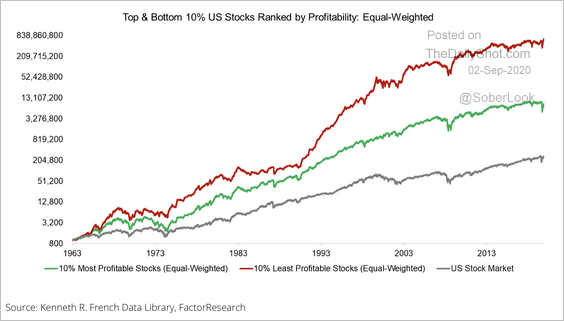 Source: FactorResearch
Here’s a performance ranking based on profitability of market-cap vs. equal-weighted.
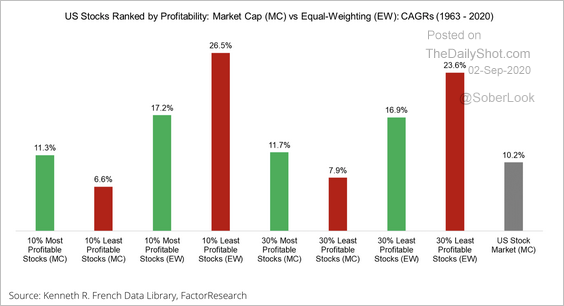 Source: FactorResearch
——————–
4. Recovering bear market losses have historically required remaining invested for about 1,100 trading days. This year’s recovery has been much swifter.
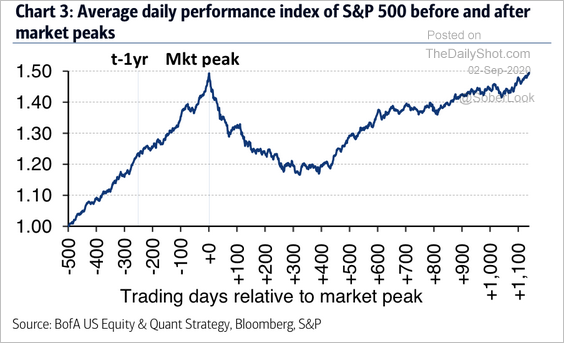 Source: BofA Securities
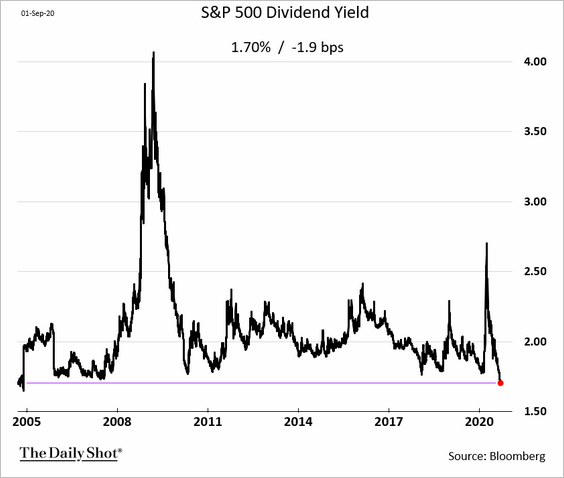
5. The S&P 500 dividend yield continues to plunge. It will be difficult to justify this trend if Treasury yields back up.
6. The correlation between the S&P 500 and the cumulative advance-decline line has broken down.
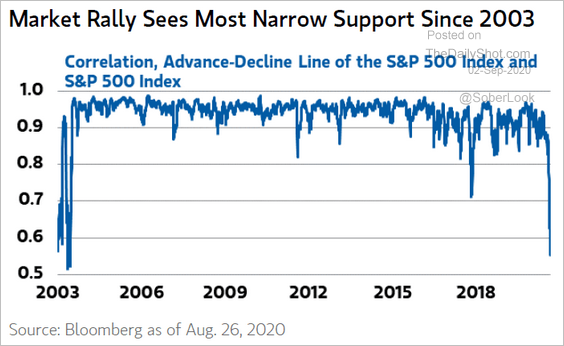 Source: @ISABELNET_SA, @MorganStanley Read full article
7. Valuation matters most for long-term stock returns, according to BofA.
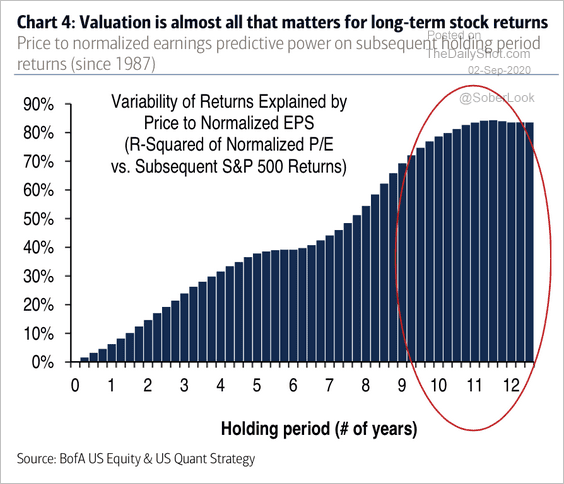 Source: BofA Securities
By the way, US stocks are trading at the highest valuation premium to European stocks since the 90s.
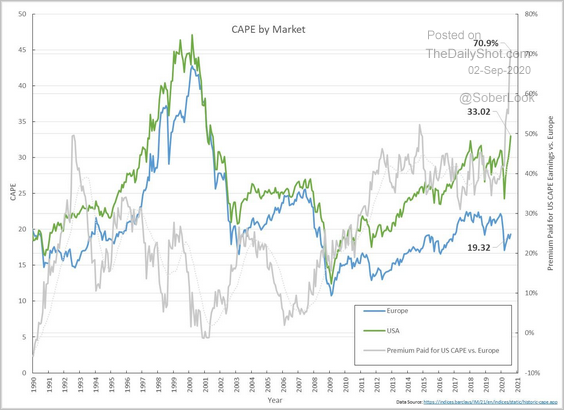 Source: Mitch Bollinger
——————–
8. The volatility market is pricing in substantial election risks.
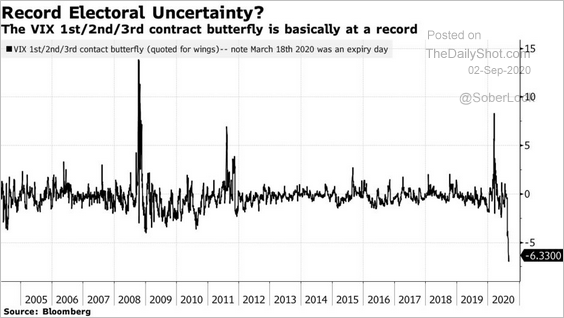 Source: @markets Read full article
9. Single-stock options with short maturities are extremely popular.
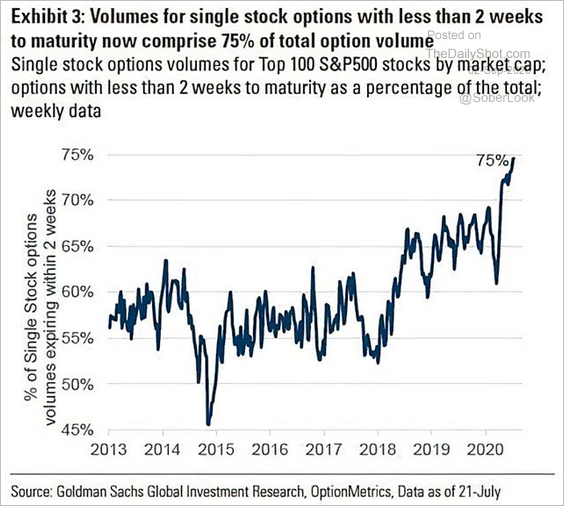 Source: @ISABELNET_SA, @GoldmanSachs
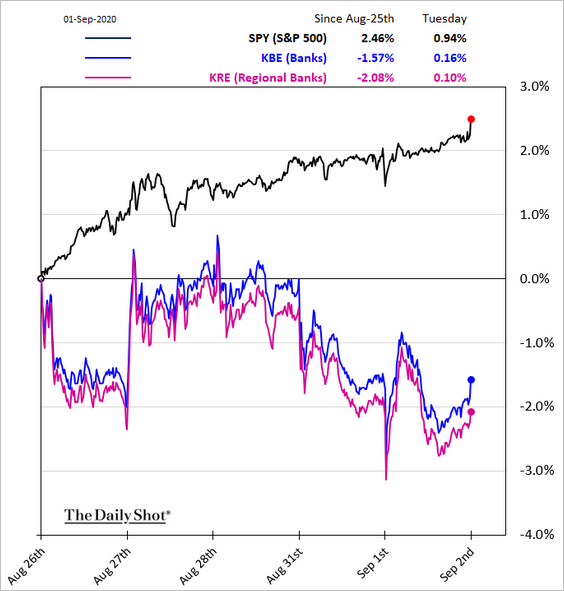
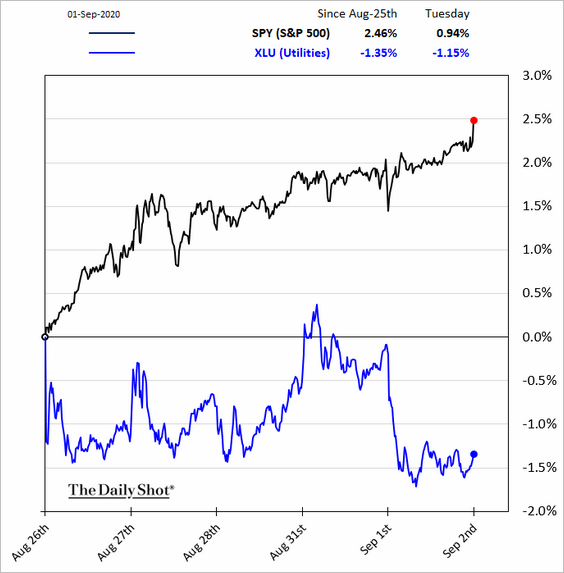
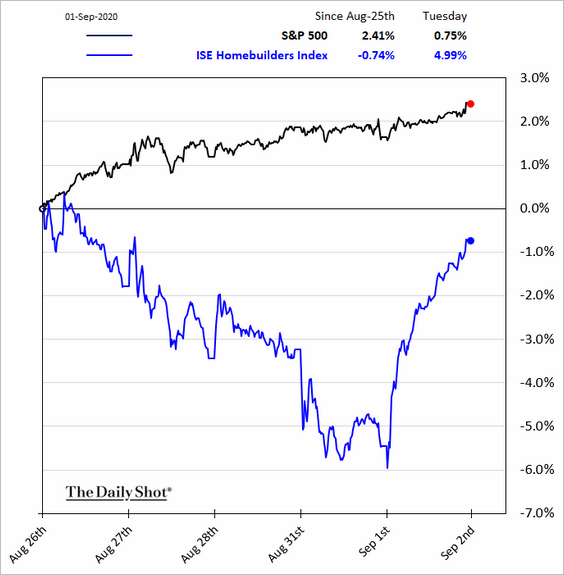
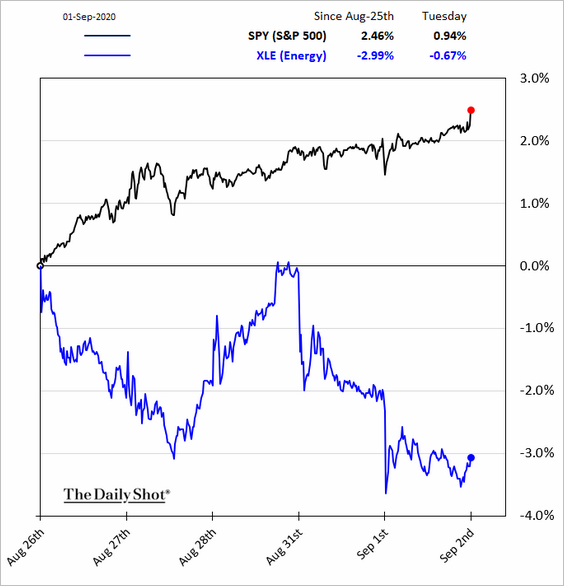
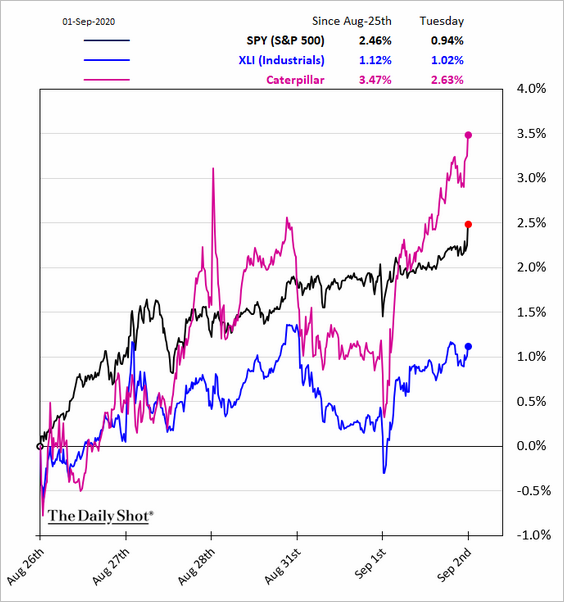
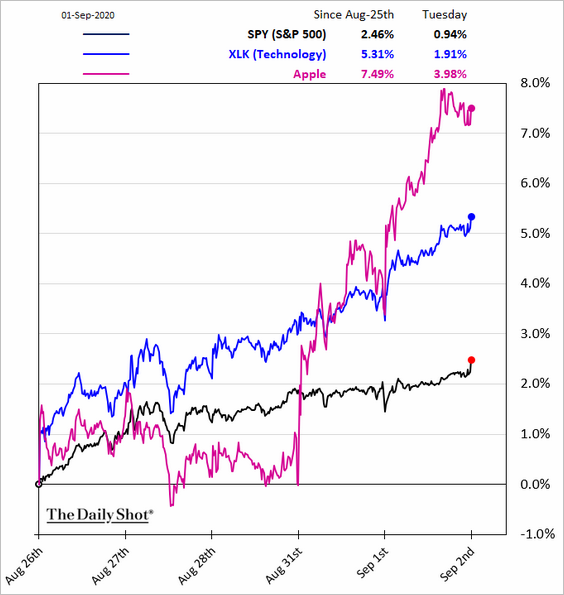
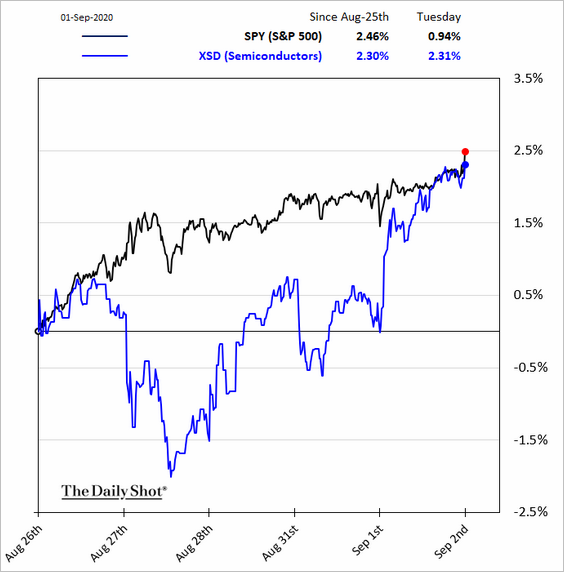
10. Finally, here are some sector performance updates (5 business days).
• Banks:
• Utilities:
• Homebuilders:
• Energy:
• Industrials:
• Tech and semiconductors:
• Movie theater stocks have been outperforming.
 Source: @WSJ Read full article
Credit
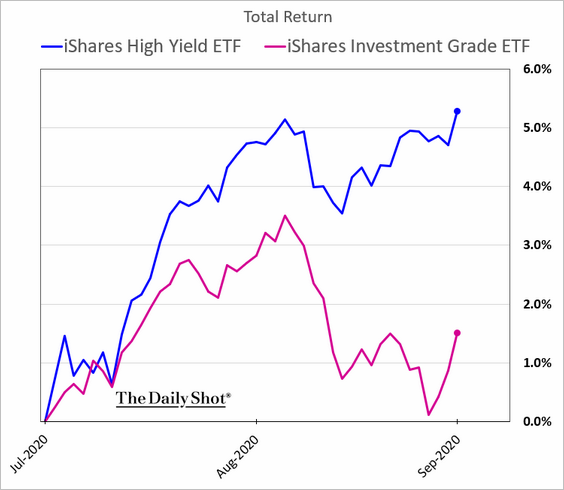
1. Investment-grade bonds have underperformed over the past few weeks as Treasury yields rose.
• Will investment-grade bond yields continue to trend down as the Fed holds the “lower for longer” pattern?
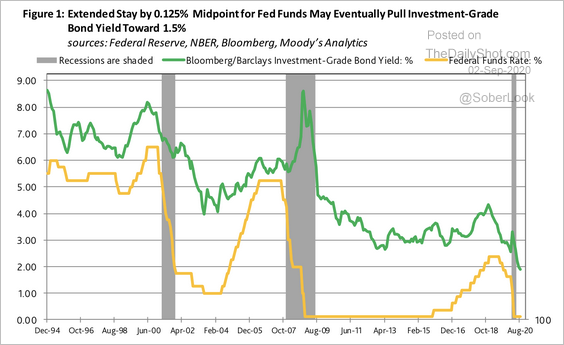 Source: Moody’s Analytics
• Real short-term corporate bond yields turned negative.
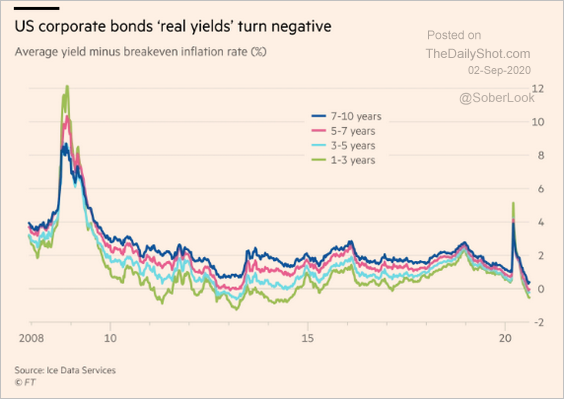 Source: @lisaabramowicz1, @FT Read full article
——————–
2. BofA’s wealth management clients have been cutting their bond allocations.
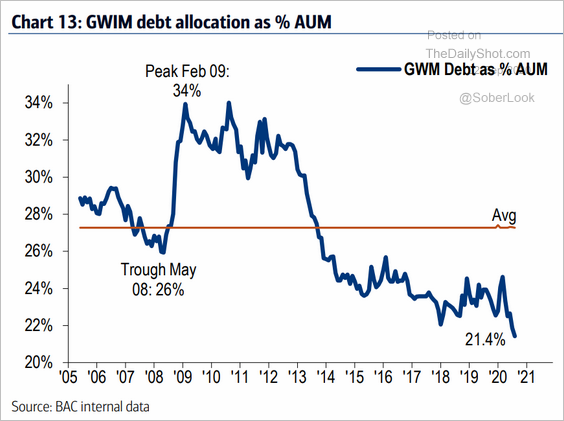 Source: BofA Merrill Lynch Global Research
3. What is a typical supply-chain finance transaction?
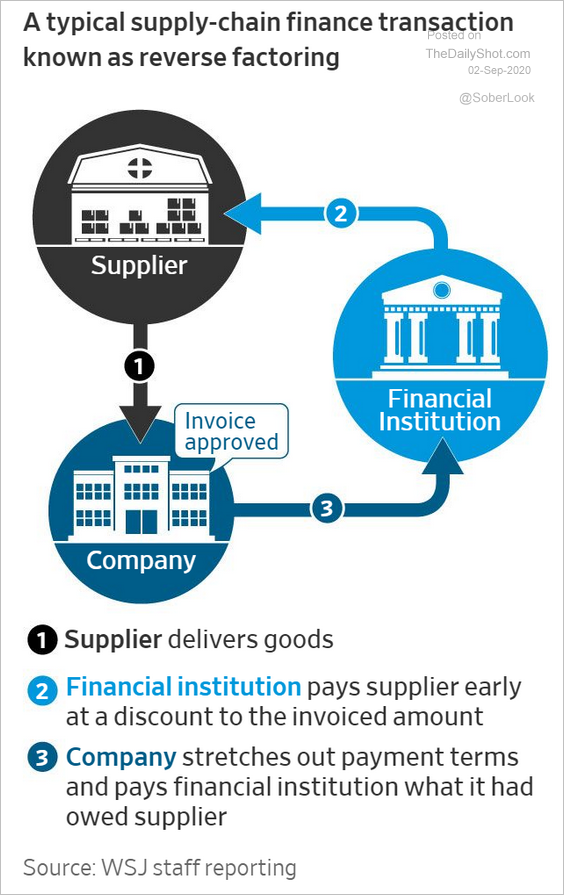 Source: @WSJ Read full article
Rates
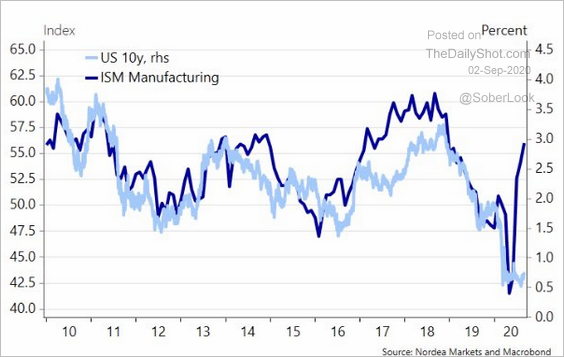
1. Various indicators continue to signal higher bond yields.
• ISM manufacturing:
 Source: @meremortenlund
• Copper:
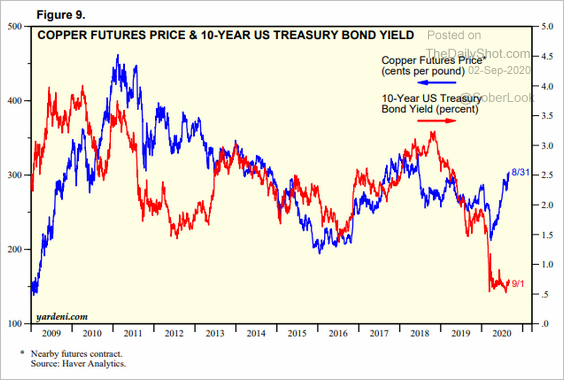 Source: Yardeni Research
——————–
2. The supply of both Treasuries and reserves rose to unprecedented levels this year.
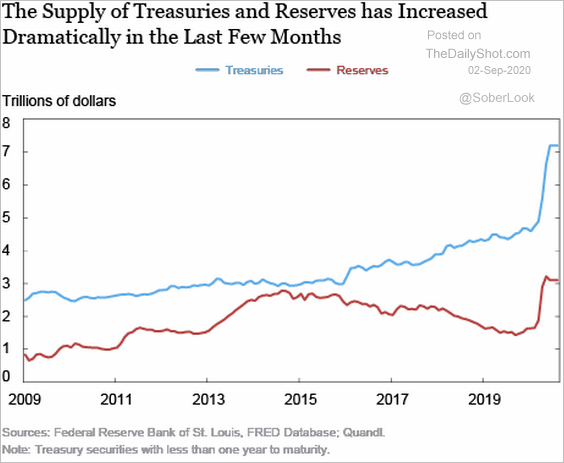 Source: Liberty Street Economics Read full article
——————–
Food for Thought
1. Homebuyers targeting suburbs and small towns:
 Source: @markets Read full article
2. “Outbound” and “inbound” states:
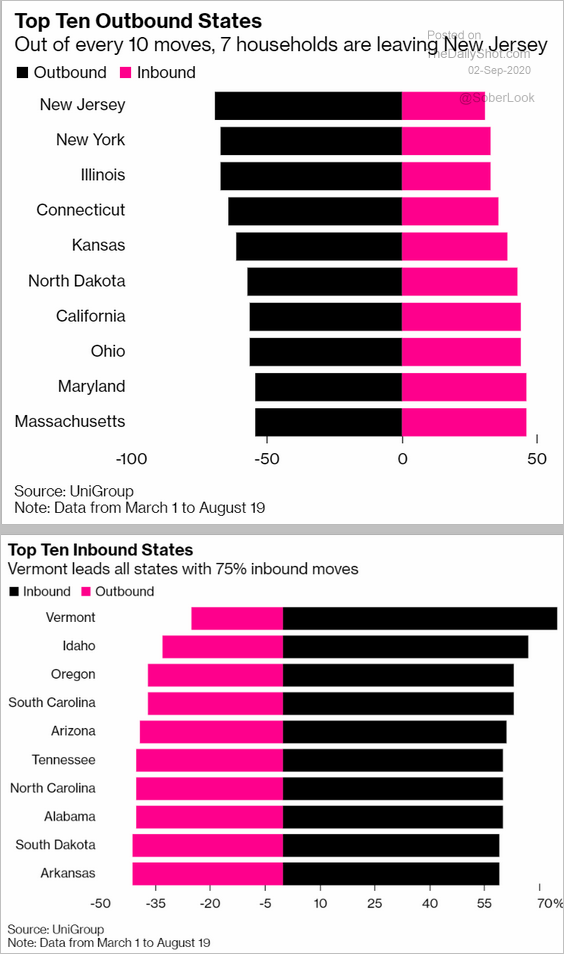 Source: @markets Read full article
3. Relocating:
 Source: @markets Read full article
——————–
4. 401k accounts at Fidelity:
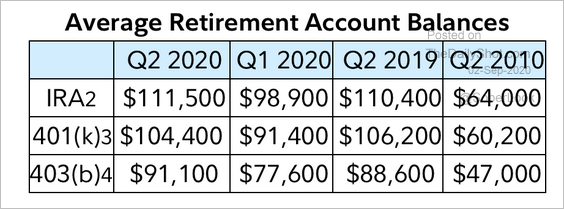 Source: Fidelity Investments Read full article
5. US budget deficit forecast:
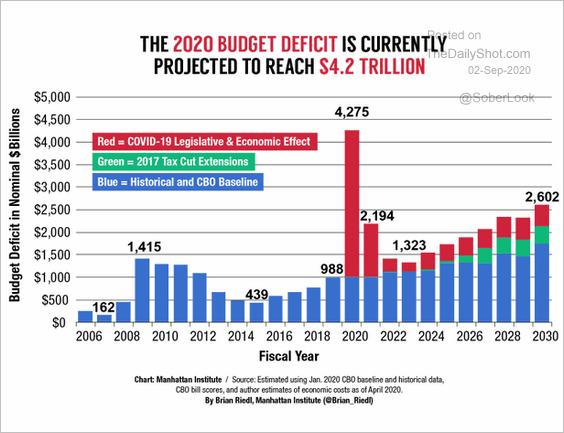 Source: @MI_Investments
6. Vaccine progress:
 Source: @WSJ Read full article
The percentage of people who believe vaccines are safe:
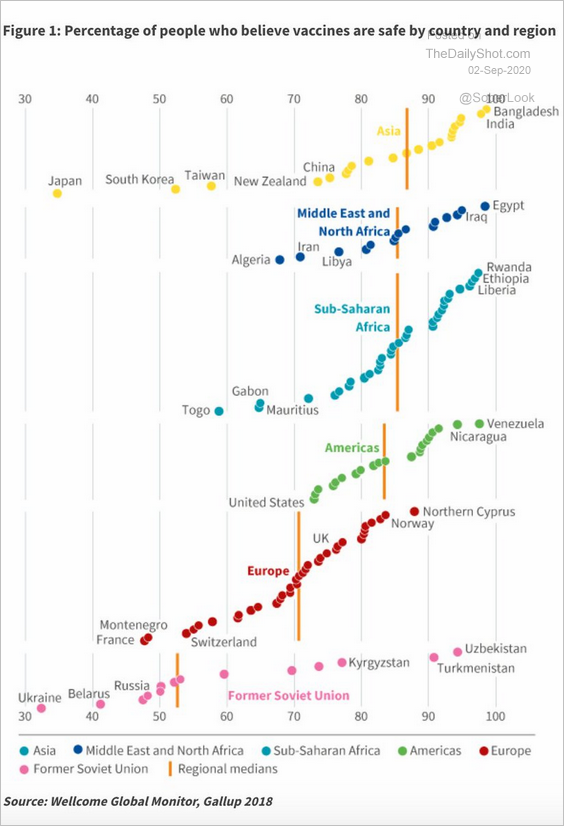 Source: @adam_tooze Read full article
——————–
7. President Trump’s approval ratings abroad:
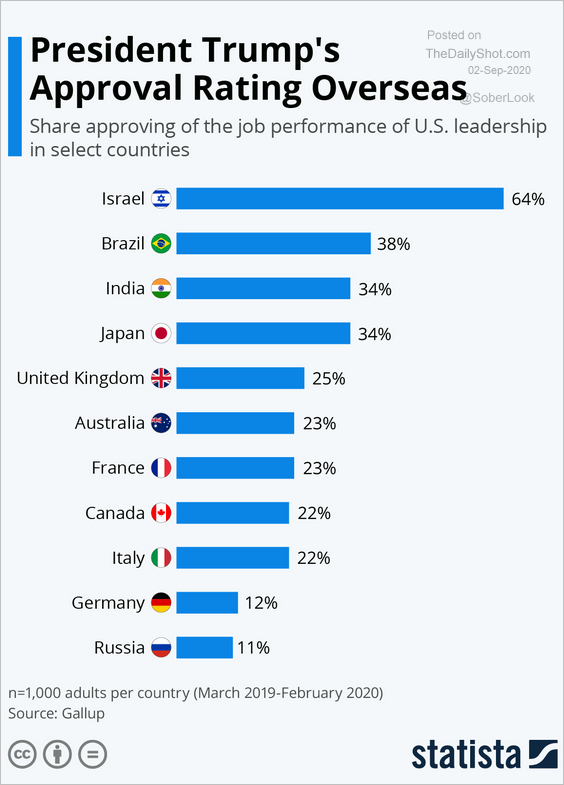 Source: Statista
8. Staycations:
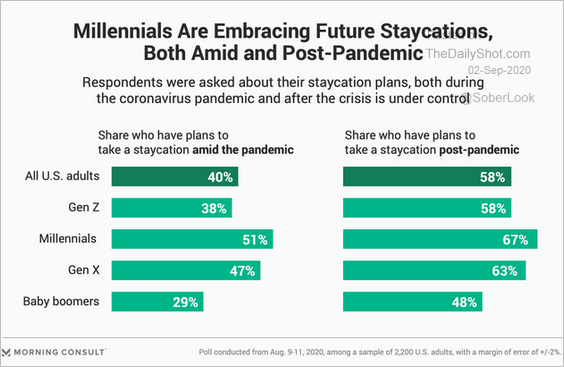 Source: @MorningConsult Read full article
——————–