
The Daily Shot: 08-Sep-20
• The United States
• Canada
• The United Kingdom
• The Eurozone
• Japan
• Asia – Pacific
• China
• Emerging Markets
• Commodities
• Energy
• Equities
• Rates
• Food for Thought
The United States
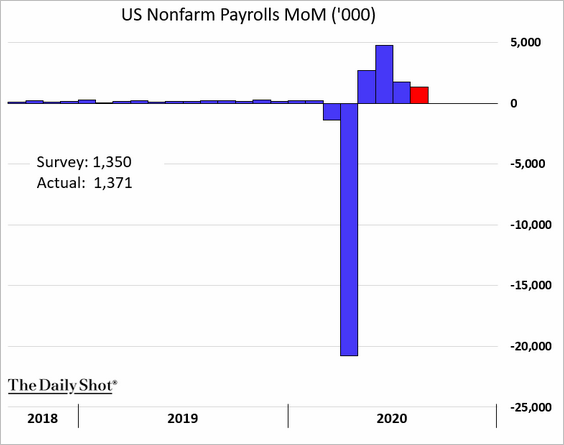
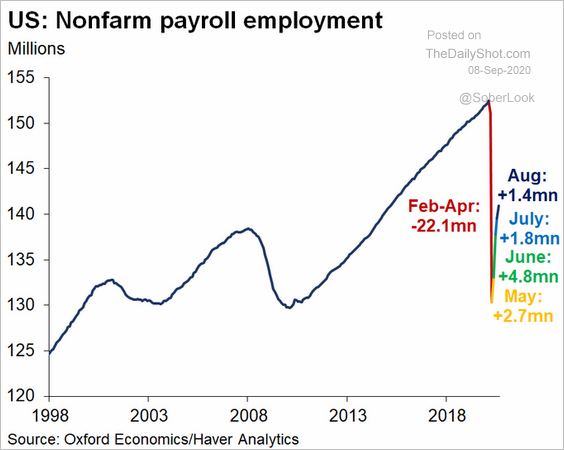
1. Let’s begin with Friday’s payrolls report, which topped economists’ forecasts.
– Month-over-month changes:
– US employment level:
 Source: @GregDaco
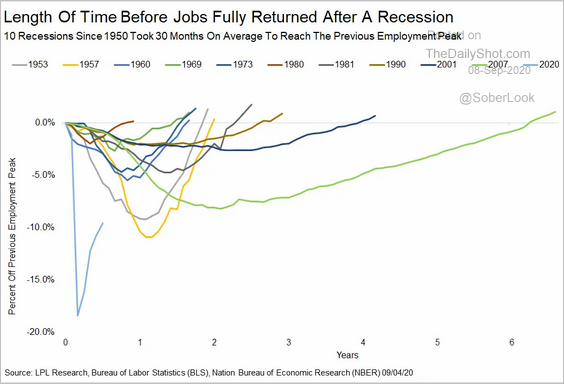
• Here is the current recovery compared to previous cycles.
 Source: LPL Research
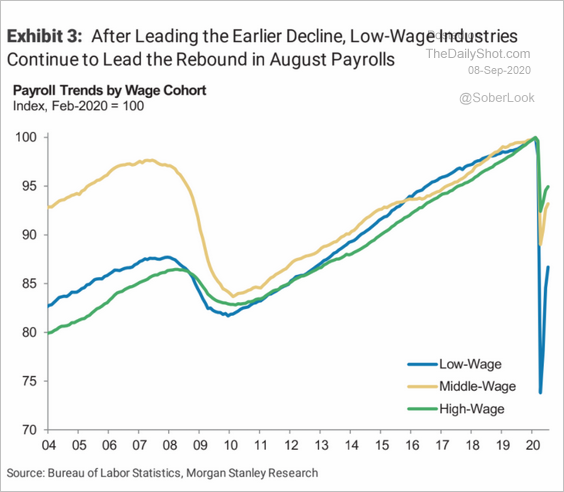
– The hiring rebound for low-wage workers has been the quickest, but there is a long way to go.
 Source: Morgan Stanley Research
– Low-wage workers saw the greatest cuts in employment income since the start of the crisis.
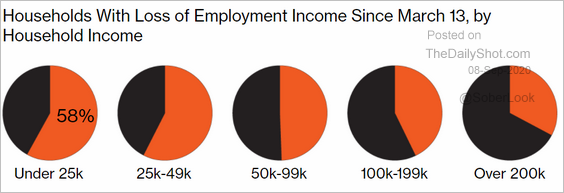 Source: @BW Read full article
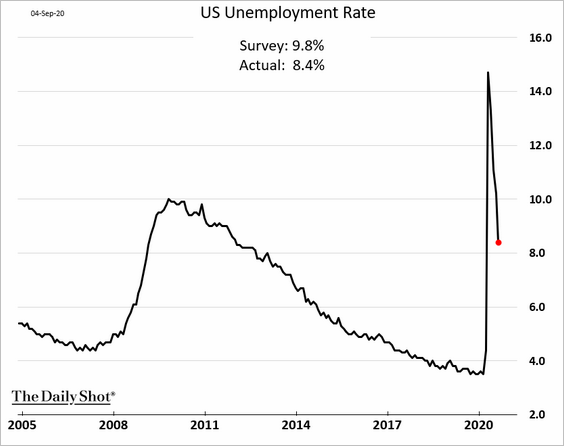
• The unemployment rate dipped below 9%.
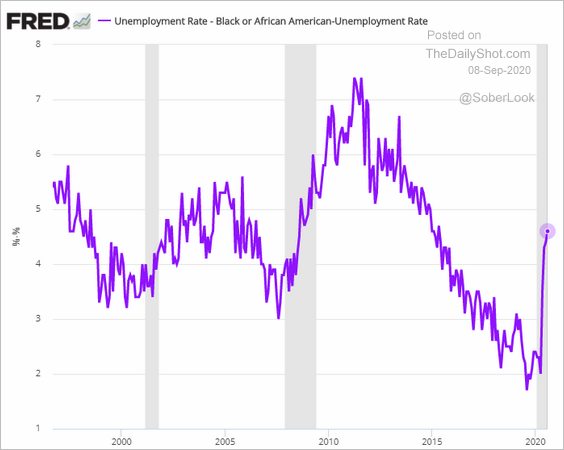
– This chart shows the widening gap between African Americans’ unemployment rate vs. the overall US workforce.
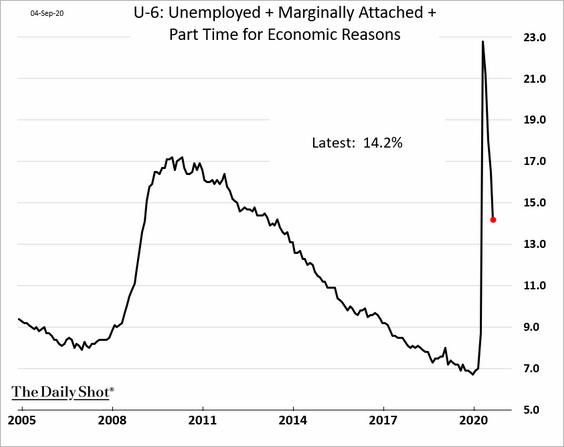
• The U-6 measure of underemployment fell below 15%.
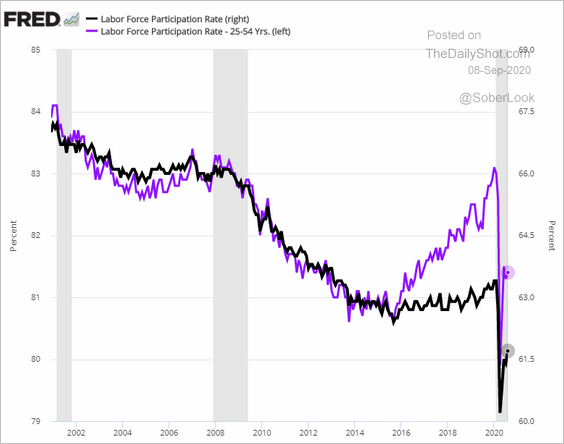
• The recovery in the prime-age labor force participation rate has stalled for now.
• Companies with the “lightest” workforce have been rewarded by the stock market, and there is a concern that many firms will not want to return staffing to pre-crisis levels.
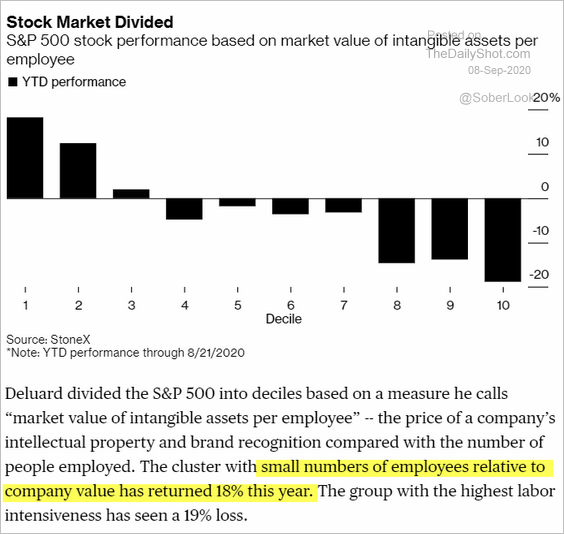 Source: @markets Read full article
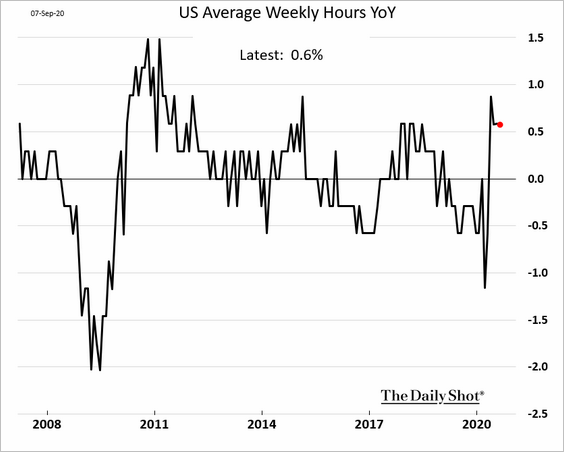
– Companies are giving their current employees more hours.
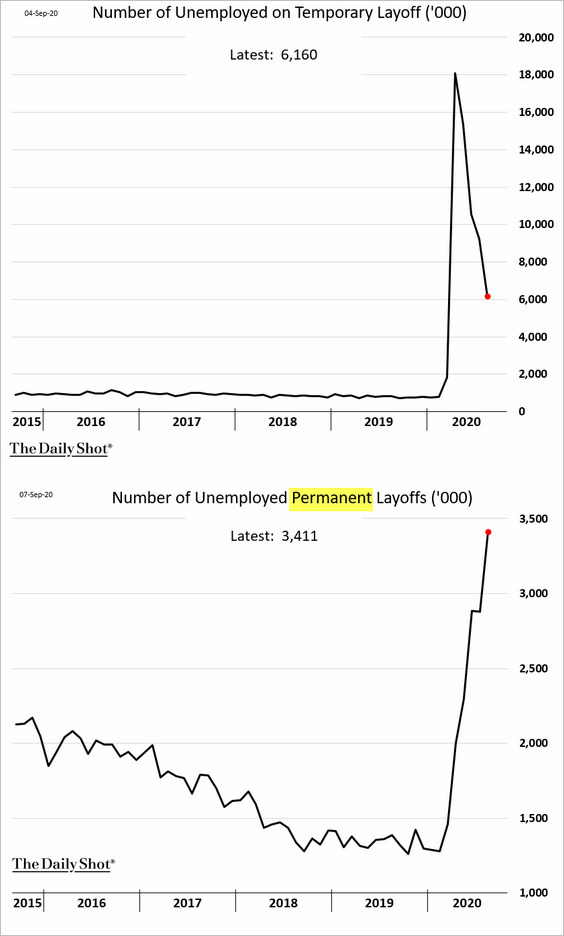
– Permanent layoffs keep climbing (second chart).
——————–
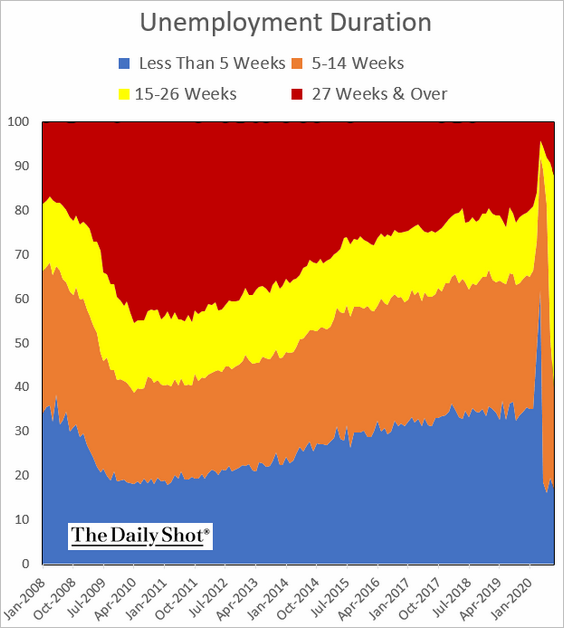
• Here are a few other updates from the employment report.
– Unemployment duration:
– The breakdown of labor market changes since February:
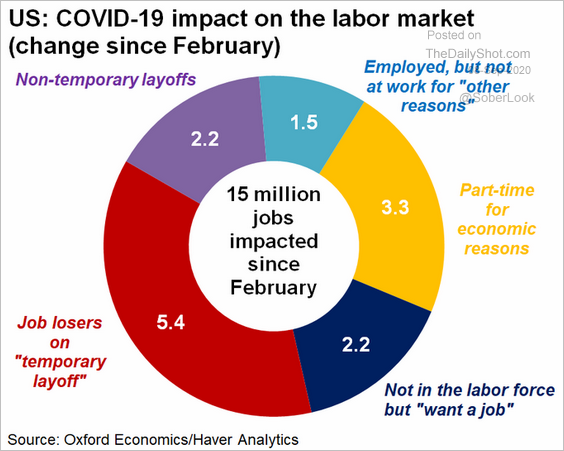 Source: @GregDaco
– Best and worst-performing sectors:
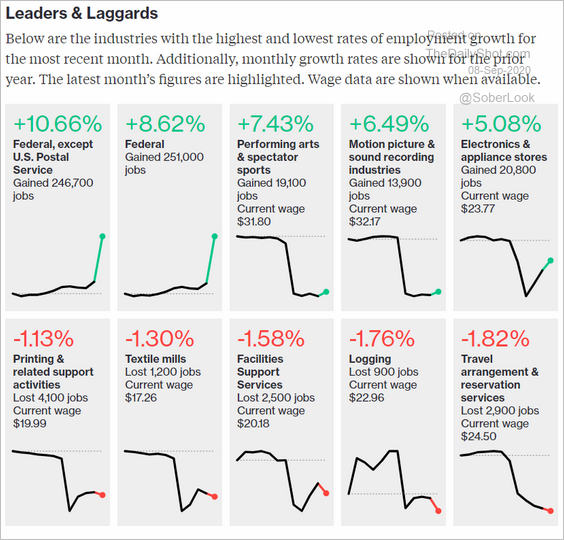 Source: @bbgvisualdata Read full article
——————–
2. High-frequency indicators point to a gradual recovery.
• The ANZ recovery tracker (similar to what we saw from Oxford Economics last week):
![]() Source: ANZ Research
Source: ANZ Research
• Consumer spending by income:
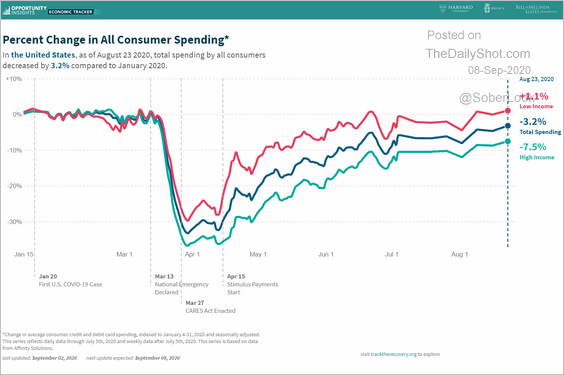 Source: Opportunity Insights
——————–
3. Morgan Stanley’s retail sales tracker shows an improvement in August.
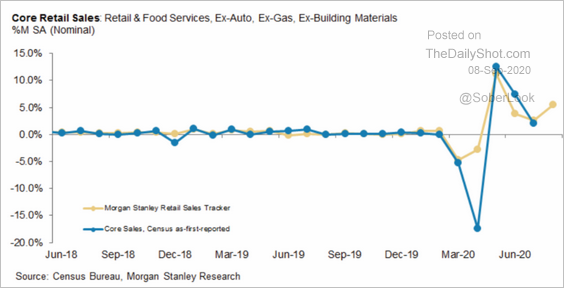 Source: Morgan Stanley Research
4. There has been a substantial increase in households that “sometimes or often” go hungry.
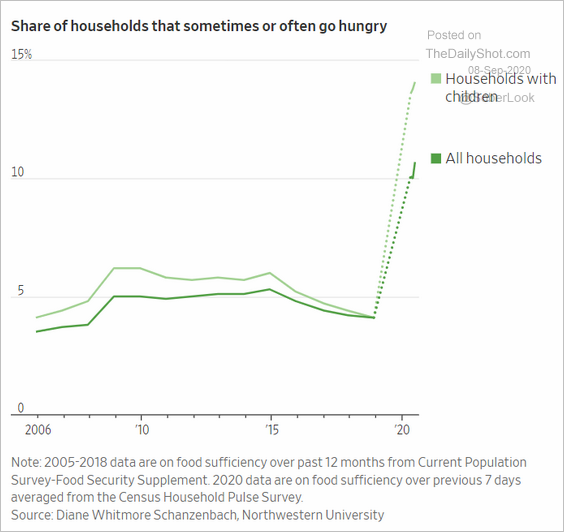 Source: @WSJ Read full article
Many can’t cover basic expenses.
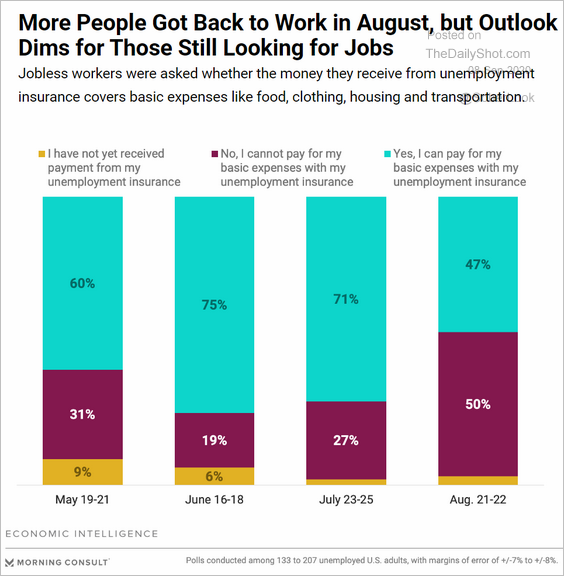 Source: Morning Consult Read full article
Canada
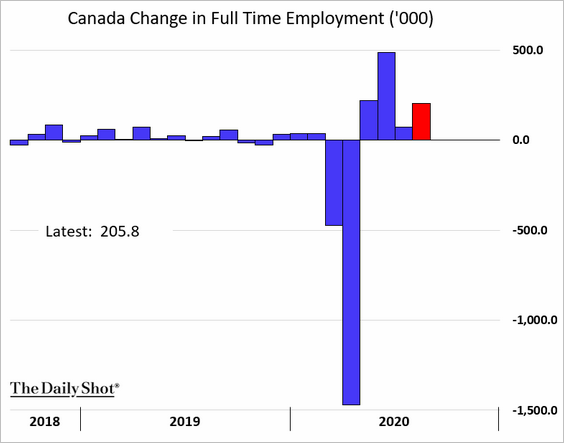
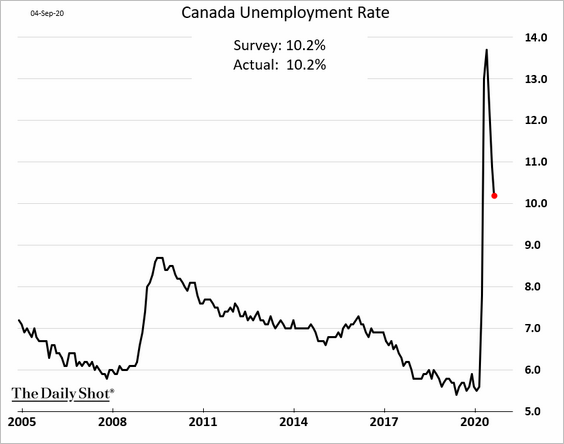
1. The August payrolls report was solid, with the labor market adding over 200k full-time jobs.
• The unemployment rate continued to decline but was still above 10% last month.
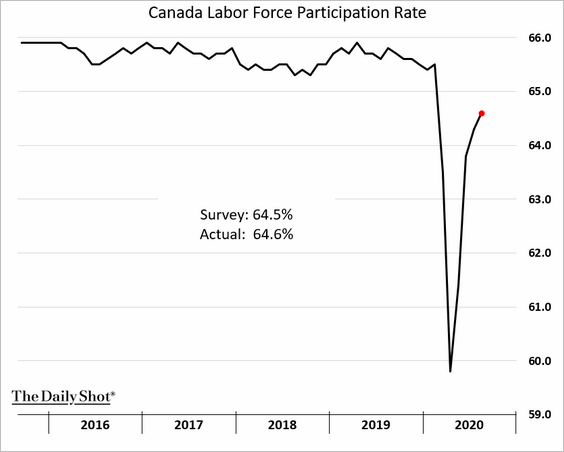
• The participation rate is improving.
• Here is the breakdown by sector.
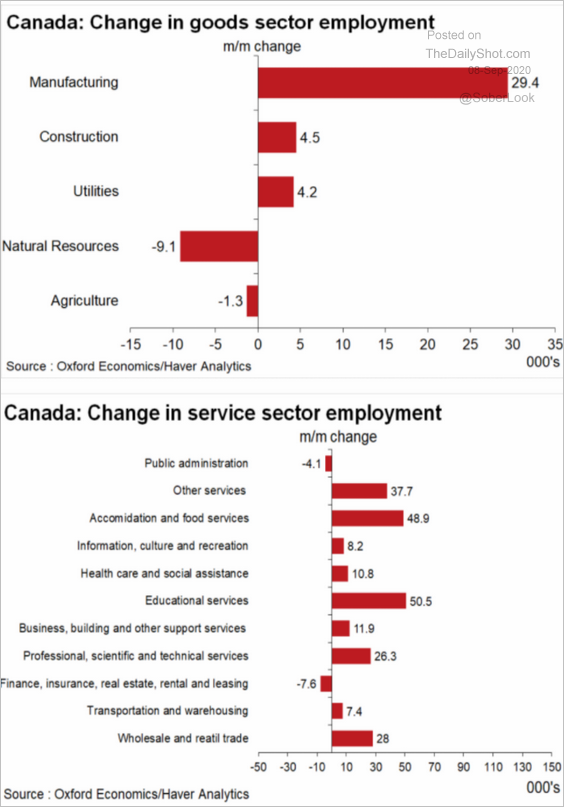 Source: Oxford Economics
——————–
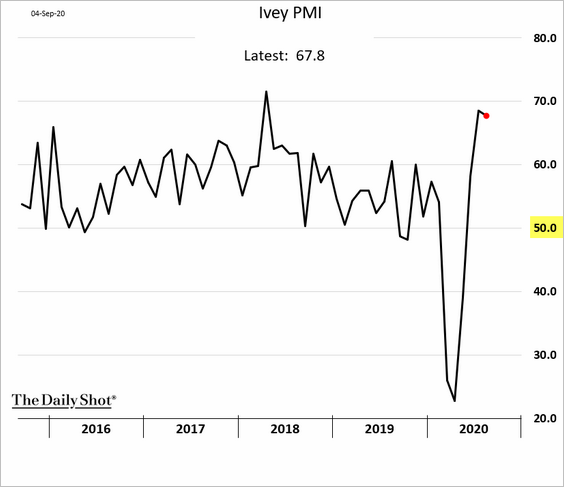
2. Business activity is expanding rapidly.
3. Corporate bankruptcies are back to pre-crisis levels (the title should say “filing”).
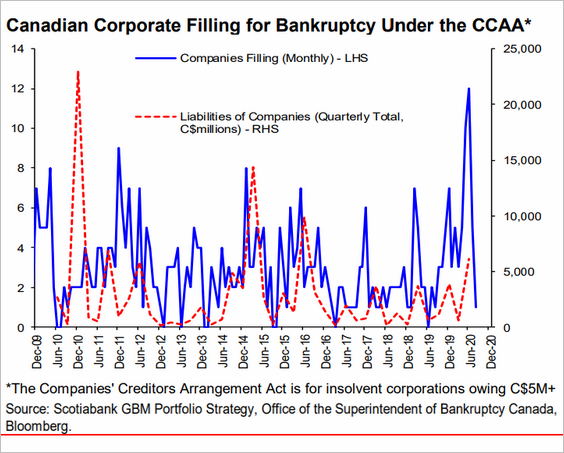 Source: Hugo Ste-Marie, Portfolio & Quantitative Strategy Global Equity Research, Scotia Capital
4. Canada’s trade is recovering.
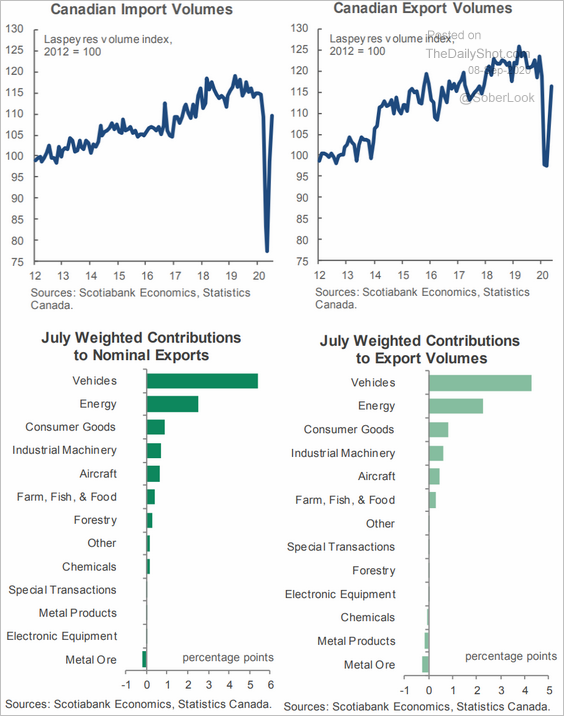 Source: Scotiabank Economics
The United Kingdom
1. The pound has been under pressure as Brexit concerns resurface.
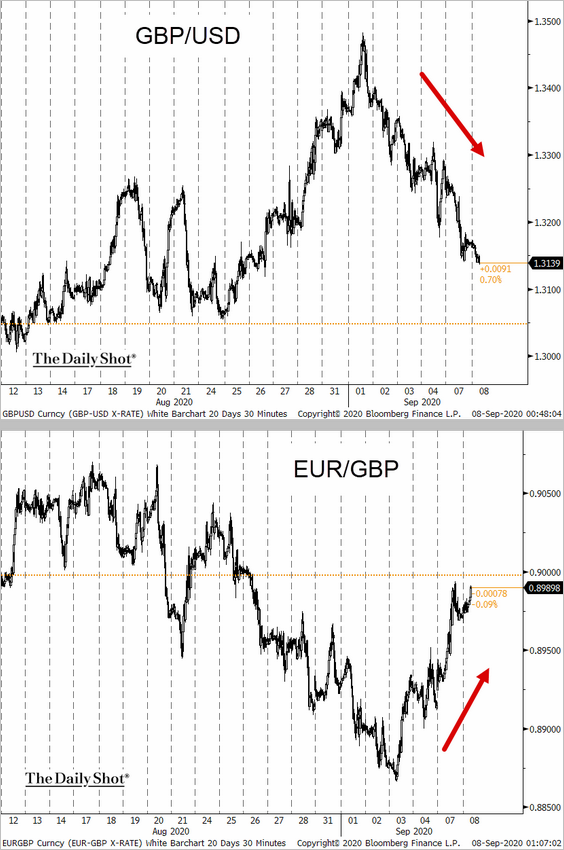 Source: @TheTerminal, Bloomberg Finance L.P.
 Source: Reuters Read full article
 Source: Politico Read full article
——————–
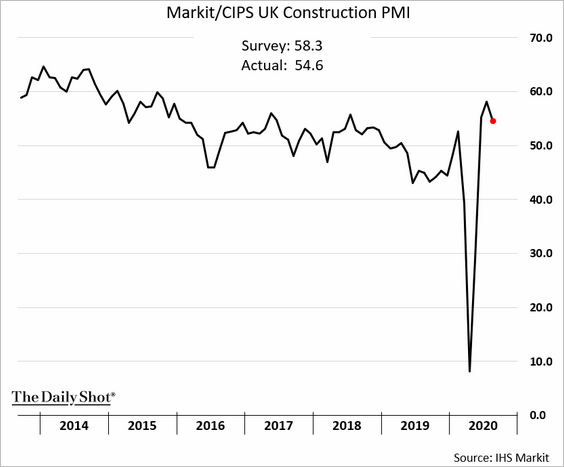
2. Growth in construction activity has slowed.
3. The second wave could pressure the recovery.
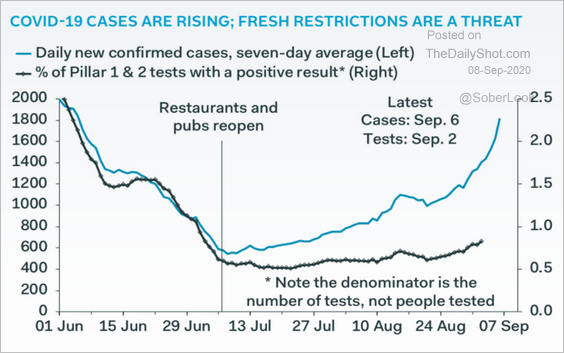 Source: Pantheon Macroeconomics
4. This chart shows companies’ claims under the job retention scheme.
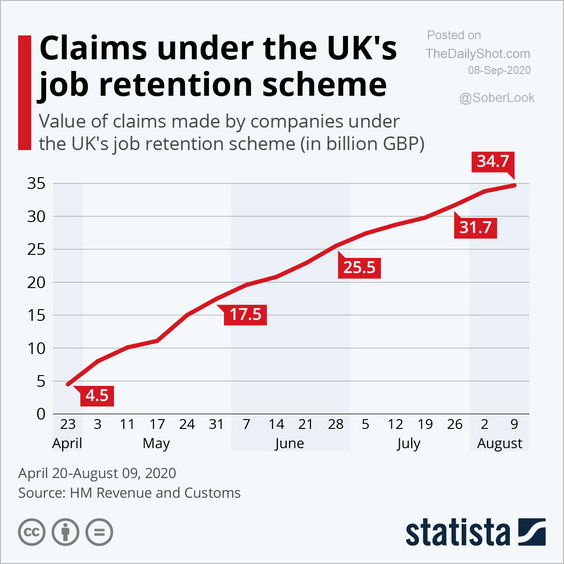 Source: Statista
5. While the budget deficit widening has been severe, it has been running below government forecasts.
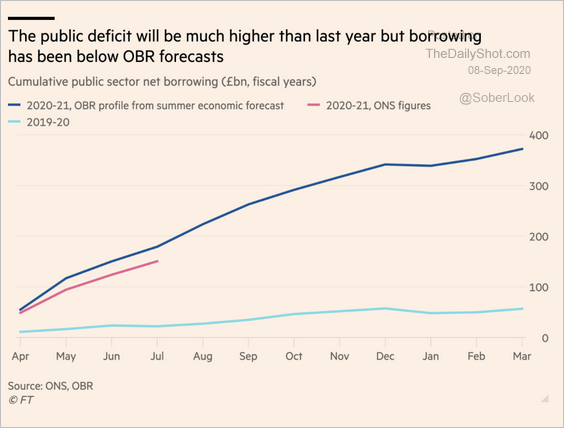 Source: @financialtimes Read full article
The Eurozone
1. Germany’s factory orders and industrial production have been disappointing (data as of July).
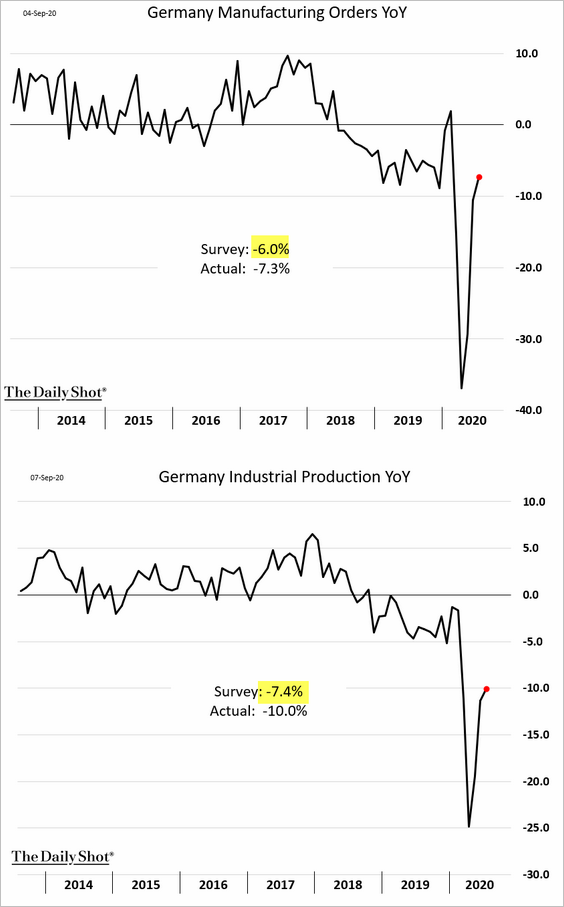
But survey data point to further improvement in August.
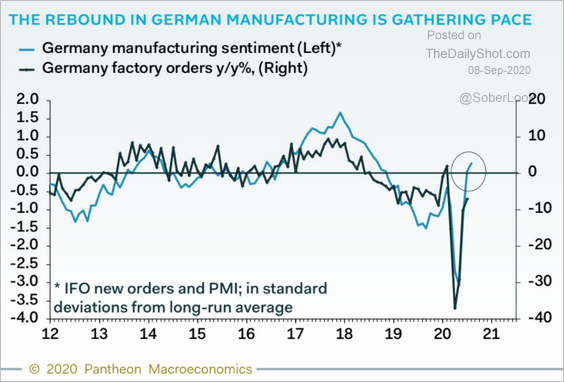 Source: Pantheon Macroeconomics
——————–
2. Bund yields have been in a tight trading range, with the ECB depressing volatility.
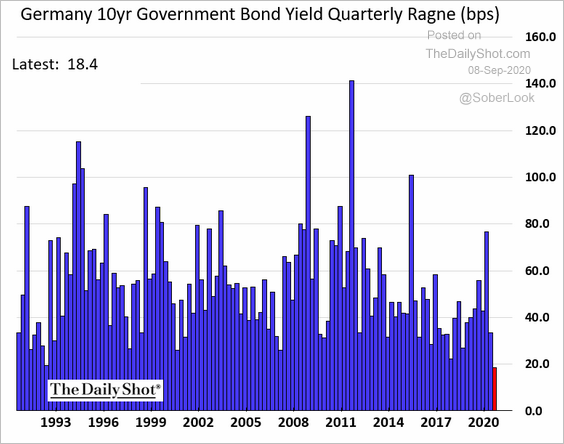 h/t @johnainger, @TheTerminal, Bloomberg Finance L.P.
3. Spain’s second wave stands out.
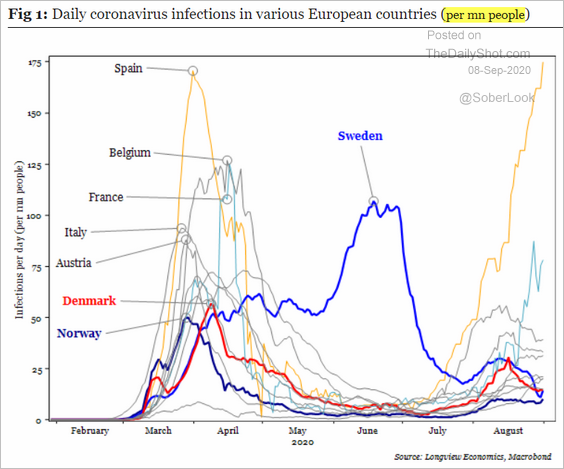 Source: Longview Economics
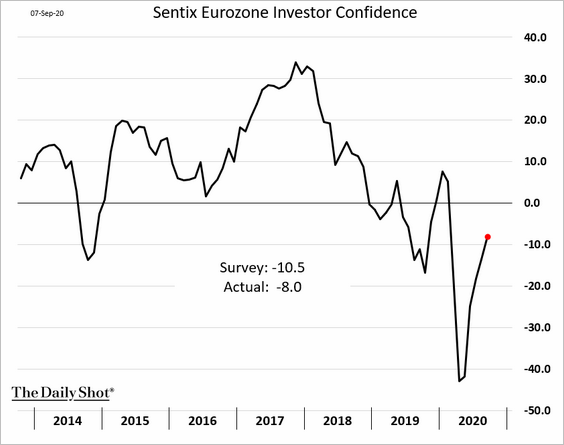
4. Euro-area investor sentiment continues to recover.
5. PMI data suggest that inflation has bottomed.
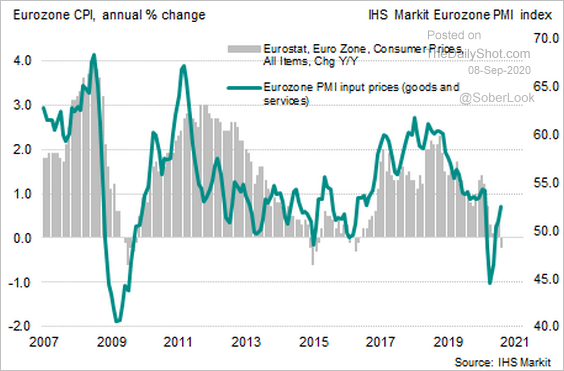 Source: @WilliamsonChris, @IHSMarkitPMI
Japan
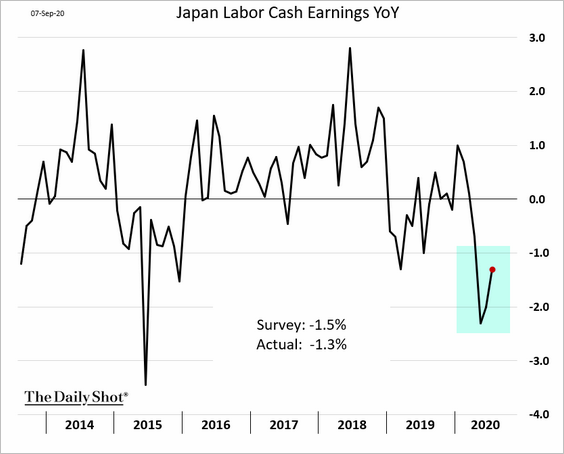
1. Wage recovery will take time.
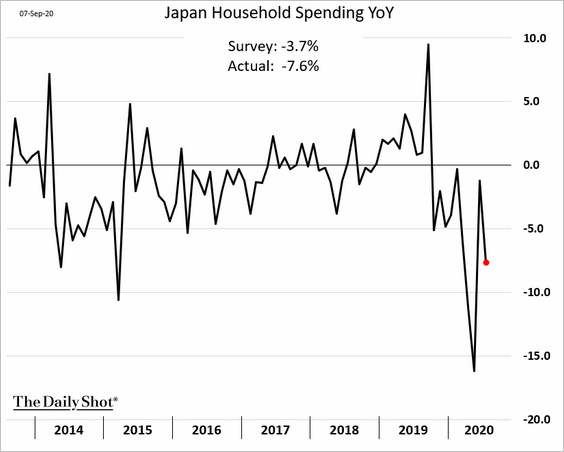
2. Household spending deteriorated again in July.
3. The labor market remains soft.
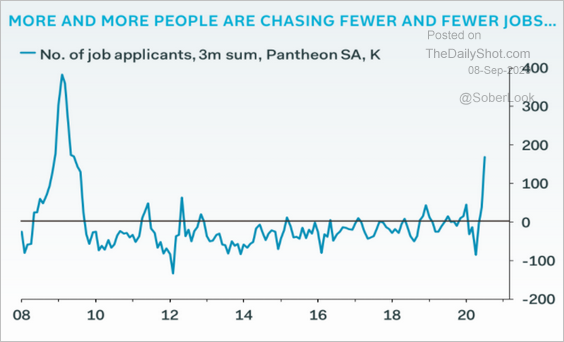 Source: Pantheon Macroeconomics
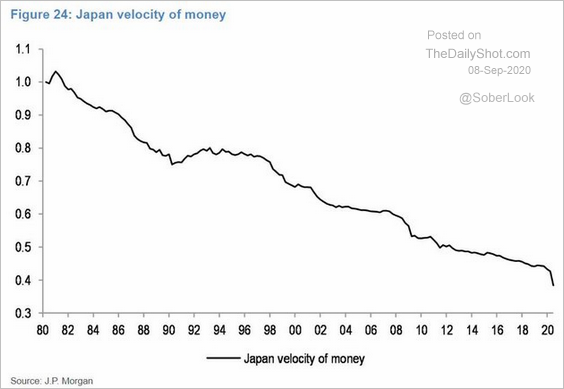
4. Growth in bank lending has been impressive, driven by corporate demand for credit.
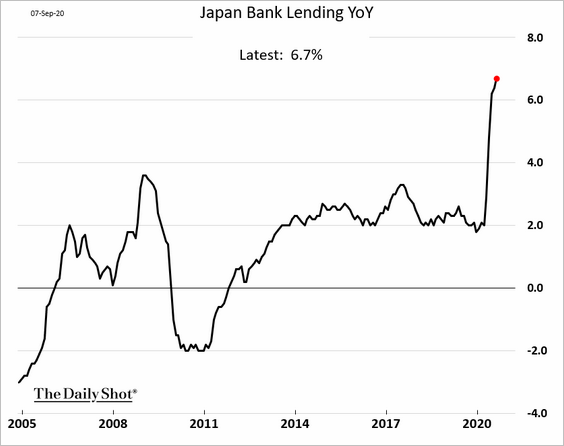
But all this credit expansion is not translating into faster economic growth. Here is the velocity of money.
 Source: J.P. Morgan, @jsblokland
——————–
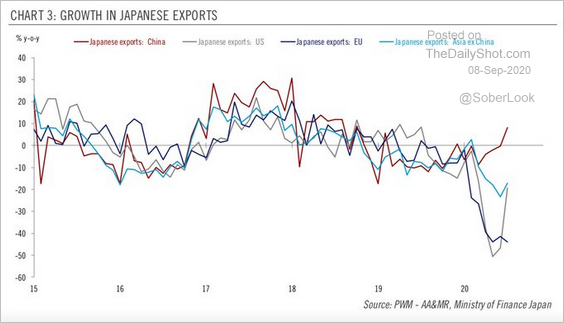
5. Finally, this chart shows the year-over-year changes in Japan’s exports (by destination).
 Source: @PictetWM
Asia – Pacific
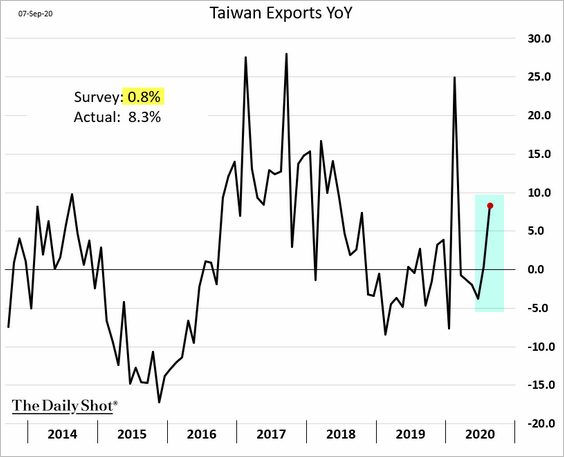
1. Taiwan’s exports strengthened again.
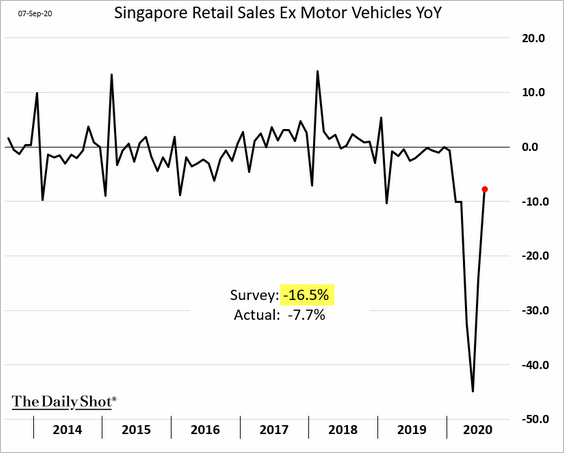
2. Singapore’s July retail sales surprised to the upside.
3. Retail space vacancy rates in Hong Kong and Singapore have been climbing.
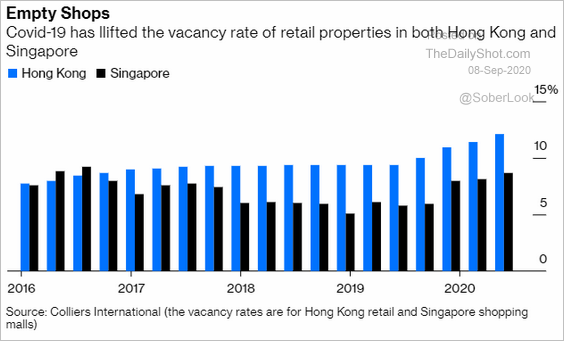 Source: @andymukherjee70, @bopinion Read full article
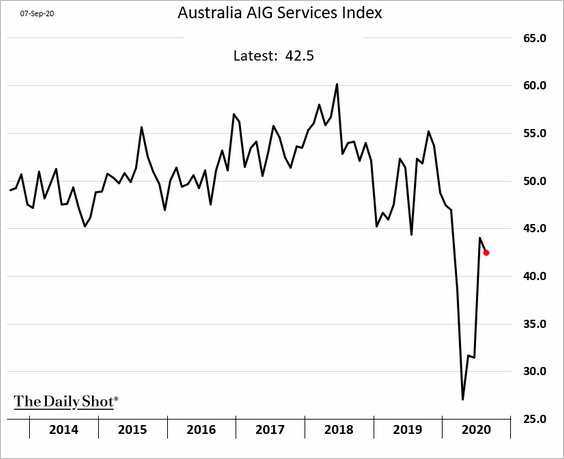
4. Next, we have some updates on Australia.
• Service-sector activity remains weak.
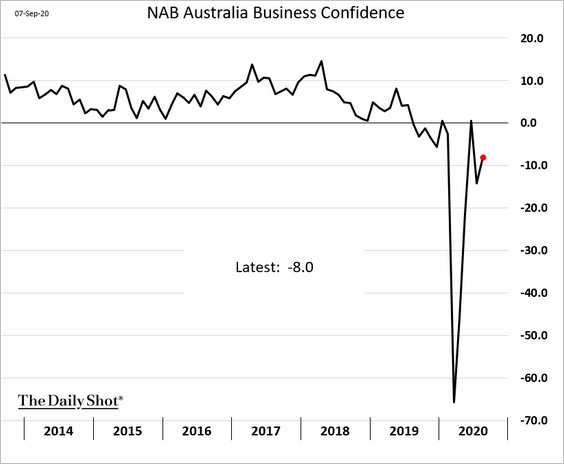
• Business confidence ticked higher.
• Online card spending continues to rise.
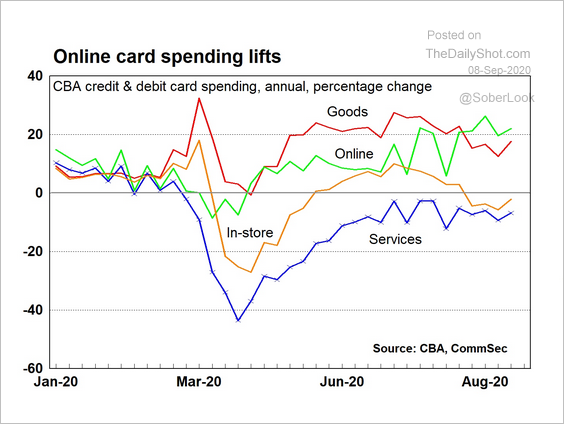 Source: CBA, @CommSec
• Personal credit has contracted sharply this year.
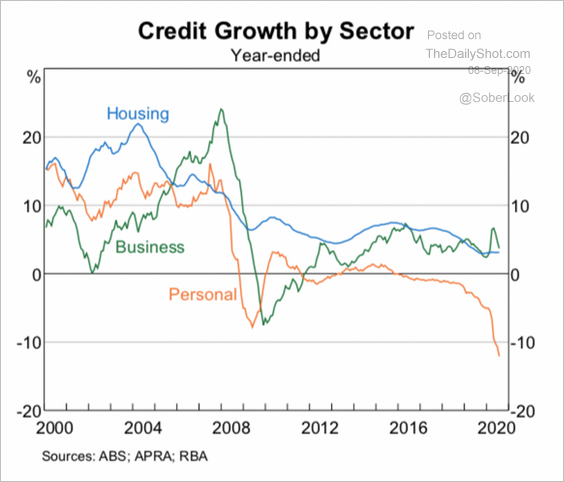 Source: RBA
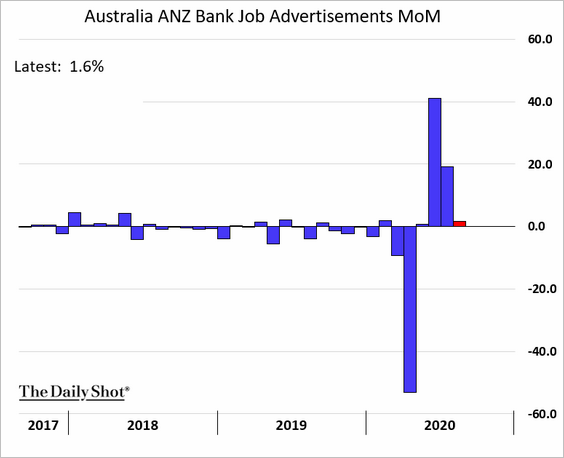
• Growth in job ads slowed last month.
• Outside of Victoria, payrolls are improving.
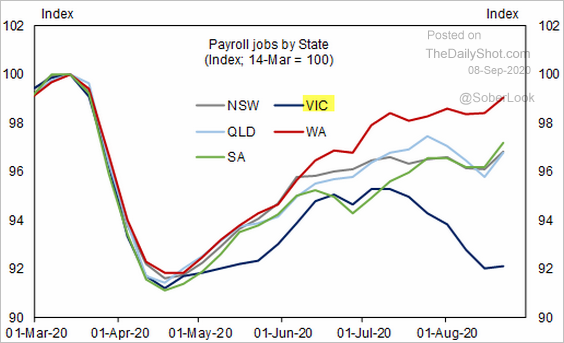 Source: Goldman Sachs
• Is the Australian housing market nearing a bottom?
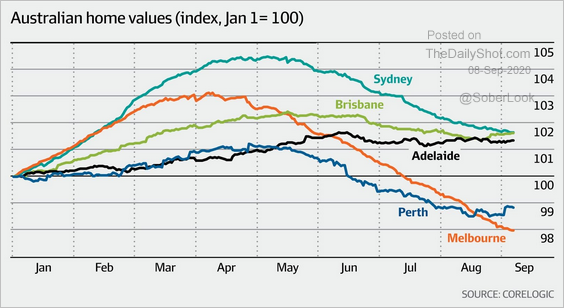 Source: @cjoye Read full article
• Finally, this chart shows Australia’s portfolio flows over the past two decades.
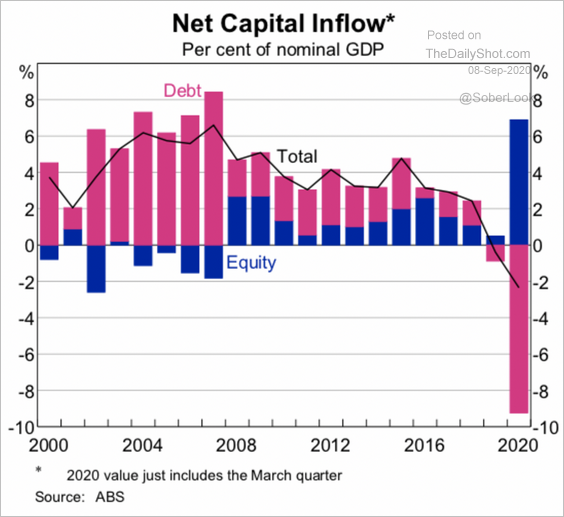 Source: RBA
China
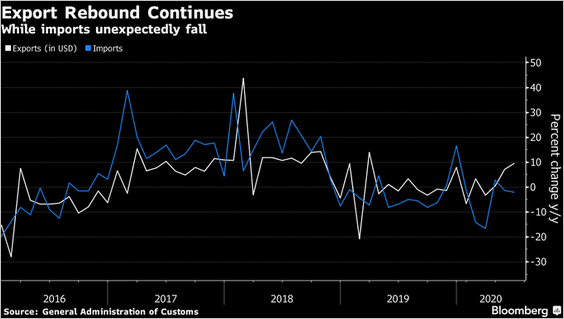
1. Exports remain robust.
2. This chart shows loan growth by sector.
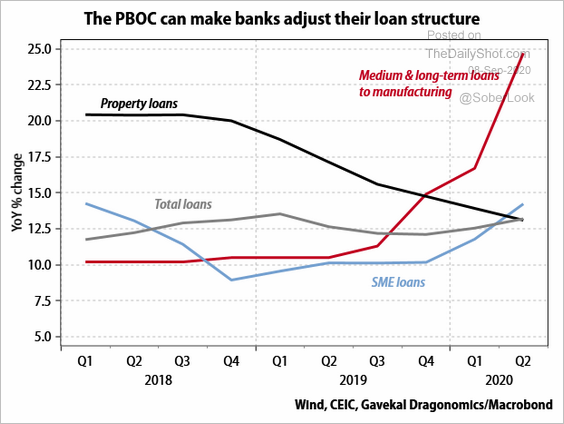 Source: Gavekal
3. The US and China’s core CPI rates have diverged.
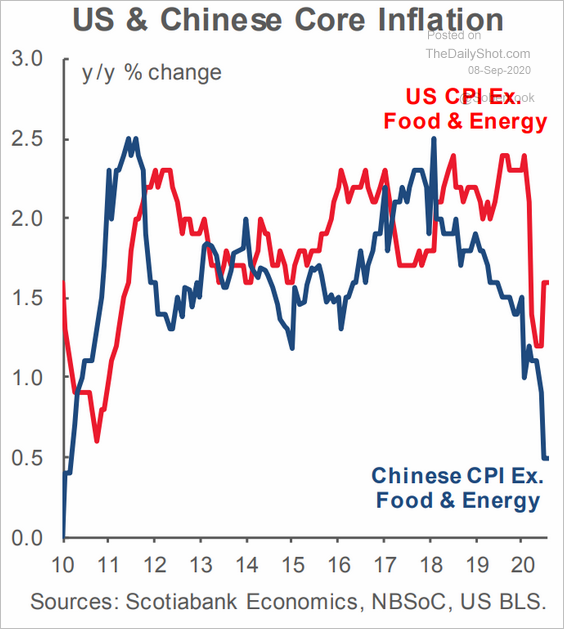 Source: Scotiabank Economics
4. Hong Kong’s stock market underperformance continues to widen (MXAP = MSCI Asia-Pacific Index).
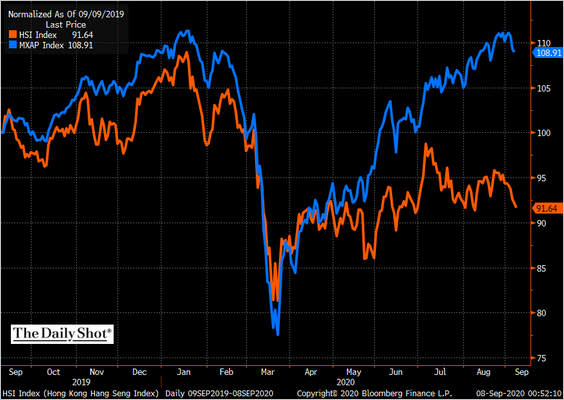 Source: @TheTerminal, Bloomberg Finance L.P.
Emerging Markets
1. The Turkish lira is hitting record lows vs. USD.
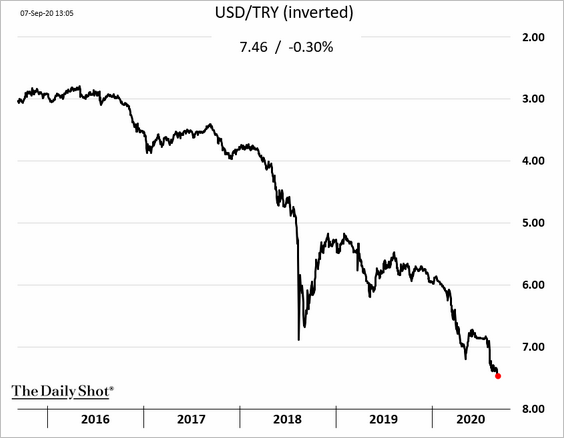
Nonetheless, the nation’s imports have been recovering.
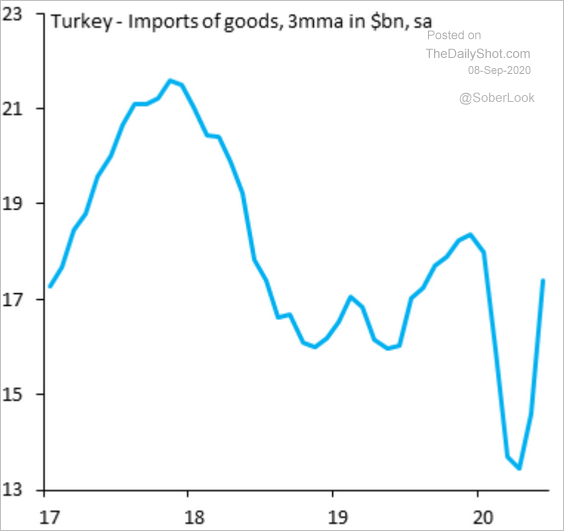 Source: @SergiLanauIIF
——————–
2. The Russian ruble has underperformed its EM/commodity peers since July.
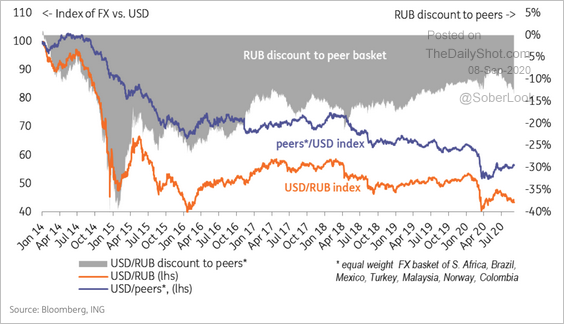 Source: ING
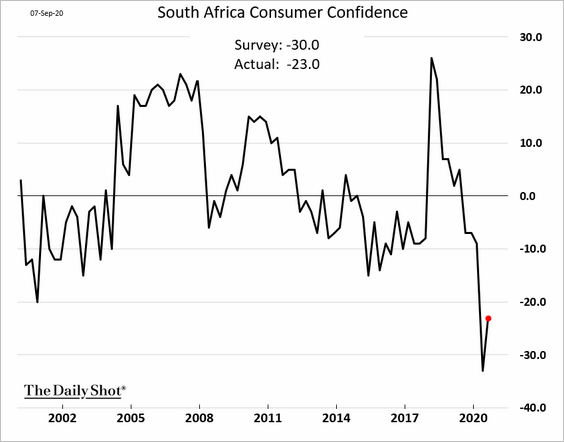
3. South Africa’s consumer sentiment is starting to recover from record lows.
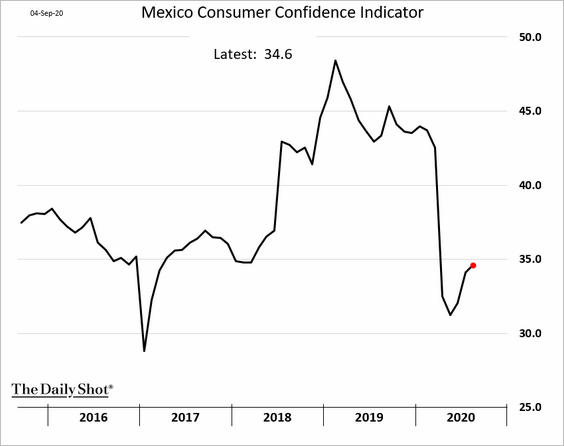
4. Here is Mexico’s consumer confidence.
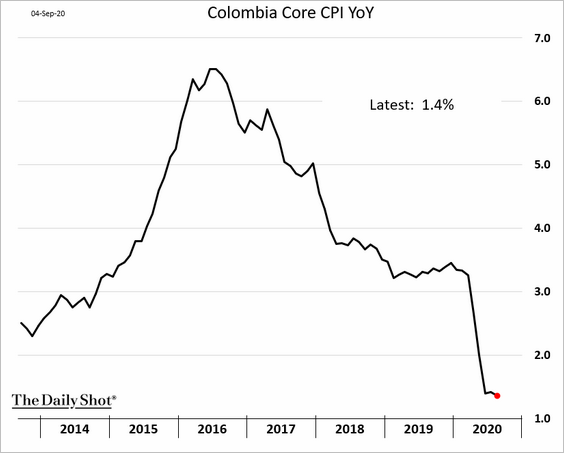
5. Colombia’s core CPI is at record lows.
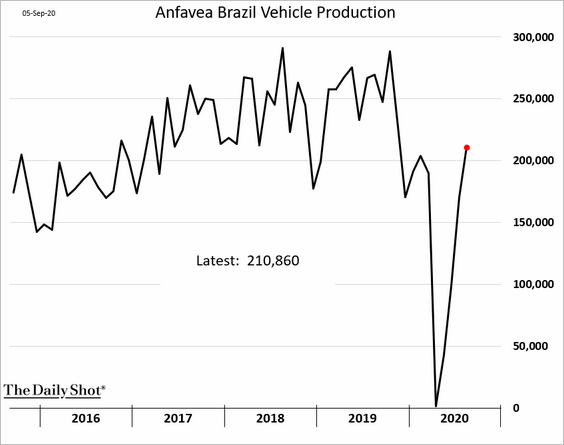
6. Brazil’s vehicle production had a v-shaped recovery.
Commodities
1. China’s copper demand spiked this year.
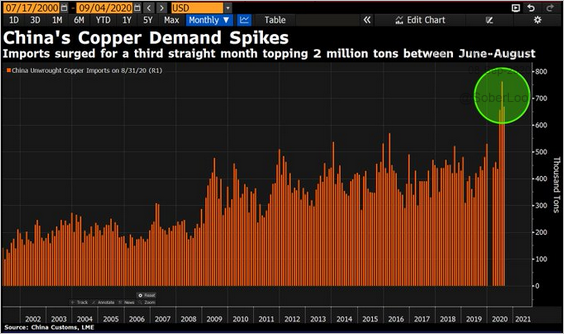 Source: @DavidInglesTV
Improved demand combined with tight inventory levels has boosted copper prices this year.
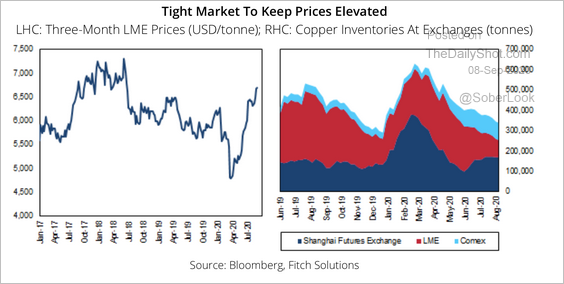 Source: Fitch Solutions Macro Research
——————–
2. Industrial commodities buyer activity has accelerated in August.
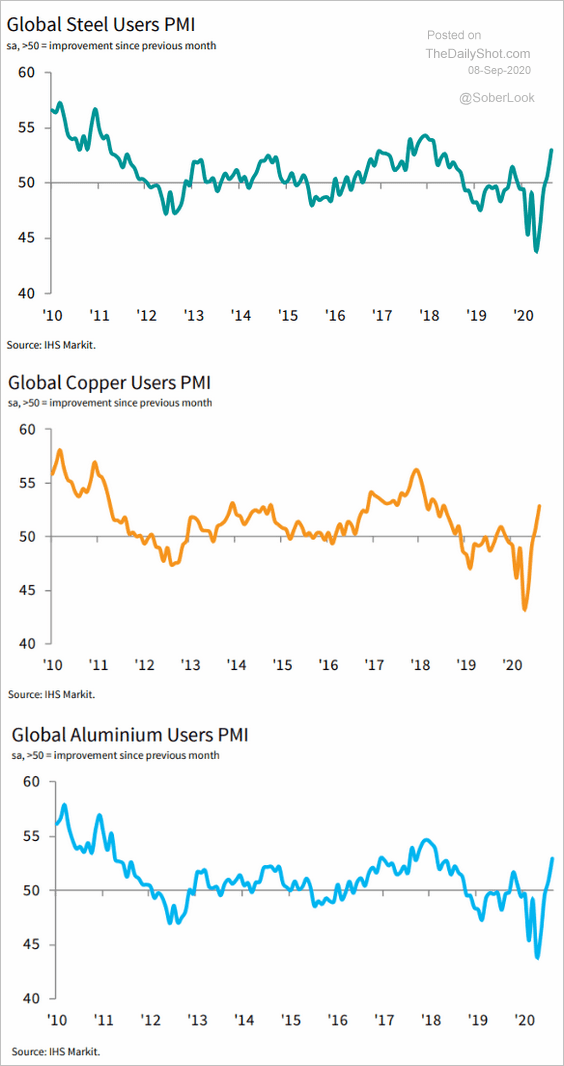 Source: IHS Markit Read full article
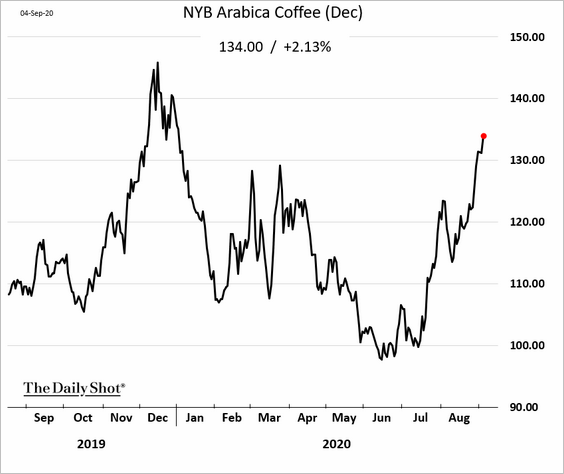
3. Coffee continues to rally.
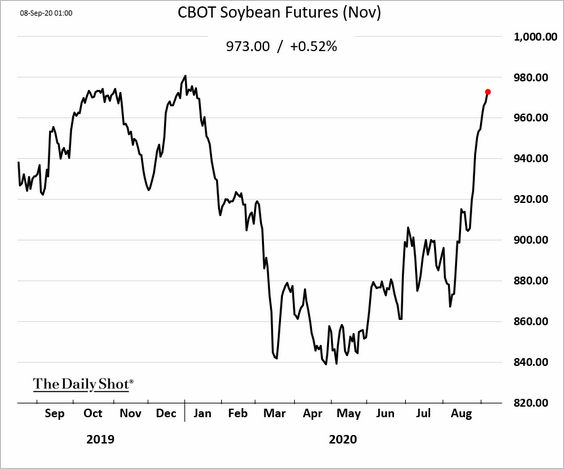
4. US soybean futures have recovered all of the pandemic-related losses.
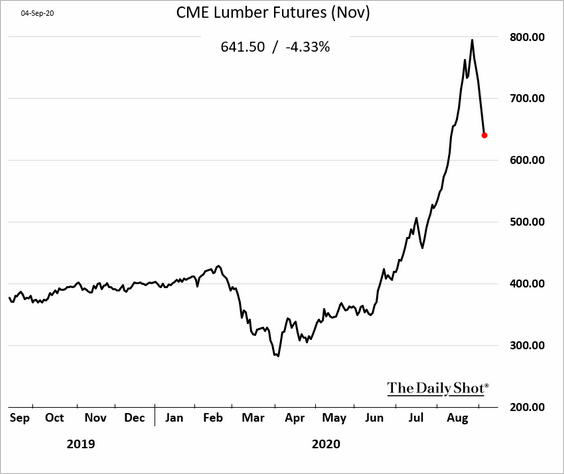
5. Lumber futures are rolling over.
Energy
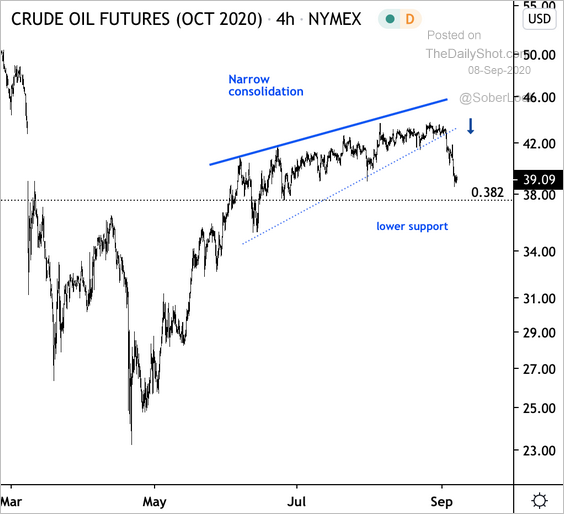
1. WTI crude oil futures broke down after three months of consolidation (now below $40/bbl).
 Source: @DantesOutlook
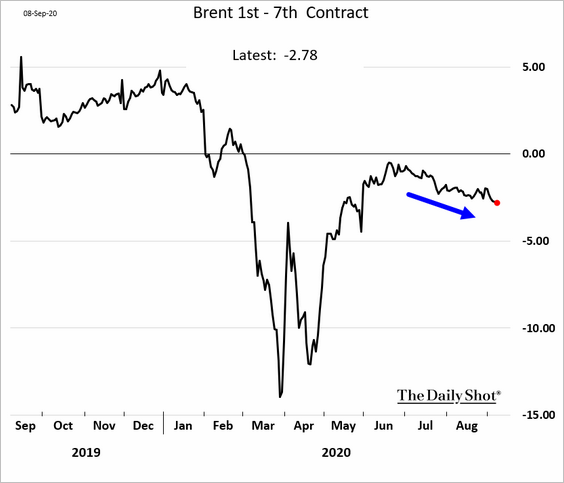
2. The Brent curve is gradually moving further into contango, an indication of soft demand.
3. The Saudis cut oil prices for October deliveries.
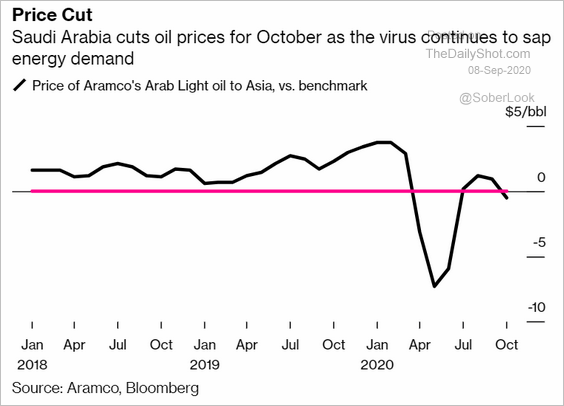 Source: @markets, @Theimmigrant84 Read full article
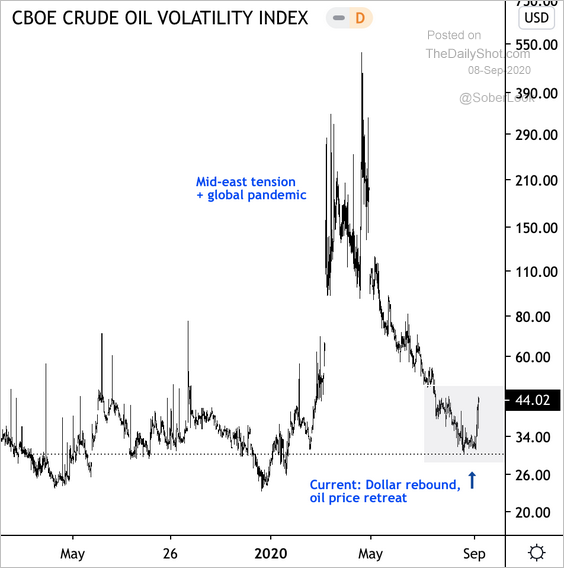
4. Crude oil volatility spiked last week, following a steady retreat from crisis highs.
 Source: @DantesOutlook
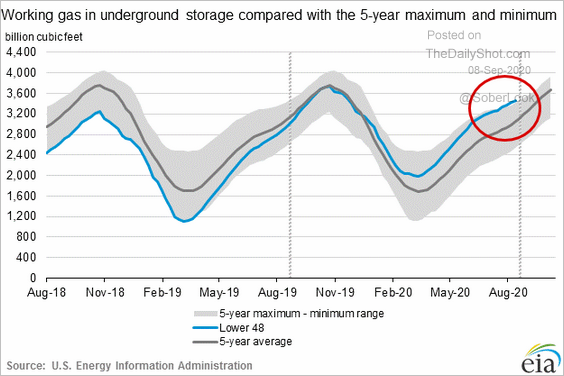
5. US natural gas in storage remains above the 5-year range.
Equities
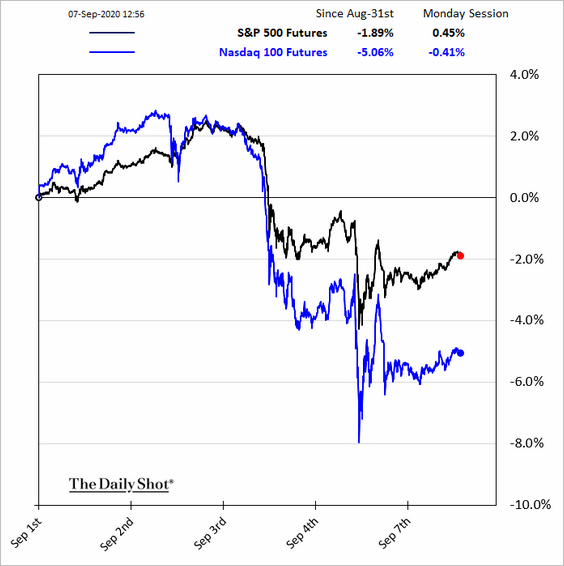
1. US stock futures have stabilized, but Nasdaq continues to lag.
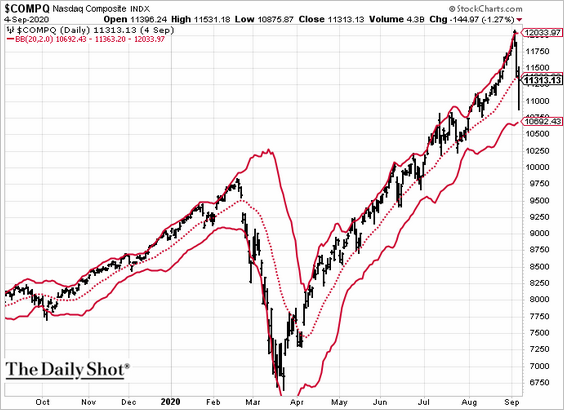
2. The Nasdaq Composite held resistance at the upper Bollinger band.
3. Speculative bets on the Nasdaq 100 and the S&P 500 have diverged.
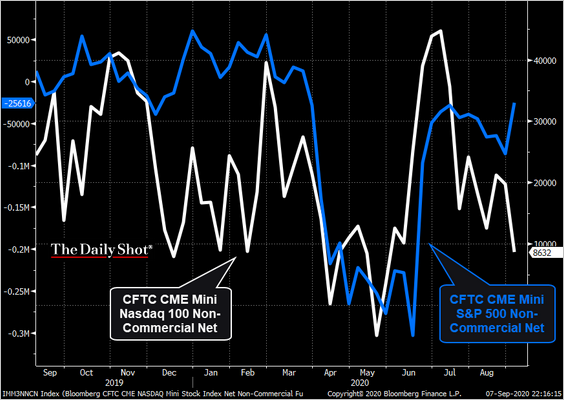 Source: @TheTerminal, Bloomberg Finance L.P., Cormac Mullen
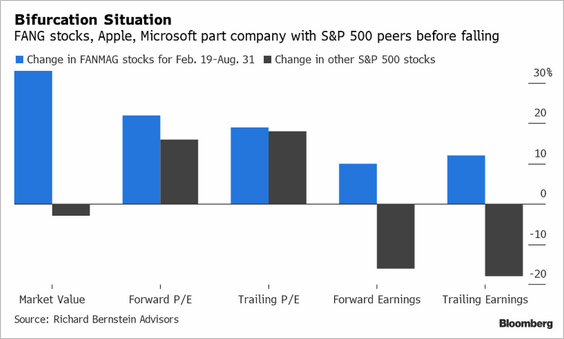
4. The tech mega-caps represent a market that is vastly different from the rest of the S&P 500.
 Source: @TheTerminal, Bloomberg Finance L.P. Further reading
5. Here are the FANG+ stocks vs. their 200-day moving average.
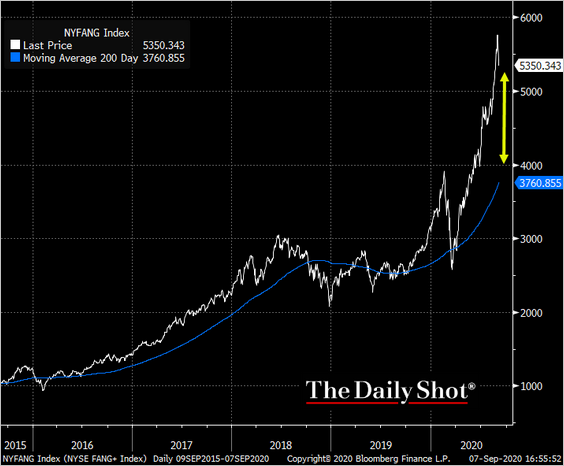 Source: @TheTerminal, Bloomberg Finance L.P.
6. Insiders have been unloading shares.
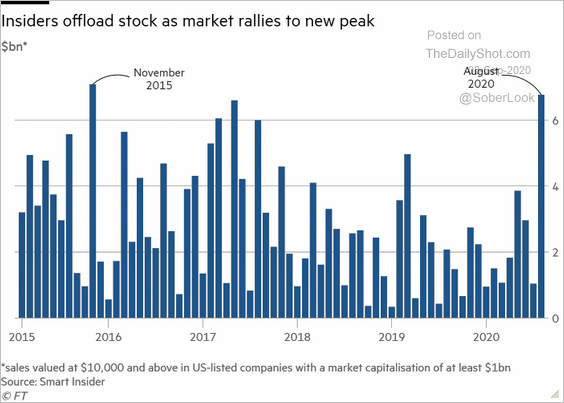 Source: @financialtimes Read full article
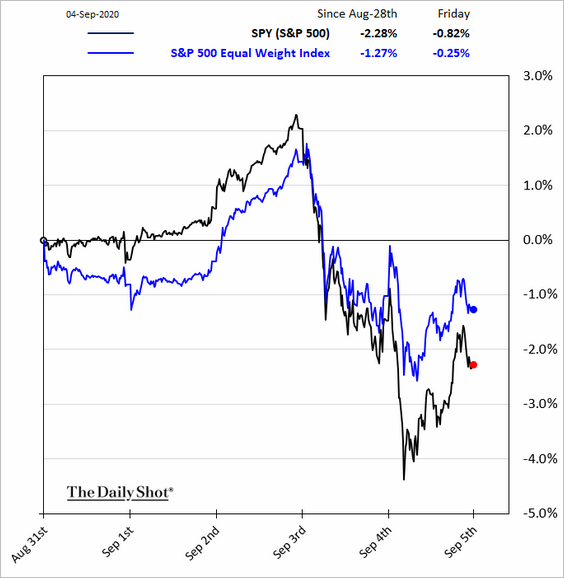
7. Smaller members of the S&P 500 outperformed last week.
8. Plotted on a log scale, the S&P 500 continues to follow a long-term trend.
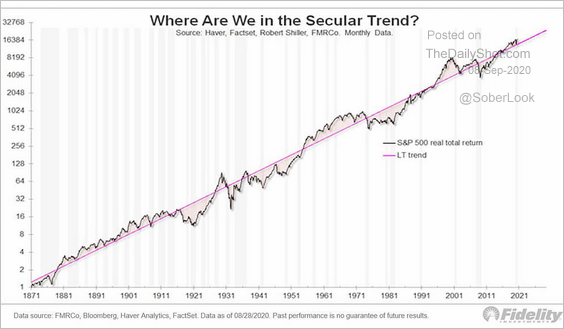 Source: @ISABELNET_SA, @TimmerFidelity
9. History suggests that there are more gains ahead for the S&P 500.
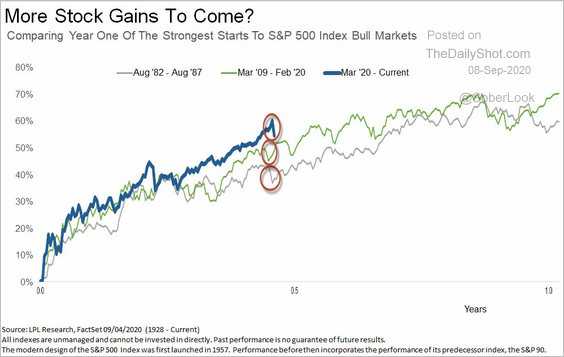 Source: LPL Research
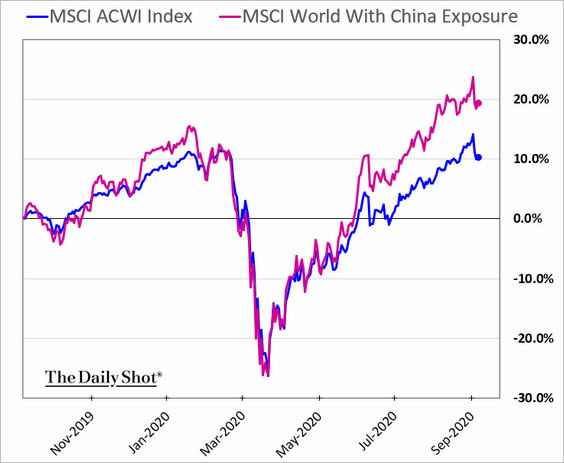
10. Stocks with China exposure continue to outperform.
11. Next, we have some updates on the options markets.
• Demand for tech call options (driven by retail investors and some institutions such as Softbank – see story):
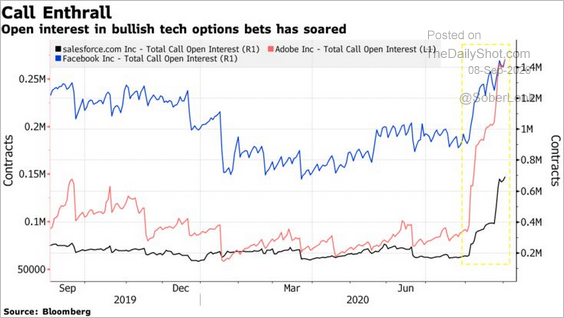 Source: @markets Read full article
• Single-stock call option volume:
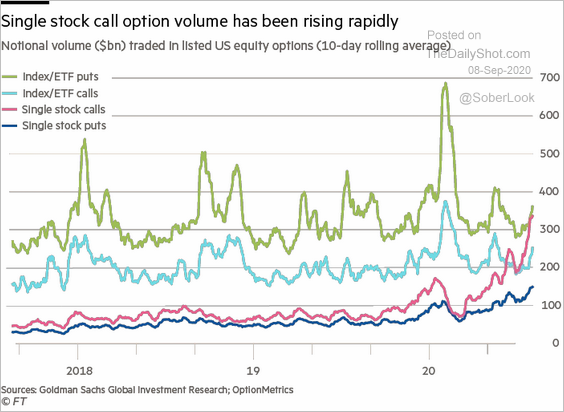 Source: @jessefelder, @financialtimes Read full article
• Implied vs. realized S&P 500 volatility:
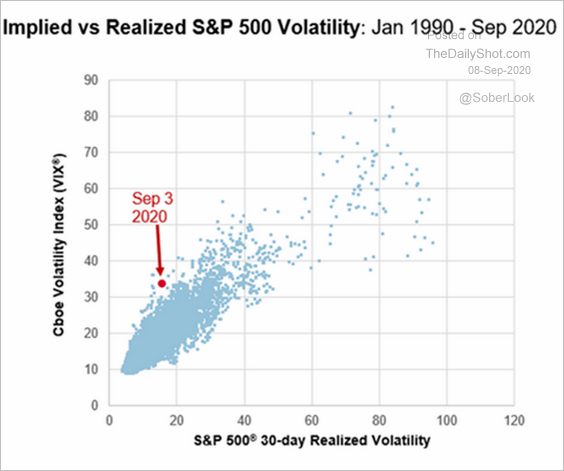 Source: S&P Global Market Intelligence
——————–
12. Finally, we have some sector updates.
• Healthcare and biotech (vaccine jitters):
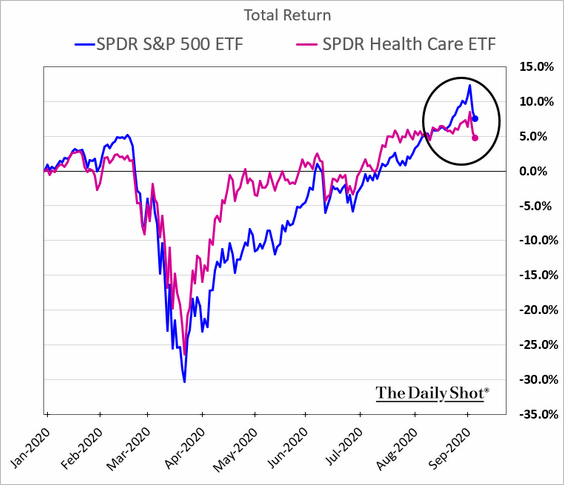
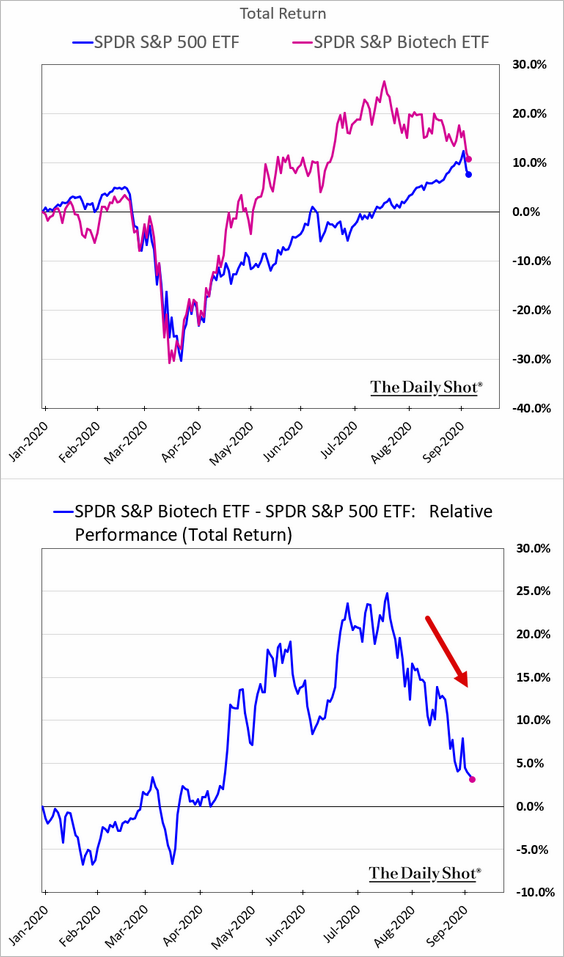
 Source: @markets Read full article
• Financials (2 charts):
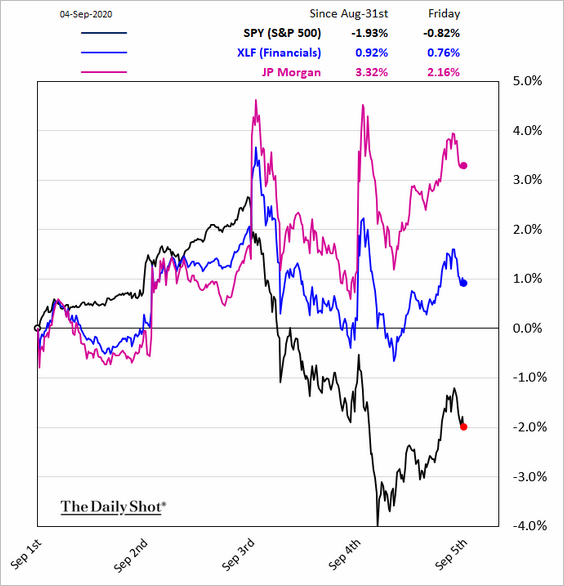
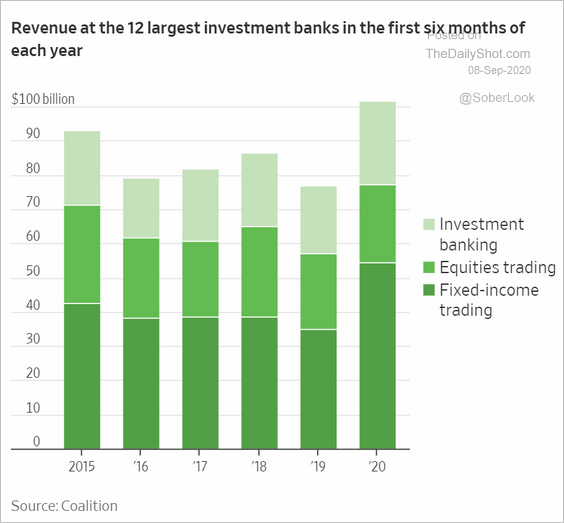 Source: @WSJ Read full article
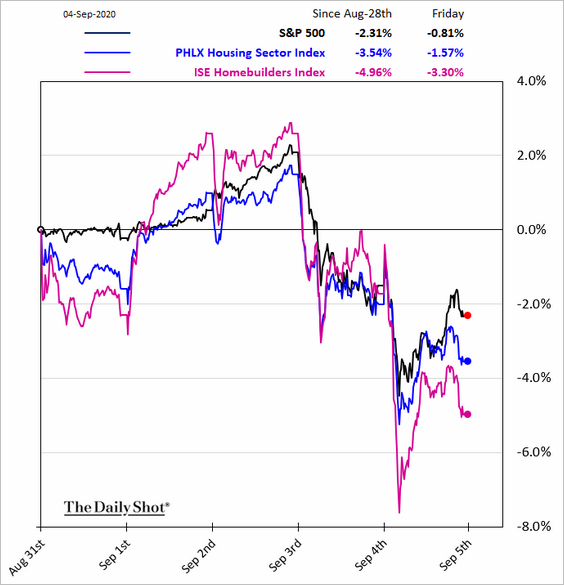
• Housing:
• September and year-to-date performance by sector and factor:
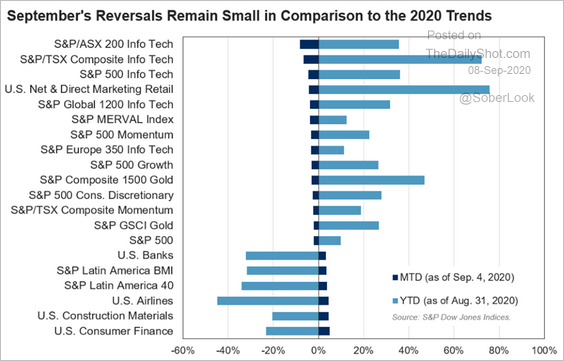 Source: S&P Global Market Intelligence
Rates
1. Treasuries no longer provide a good hedge for stocks.
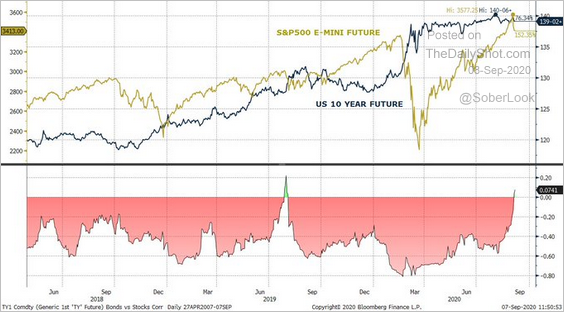 Source: @EffMktHype
2. The Fed’s clearer forward rate guidance and uncapped quantitative easing could keep Treasury volatility subdued, according to SunTrust Private Wealth Management.
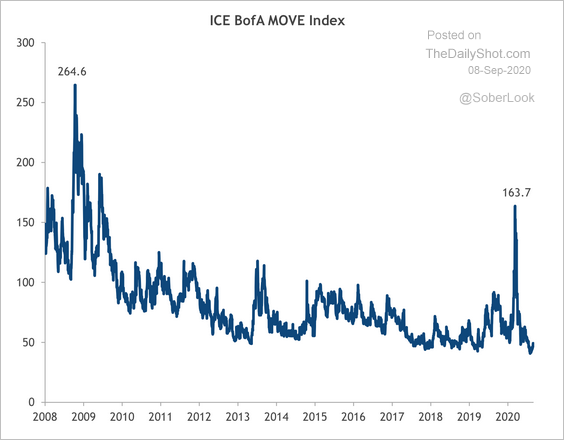 Source: SunTrust Private Wealth Management
3. Inflation expectations have sharply diverged from Treasury yields, pushing real rates to record lows (deep into negative territory).
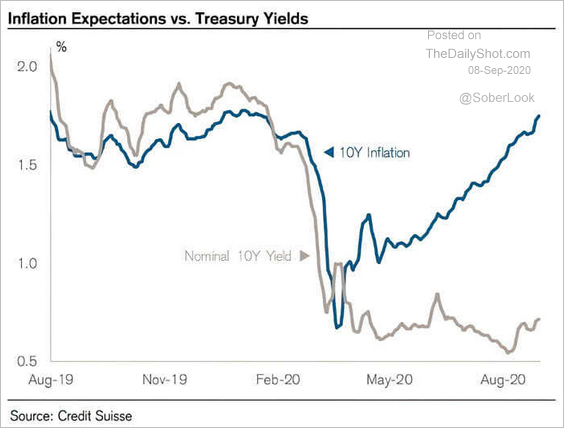 Source: @ISABELNET_SA, @csresearch
4. The Fed’s liquidity swaps, which allow other central banks to access US dollars, will wind down over the next month, according to JP Morgan.
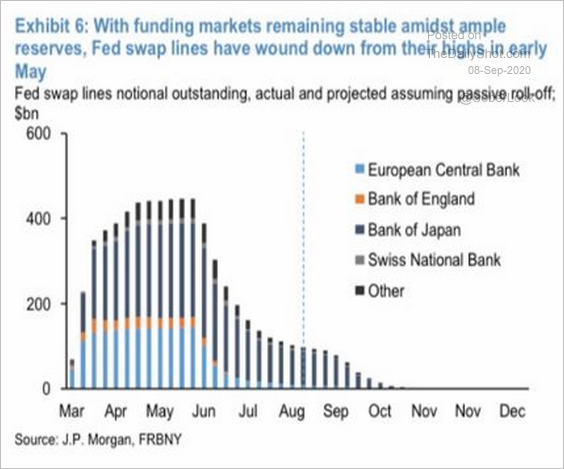 Source: J.P. Morgan
5. As the US Treasury spends its cash holdings at the Fed (TGA), reserves could climb sharply.
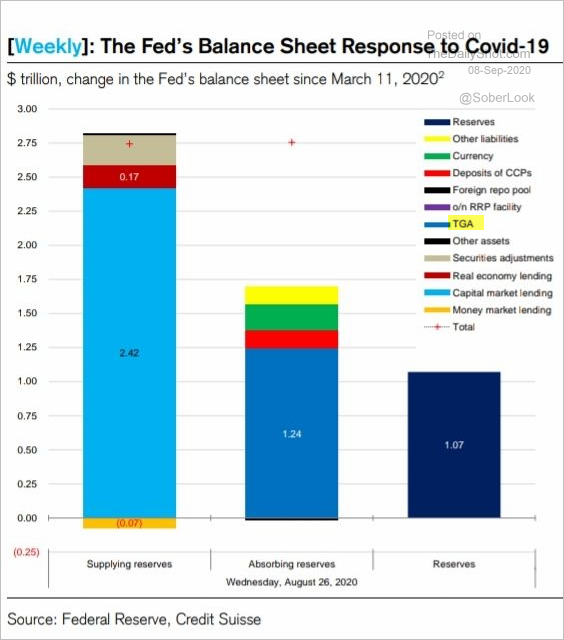 Source: Credit Suisse
——————–
Food for Thought
1. The status of sports betting across the US:
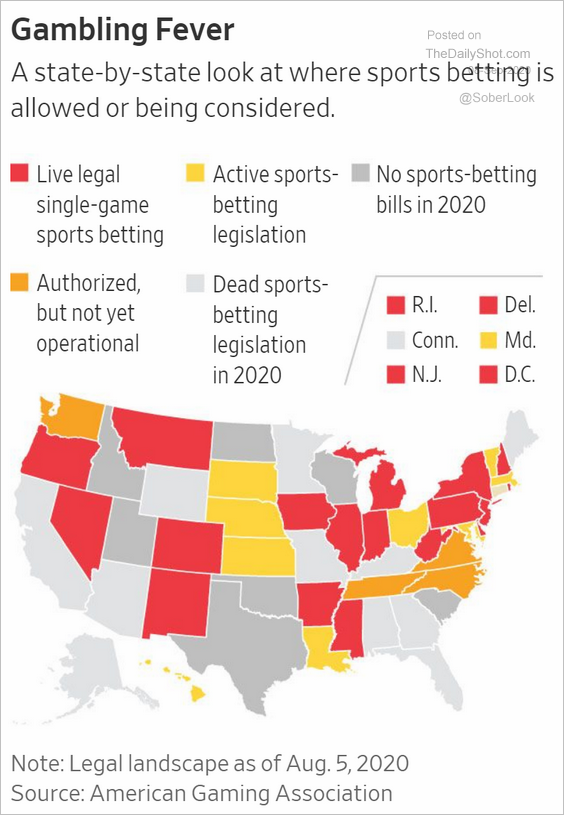 Source: @WSJ Read full article
2. Using bank branches:
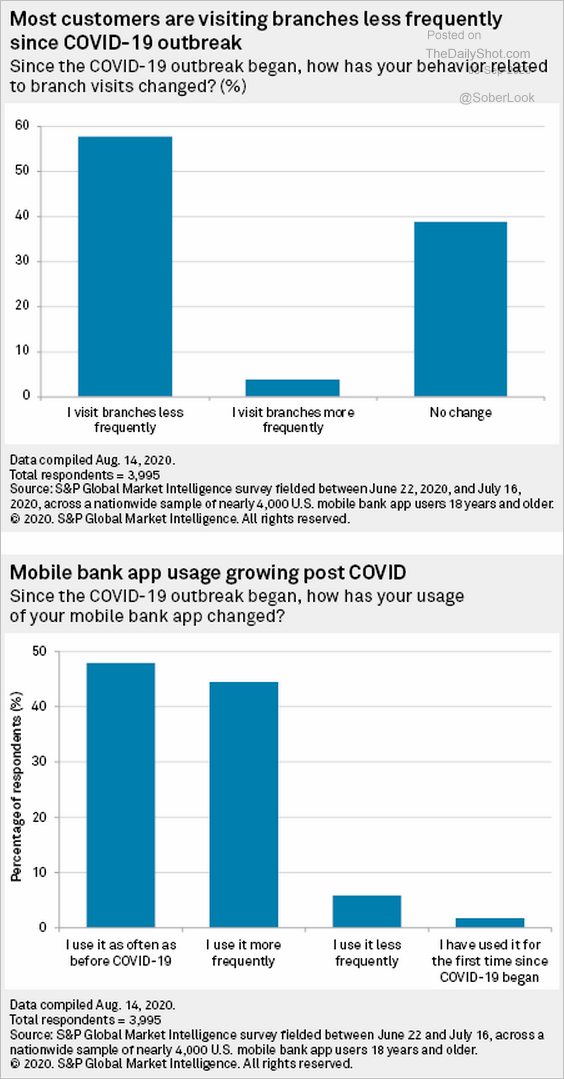 Source: S&P Global Market Intelligence
3. Bike production (2 charts):
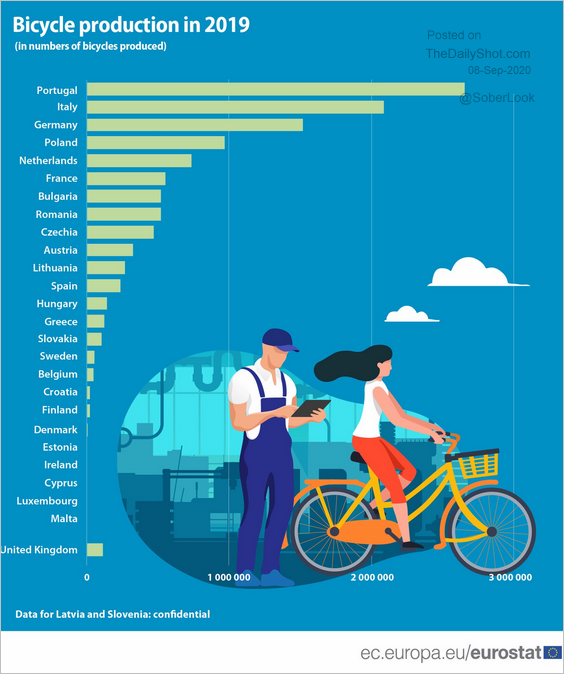 Source: Eurostat Read full article
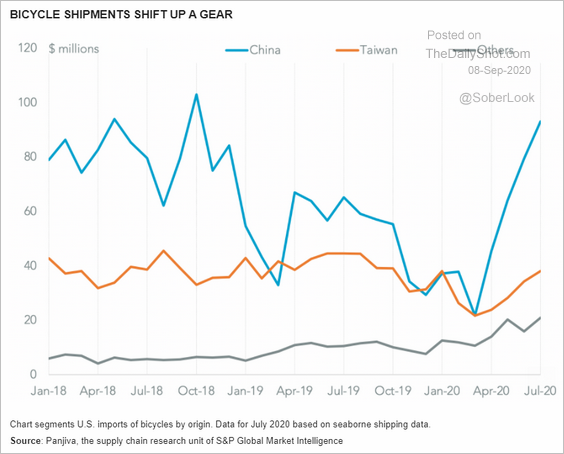 Source: S&P Global Market Intelligence
——————–
4. US airport activity:
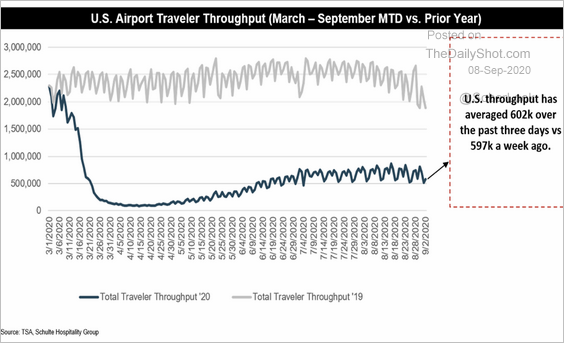 Source: Schulte Hospitality Group
5. Childcare costs:
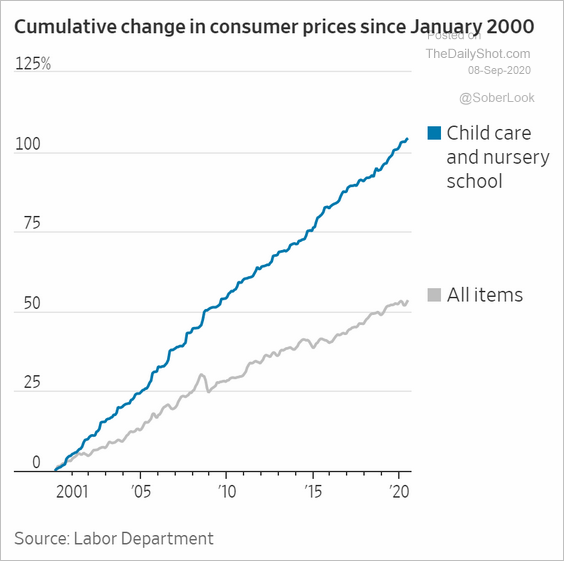 Source: @WSJ Read full article
6. Wall Street political donations:
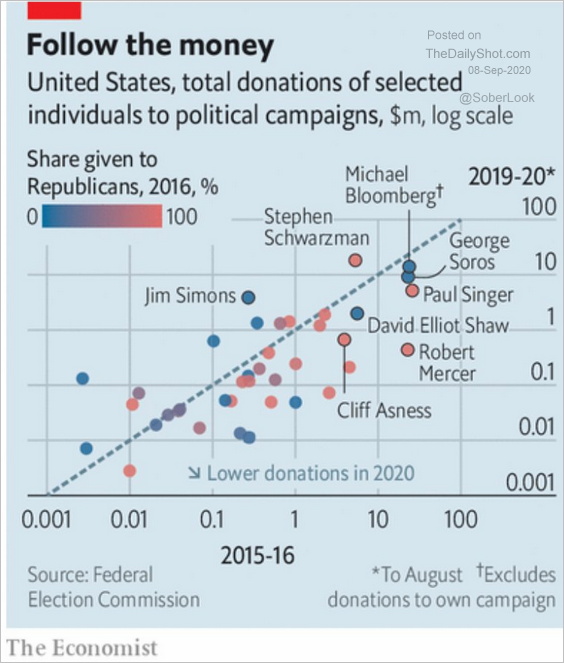 Source: @adam_tooze, @TheEconomist, @DuncanWeldon Read full article
7. USPS delays:
 Source: Shippo Read full article
8. App Store/Google Play revenue split with developers:
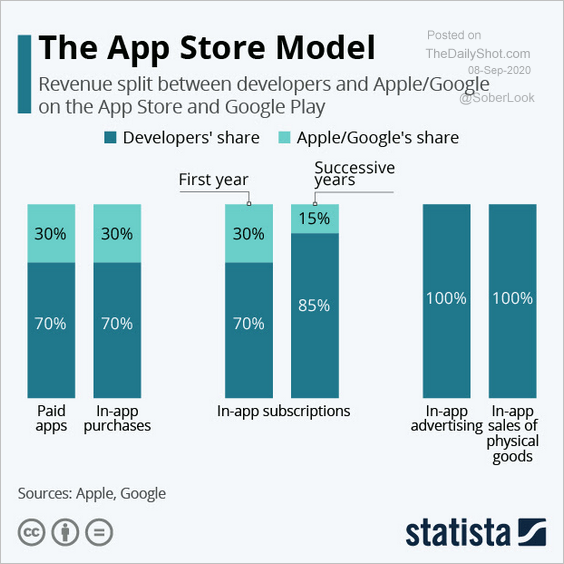 Source: Statista
9. Attempted coups:
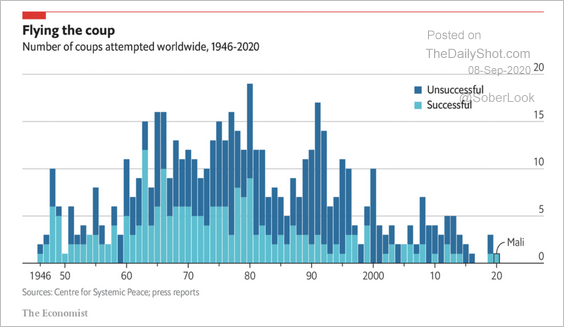 Source: The Economist Read full article
——————–