
The Daily Shot: 17-Sep-20
• The United States
• Canada
• The United Kingdom
• The Eurozone
• Asia – Pacific
• China
• Emerging Markets
• Commodities
• Energy
• Equities
• Global Developments
• Food for Thought
The United States
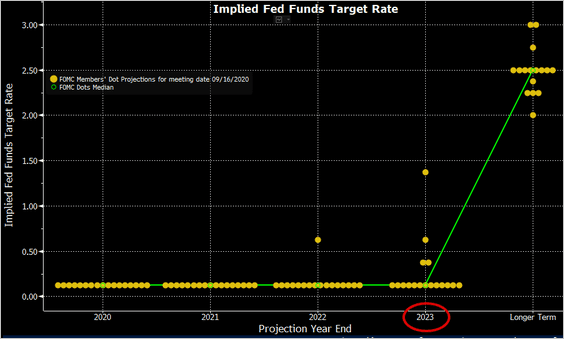
1. The FOMC now expects rates to stay near zero through 2023. Here is the dot plot.
 Source: @TheTerminal, Bloomberg Finance L.P.
Does rate guidance even matter at this point? The Fed has effectively put the policy on autopilot (“outcome-based” forward guidance).
The Committee decided to keep the target range for the federal funds rate at 0 to 1/4 percent and expects it will be appropriate to maintain this target range until labor market conditions have reached levels consistent with the Committee’s assessments of maximum employment and inflation has risen to 2 percent and is on track to moderately exceed 2 percent for some time. In addition, over coming months the Federal Reserve will increase its holdings of Treasury securities and agency mortgage-backed securities at least at the current pace to sustain smooth market functioning and help foster accommodative financial conditions, thereby supporting the flow of credit to households and businesses.
 Source: @TheTerminal, Bloomberg Finance L.P.
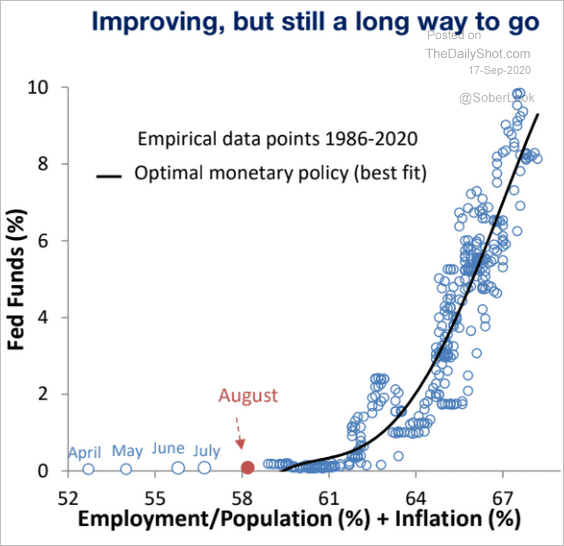
Even without the changes to inflation targeting, historical data suggest that the next rate hike is a long way off.
 Source: Piper Sandler
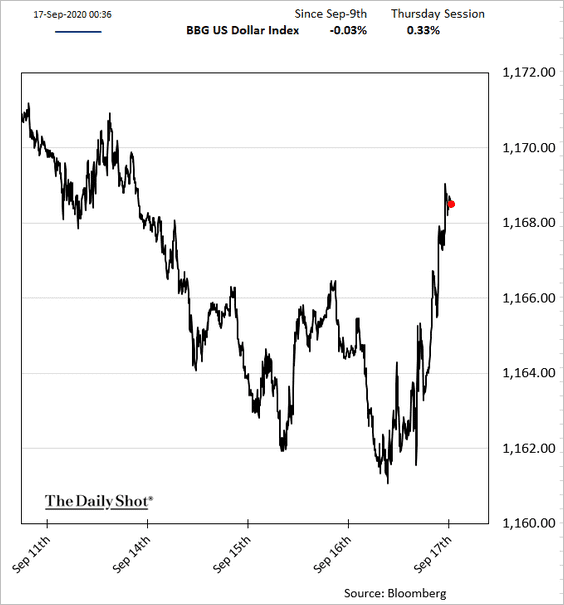
The market was hoping to see more detail on QE. Absent that, we got some US dollar short-covering and a bit of weakness in stocks and gold.
——————–
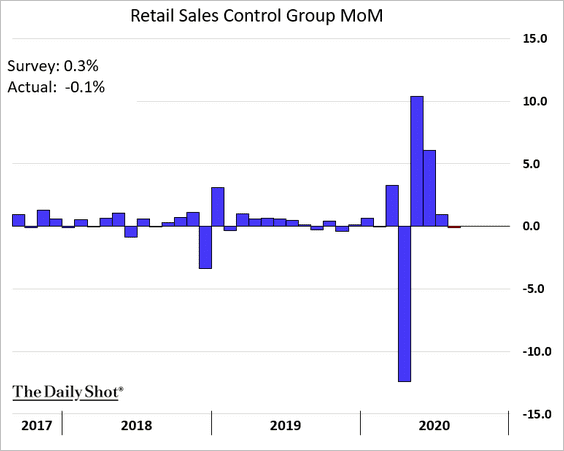
2. The August retail sales report was softer than expected, suggesting that consumption recovery is losing momentum.
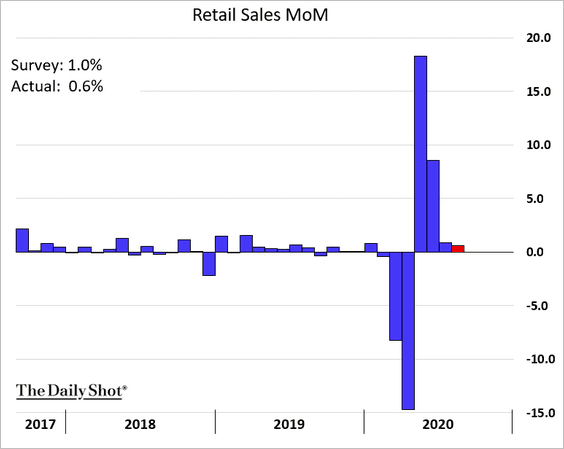
The control group (sales excluding autos, building materials, gas, and office supplies) declined.
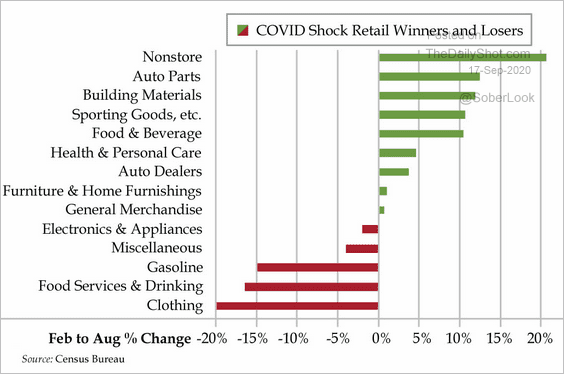
Here is the breakdown by sector since February.
 Source: The Daily Feather
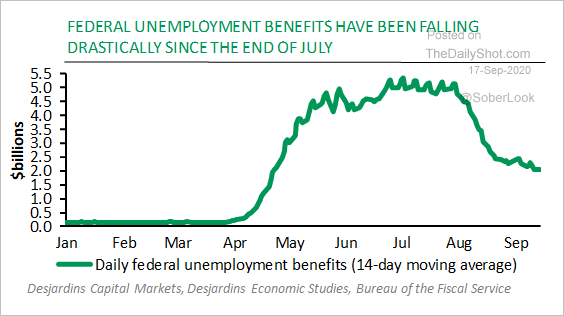
The reduction in government support is taking its toll, and as the extra unemployment benefits expire, the situation will deteriorate further.
 Source: Desjardins
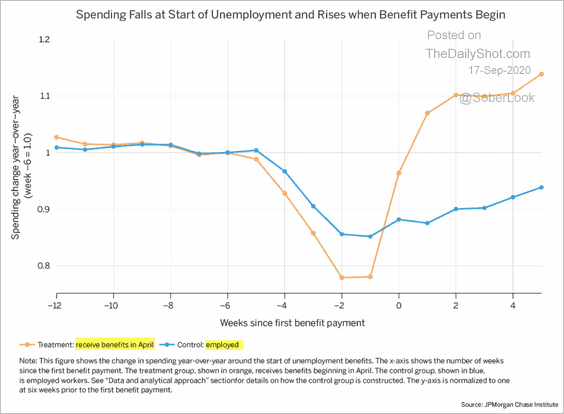
And there is little doubt that the recovery in retail sales has been driven by enhanced unemployment benefits.
 Source: JPMorgan Chase Institute
——————–
3. Homebuilder optimism hit another record high, boosted by extraordinarily low rates and tight supplies.
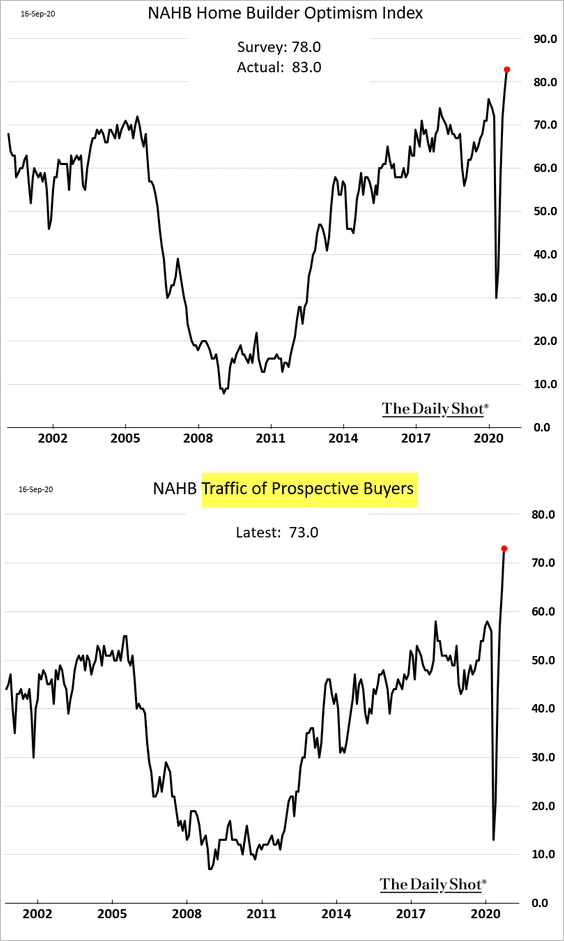
Homebuilder shares continue to outperform.

——————–
4. The collapse in mortgage rates sent loan originations to a new record.
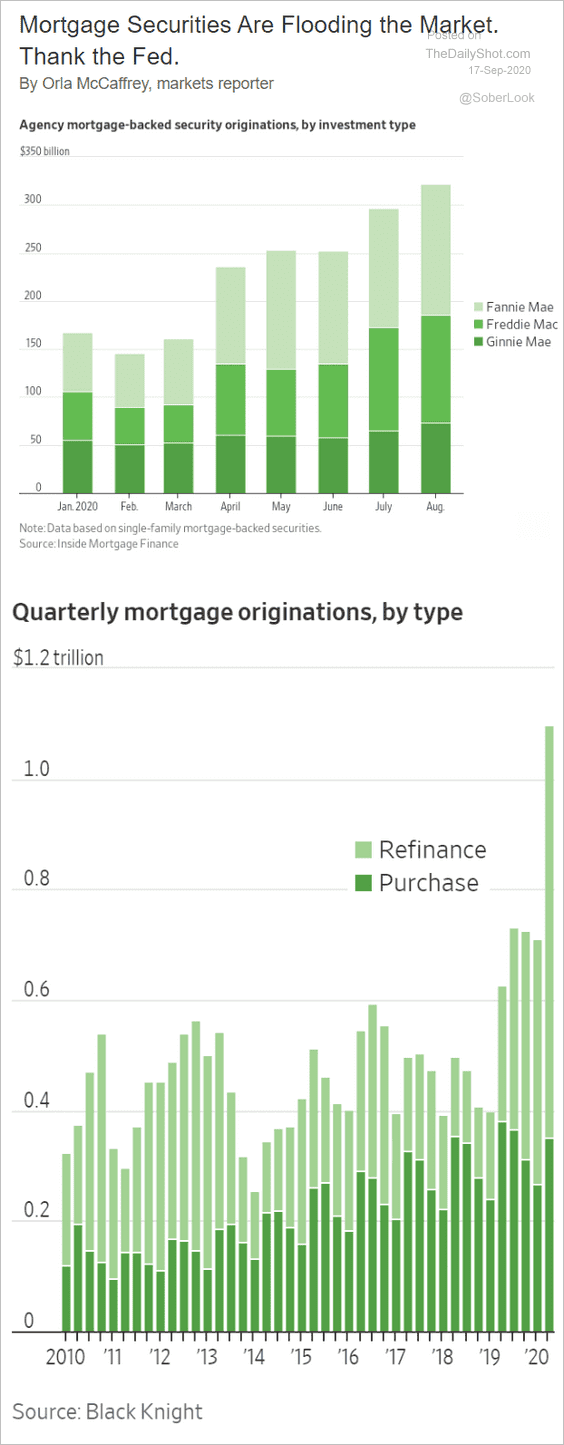 Source: @WSJ Read full article
The Fed has been immensely helpful in this process.
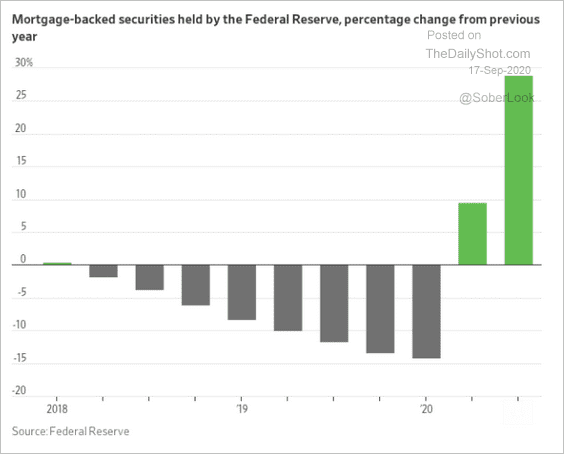 Source: @WSJ Read full article
——————–
5. The NY Fed’s regional survey of service companies shows that the recovery may take some time.
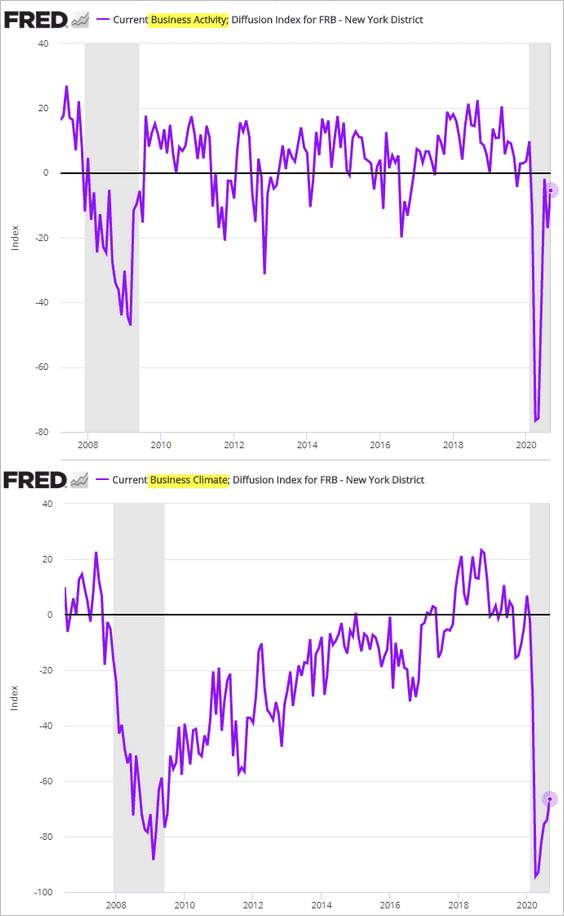
Here is the New York City recovery tracker.
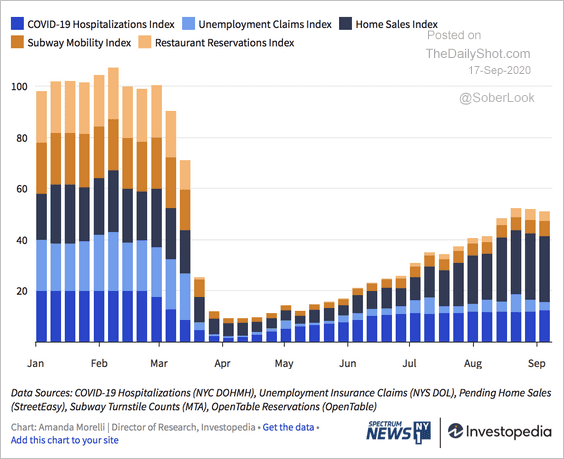 Source: Investopedia Read full article
——————–
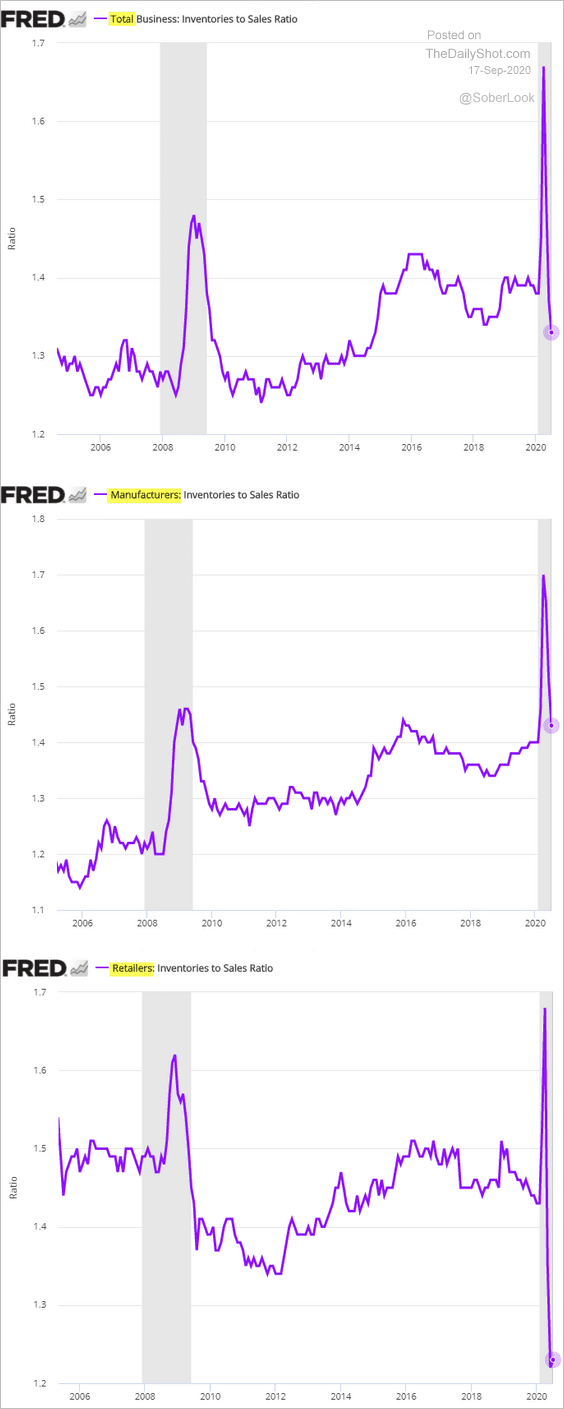
6. The US inventories-to-sales ratio continues to decline.
Canada
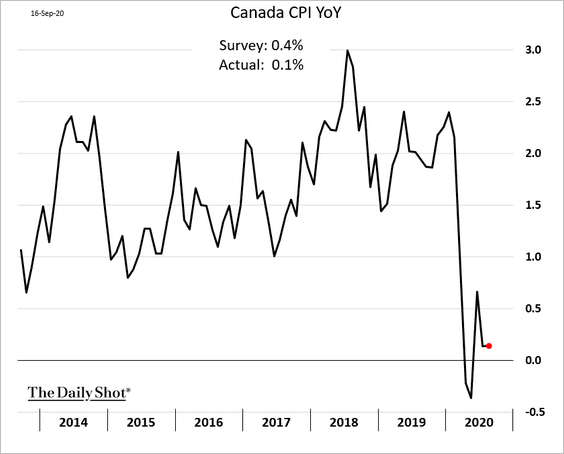
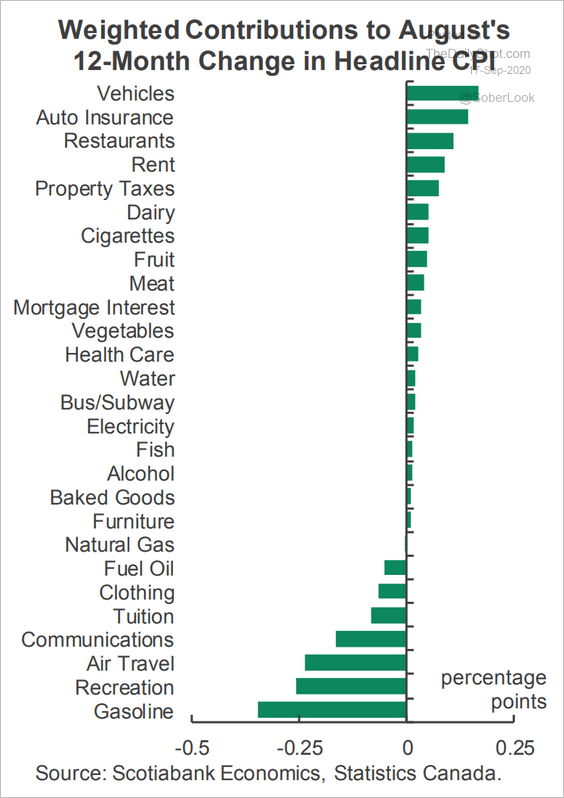
1. The headline inflation surprised to the downside.
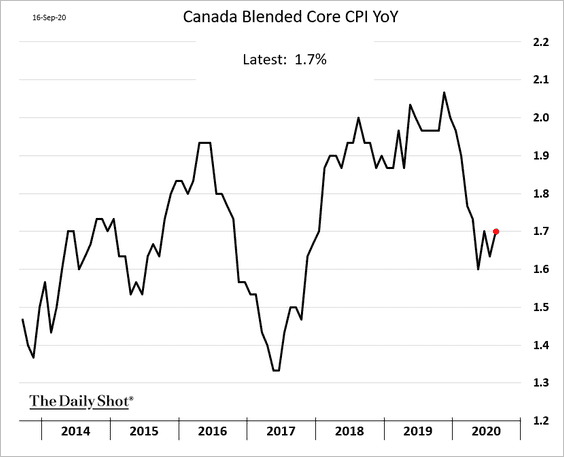
But the core CPI remains stable.
Here are the contributions to the year-over-year CPI changes.
 Source: Scotiabank Economics
——————–
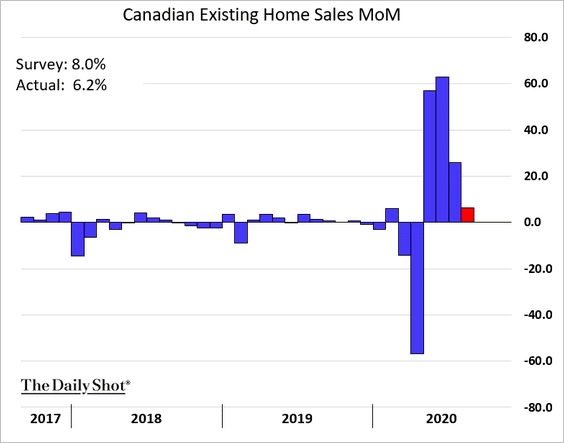
2. The rebound in home sales is moderating (as of August).
The United Kingdom
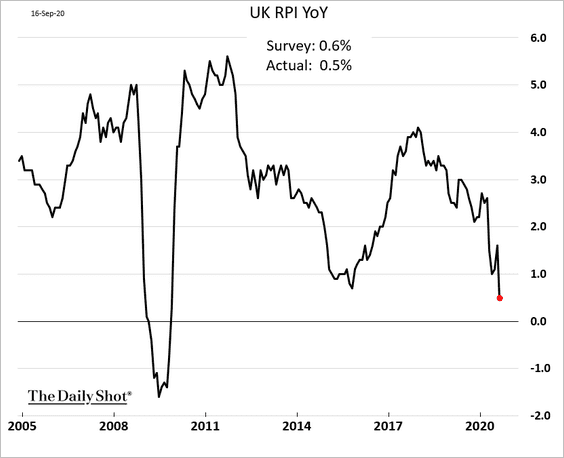
1. Inflation declined sharply, but the drop was smaller than expected.
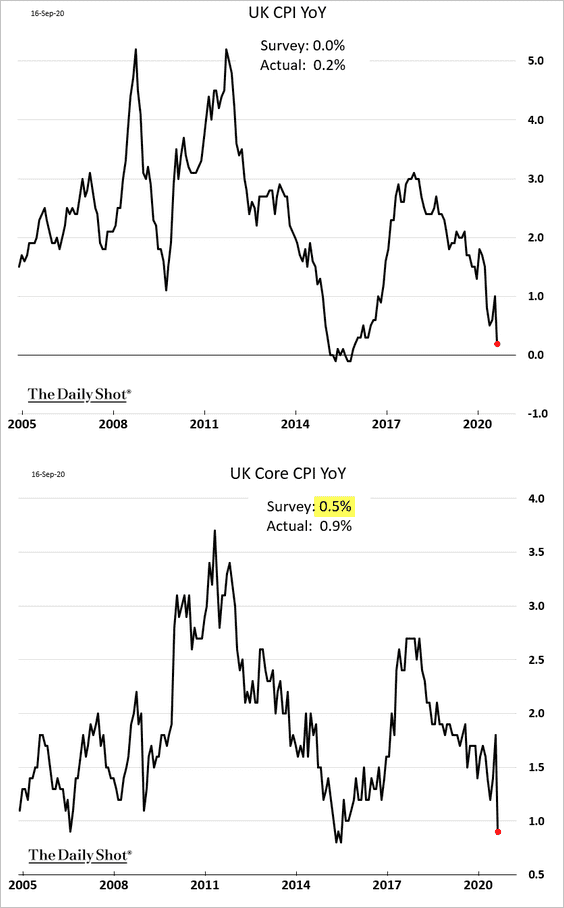
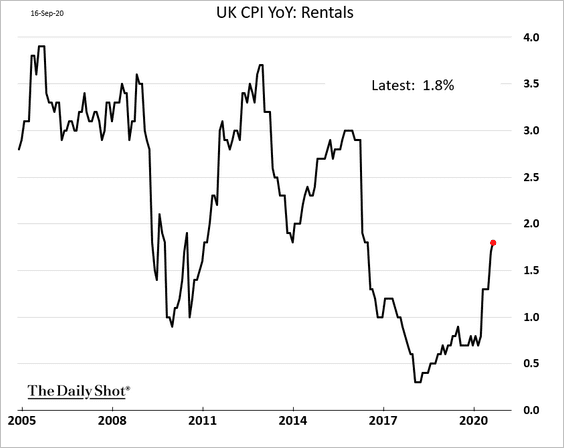
• Rent inflation has been rising.
• Retail price inflation is the lowest in over a decade.
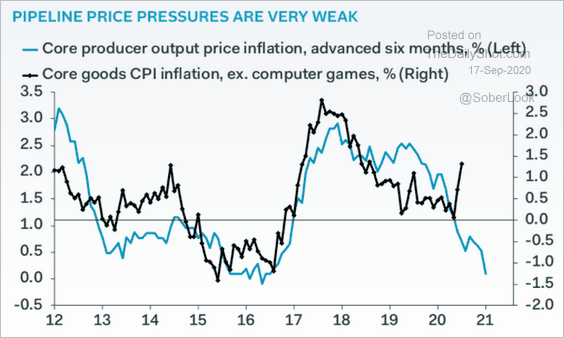
• The core PPI is at zero again.
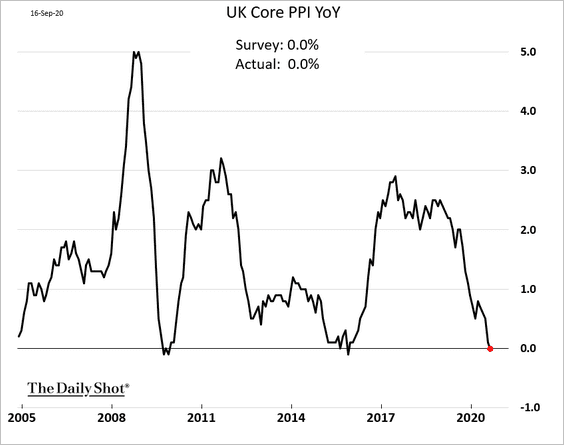
The PPI weakness suggests that consumer inflation will slow further.
 Source: Pantheon Macroeconomics
——————–
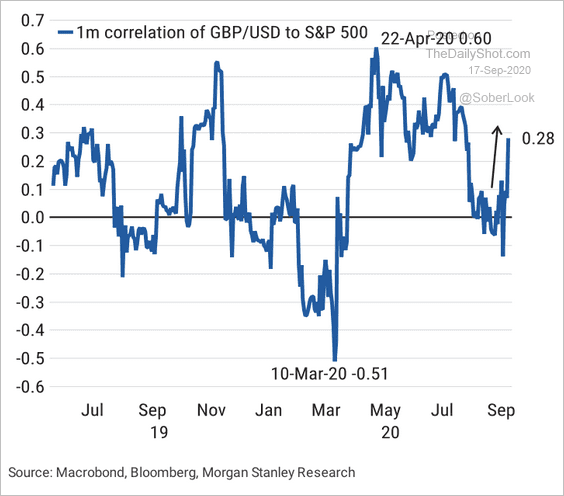
2. Next, we have some updates on the British pound.
• GBP/USD correlation with US equities has risen again.
 Source: Morgan Stanley Research
• Investors have built up significant hedges for GBP downside over the next three months, according to Oxford Economics.
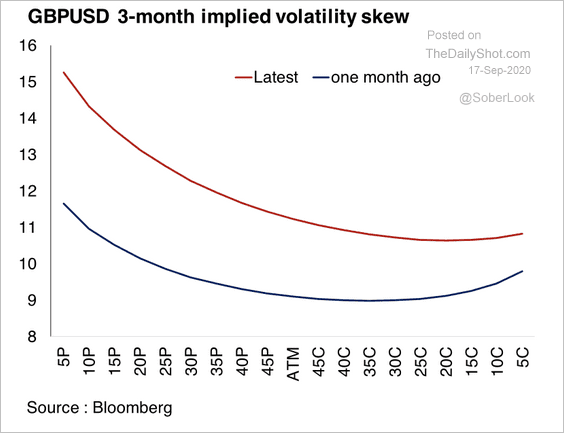 Source: Oxford Economics
• EUR/GBP is holding long-term support.
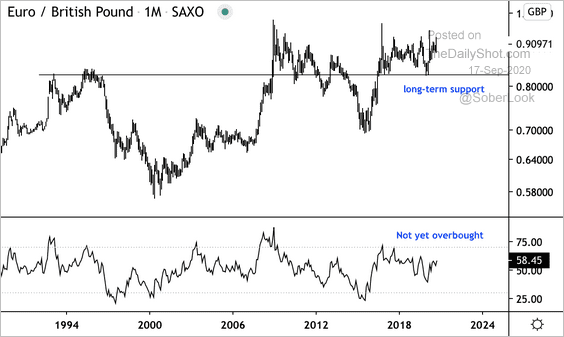 Source: @DantesOutlook
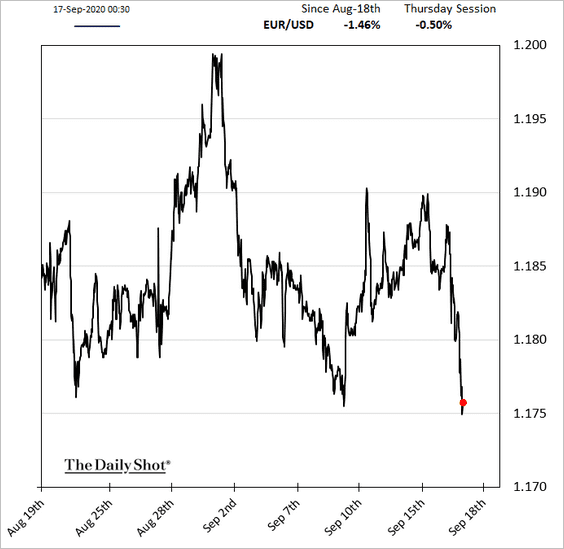
The Eurozone
1. The euro is weaker after the Fed’s decision.
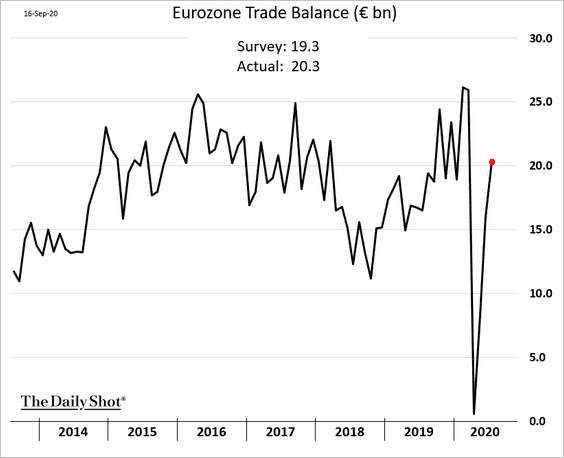
2. Trade recovery will take a while.
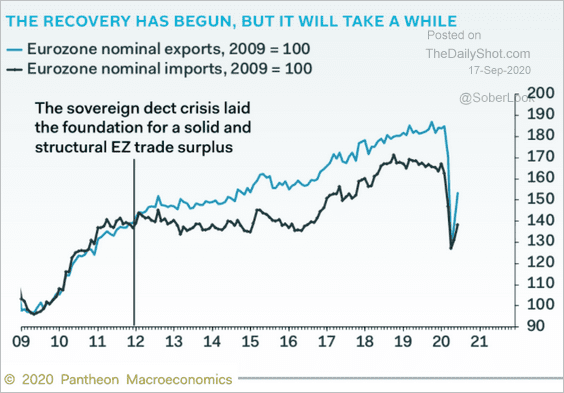 Source: Pantheon Macroeconomics
With imports lagging, the trade surplus has rebounded.
——————–
3. Why did Spain’s economy underperform?
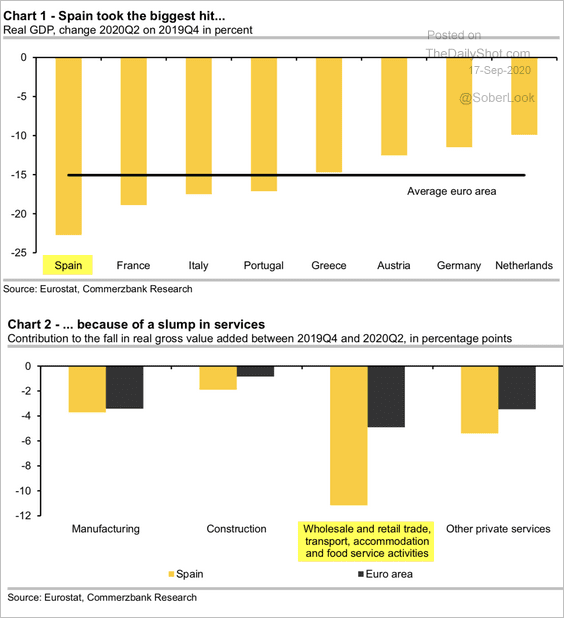 Source: Commerzbank Research
4. Italy’s debt-to-GDP ratio is headed for record highs.
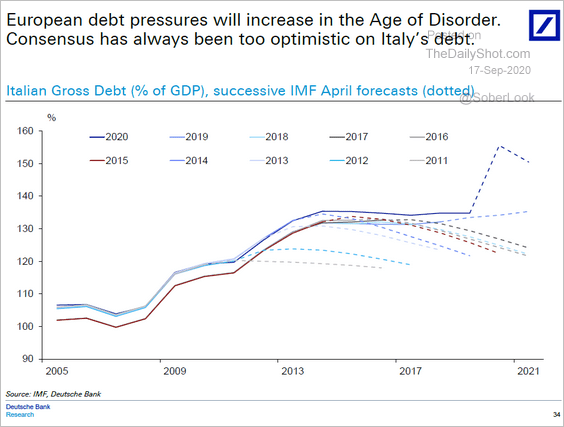 Source: Deutsche Bank Research
Asia – Pacific
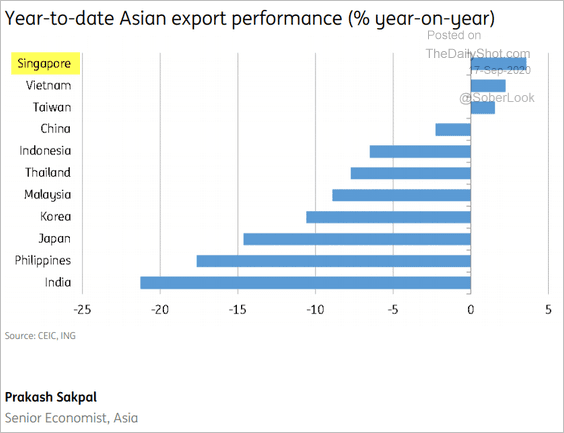
1. Singapore’s exports have been remarkably strong.
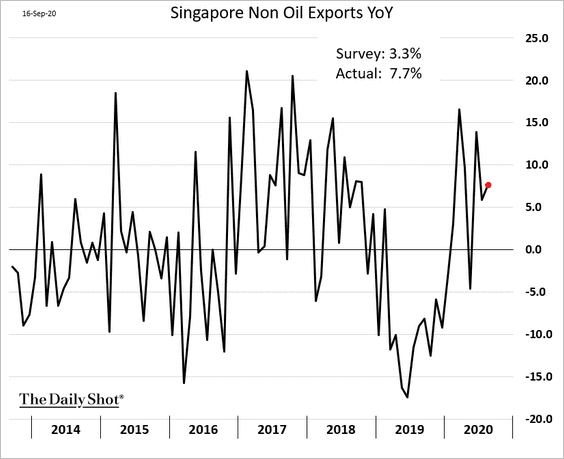
 Source: ING
——————–
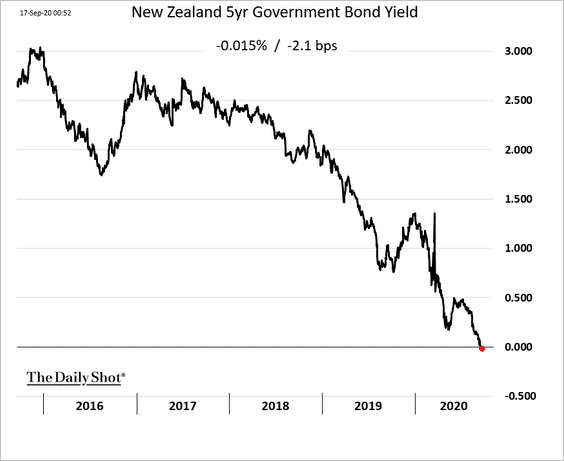
2. New Zealand’s 5yr yield is now negative.
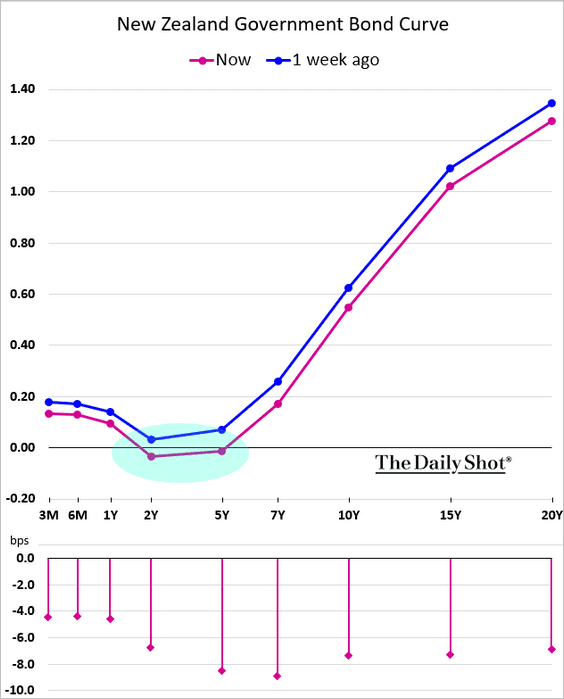
Here is the yield curve.
Separately, this chart shows the contributions to New Zealand’s record GDP decline in Q2.
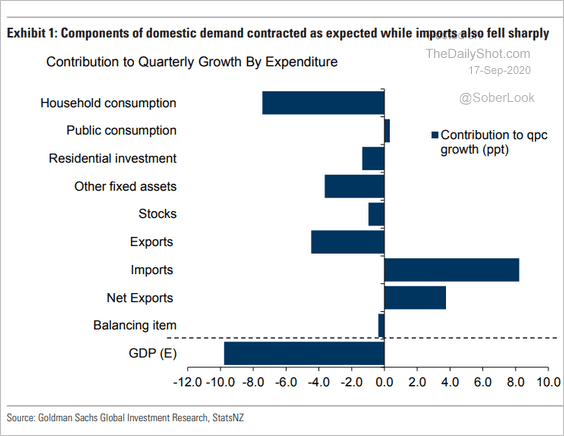 Source: Goldman Sachs
——————–
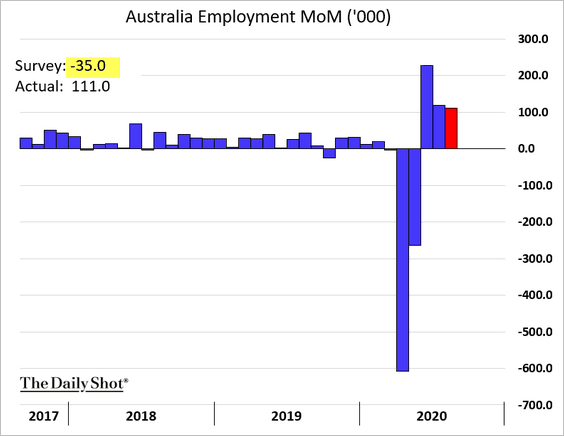
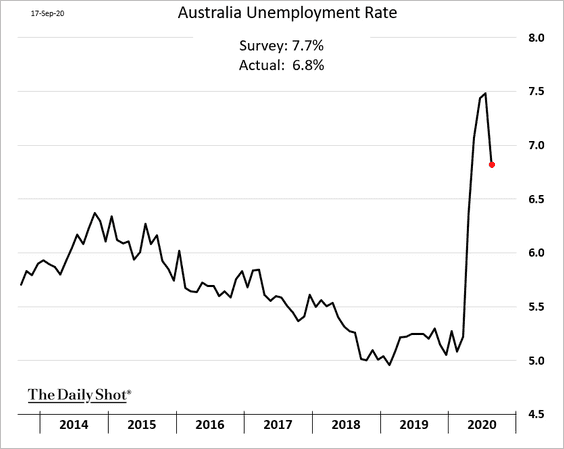
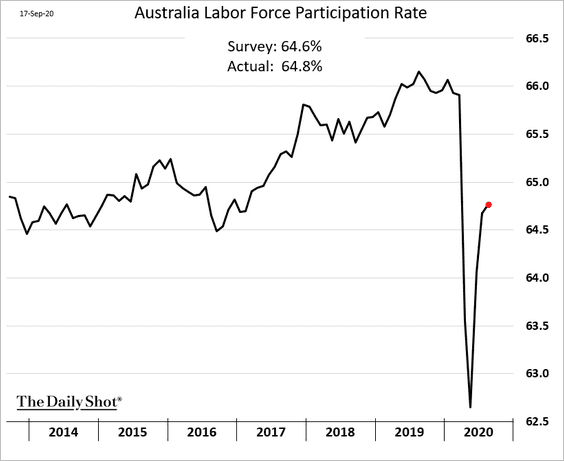
3. Australia’s employment report was better than expected.
• Employment change:
• The unemployment rate:
• The participation rate.
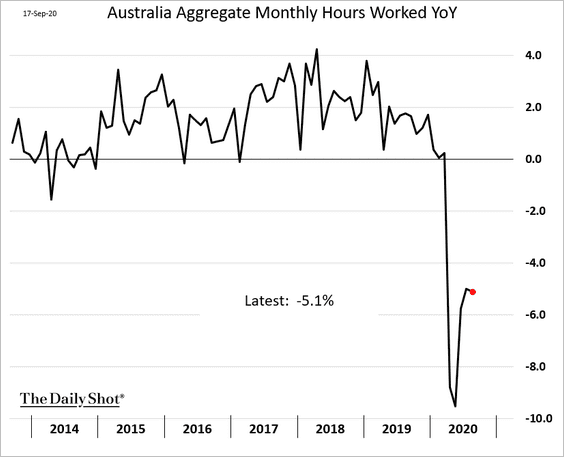
However, the recovery in total hours worked has a long way to go.
China
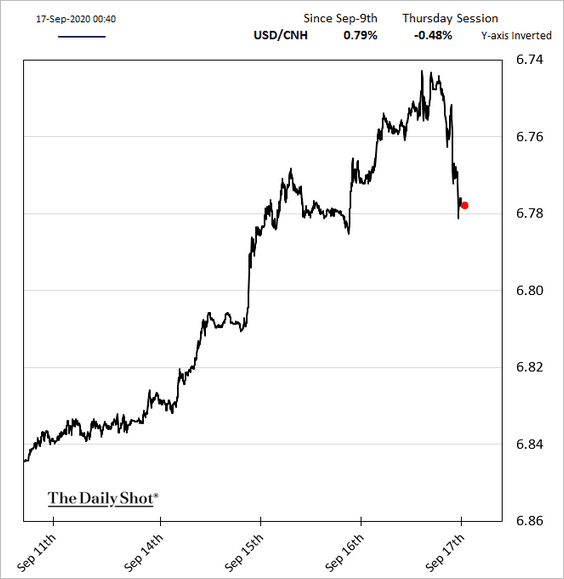
1. The renminbi weakened vs. USD in response to the Fed’s policy announcement.
However, the bond yield differential with the US points to further strength in China’s currency.
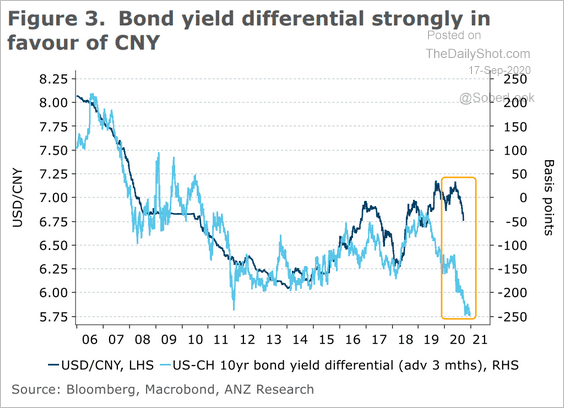 Source: ANZ Research
——————–
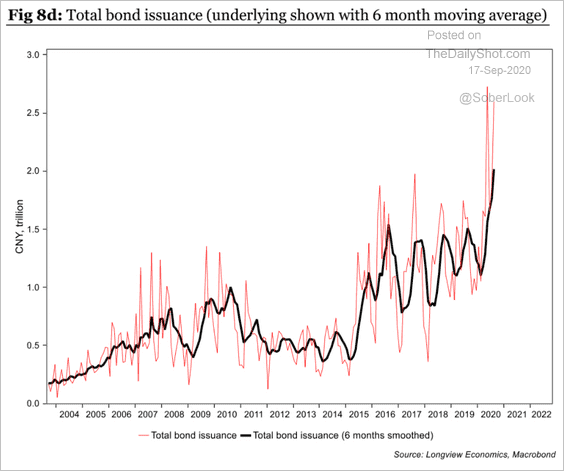
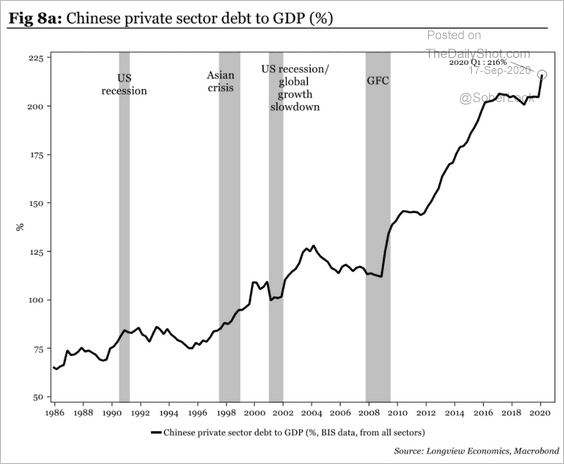
2. China’s aggregate credit flows have been impressive as bond issuance hits new highs (second chart).
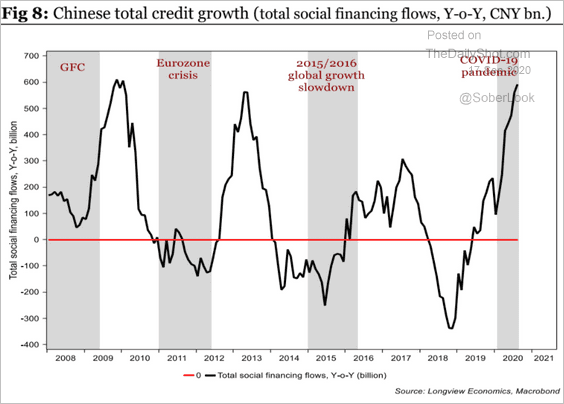 Source: Longview Economics
 Source: Longview Economics
The private-sector debt-to-GDP ratio hit a record earlier this year.
 Source: Longview Economics
——————–
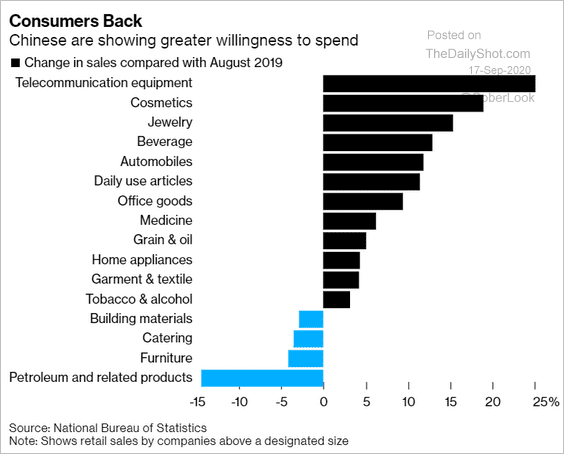
3. Consumer spending has picked up.
 Source: @markets Read full article
Emerging Markets
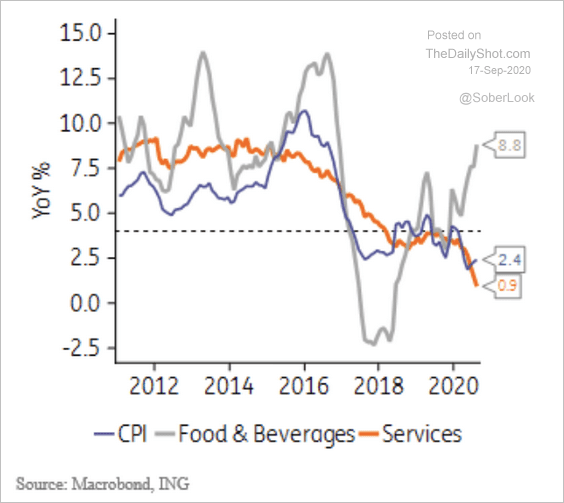
1. In Brazil, food prices have surged, while service inflation subsided this year.
 Source: ING
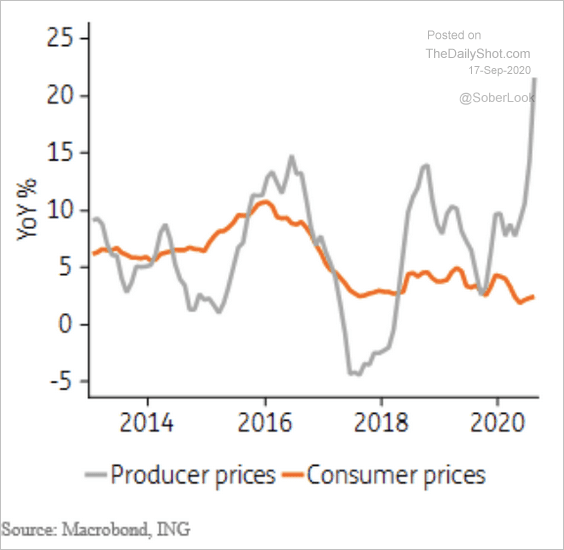
There is a growing gap between Brazil’s producer and consumer prices.
 Source: ING
——————–
2. This chart shows LatAm inflation rates vs. central banks’ targets.
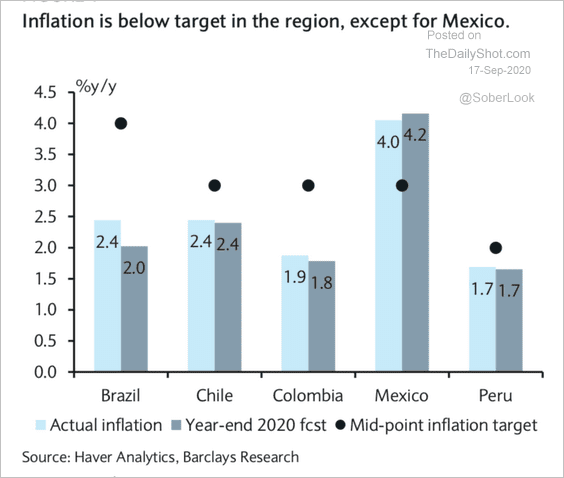 Source: Barclays Research
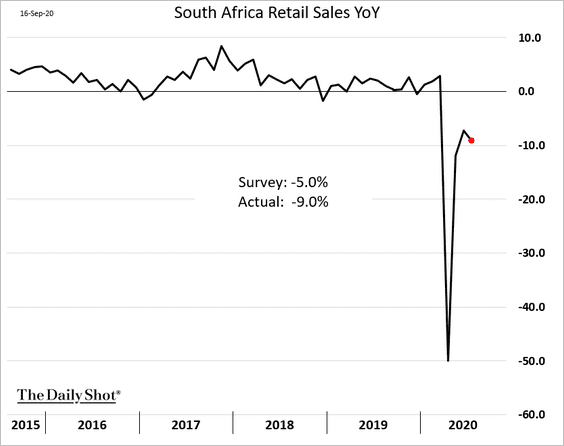
3. South Africa’s retail sales slowed again in July.
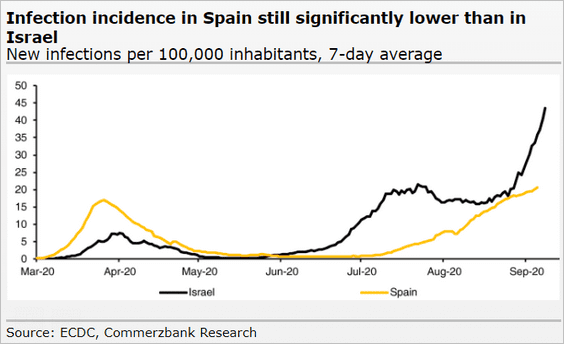
4. Israel’s daily COVID infections have accelerated.
5. Resilience in EM Asia tech exports is helping to offset softness in demand for non-tech items.
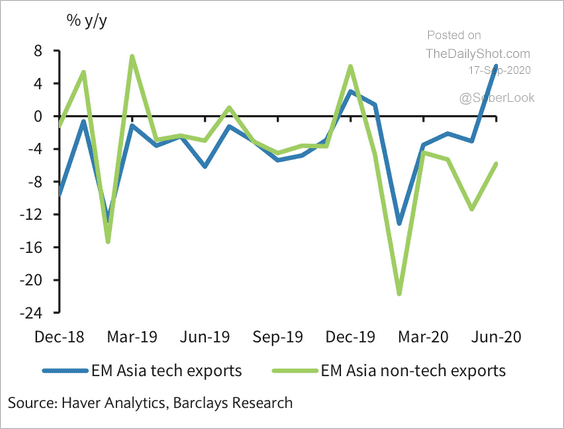 Source: Barclays Research
Commodities
1. Gold is at support.
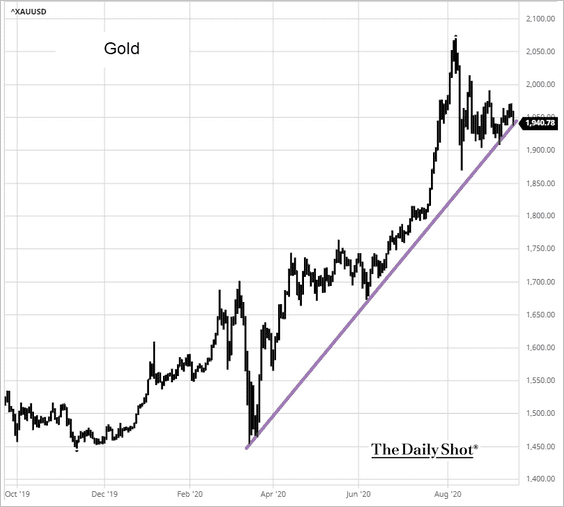 Source: barchart.com
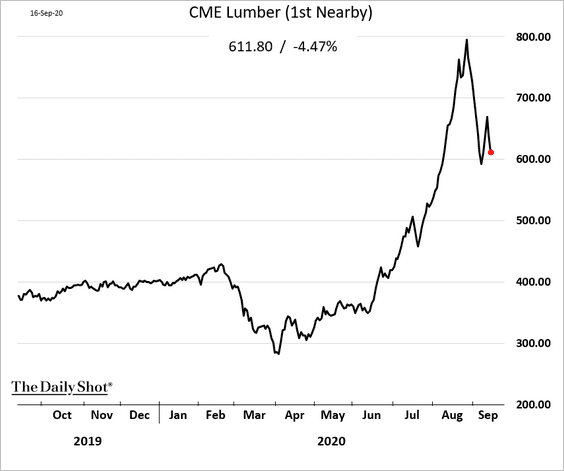
2. Are US lumber futures stabilizing?
Energy
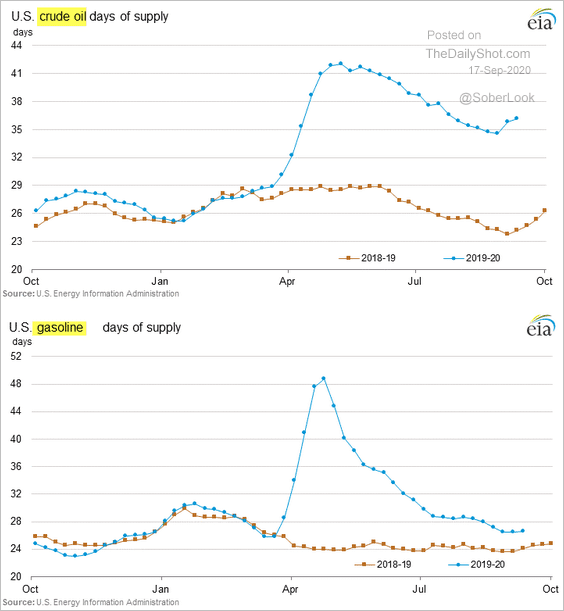
1. US gasoline demand remains soft.
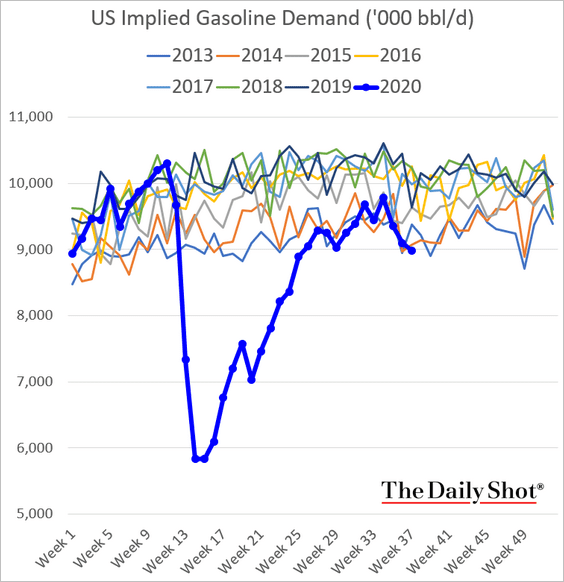
Here is the overall refined product demand.
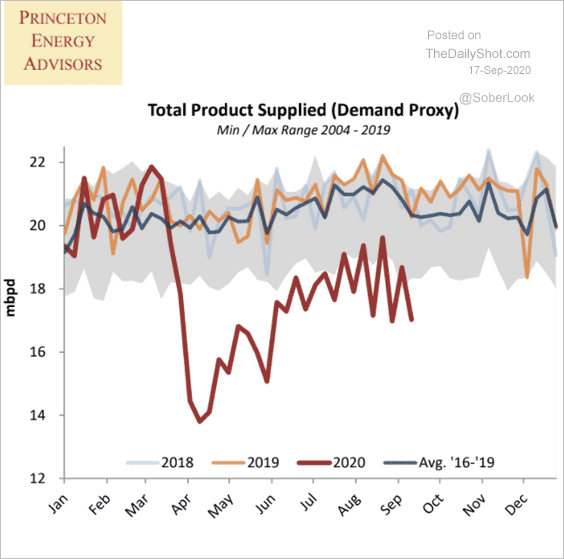 Source: Princeton Energy Advisors
——————–
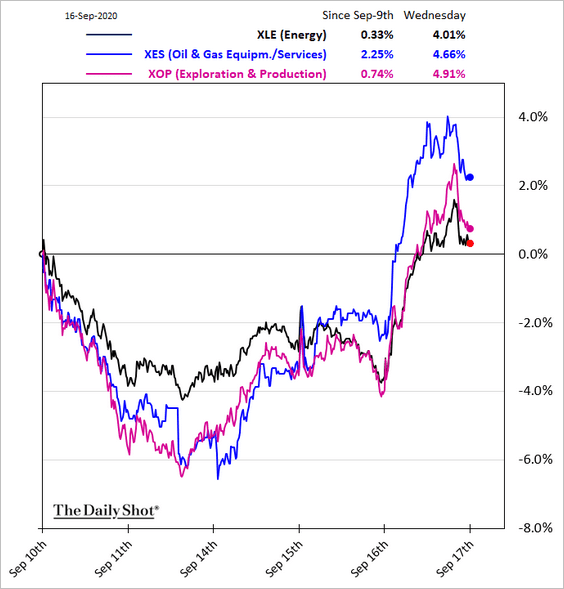
2. US crude oil inventories were lower than expected last week, boosting oil prices.
Energy shares outperformed.
——————–
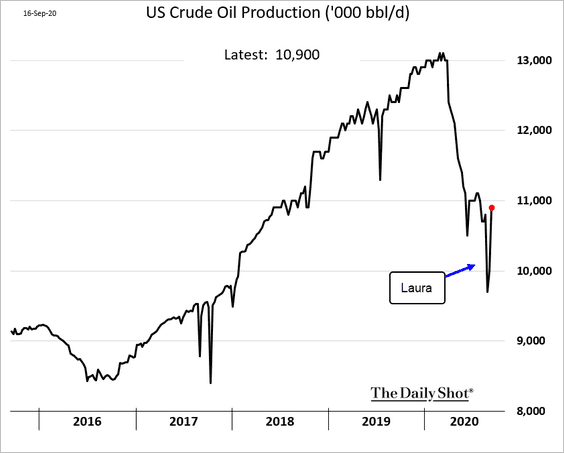
3. US crude oil production rebounded after Laura-related shutdowns.
4. This chart shows US crude oil exports by top destinations.
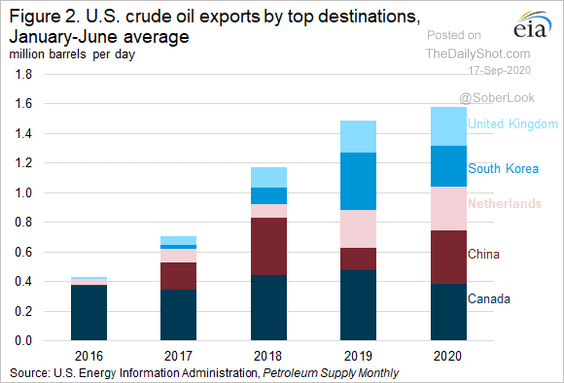 Source: EIA
5. Natural gas prices in Europe and Asia have improved.
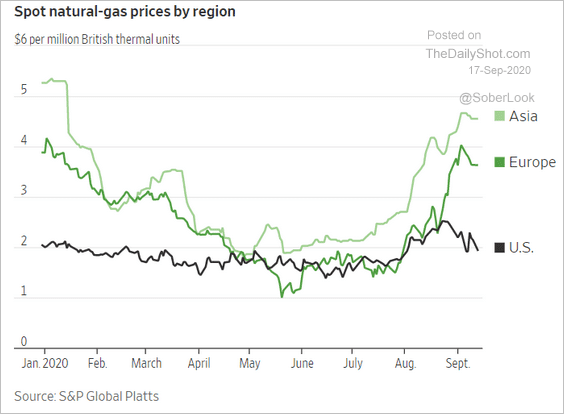 Source: @WSJ Read full article
US LNG exports to Europe are profitable again.
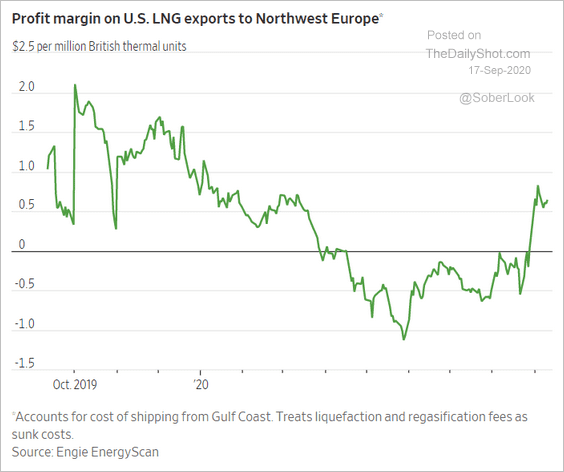 Source: @WSJ Read full article
Equities
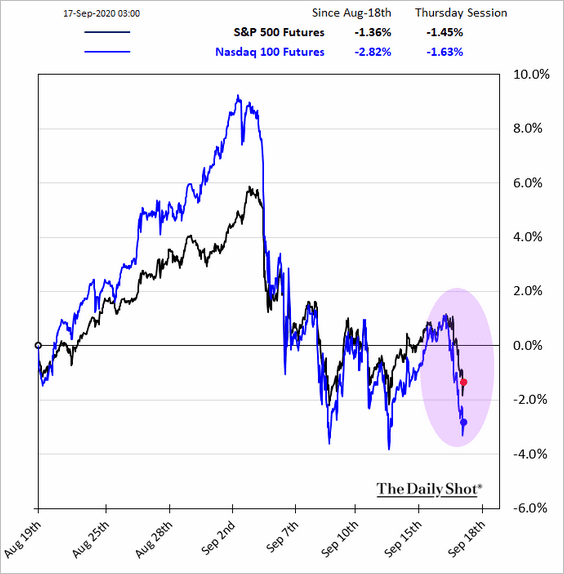
1. Stock futures are heavy after the Fed’s meeting. The market was hoping for more clarity on QE but didn’t get it.
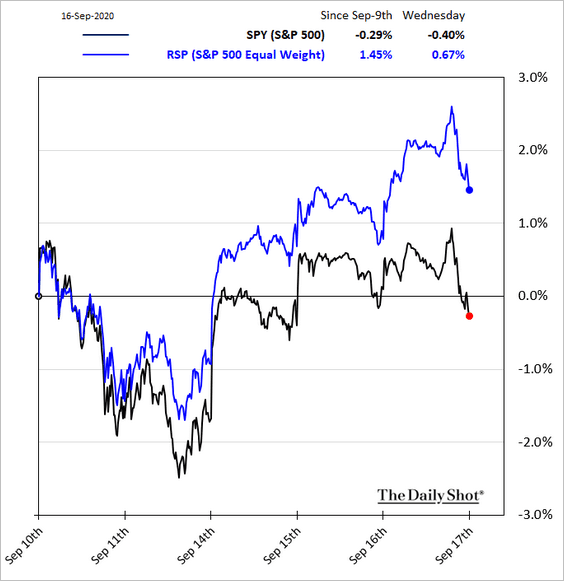
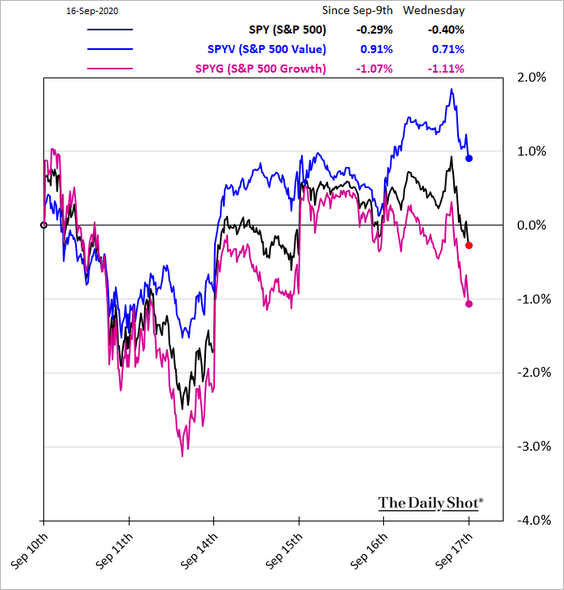
2. Smaller companies and value stocks have been outperforming,
• Small caps:
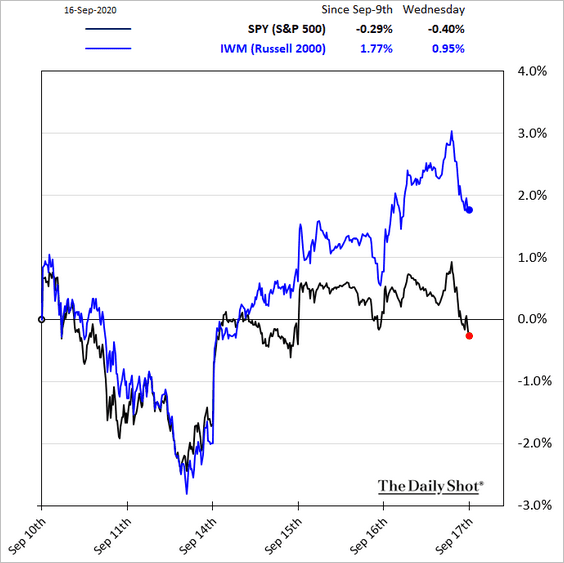
• Equal-weight S&P 500:
• Growth vs. value:
——————–
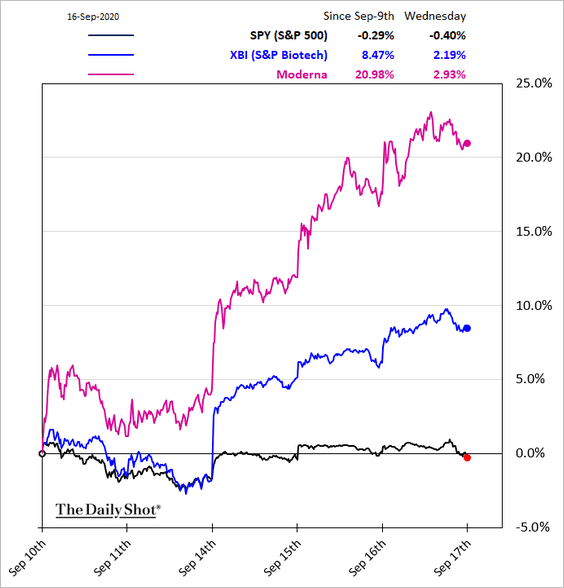
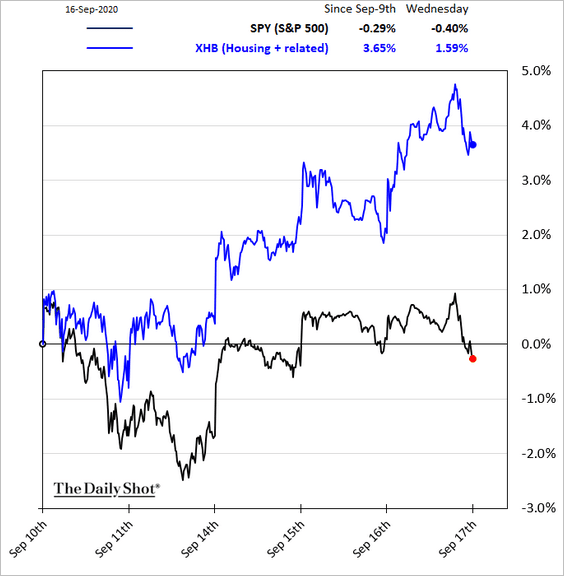
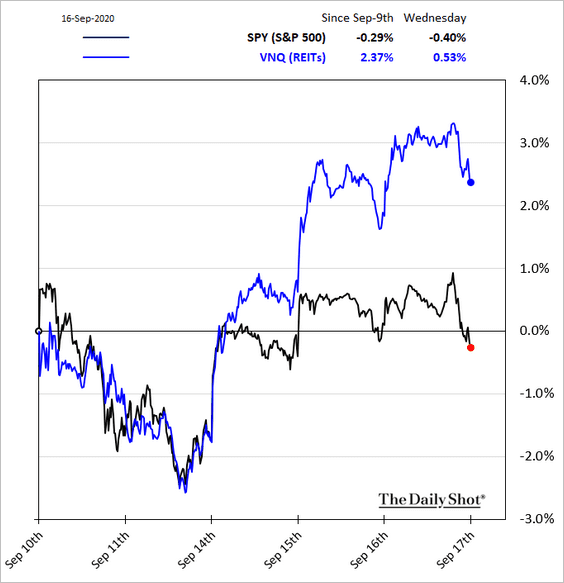
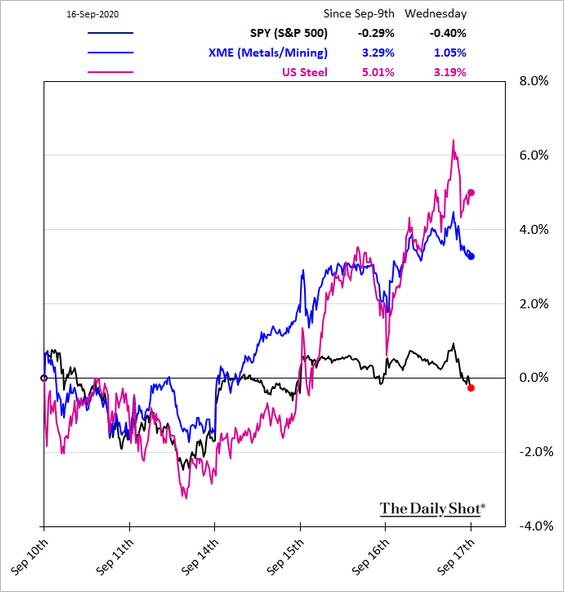
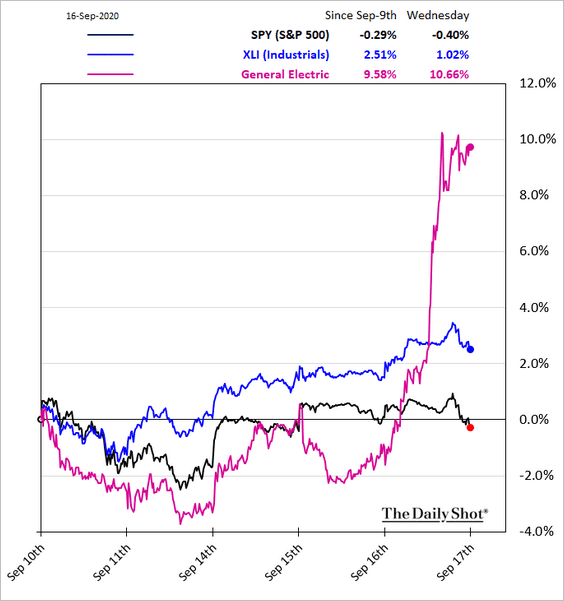
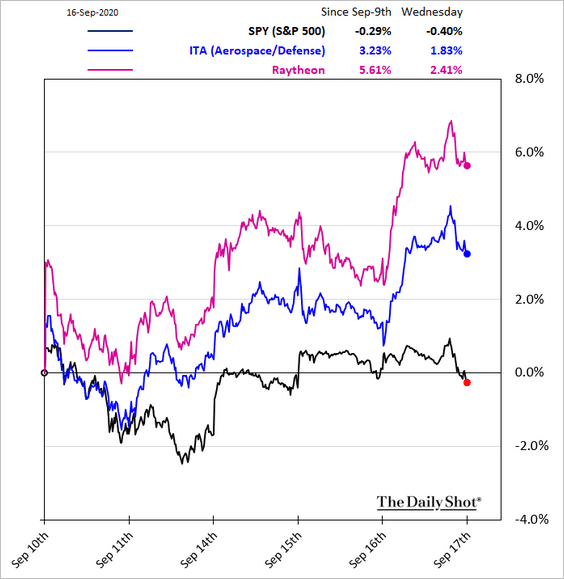
3. Next, we have some sector updates.
• Biotech:
• Housing:
• REITs:
• Metals & Mining:
• Industrials and defense:
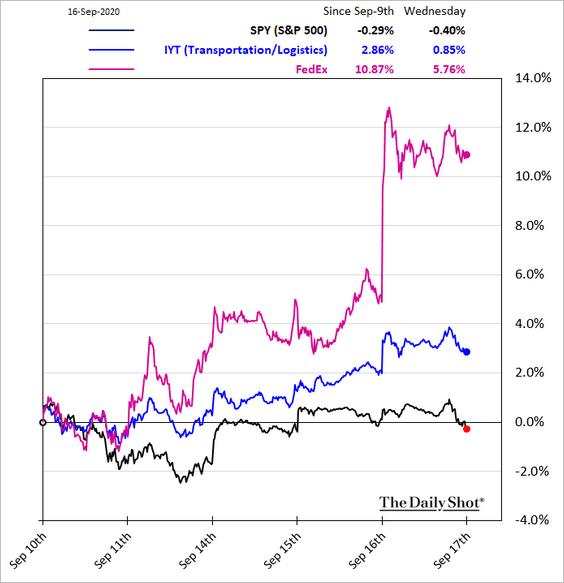
• Transportation:
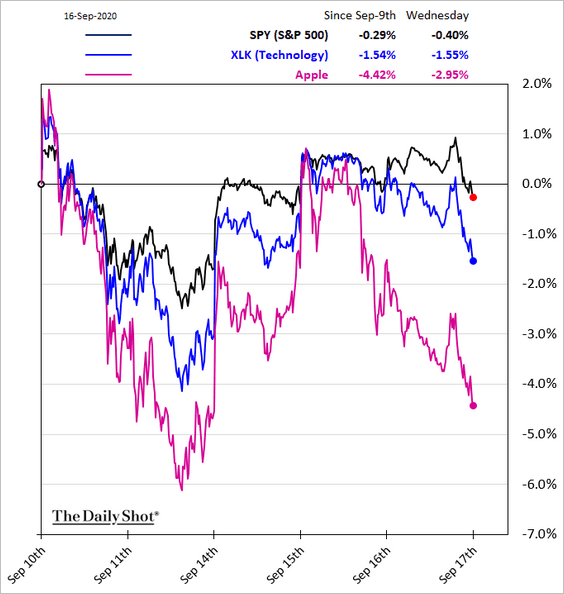
• Tech:
——————–
4. What are the macro catalysts for US equities going forward?
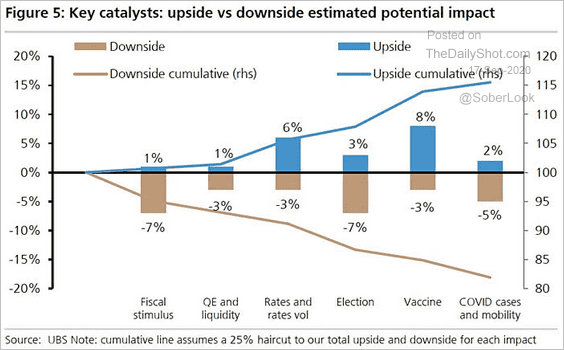 Source: @ISABELNET_SA, @UBS
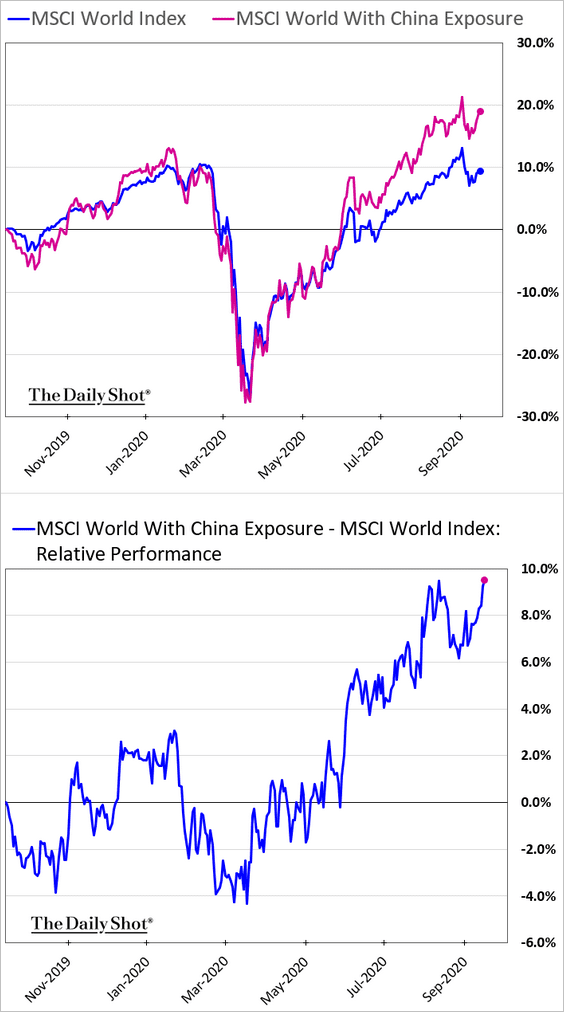
5. The market continues to reward companies with China exposure.
6. Here are a couple of charts on retail/options speculative frenzy.
• From Alpine Macro:
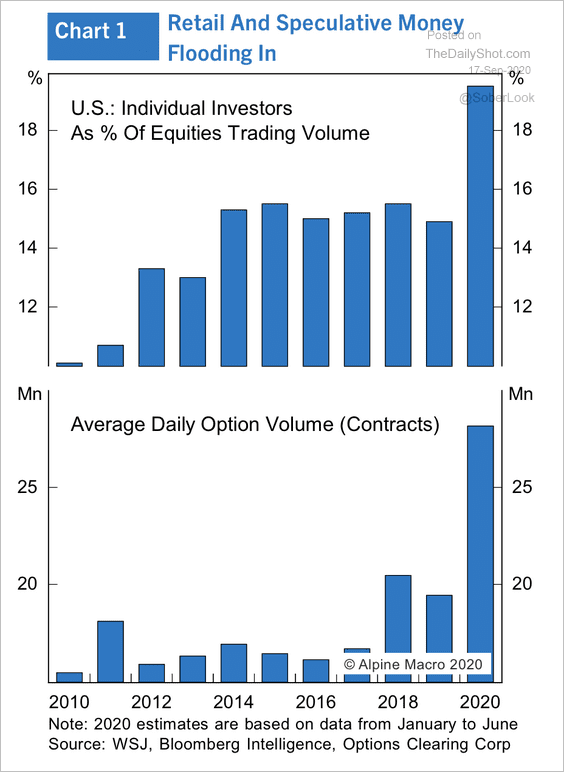 Source: Alpine Macro
• From Deutsche Bank:
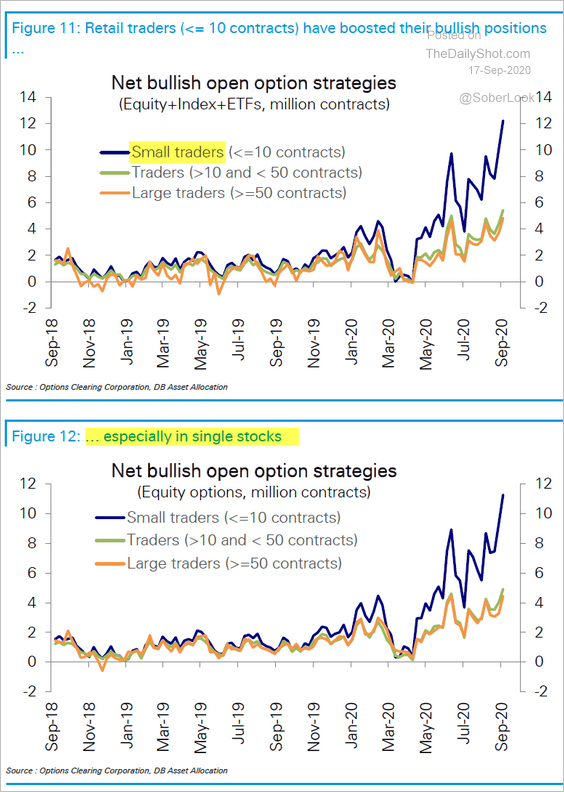 Source: Deutsche Bank Research
——————–
7. The speed of the rebound from March lows has been remarkable.
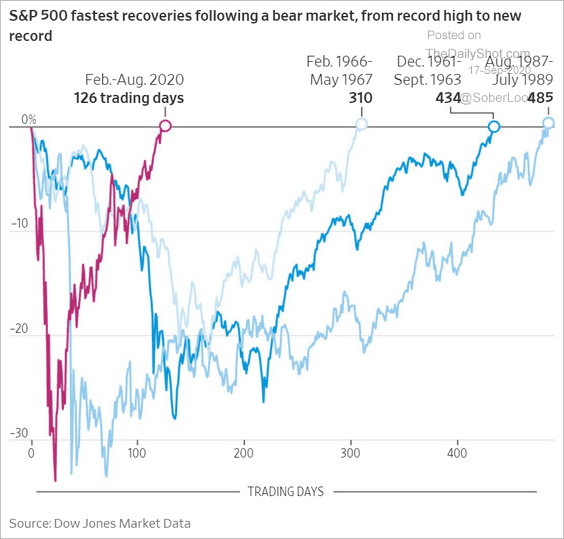 Source: @WSJ Read full article
8. This chart shows the S&P 500 buybacks and dividends over the past couple of decades.
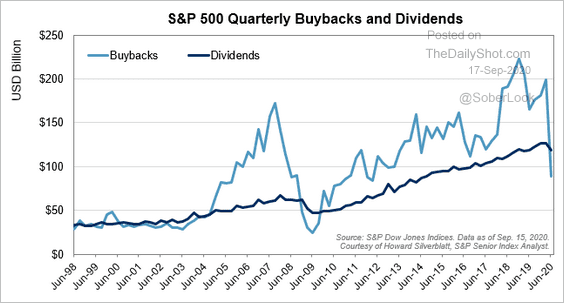 Source: S&P Global Market Intelligence
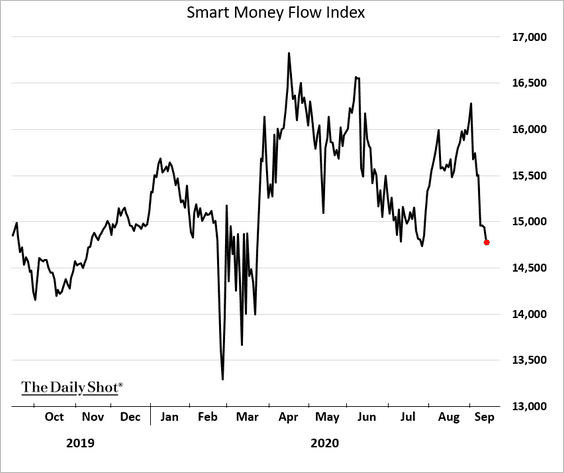
9. The Smart Money Flow Index has been weakening.
Global Developments
1. The daily COVID cases hit a new high, boosted by India.
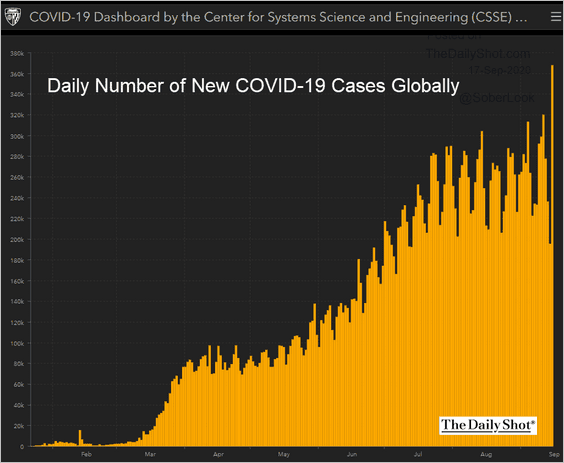 Source: JHU CSSE
2. Nonetheless, interest in travel has been gradually recovering.
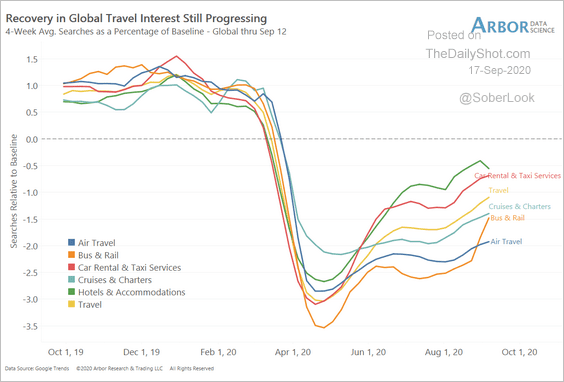 Source: Arbor Research & Trading
3. The ZEW survey points to higher global yields and more upside for financials and industrials.
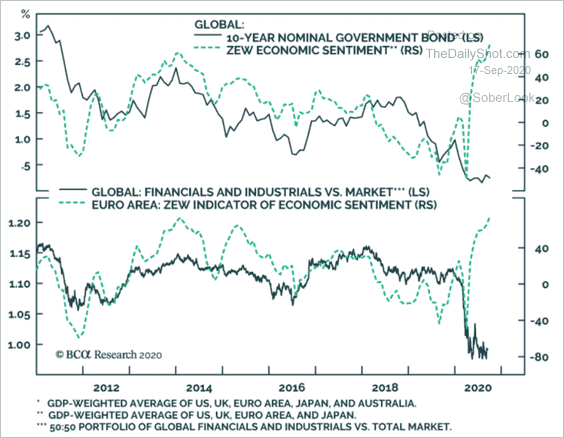 Source: BCA Research
4. Yields in the UK, US, and Germany have been correlated, suggesting that domestic policies may be less relevant for bonds.
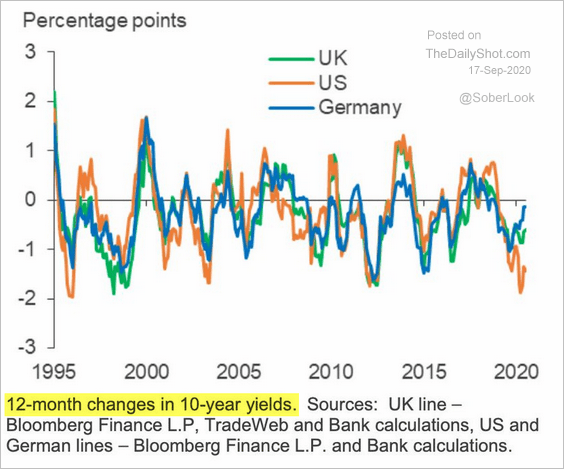 Source: @adam_tooze, @bankofengland Read full article
5. This chart shows the evolution of corporate tax rates in select economies.
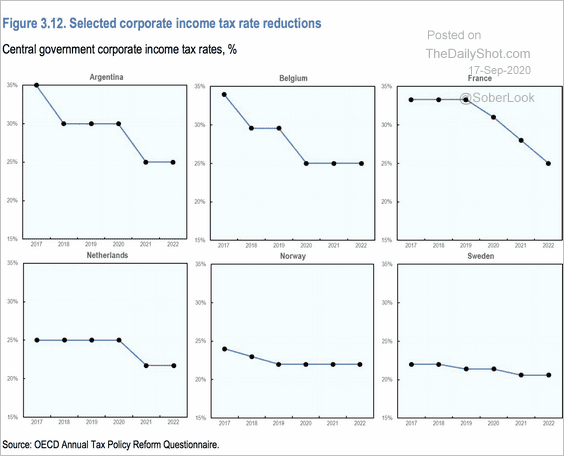 Source: OECD Read full article
——————–
Food for Thought
1. Companies’ investment expectations based on the election outcome:
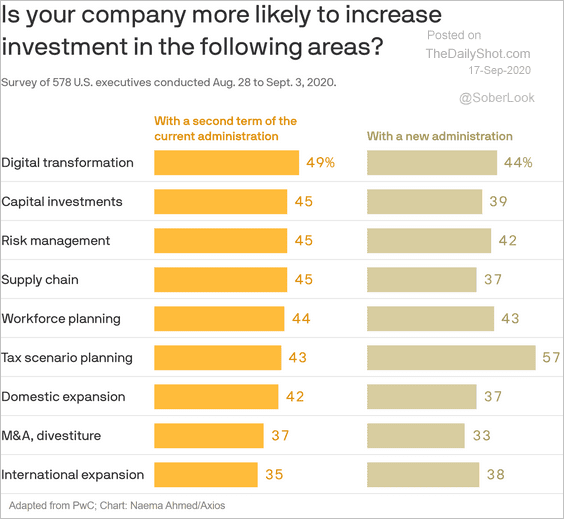 Source: @axios Read full article
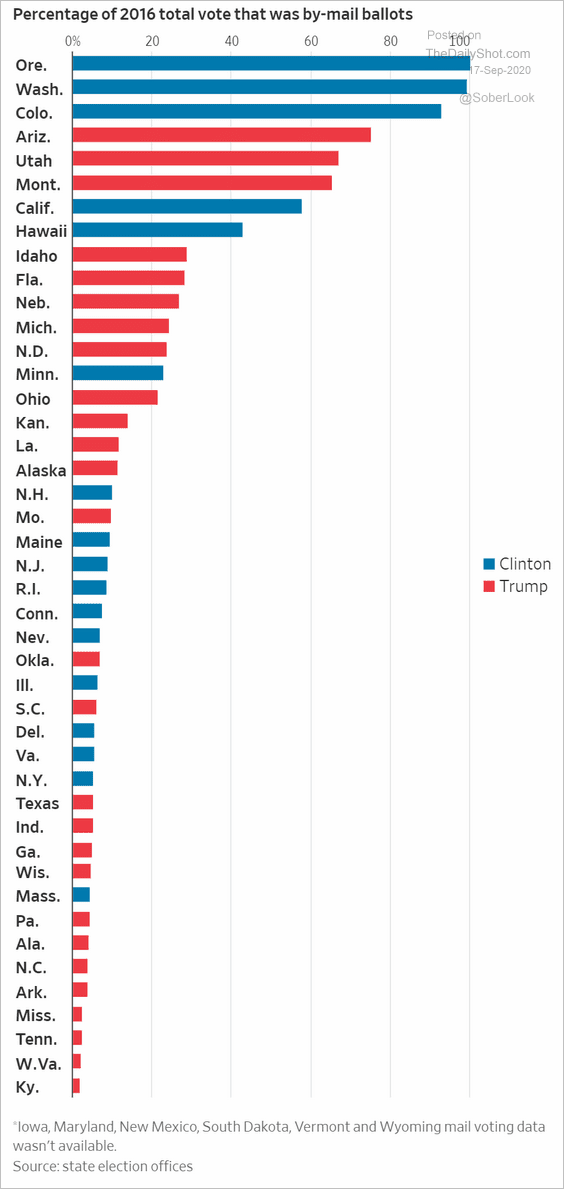
2. Voting by mail (2 charts):
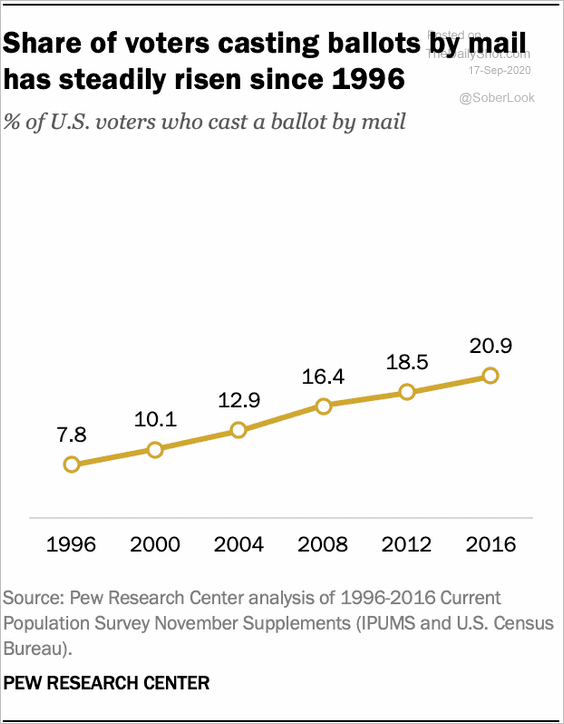 Source: @FactTank Read full article
 Source: @WSJ Read full article
——————–
3. Most commonly used fuel type for electricity production:
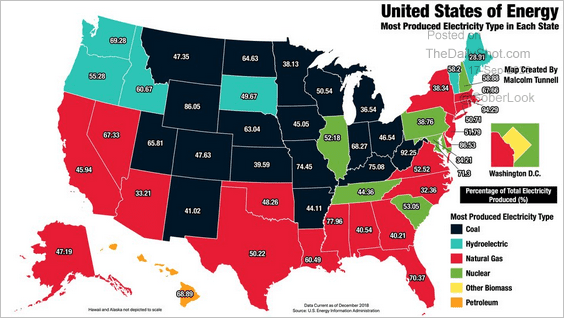 Source: @simongerman600
4. A shift in energy-intensive manufacturing to developing economies:
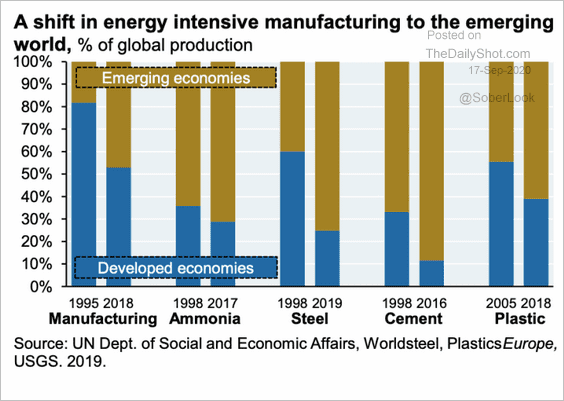 Source: JP Morgan, Snippet Finance Read full article
5. Highest-paid female athletes:
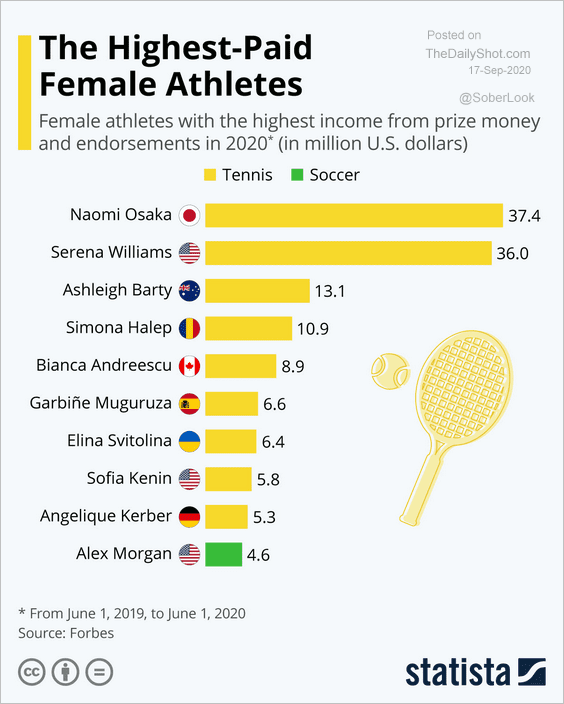 Source: Statista
6. Dating:
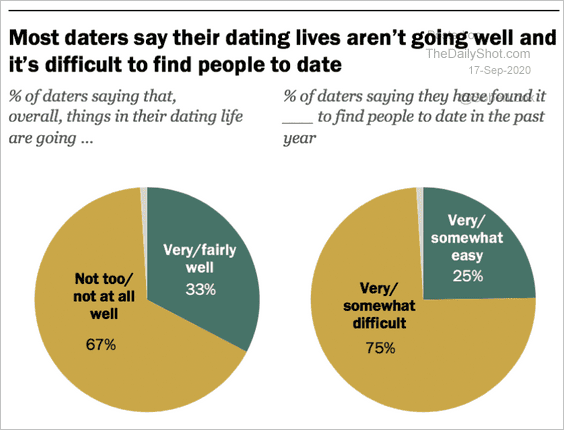 Source: Pew Research Center Read full article
7. COVID-tracing app downloads:
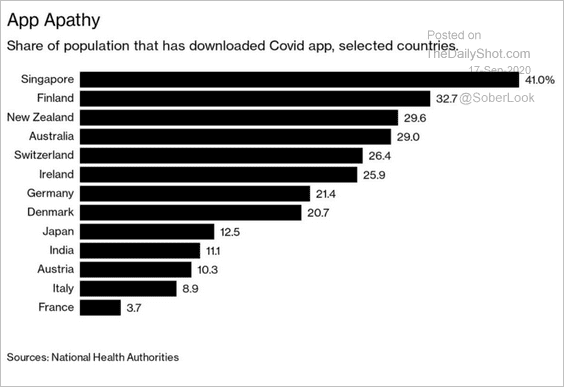 Source: @BW Read full article
8. Vaccine blocks:
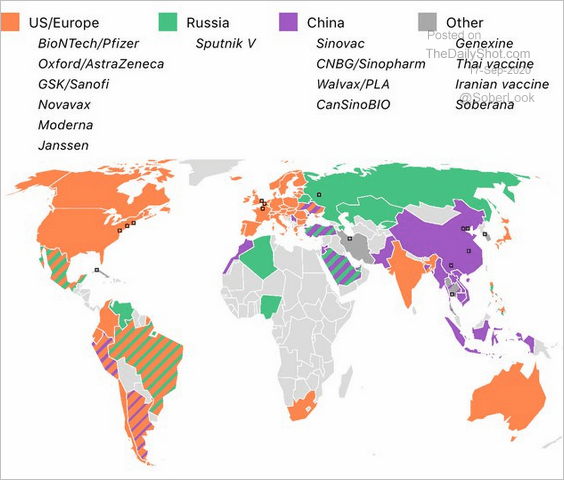 Source: @sasha_trub Read full article
9. Eighteen years ago:
 Source: James Eagle
——————–