
The Daily Shot: 18-Nov-20
• The United States
• Canada
• The United Kingdom
• Europe
• Asia – Pacific
• China
• Emerging Markets
• Cryptocurrency:
• Commodities
• Equities
• Credit
• Rates
• Global Developments
• Food for Thought
The United States
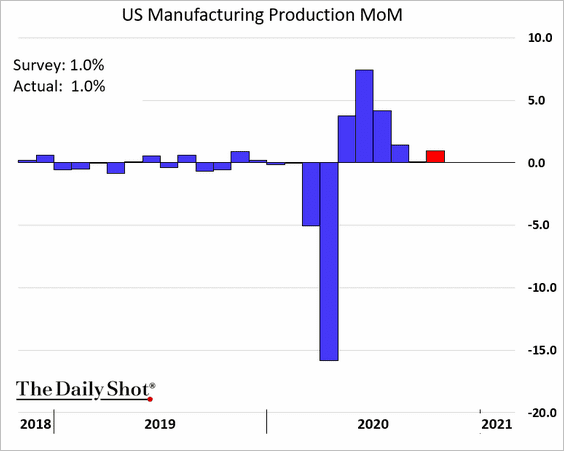
1. US factory output rose last month, in line with expectations.
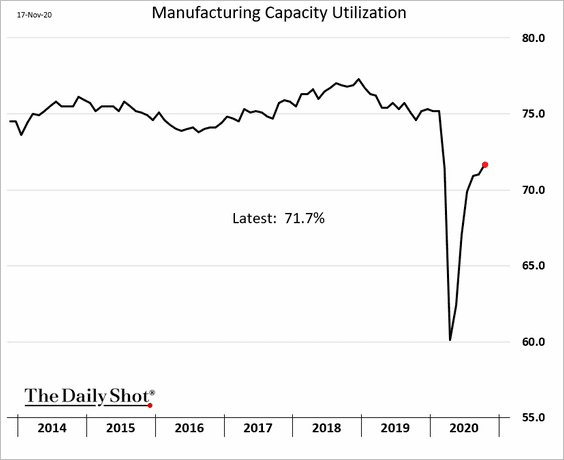
Manufacturing capacity utilization continues to improve.
Here is the total industrial production performance vs. the 2008 recession.
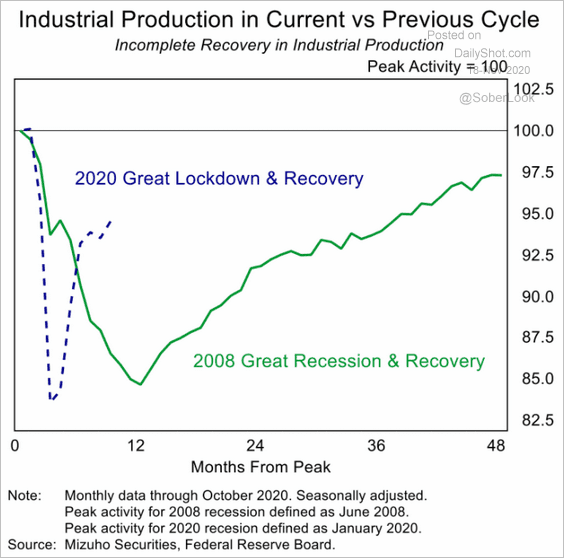 Source: Mizuho Securities USA
——————–
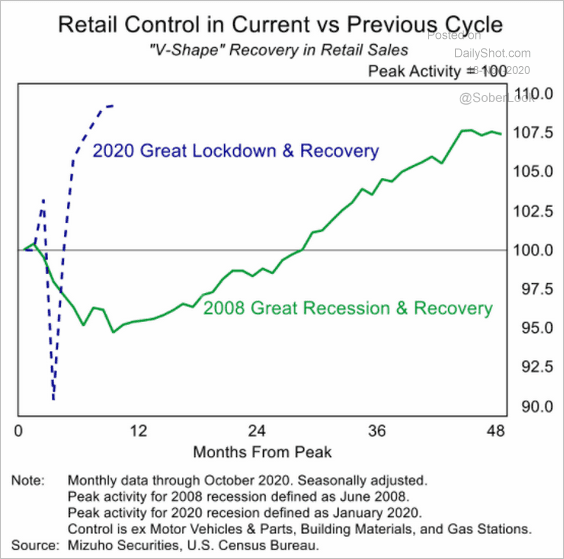
2. October retail sales were softer than expected amid signs of consumer activity losing momentum.
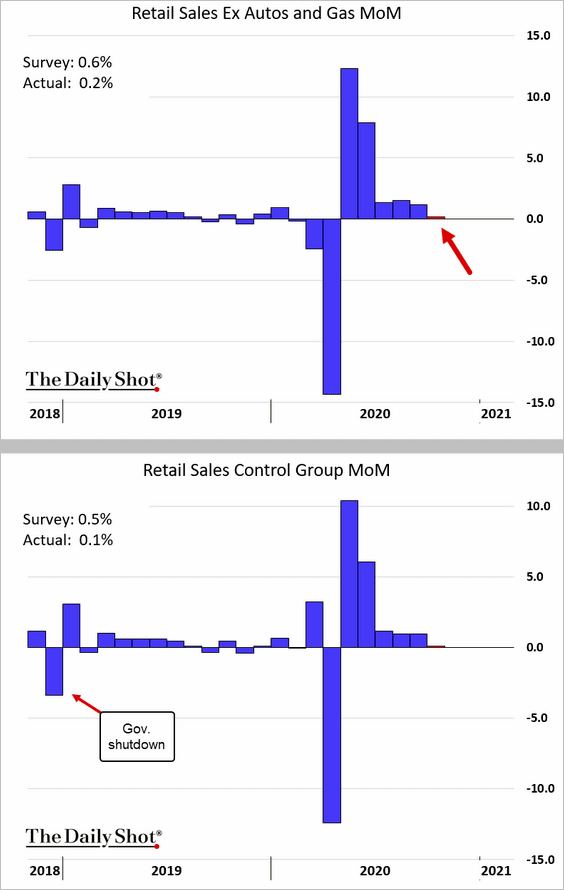
• Nonetheless, the overall rebound has been remarkable.
 Source: Mizuho Securities USA
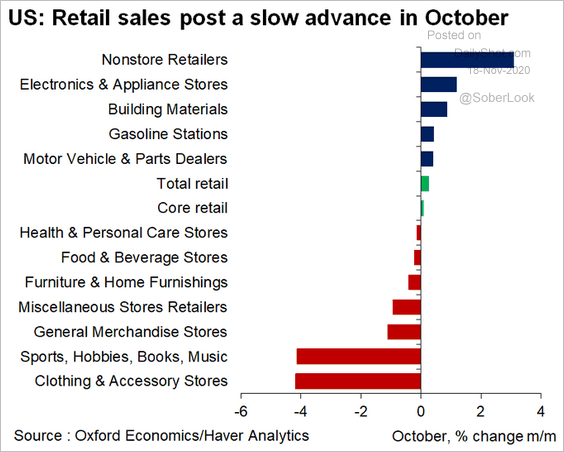
• Here is the breakdown by sector.
 Source: @GregDaco
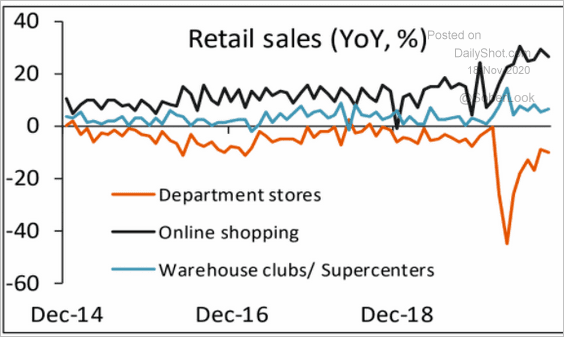
• Gains in online sales activity have been impressive.
 Source: Piper Sandler
• Below is the “lockdown” divergence.
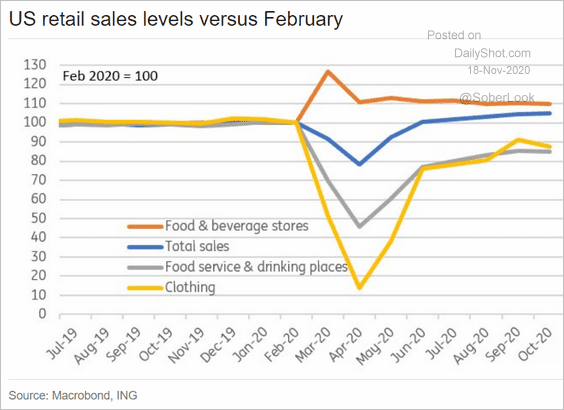 Source: ING
Retail sales face significant headwinds going forward.
• Increased concerns about the pandemic:
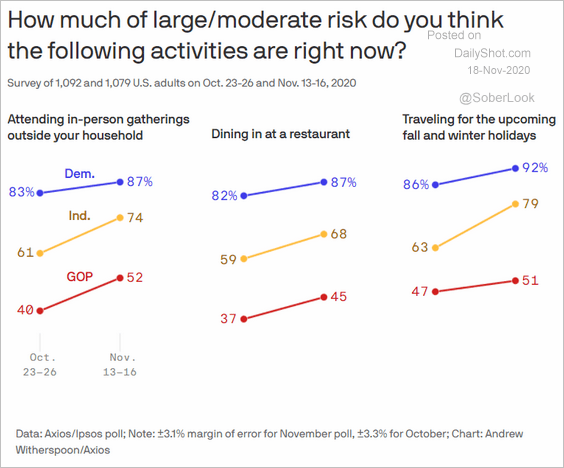 Source: @axios Read full article
• COVID-related hospitalizations:
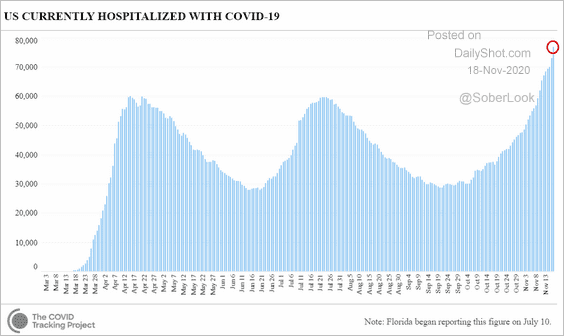 Source: CovidTracking.com
• Mobility:
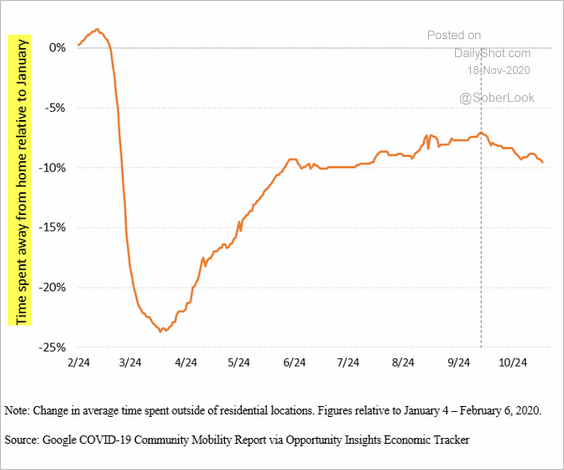 Source: JP Morgan, @SteveRattner
• Retail foot traffic:
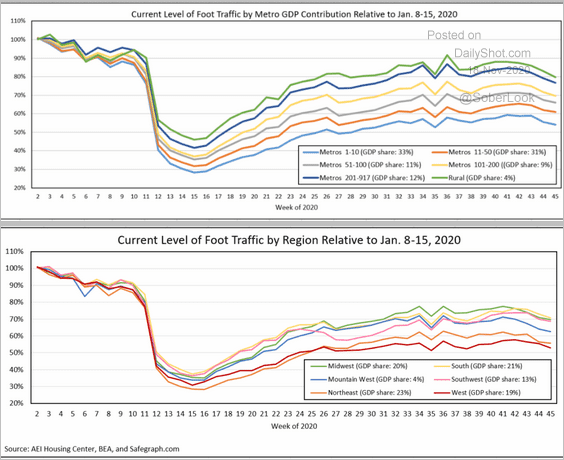 Source: AEI Housing Center Read full article
• Chase card spending:
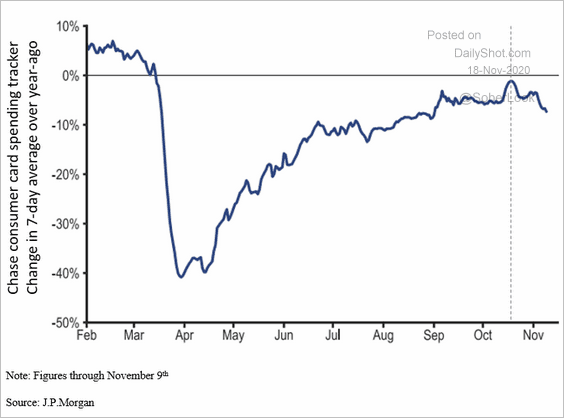 Source: JP Morgan, @peterdwilliams
——————–
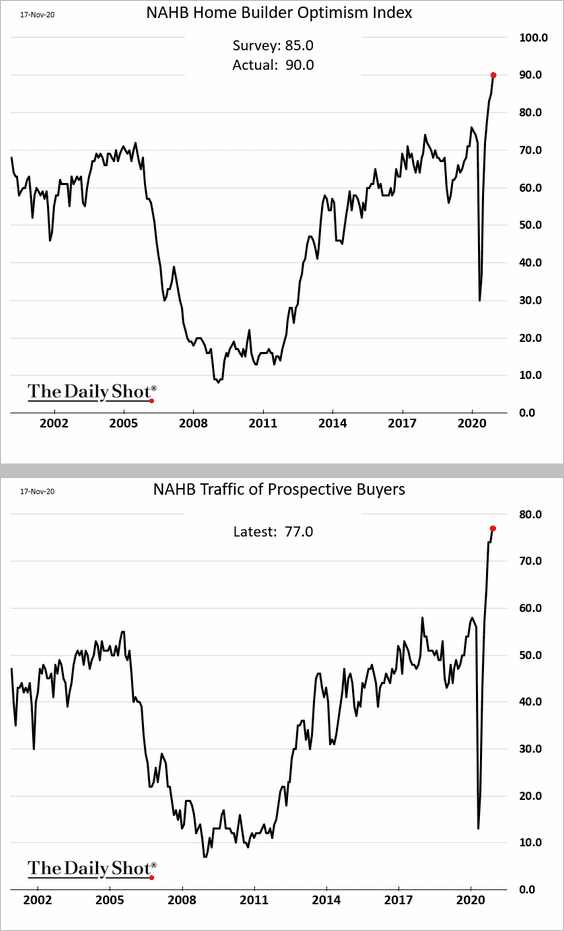
3. Homebuilder optimism hit another record as demand soars (2nd chart).
4. Next, we have some updates on inflation
• Import prices rose again, boosted by a weaker US dollar.
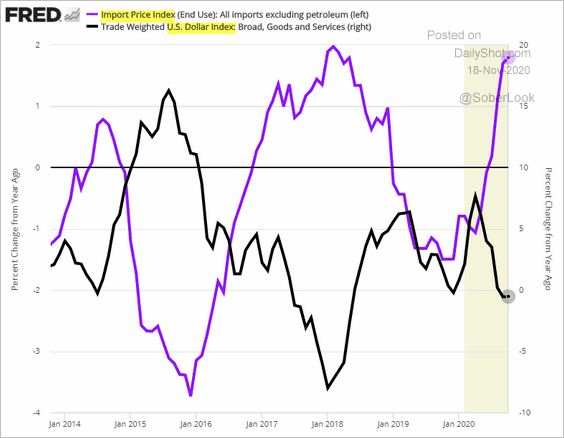
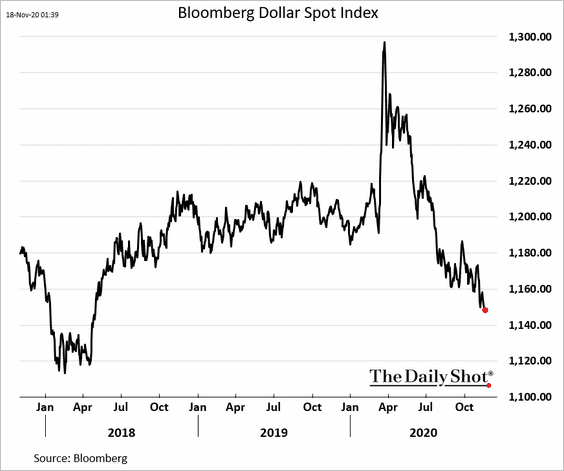
And the dollar continues to retreat.
• For now, market-based inflation expectations have been stable.
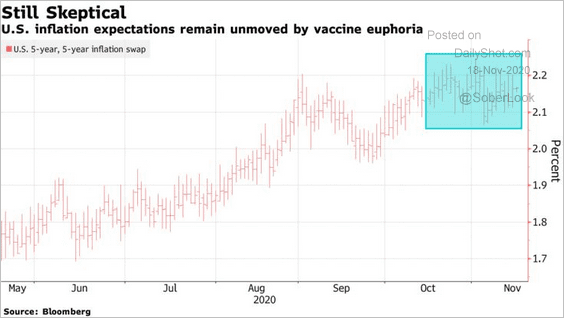 Source: @markets Read full article
• Morgan Stanley expects the core PCE inflation to cross 2% sooner than in past cycles.
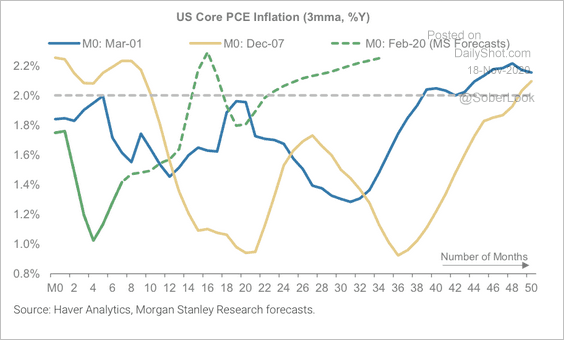 Source: Morgan Stanley Research
In previous cycles, the Fed tightened policy well before inflation reached 2%.
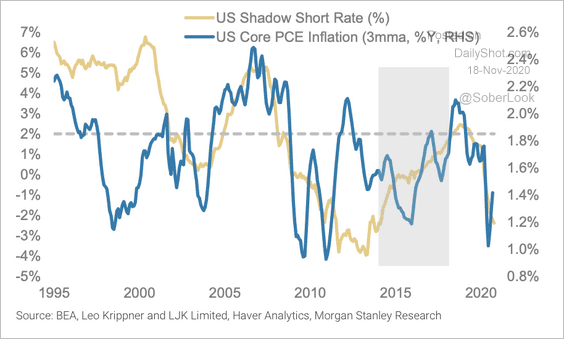 Source: Morgan Stanley Research
• However, the relatively weak lending environment could cap inflation.
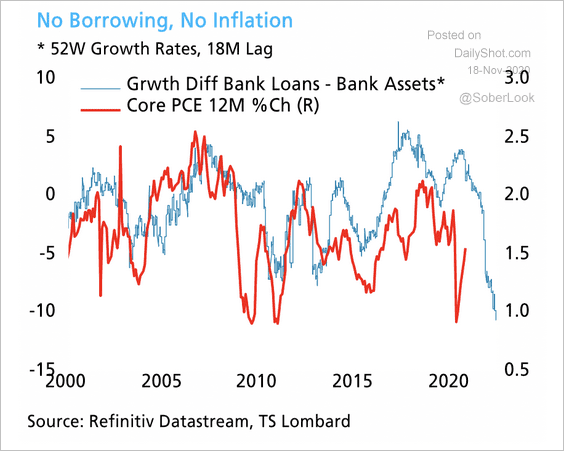 Source: TS Lombard
• This chart shows the CPI trend over the past three decades.
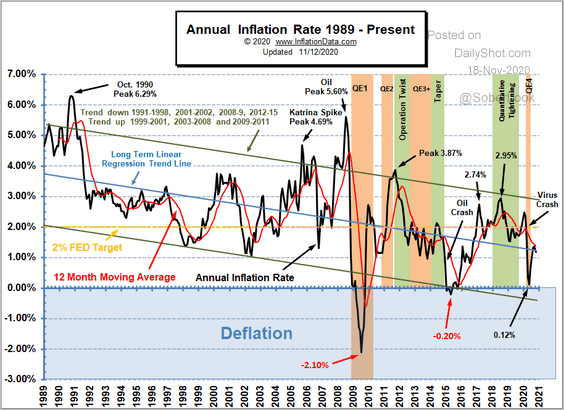 Source: InflationData Read full article
• Here is the US inflation timeline (from Torsten Slok).
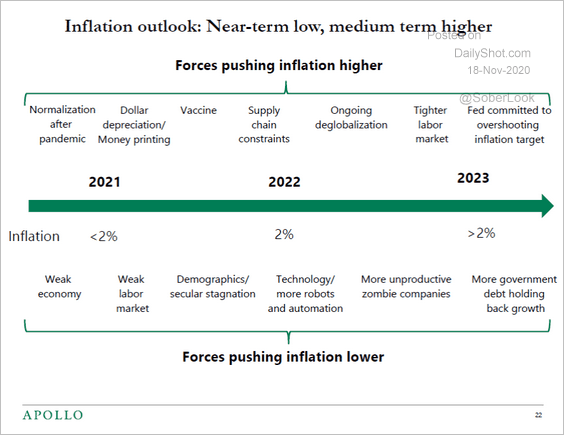 Source: Torsten Slok, Apollo
Canada
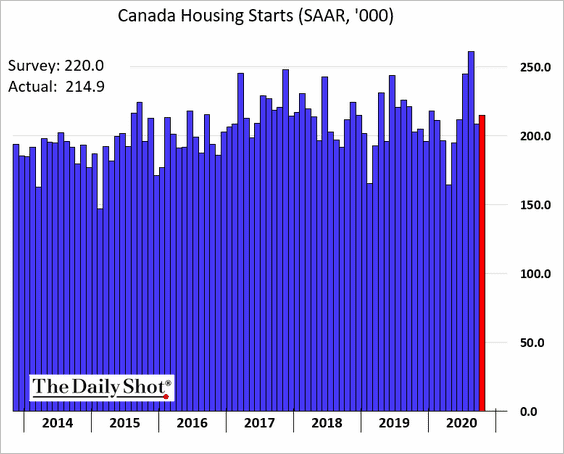
1. Housing starts remain stable.
2. Many Canadian firms filed for Chapter 15 bankruptcy protection in the US.
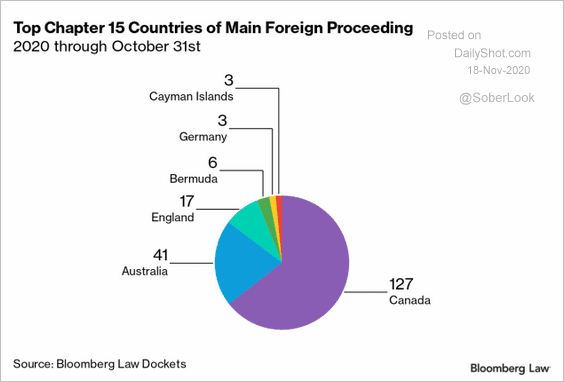 Source: @TeadraPugh Read full article
The United Kingdom
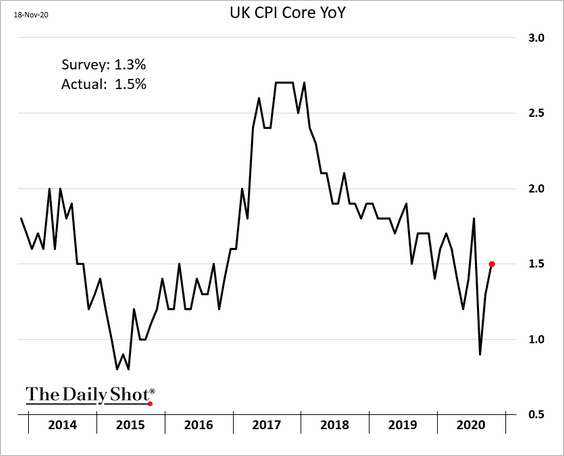
1. The consumer inflation report was a bit firmer than expected. Here is the core CPI.
Some sectors have seen significant inflation this year.
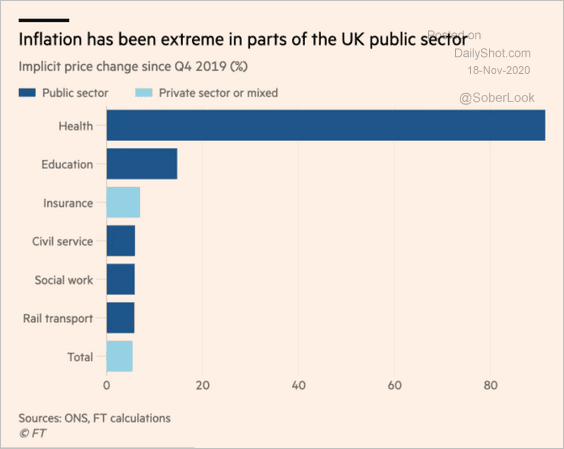 Source: @financialtimes Read full article
——————–
2. Pantheon Macroeconomics expects a GDP decline this month.
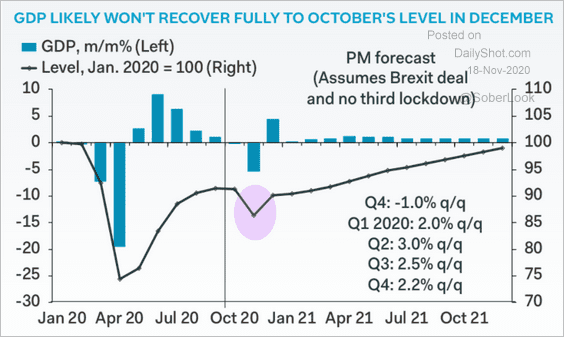 Source: Pantheon Macroeconomics
3. The inverse correlation between the pound and UK stocks has been elevated.
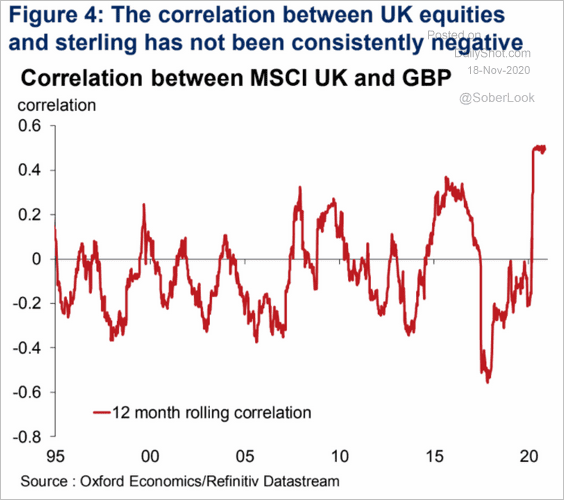 Source: Oxford Economics
4. The job recovery has been uneven.
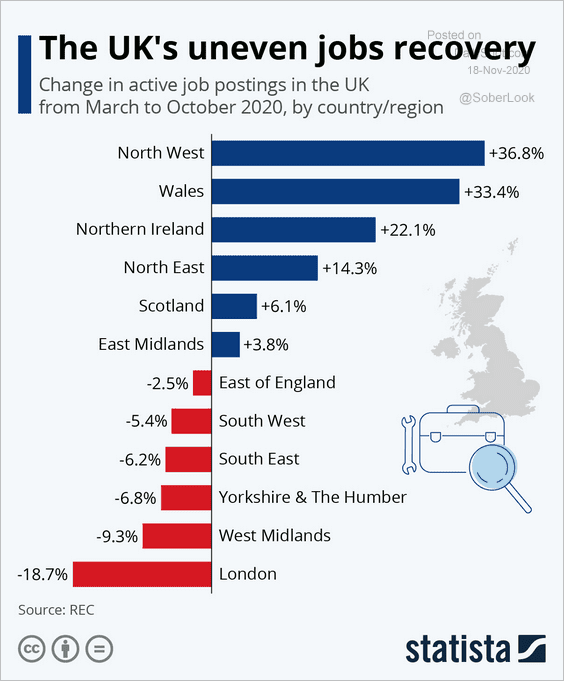 Source: Statista
Europe
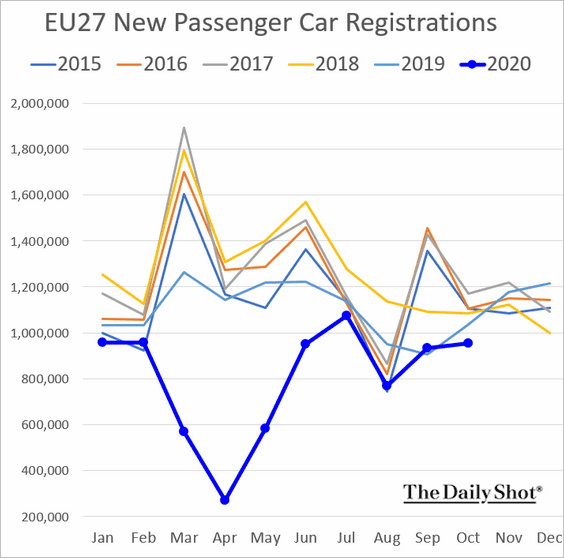
1. New car registrations are back below the 5-year range.
2. Europe’s mobility declined more than in the US.
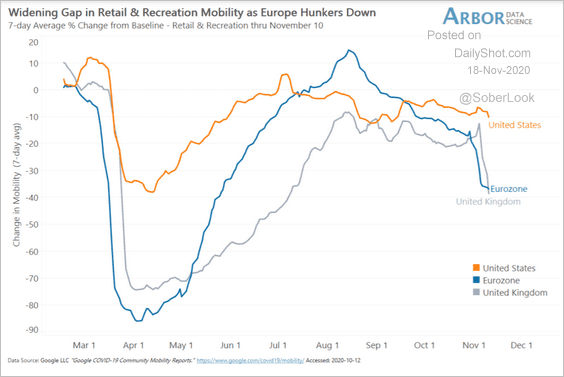 Source: Arbor Research & Trading
3. Here is the expected demographic drag on the GDP (due to a shrinking workforce).
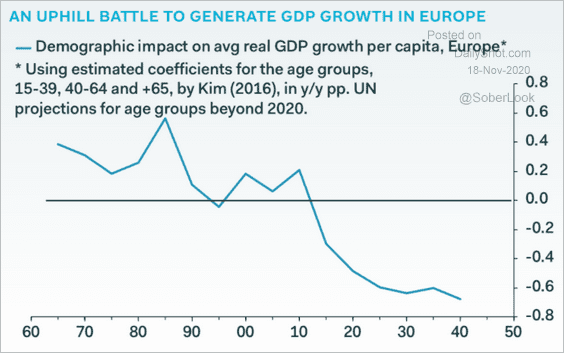 Source: Pantheon Macroeconomics
4. The euro is the most undervalued currency among the G10 relative to the dollar, while the Swiss franc is the most overvalued, according to OECD calculations.
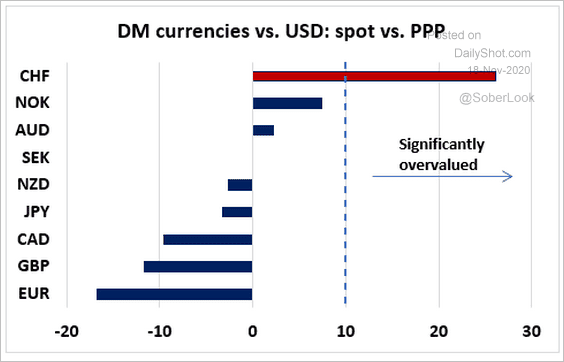 Source: @RothkoResearch
5. Norway’s consumer confidence remains depressed.
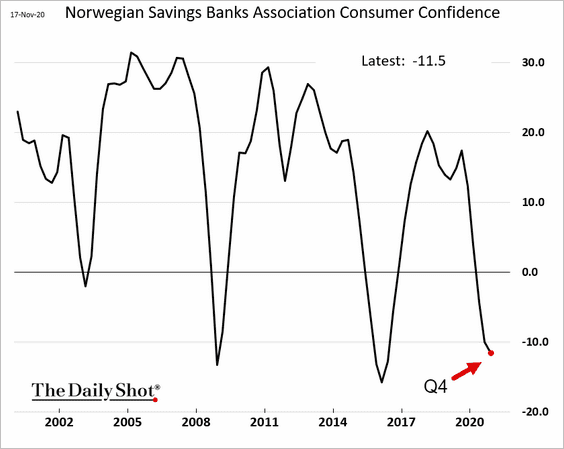
Below are some updates on the Norwegian krone.
• The krone positioning is still long, but foreigners typically sell NOK during Q4.
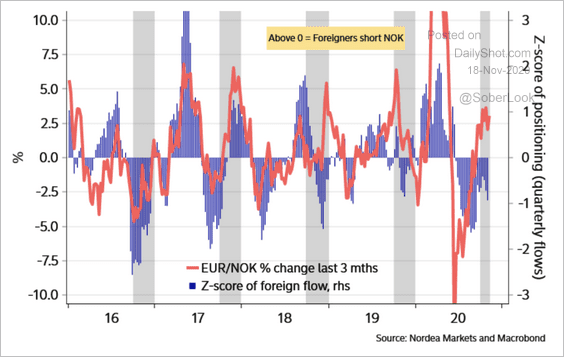 Source: Nordea Markets
• NOK has depreciated in recent years due to falling oil prices and an easy monetary policy stance.
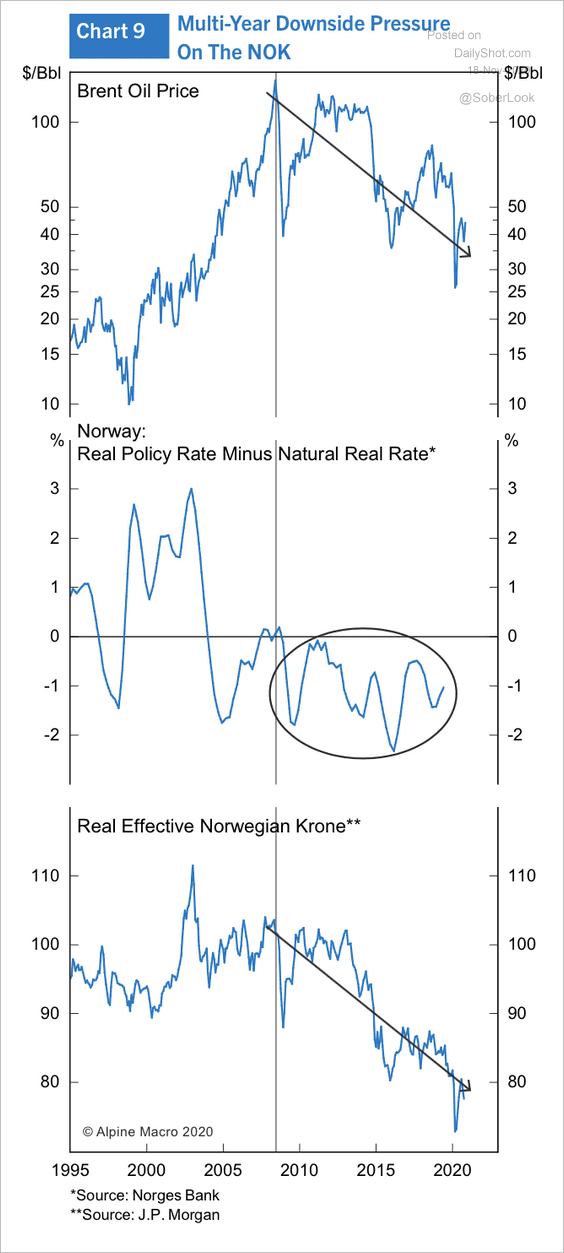 Source: Alpine Macro
• Higher oil prices should help NOK recover.
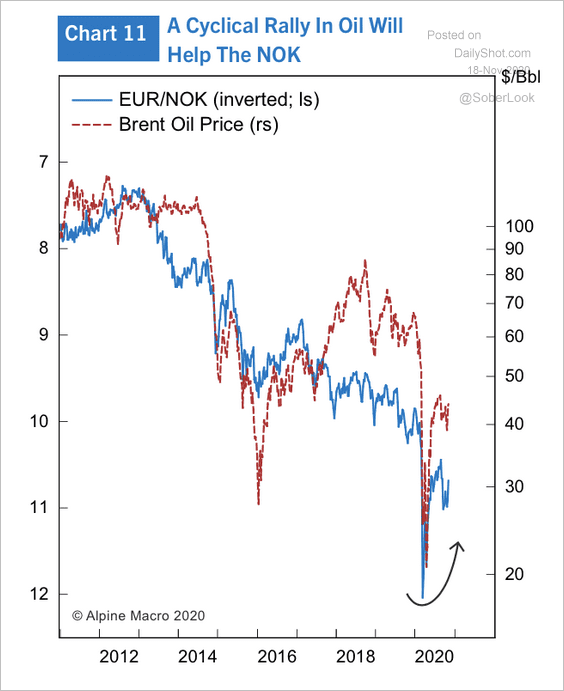 Source: Alpine Macro
Asia – Pacific
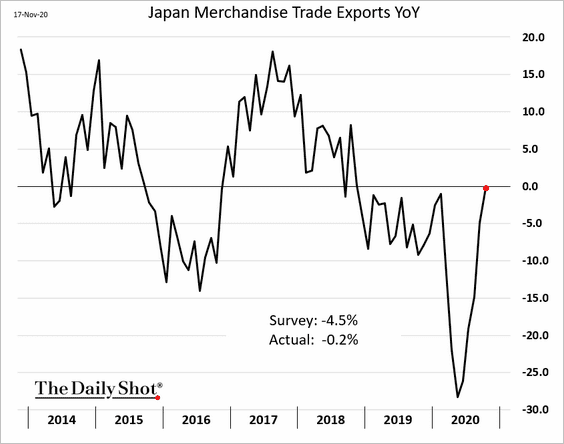
1. Japan’s exports have almost fully recovered vs. last year, topping economists’ forecasts.
2. The world’s busiest domestic flight routes are in Asia.
 Source: @markets Read full article
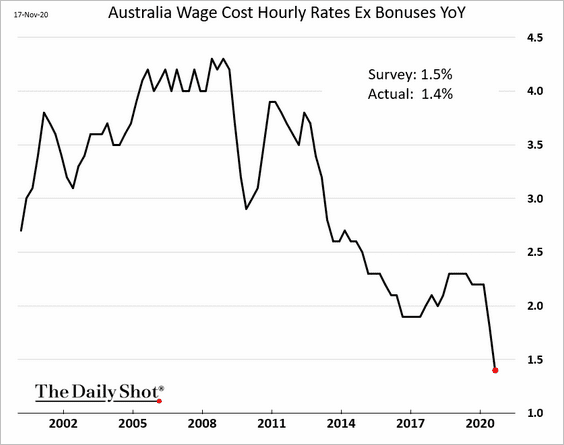
3. Australia’s wage growth hit a record low, with the latest quarterly figures coming in below consensus.
Here are some trends from ANZ Research.
• Wage growth including bonus:
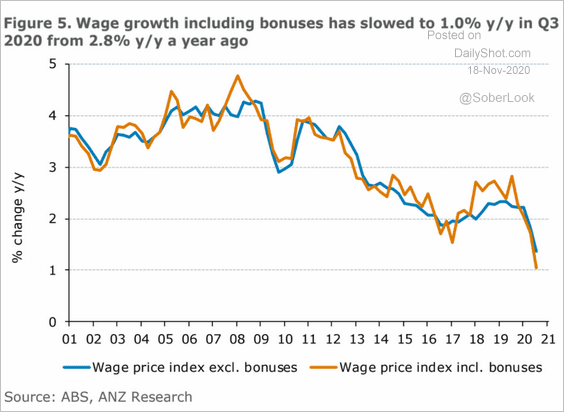 Source: ANZ Research
• By state:
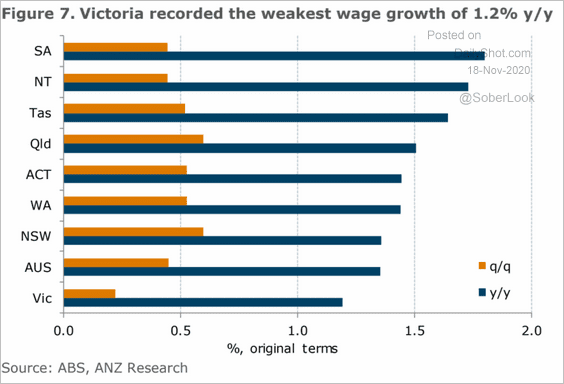 Source: ANZ Research
• Companies freezing wages:
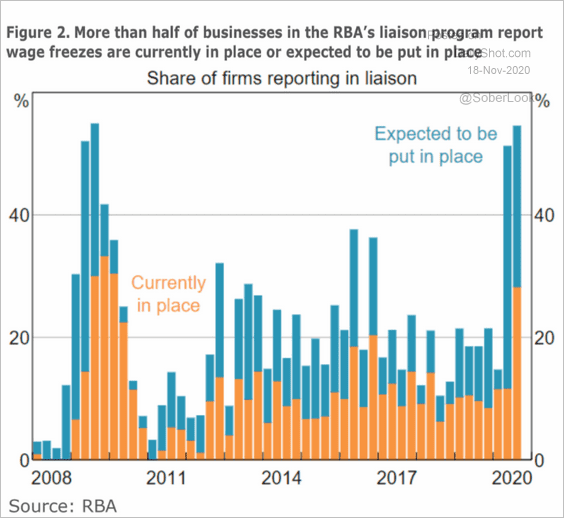 Source: ANZ Research
China
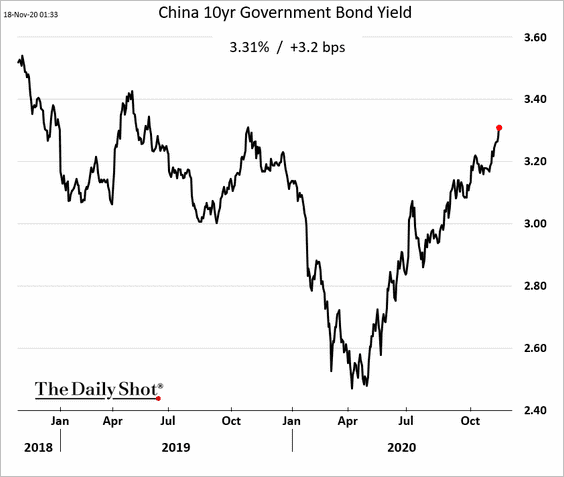
1. Bond yields continue to grind higher. At 3.3% China’s 10-year yield looks attractive relative to the rest of the world. As a result, the upward pressure on the renminbi will persist.
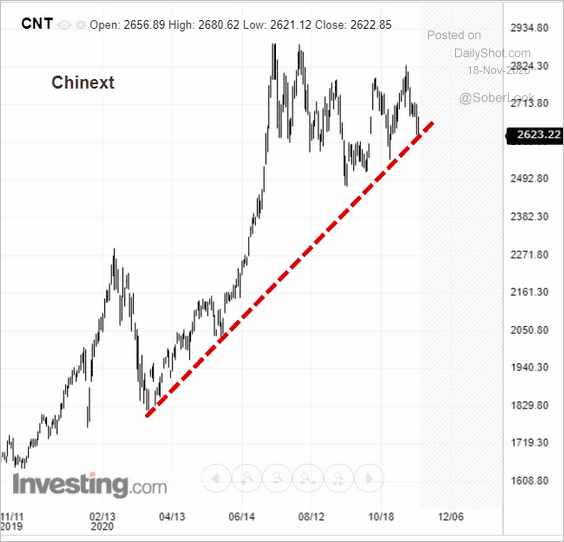
2. Chinext, the index of “new economy” smaller companies, is at support.
3. China’s productivity growth has been relatively weak.
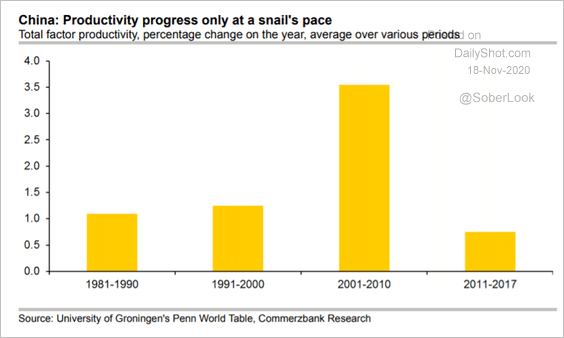 Source: Commerzbank Research
Here is a comparison with the rest of the world.
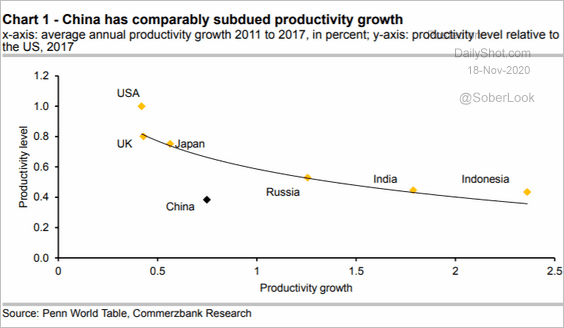 Source: Commerzbank Research
——————–
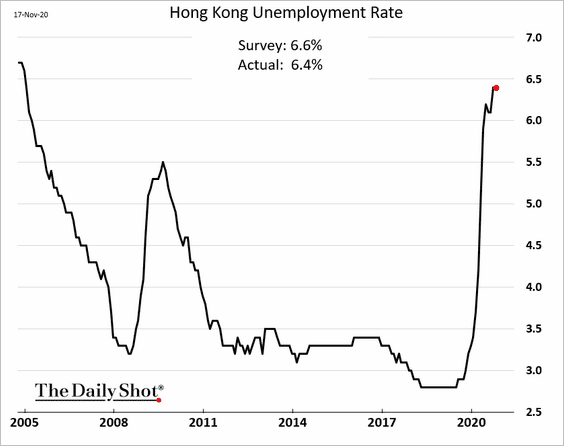
4. Hong Kong’s unemployment rate held steady last month (economists expected an increase).
Emerging Markets
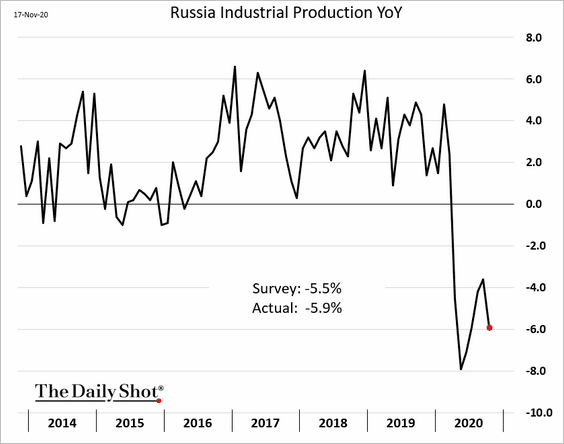
1. Russia’s industrial production deteriorated again last month.
2. Credit expansion in Turkey has been massive.
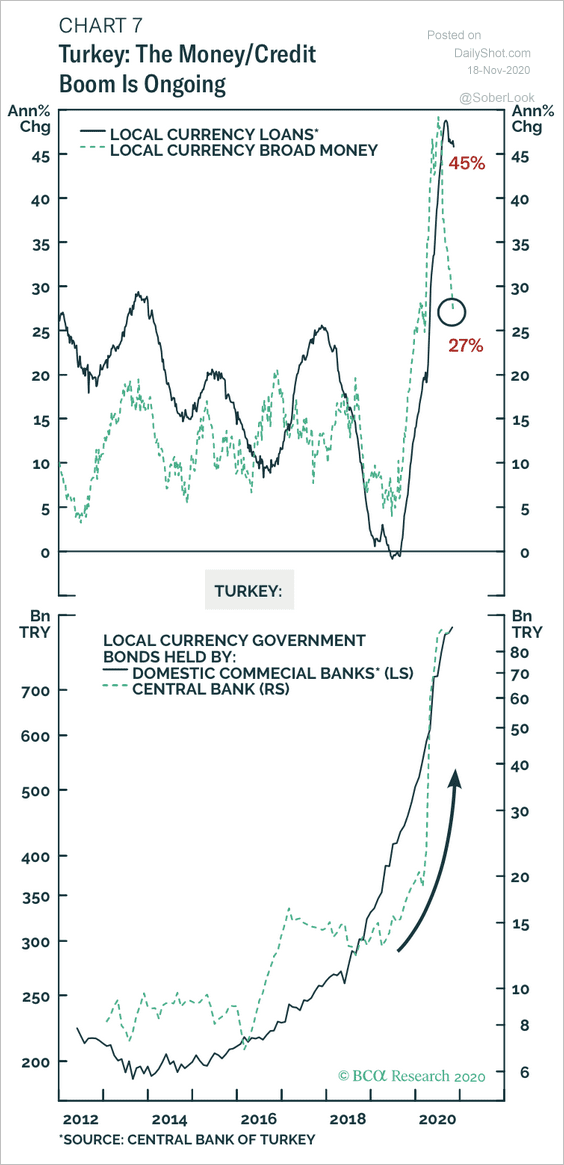 Source: BCA Research
3. LatAm stocks look attractive. The first panel shows the forward P/E ratio relative to the S&P 500. The second compares LatAm stock performance to copper prices.
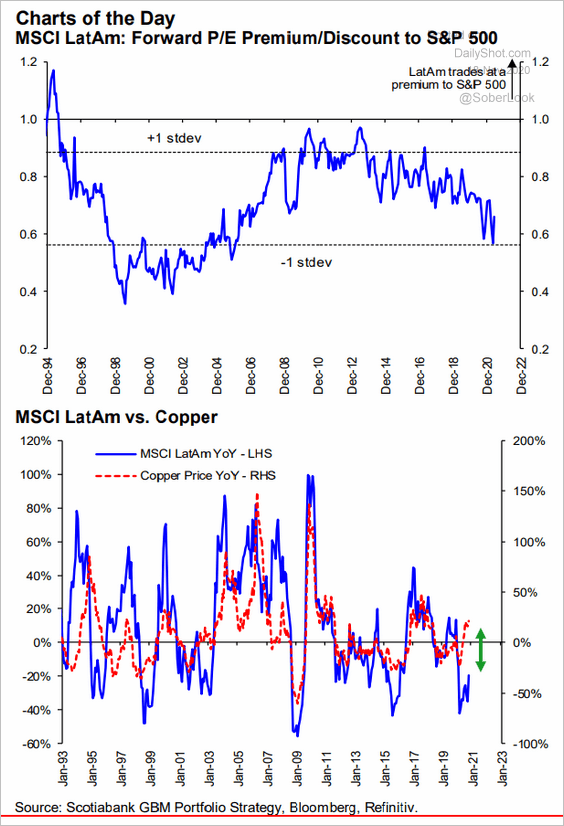 Source: Hugo Ste-Marie, Portfolio & Quantitative Strategy Global Equity Research, Scotia Capital
4. EM capital flows are recovering.
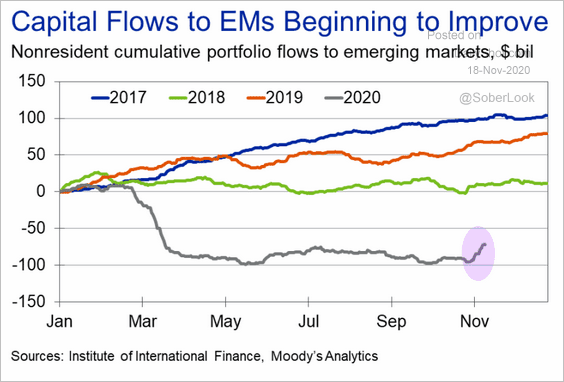 Source: Moody’s Analytics
5. Until the pandemic, the short-end of EM yield curves has been uncorrelated with manufacturing PMIs. This is because EM central banks often face issues other than economic slowdowns, such as currency depreciation, according to Morgan Stanley.
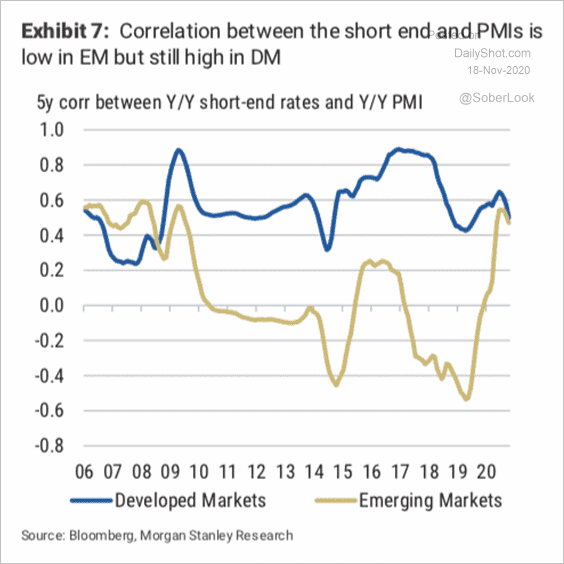 Source: Morgan Stanley Research
Cryptocurrency:
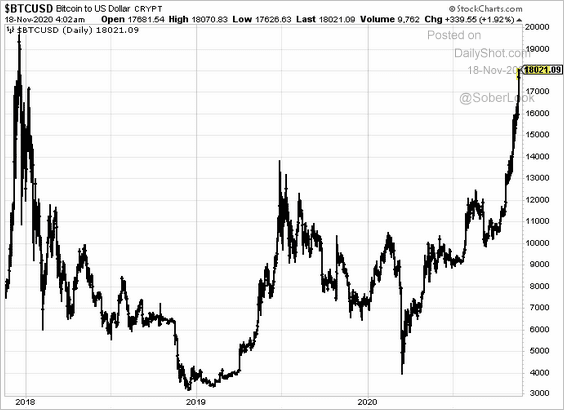
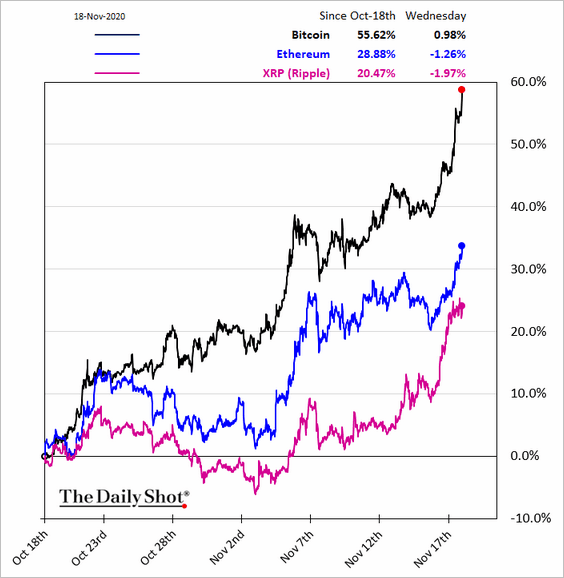
Bitcoin blasted past $18k and is now up nearly 60% over the past month.
Commodities
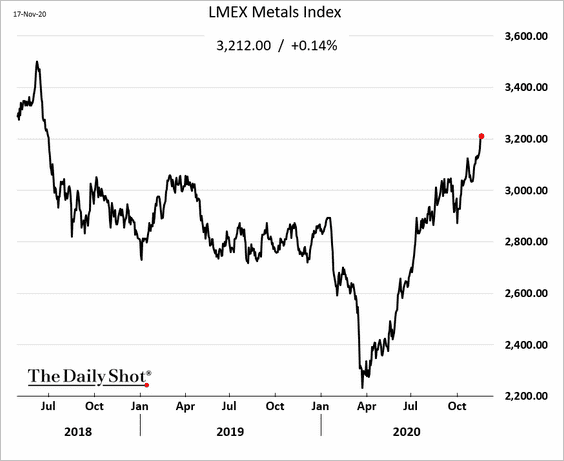
1. Industrial metals continue to climb.
2. Morgan Stanley sees investment demand becoming a drag on gold prices over the next couple of years.
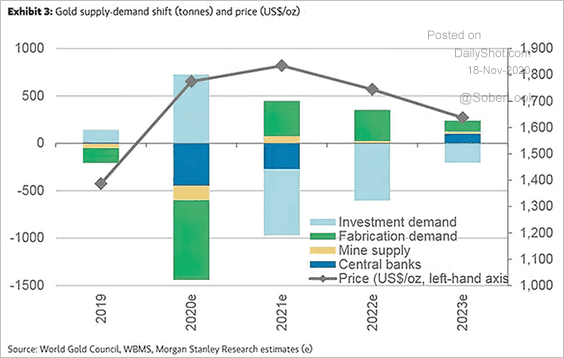 Source: @ISABELNET_SA, @MorganStanley
3. Container freight rates are up sharply this year amid capacity constraints.
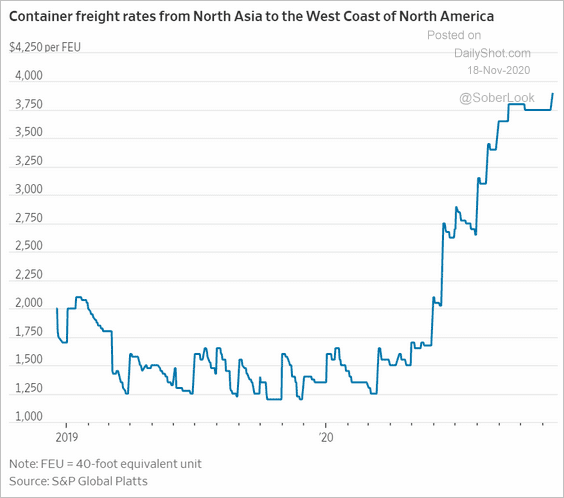 Source: @WSJ Read full article
4. Technicals suggest that Brent oil is overbought in the near-term.
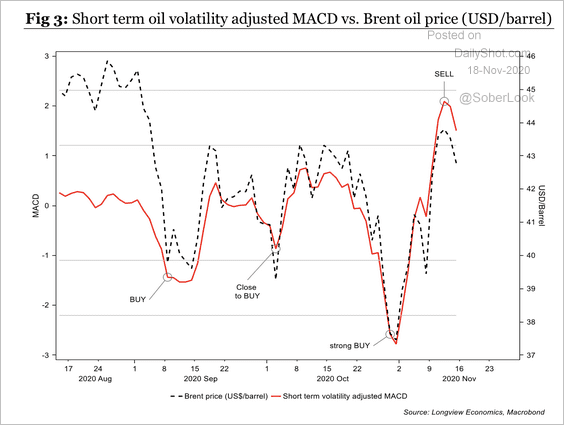 Source: Longview Economics
Equities
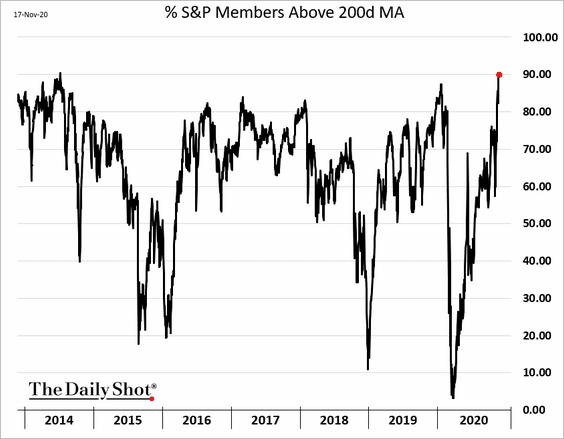
1. The percentage of S&P 500 members above the 200-day moving average is the highest since 2014.
2. The Nasdaq 100 index is holding resistance at 1,200. The next stop would be 1,220.
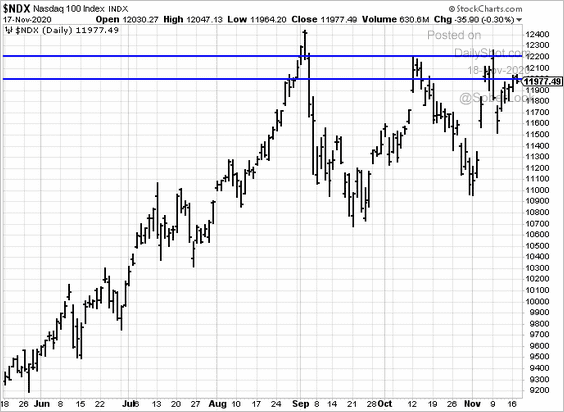 h/t Nancy Moran
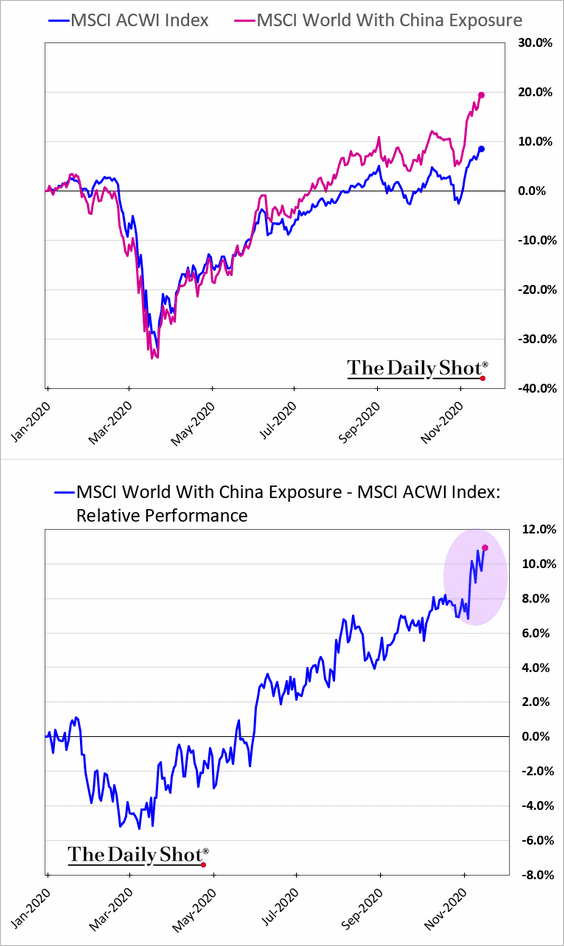
3. The outperformance of companies with China exposure accelerated this month.
4. The recent value-growth rotation has been a global phenomenon.
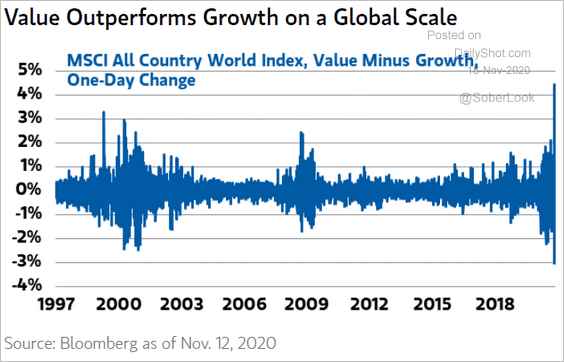 Source: @ISABELNET_SA, @MorganStanley
Here is the fund managers’ positioning, according to BofA’s FMS survey.
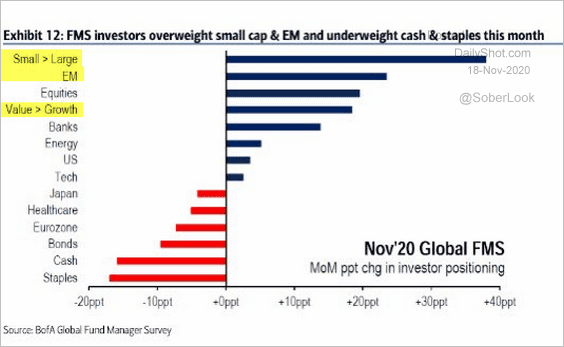 Source: @LizAnnSonders, @BankofAmerica
——————–
5. Fund managers expect small caps to outperform.
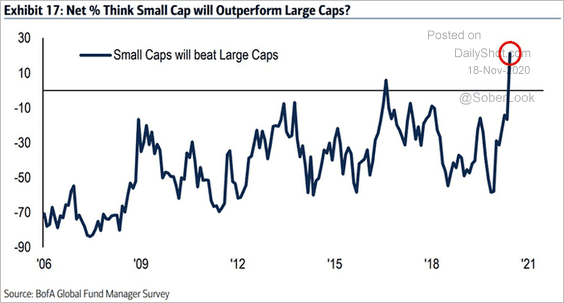 Source: @ISABELNET_SA, @BofAML
6. The S&P 500 trades at a 27% premium to the MSCI ACWI World ex-USA, based on its relative forward PE ratio.
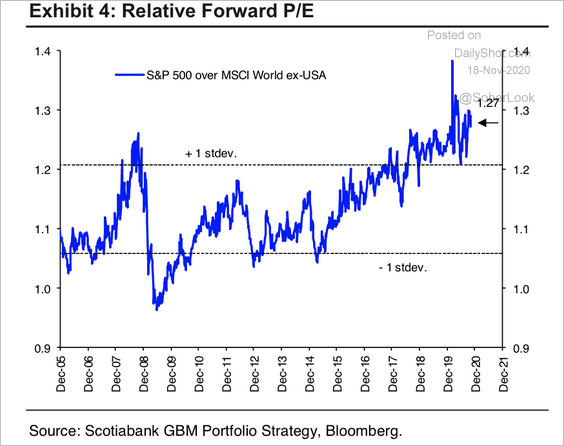 Source: Hugo Ste-Marie, Portfolio & Quantitative Strategy Global Equity Research, Scotia Capital
7. The Hussman Margin-Adjusted P/E ratio suggests that stocks are most expensive in at least a century.
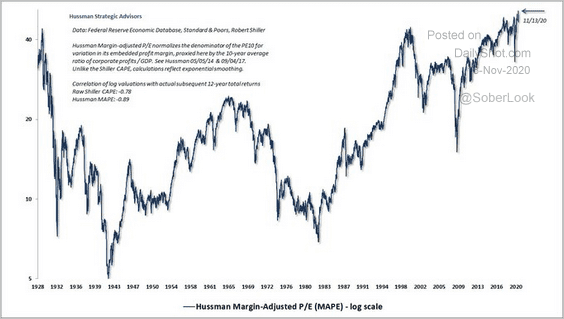 Source: @jessefelder, @hussmanjp Read full article
8. When real rates rise 20 to 30 basis points, it usually leads to a setback in risk asset momentum, according to Nordea.
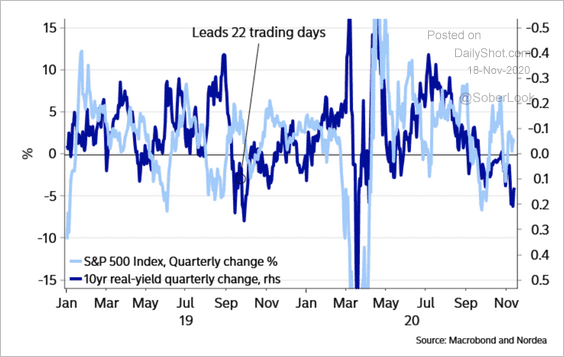 Source: Nordea Markets
9. The 60/40 portfolio duration risk has risen recently.
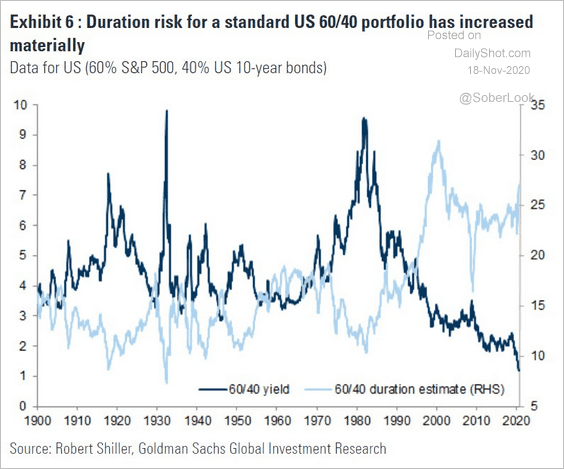 Source: Goldman Sachs, @jsblokland
Here is the relative performance of the 50/50 portfolio this year.
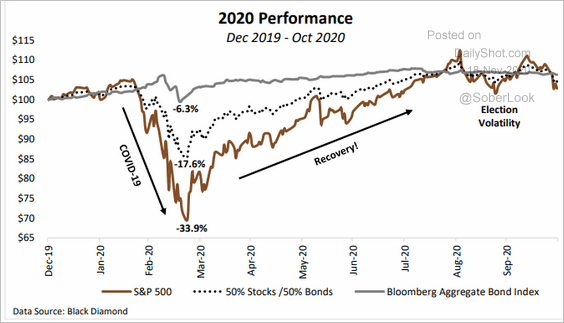 Source: Allied Investment Advisors
——————–
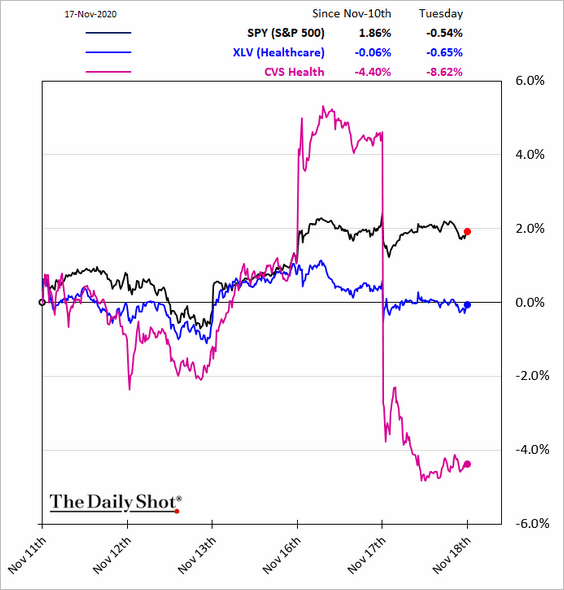
10. Shares of pharmacy chains are under pressure as Amazon gets into the business.
 Source: @axios Read full article
Credit
1. The number of bankruptcies among larger companies hasn’t been extreme in this recession because lenders have been willing to amend/restructure debt. Retailers experienced the most defaults this year.
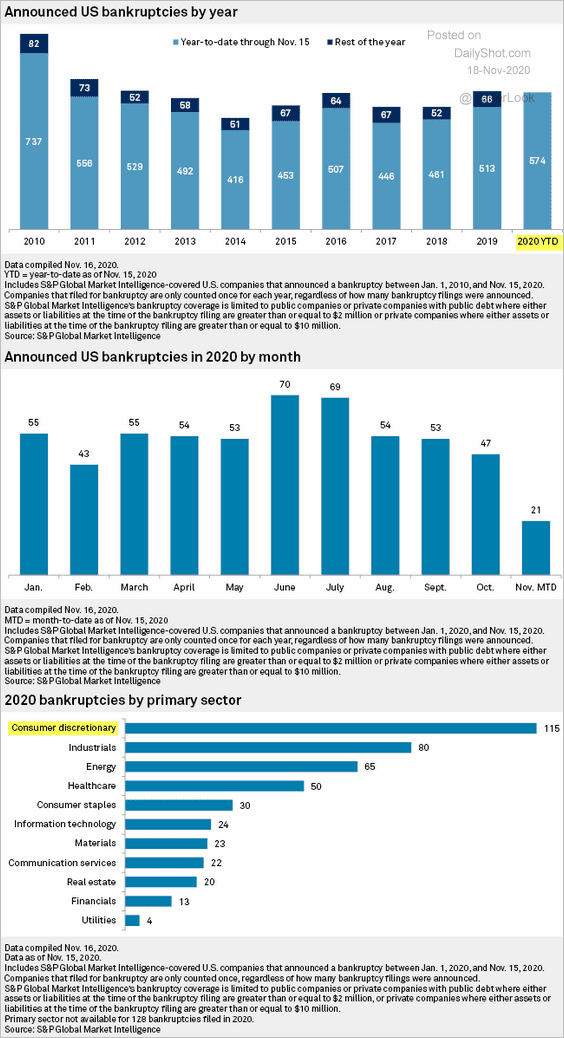 Source: S&P Global Market Intelligence
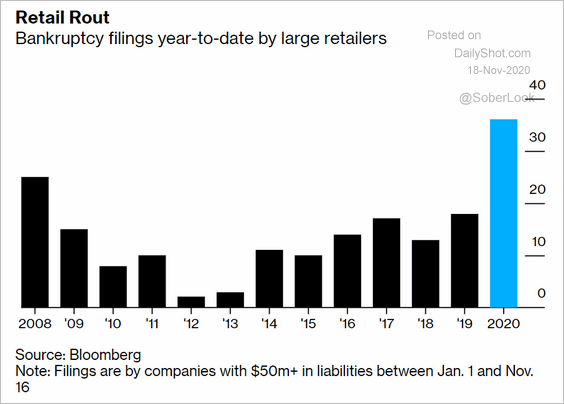 Source: @markets Read full article
——————–
2. “Zombie” firms are sitting on a great deal of debt.
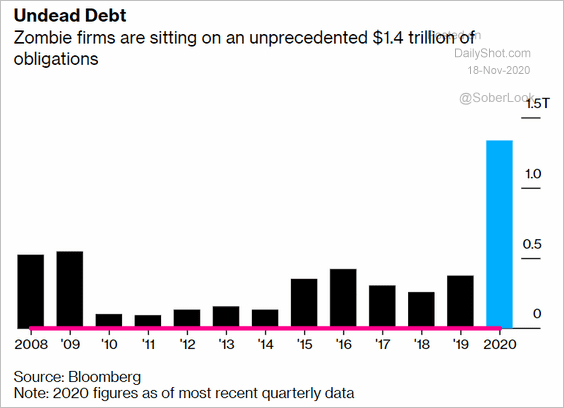 Source: @markets Read full article
Rates
1. Here is a look at the 10-year Treasury yield during various Fed regimes.
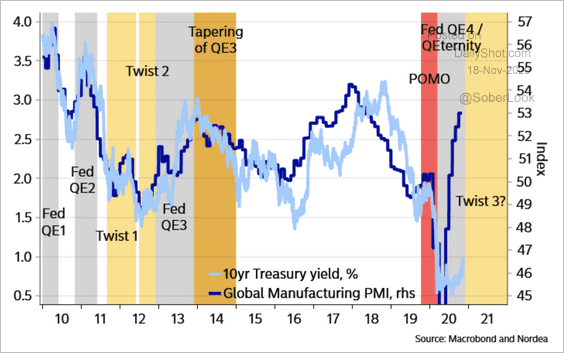 Source: Nordea Markets
2. The market expects short-term rates to remain extremely low five years out. Will the Fed remain this dovish for that long?
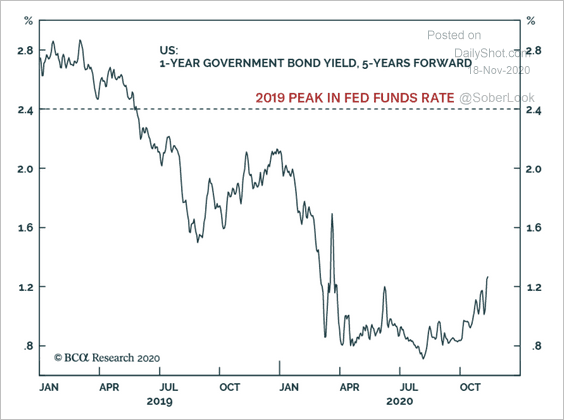 Source: BCA Research
3. The 10-year Treasury term premium is rising.
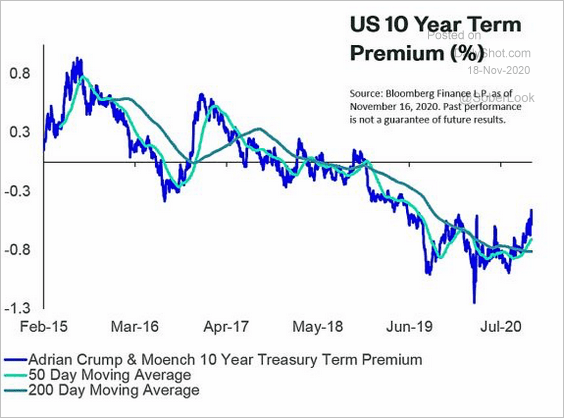 Source: SPDR Americas Research, @mattbartolini Read full article
Global Developments
1. Equities and industrial metals are the least affected by rising yields, according to TS Lombard.
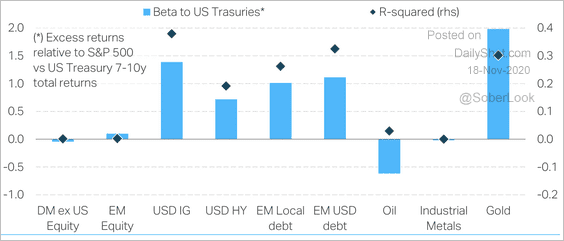 Source: TS Lombard
2. Can you tell which countries had the most aggressive fiscal stimulus programs?
 Source: OECD Read full article
3. Here is the IMF’s forecast for European and US debt-to-GDP ratios.
 Source: @WSJ Read full article
4. And this chart shows the IMF’s forecast for the 2020 GDP growth.
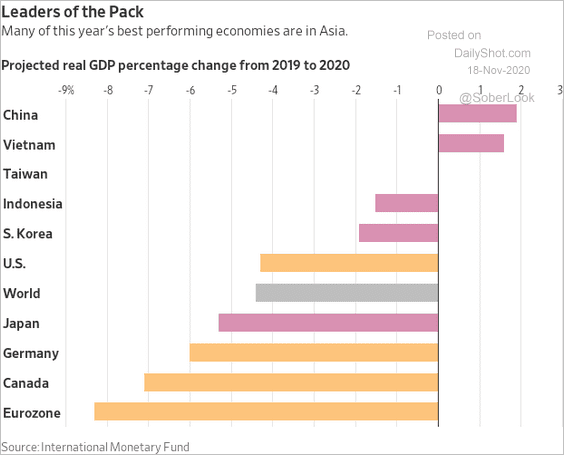 Source: @WSJ Read full article
——————–
Food for Thought
1. Support for raising the minimum wage:
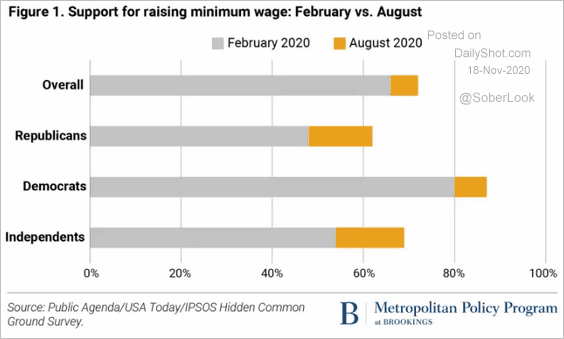 Source: The Brookings Institution
2. Election credibility partisan gaps since 1992:
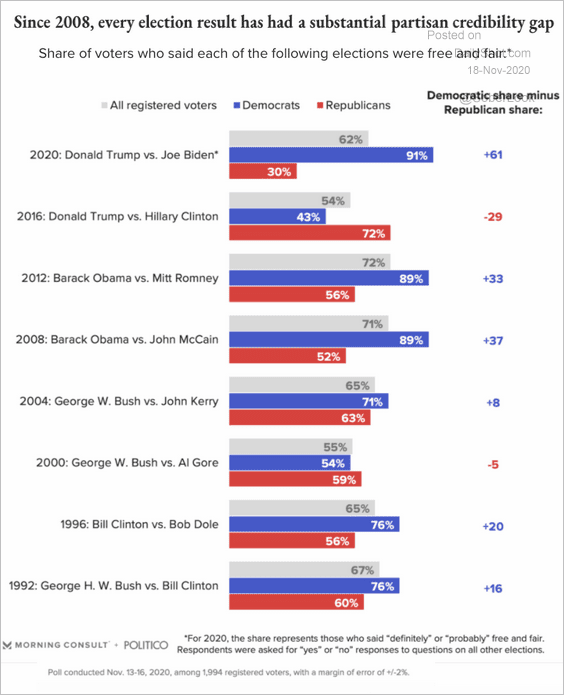 Source: Morning Consult Read full article
3. Do you believe that Donald Trump should concede?
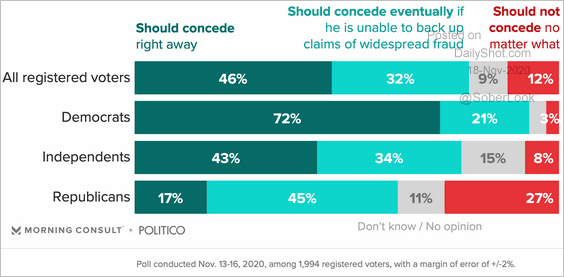 Source: Morning Consult Read full article
4. US election size relative to other countries?
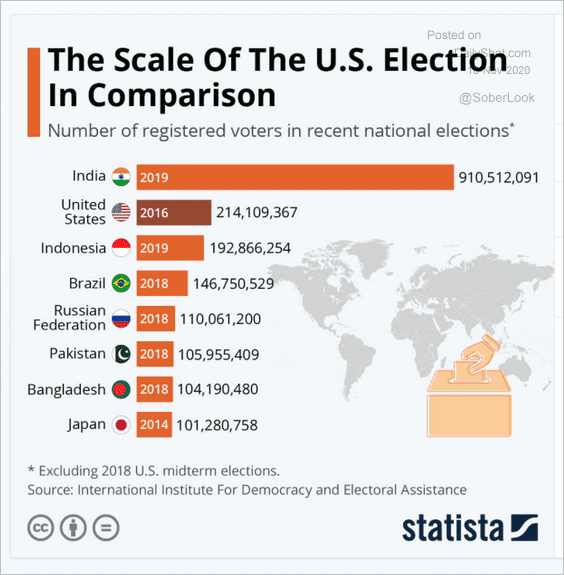 Source: Statista
5. Catholics’ support for gay marriage:
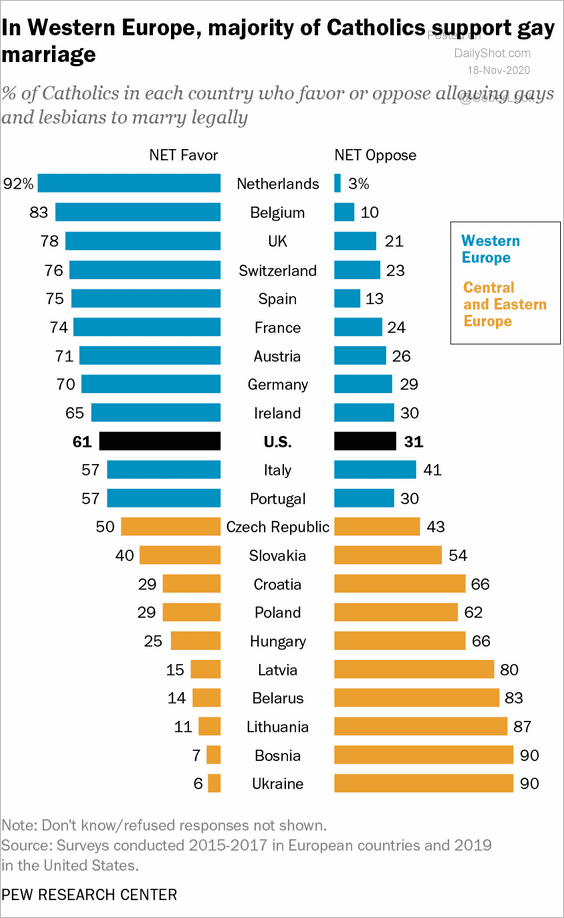 Source: Pew Research Center Read full article
6. The US share of chip manufacturing segments:
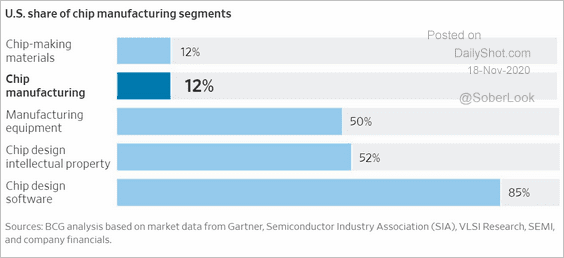 Source: @WSJ Read full article
Chip manufacturing capacity:
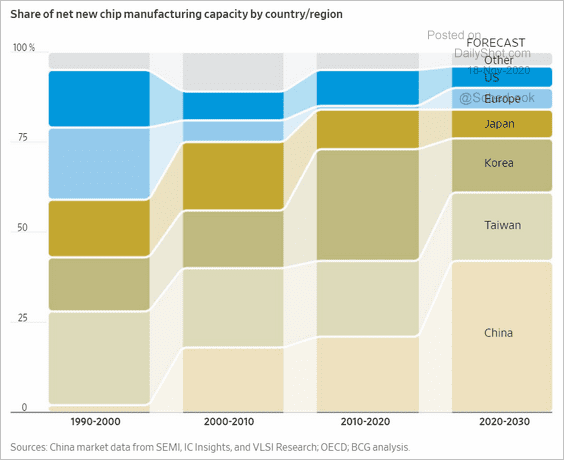 Source: @WSJ Read full article
——————–
7. US social media interactions related to the coronavirus:
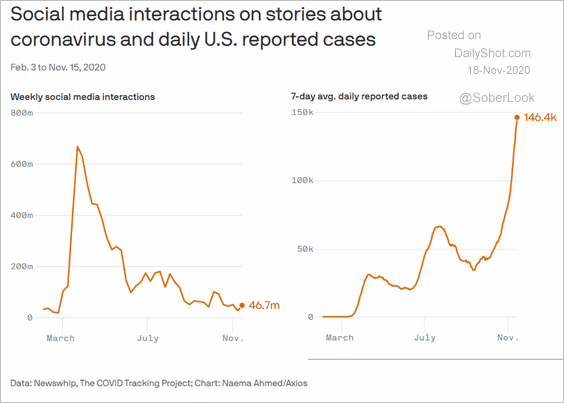 Source: @axios Read full article
8. Mandatory mask-wearing:
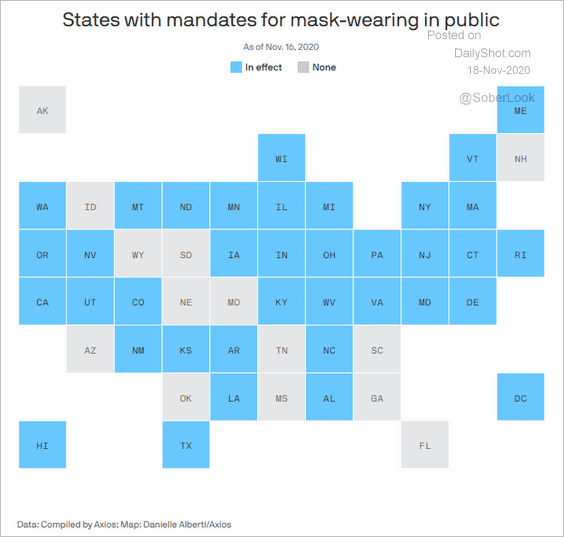 Source: @axios Read full article
9. Roundabouts by country:
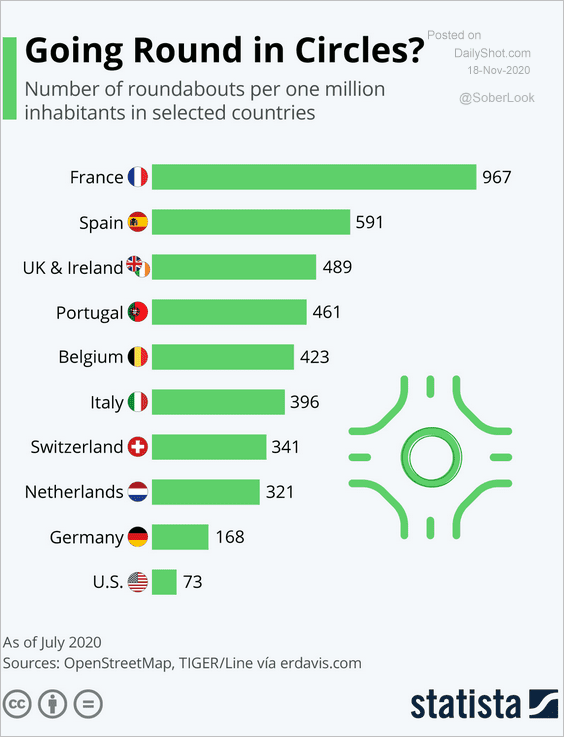 Source: Statista
——————–