
The Daily Shot: 19-Nov-20
• The United States
• Canada
• The United Kingdom
• Europe
• Asia – Pacific
• China
• Emerging Markets
• Commodities
• Energy
• Equities
• Food for Thought
The United States
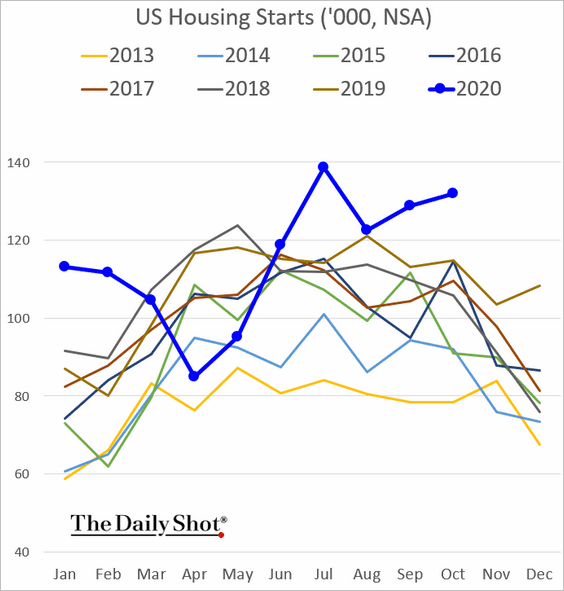
1. Let’s begin with the housing market.
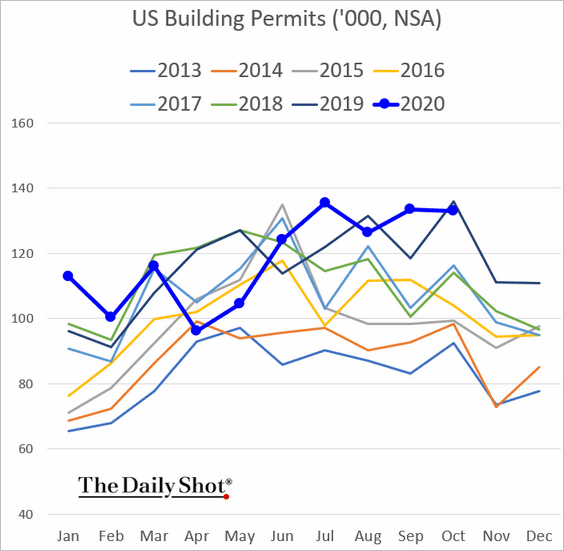
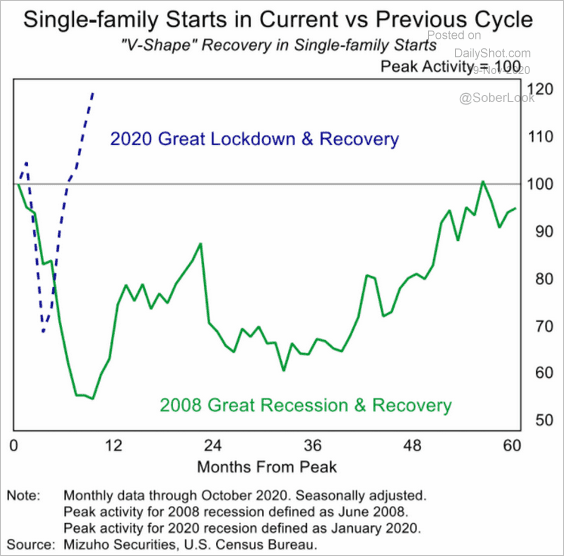
• Residential construction remains robust, with single-family housing dominating growth.
– Housing starts and building permits:
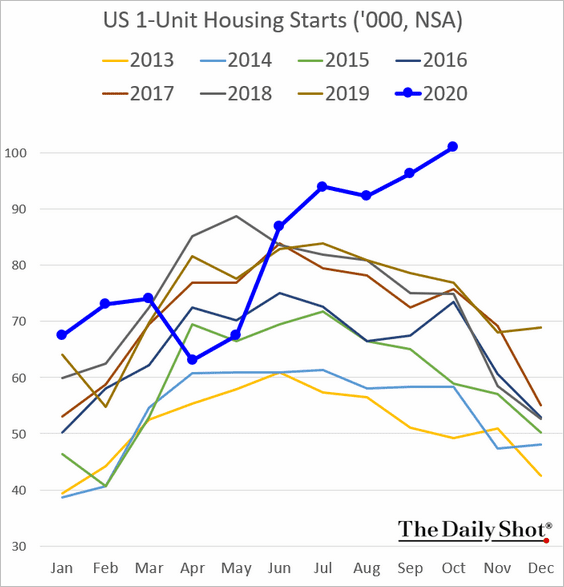
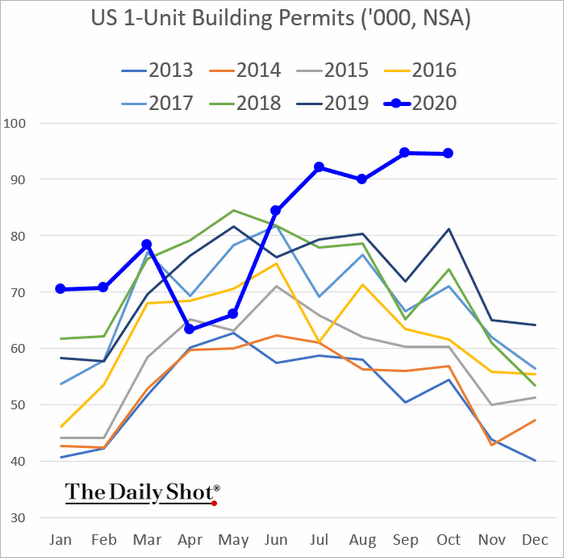
– Single-family starts and permits:
– Single-family starts vs. the 2008 recession:
 Source: Mizuho Securities USA
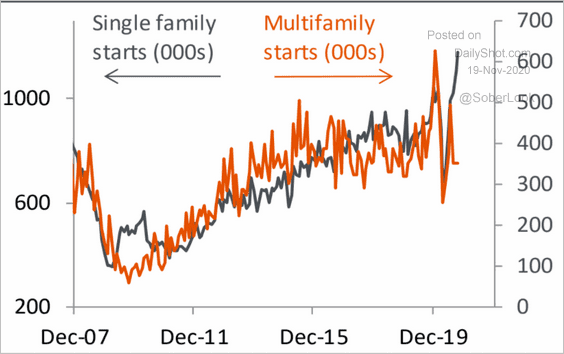
– Multifamily housing construction has slowed as Americans seek more space and less crowded areas. Growth in urban rents has weakened substantially this year.
 Source: Piper Sandler
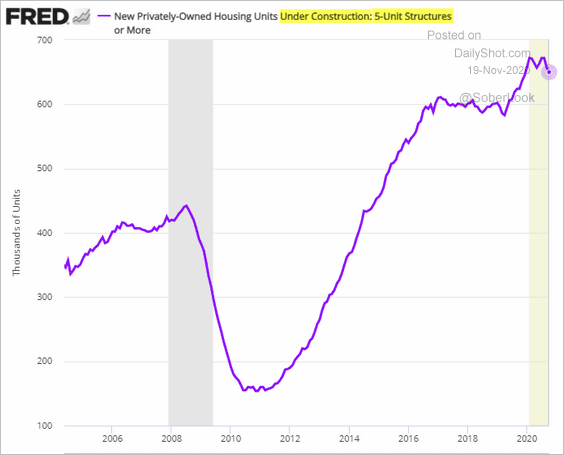
Moreover, there is a significant overhang of multifamily housing under construction.
——————–
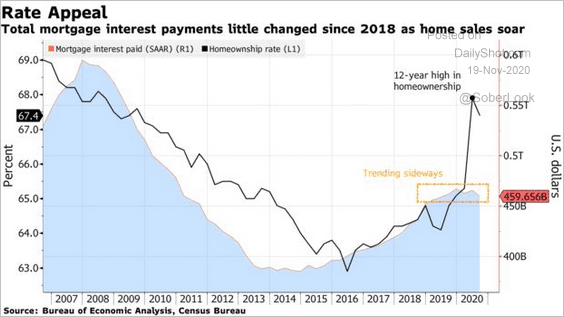
• Low mortgage rates have capped US households’ total interest payments, even as homeownership rises.
 Source: @business Read full article
• The CAPE model shows that hosing valuations are approaching the pre-2008 peak.
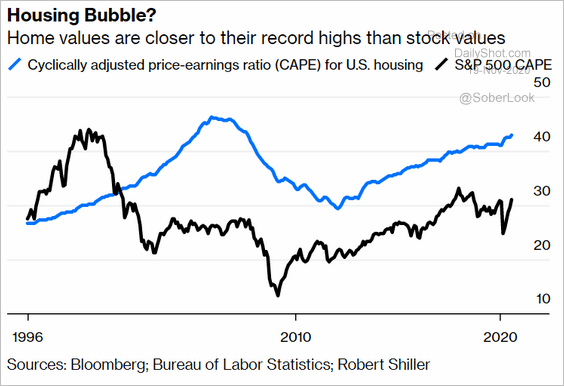 Source: @bopinion Read full article
——————–
2. Next, we have some updates on household credit.
• Buyers with top credit scores have been driving the surge in mortgage financing (2 charts).
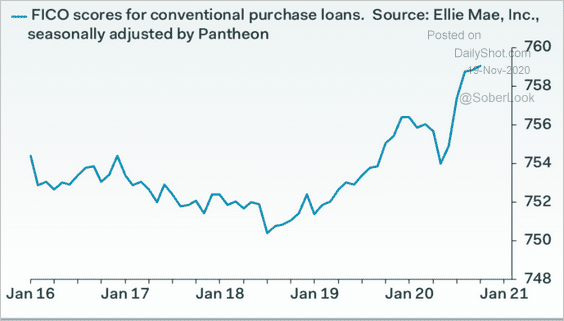 Source: Pantheon Macroeconomics
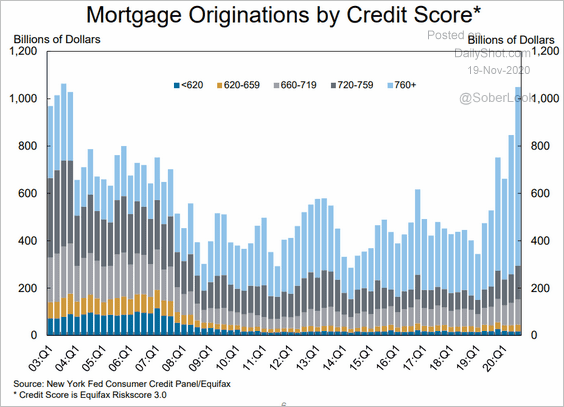 Source: Federal Reserve Bank of New York
• This chart shows mortgage originations by age:
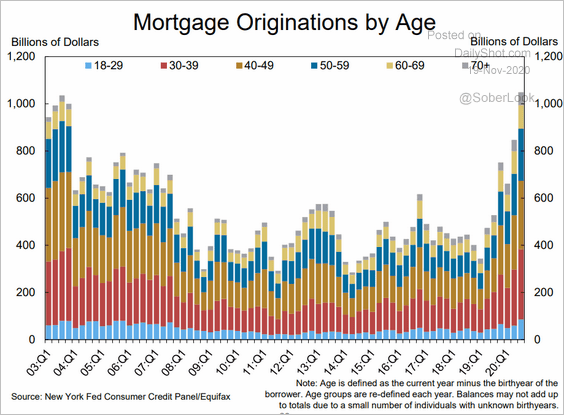 Source: Federal Reserve Bank of New York
• How has consumer credit changed over the past four quarters?
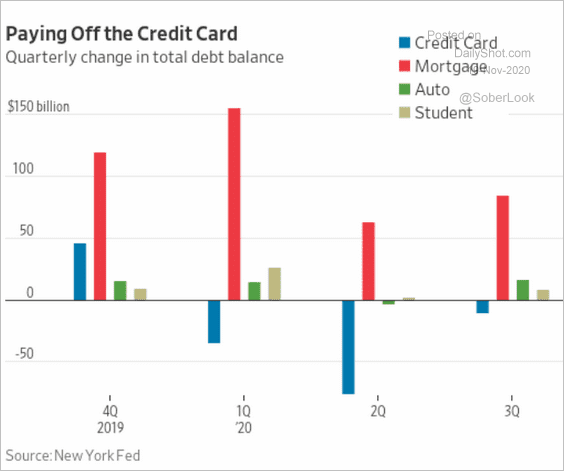 Source: @WSJ Read full article
• Here are some updates on delinquencies. Student loan delinquencies are sharply lower because of the emergency deferral program – “both suspending loan payments and temporarily setting interest rates to zero.” Mortgage delinquencies are lower as well due to the forbearance program.
– Household credit delinquencies:
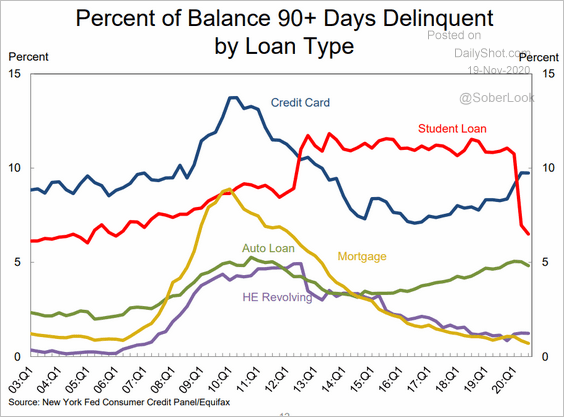 Source: Federal Reserve Bank of New York
– Mortgage delinquencies:
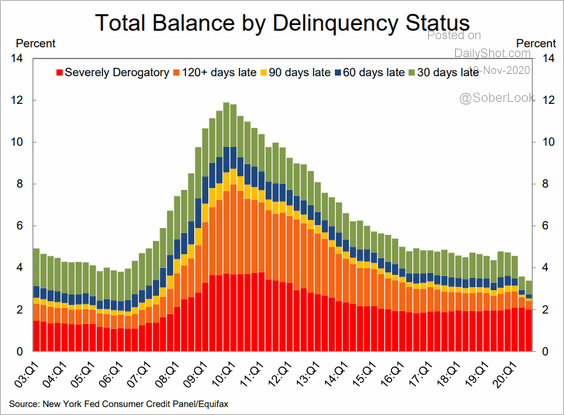 Source: Federal Reserve Bank of New York
– Student loan delinquencies by age:
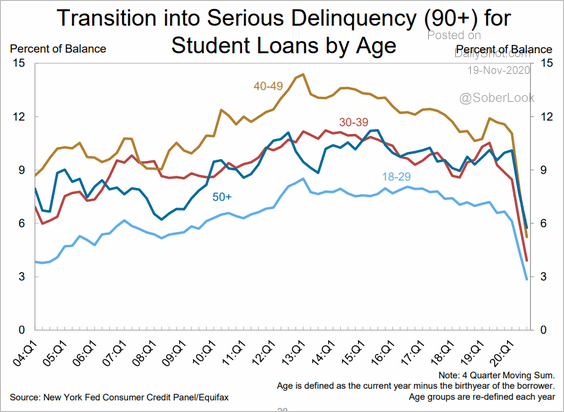 Source: Federal Reserve Bank of New York
——————–
3. Many households are concerned about not being able to pay the next month’s rent.
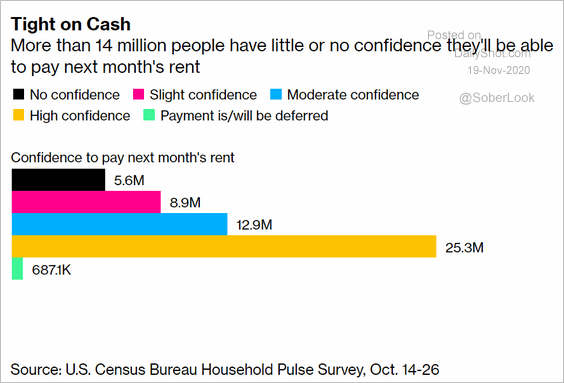 Source: @bpolitics Read full article
4. Regular (state) unemployment benefits are running out for many Americans who have been out of work for a while. They are relying on the emergency programs, which are scheduled to stop at the end of the year (the “income cliff”).
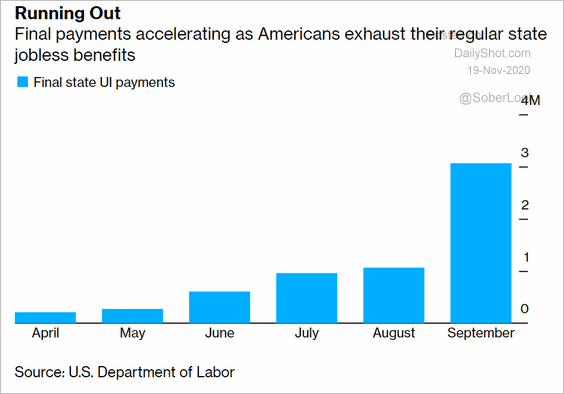 Source: @bpolitics Read full article
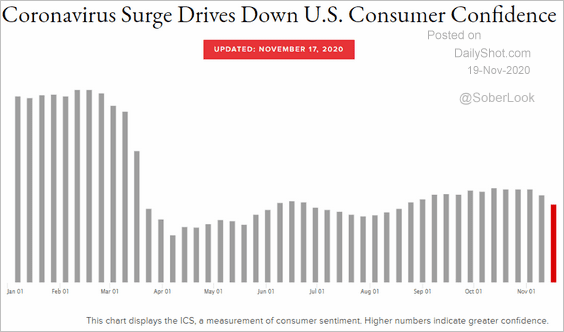
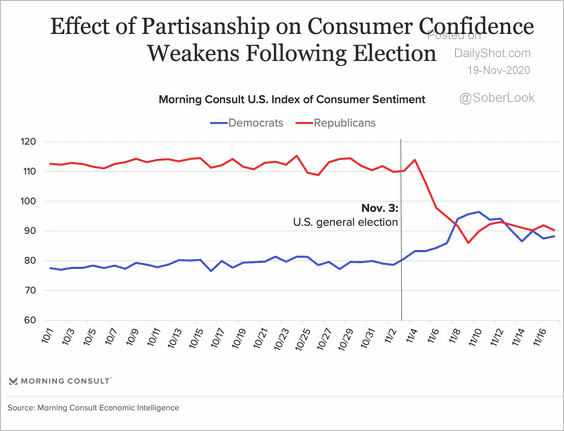
5. Consumer confidence shows further signs of strain.
 Source: Morning Consult
 Source: Morning Consult Read full article
——————–
6. Lockdowns are picking up again.
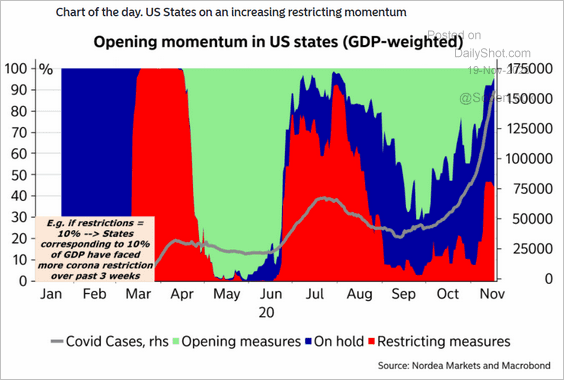 Source: Nordea Markets
New COVID cases should peak by the end of the month, but deaths are expected to keep rising for a while.
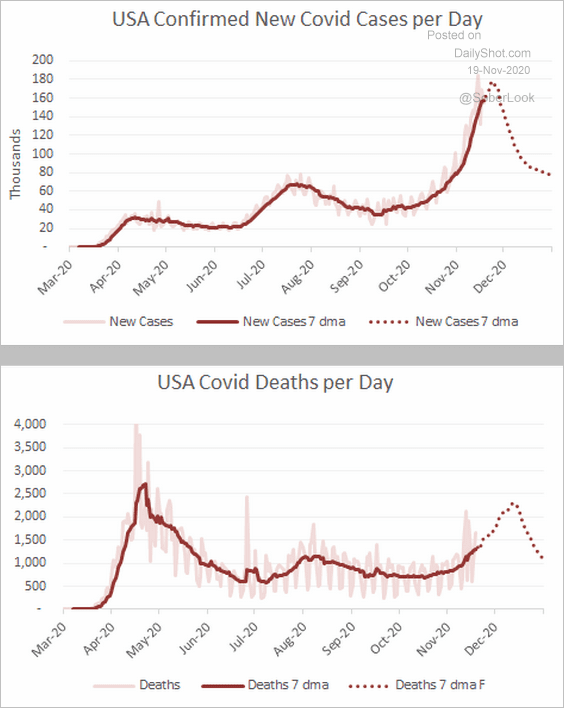 Source: Princeton Energy Advisors
——————–
7. Airfare prices are gradually recovering.
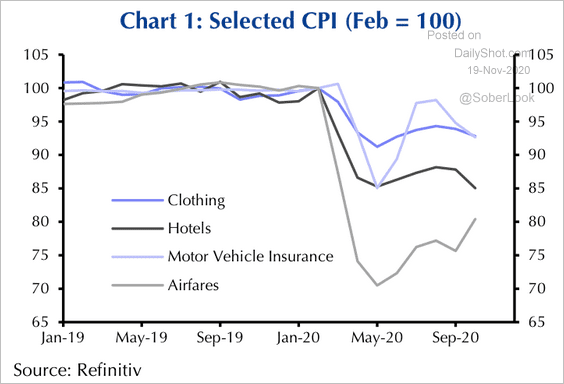 Source: Capital Economics
8. Will high levels of liquidity continue to support economic growth?
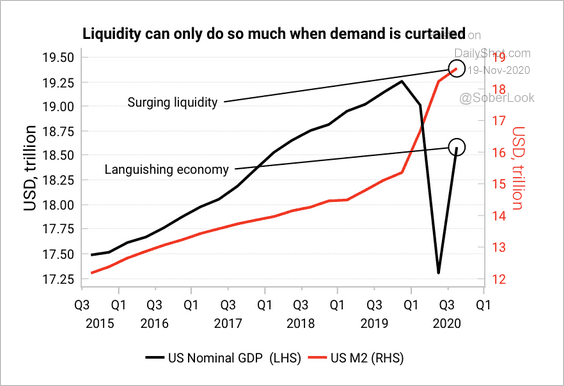 Source: Variant Perception
Canada
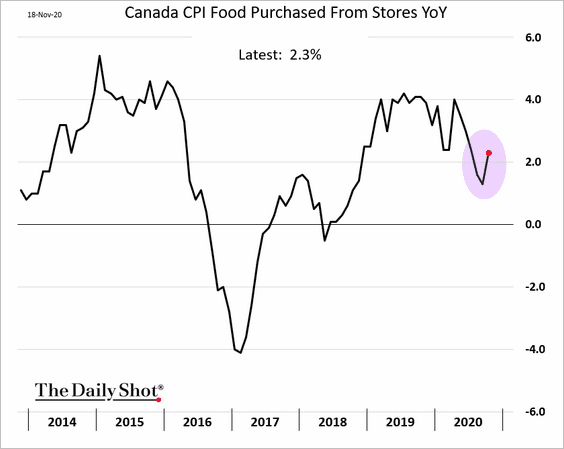
1. The CPI moved higher (exceeding forecasts), boosted by the more volatile components.
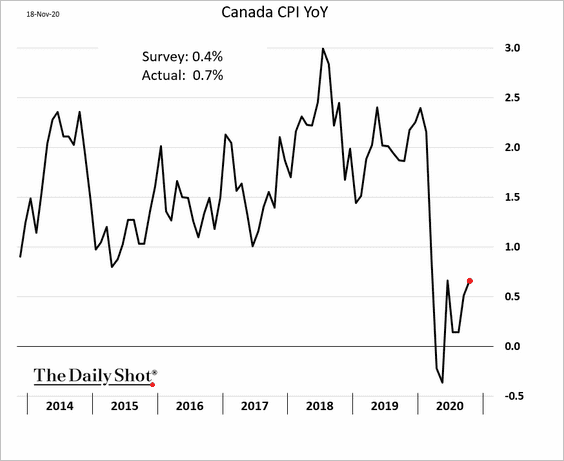
Food prices jumped.
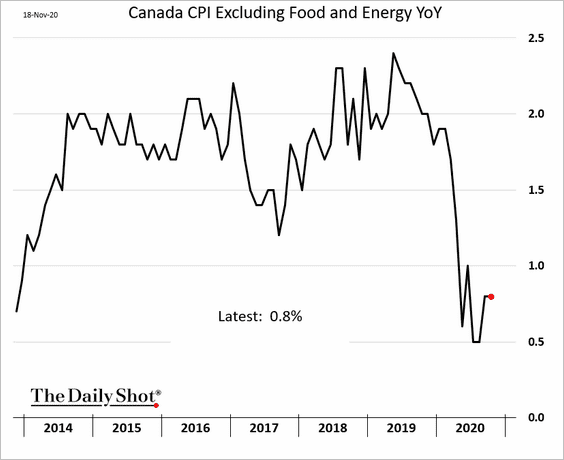
Excluding food and energy, the CPI remains soft.
——————–
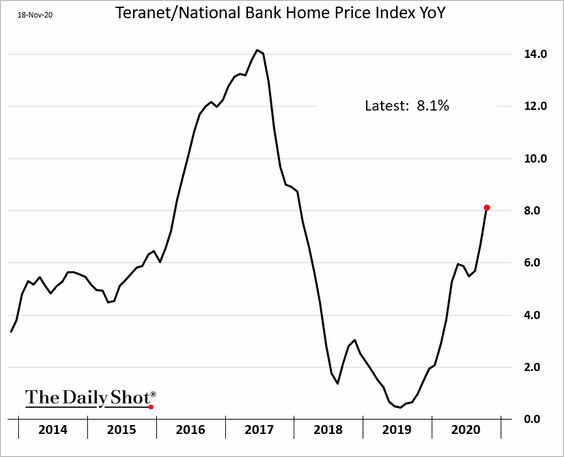
2. Home prices are now up 8% vs. last year.
3. The Oxford Economics Recovery Tracker continues to deteriorate.
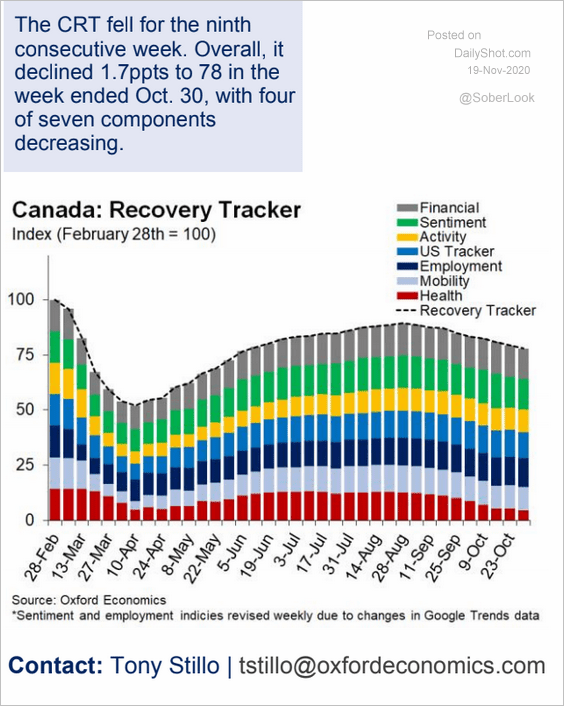 Source: Oxford Economics
The United Kingdom
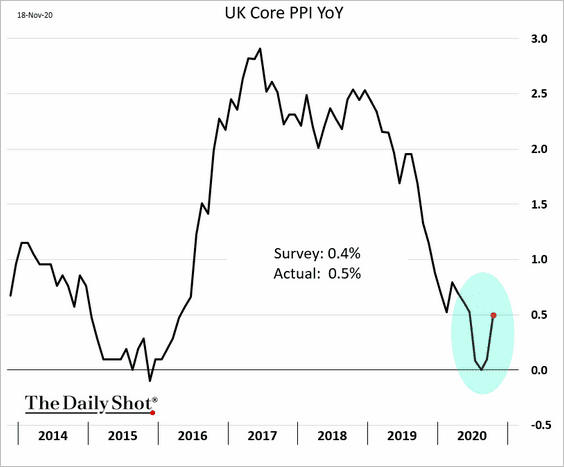
1. Producer prices rebounded from the lows.
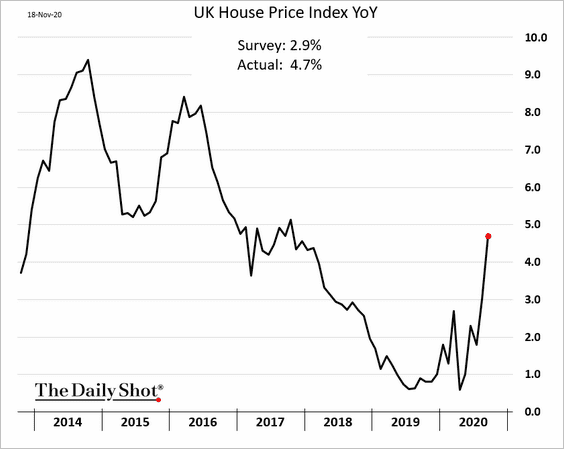
2. Home price gains surprised to the upside.
By the way, rising house prices could signal higher bond yields.
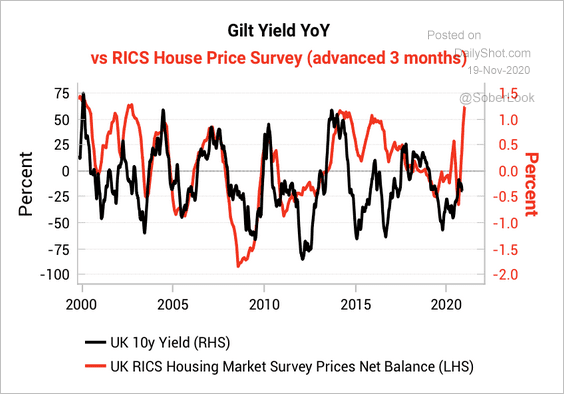 Source: Variant Perception
——————–
3. Declines in household spending were more severe in the UK than in other advanced economies.
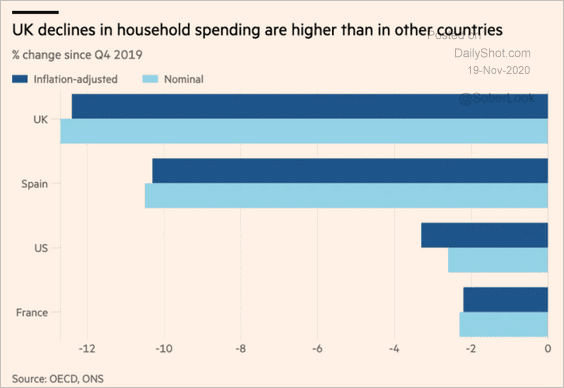 Source: @financialtimes Read full article
4. UK profit margins should rebound, assuming there is a trade deal with the EU.
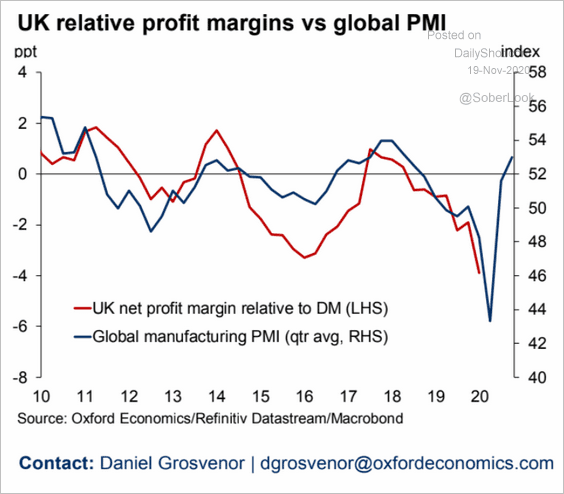 Source: Oxford Economics
5. Regret?
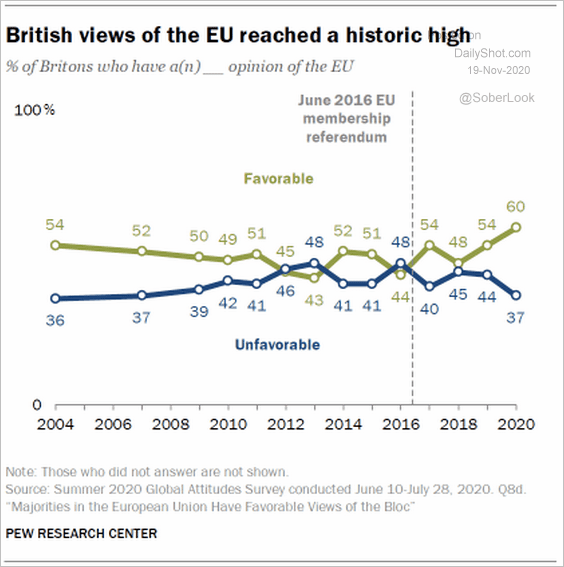 Source: @pewresearch Read full article
Europe
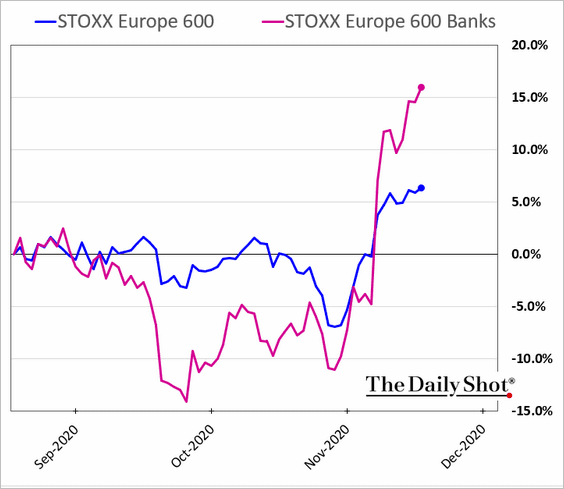
1. European bank stocks have been outperforming.
2. Which countries saw the highest increases in fatality rates over the past two weeks?
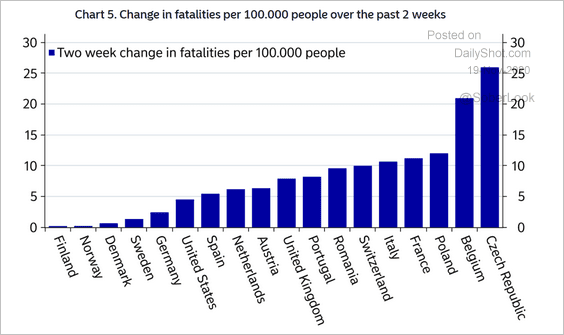 Source: Nordea Markets
3. Sweden’s home price gains are accelerating again.
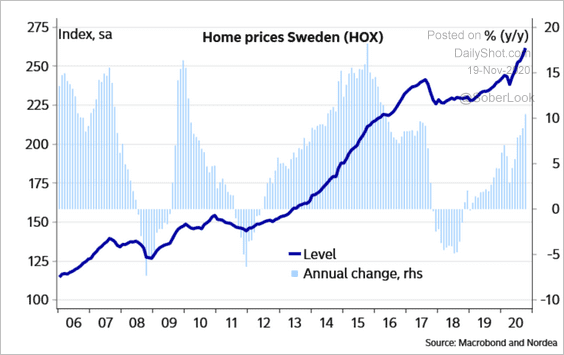 Source: Nordea Markets
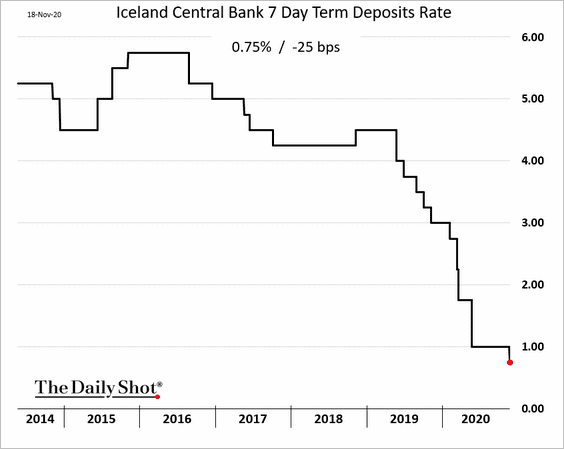
4. Iceland’s central bank cut rates.
Asia – Pacific
1. Japan is facing a third wave, …
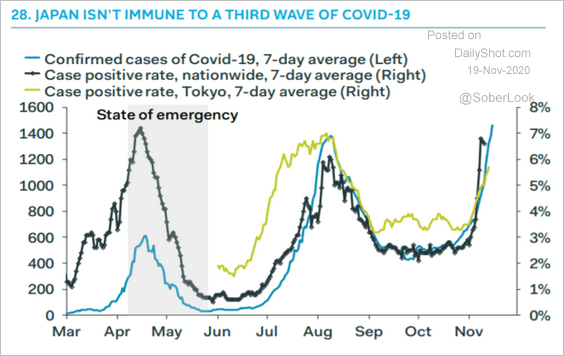 Source: Pantheon Macroeconomics
… and so is South Korea.
 Source: Statista
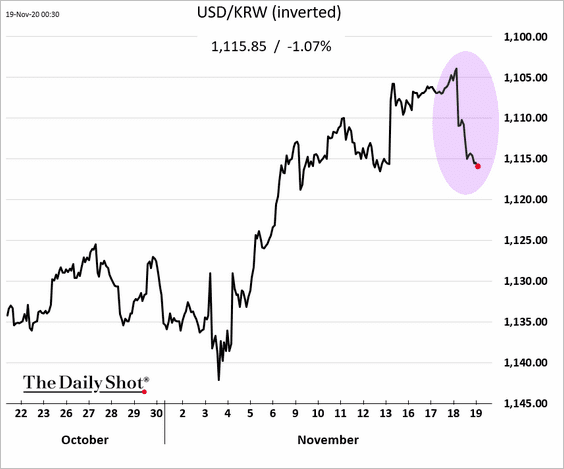
2. The South Korean won fell from a multi-year high after Finance Minister Hong Nam-ki expressed concern about the currency’s strength.
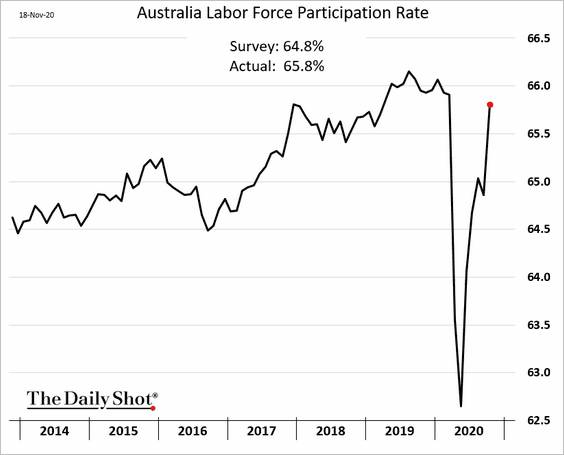
3. Australia’s employment report topped economists’ forecasts, boosted by a rebound in Victoria (2nd chart).
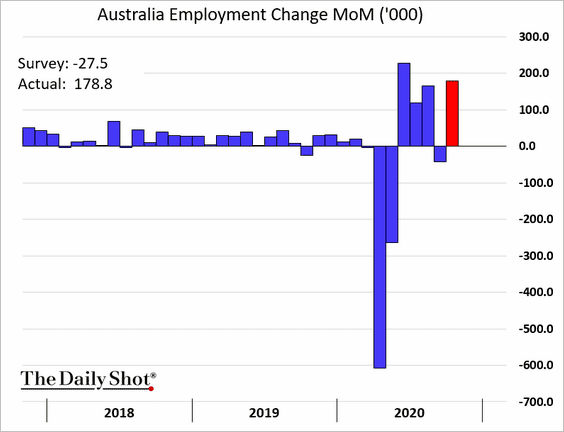
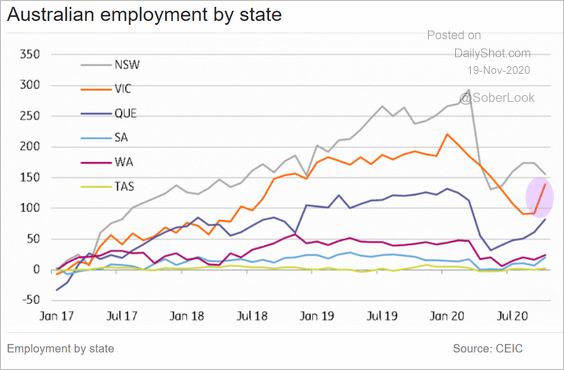 Source: ING
The unemployment rate rose less than expected.
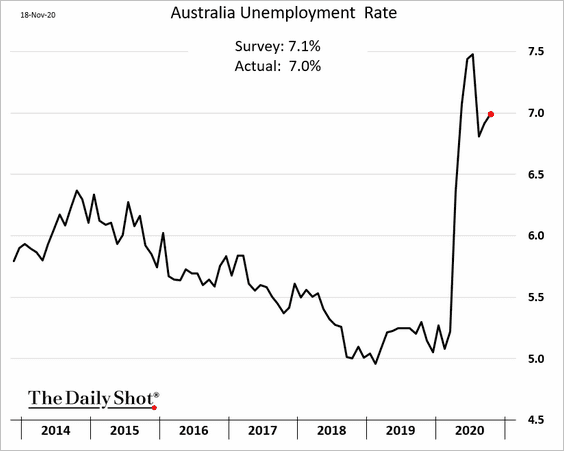
And the labor force participation rate has almost fully recovered.
China
1. China has sold the nation’s first negative-yielding sovereign bond (denominated in euros).
 Source: SCMP Read full article
2. Chinese IPOs in the US exceeded $11 billion this year.
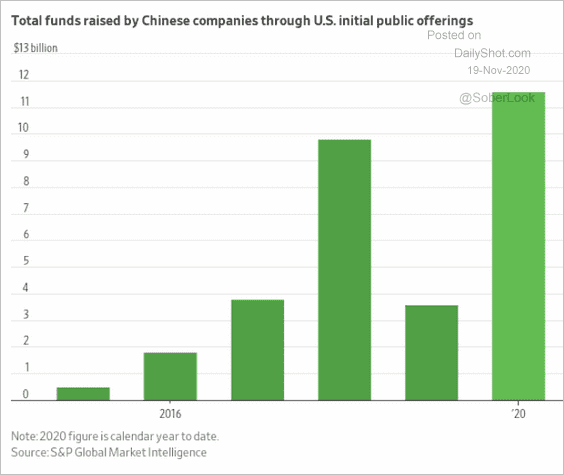 Source: @WSJ Read full article
3. China’s share of global import volumes is rising, …
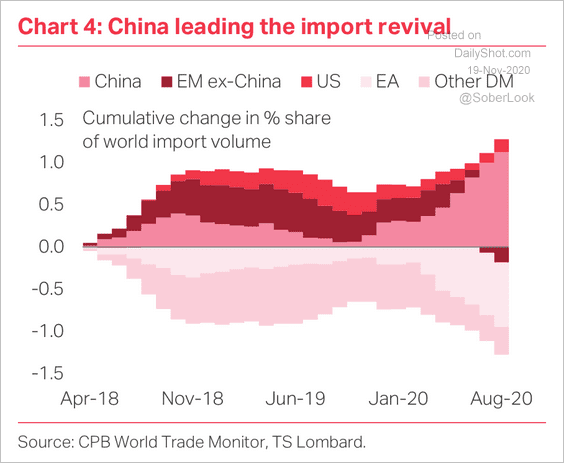 Source: TS Lombard
… and so is the nation’s dependence on foreign tech products.
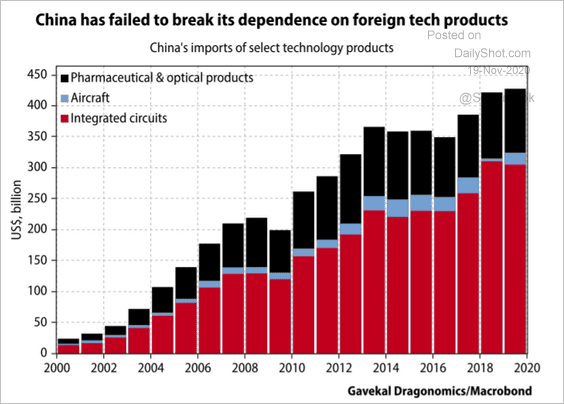 Source: Gavekal
4. The economy is less dependent on exports.
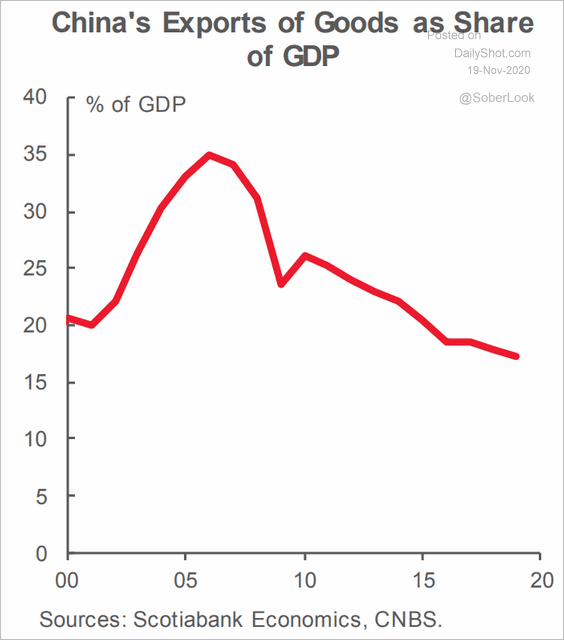 Source: Scotiabank Economics
5. The pandemic-driven integrated circuits production spike will correct soon.
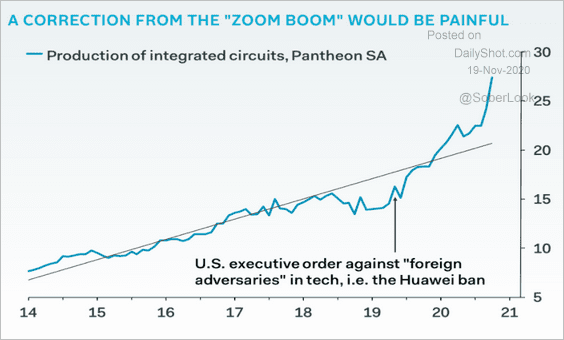 Source: Pantheon Macroeconomics
Emerging Markets
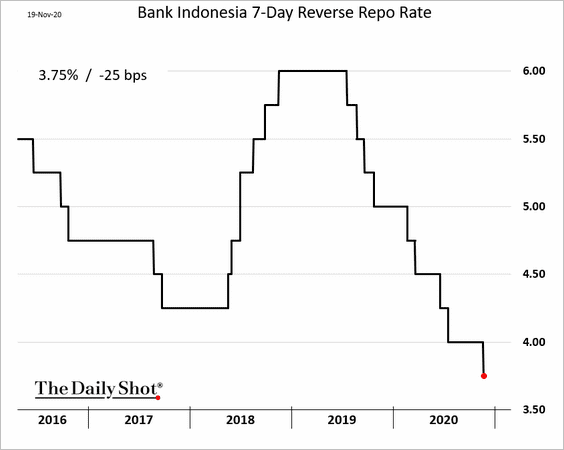
1. Indonesia’s central bank cut rates.
2. India’s retail sales are lagging production.
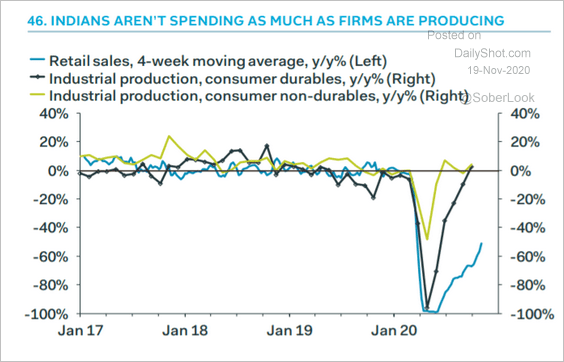 Source: Pantheon Macroeconomics
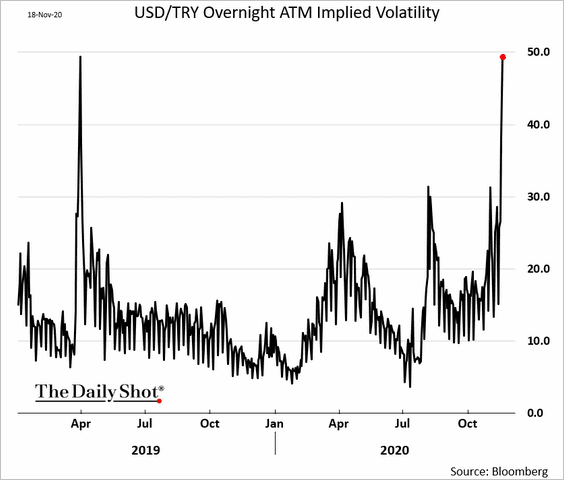
3. The Turkish lira implied volatility spiked ahead of the central bank rate decision.
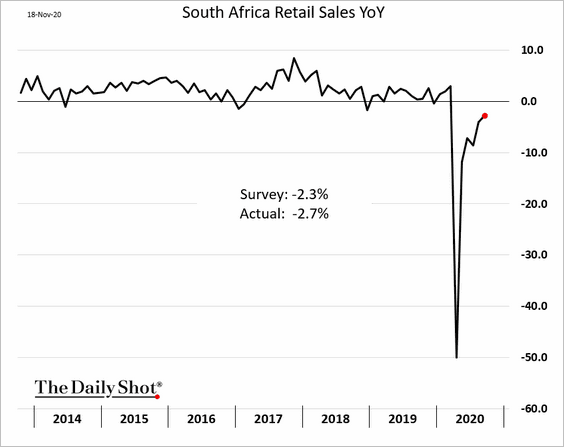
4. South Africa’s retail sales recovery is slowing.
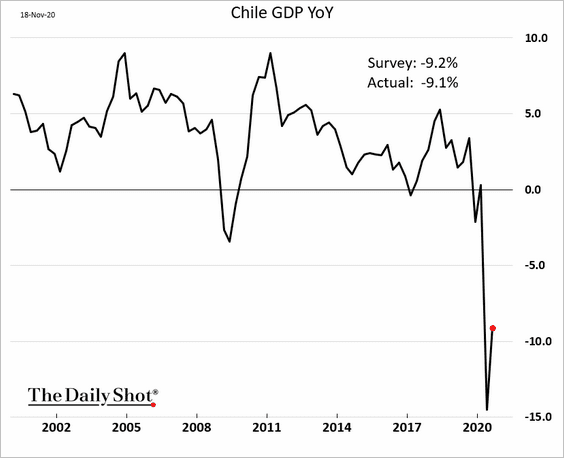
5. Chile’s GDP recovery will take a while.
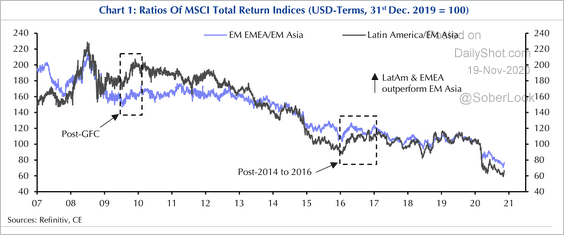
6. Latin America and EMEA equities have underperformed EM Asia over the past decade. Have we reached the bottom?
 -service
7. EM governments are facing much higher debt-service costs than what we see in advanced economies.
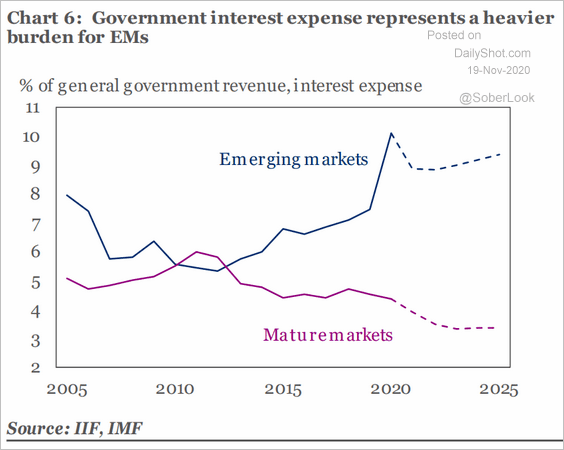 Source: IIF
8. EM equity gains have been uneven this year.
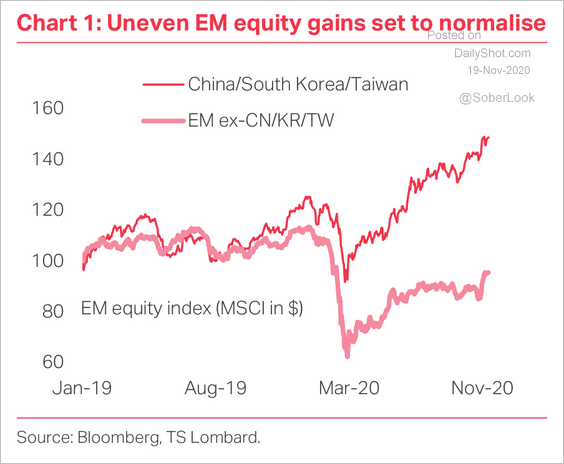 Source: TS Lombard
Here’s a look at EM sector returns year-to-date.
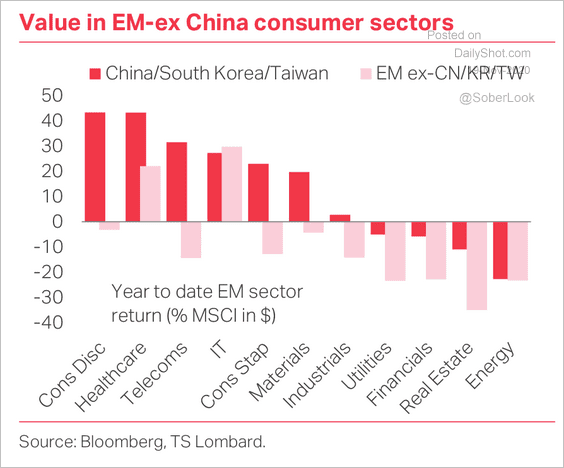 Source: TS Lombard
Commodities
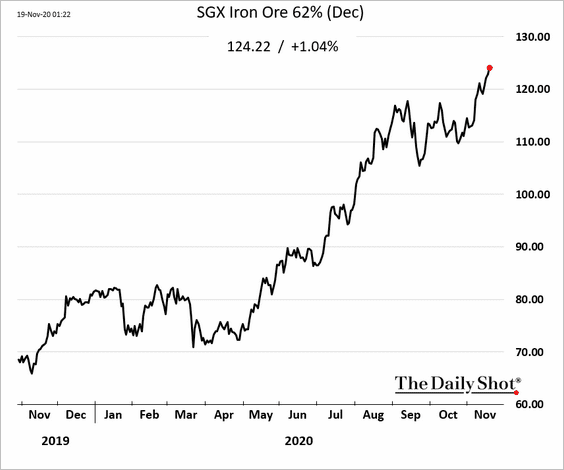
1. Iron ore prices continue to rally.
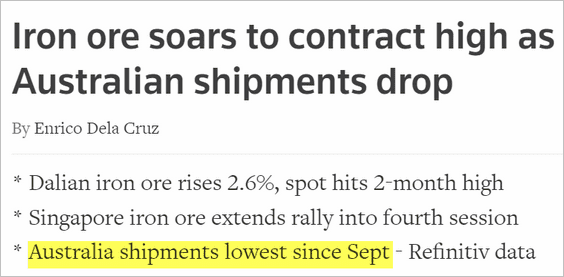 Source: Reuters Read full article
——————–
2. Lead prices have diverged from other industrial commodities over the past few months.
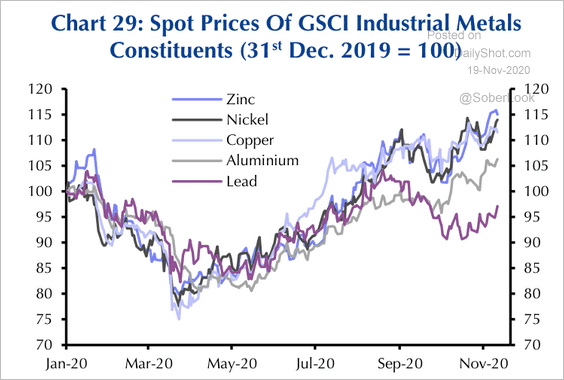 Source: Capital Economics
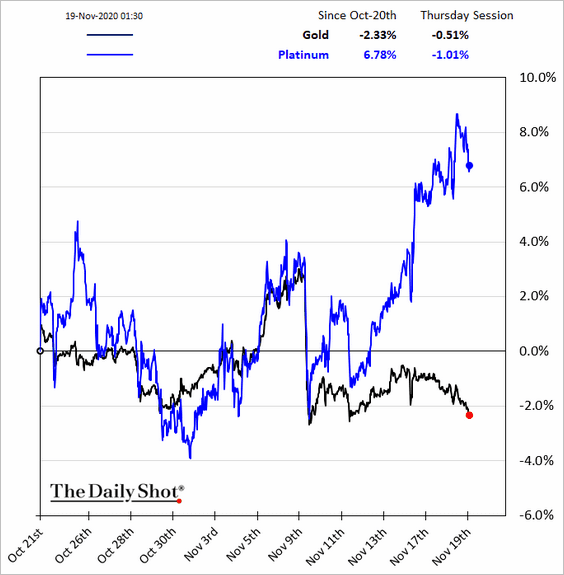
3. Platinum has been outperforming gold due to the latest vaccine news (boosted by expected industrial demand).
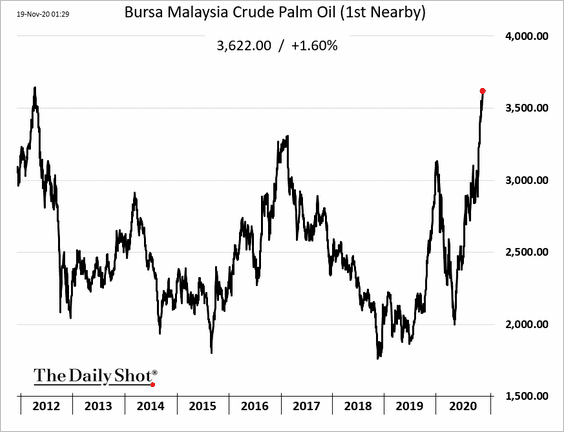
4. Rising soybean prices are pushing soy oil futures higher.
 Source: @markets Read full article
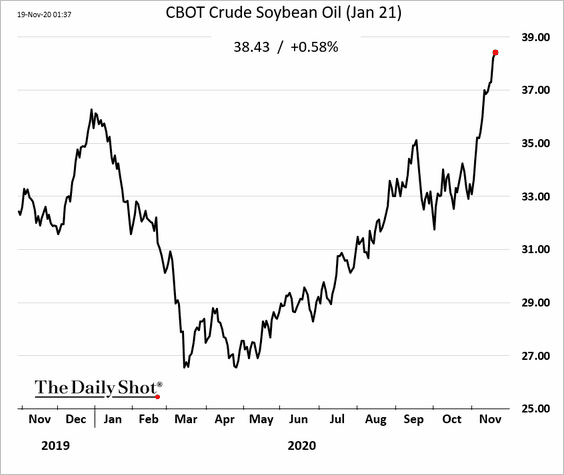
Soy oil, in turn, is putting upward pressure on palm oil prices (now at multi-year highs). Palm oil also got a boost from production concerns in Malaysia (labor shortages).
Energy
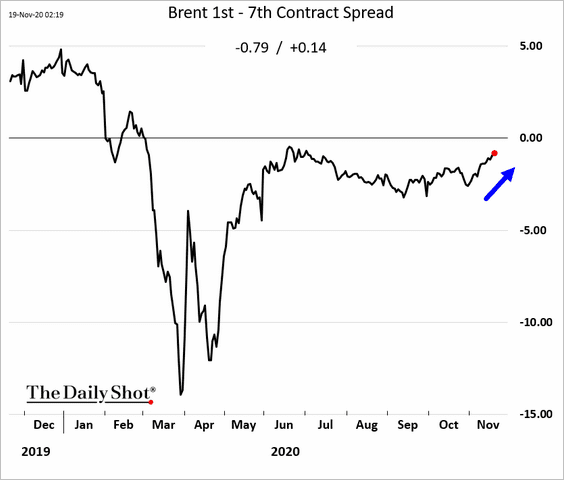
1. The Brent curve is flattening (more bullish) in response to the vaccine news.
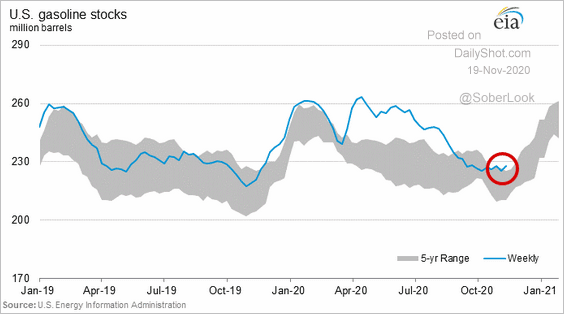
2. US gasoline inventories are back above the 5-year average.
And gasoline demand remains relatively soft.
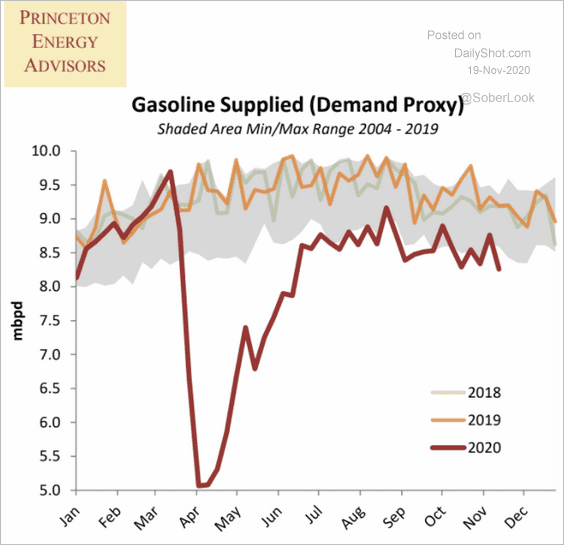 Source: Princeton Energy Advisors
——————–
3. Iran’s crude oil stockpiles are rising.
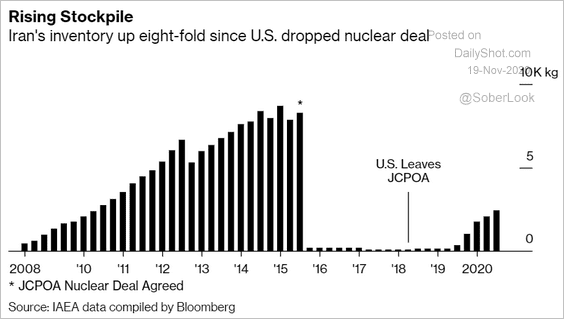 Source: @bpolitics Read full article
Equities
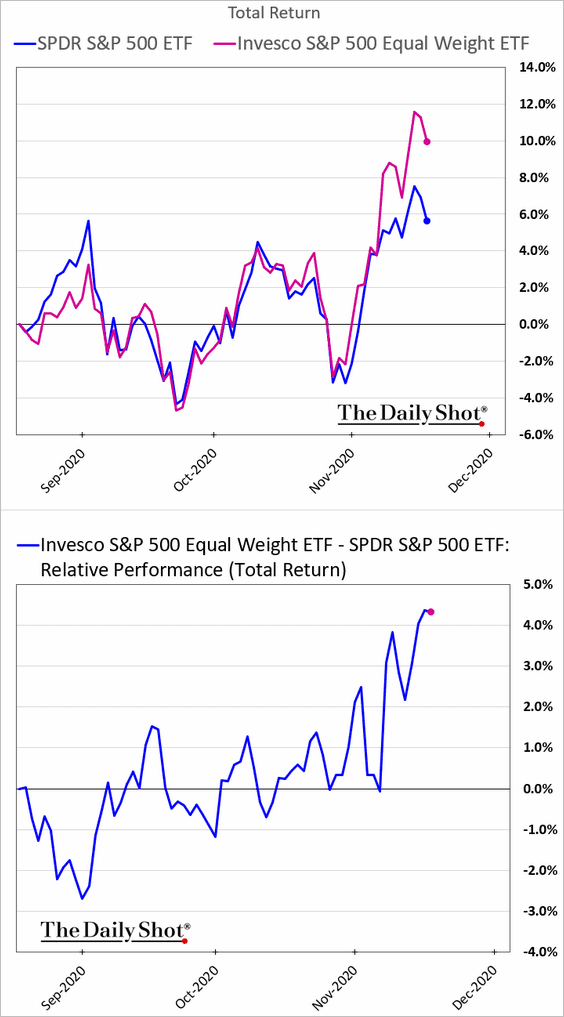
1. It’s been a good month for the S&P 500 equal-weight index as the vaccine news lifted many smaller firms.
2. November 9th saw the largest one-day gain in history for the value factor.
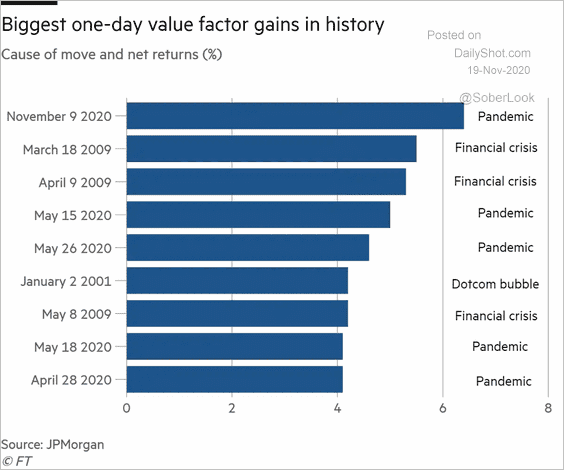 Source: @financialtimes Read full article
3. Below is the month-to-date performance by sector and equity factor.
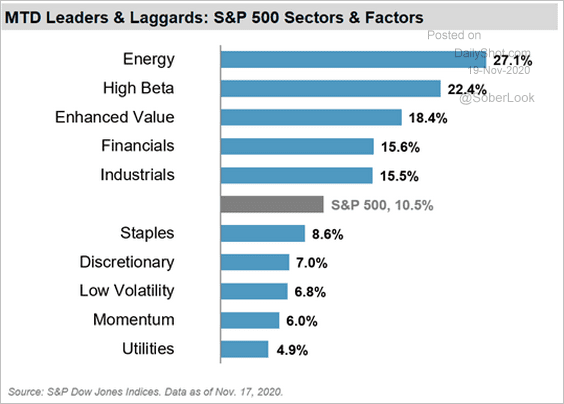 Source: S&P Global Market Intelligence
And here is the recent sector rotation.
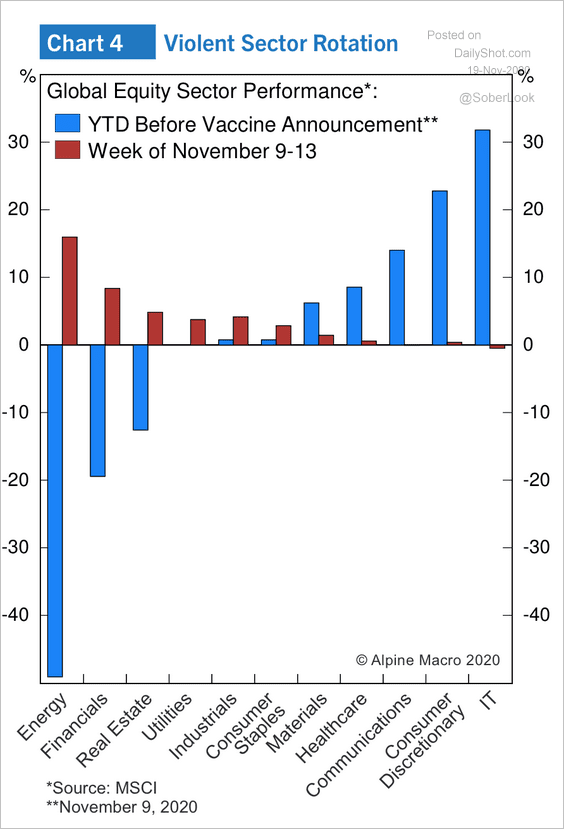 Source: Alpine Macro
——————–
4. Fewer fund managers are overweight cash than at any time since 2015.
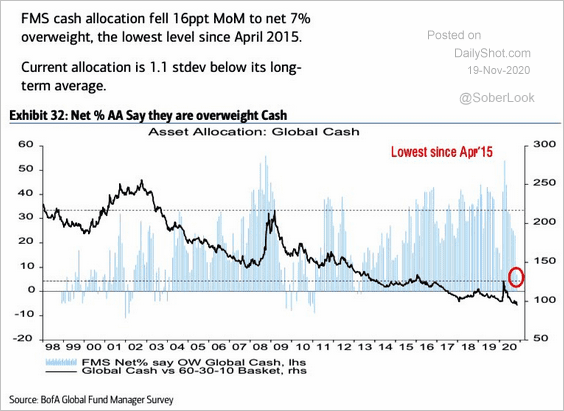 Source: BofA Global Research, @WallStJesus
5. Investors have rushed back into equity ETFs over the past week.
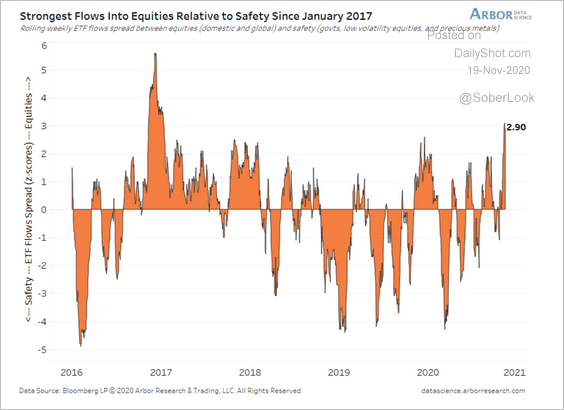 Source: Arbor Research & Trading
Flows into equity ETFs are now trouncing fixed income and commodities.
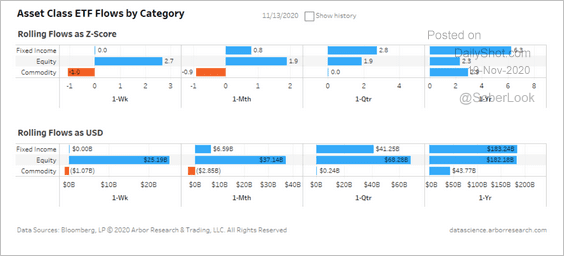 Source: Arbor Research & Trading
——————–
6. Fund managers continue to see long tech as the most crowded trade.
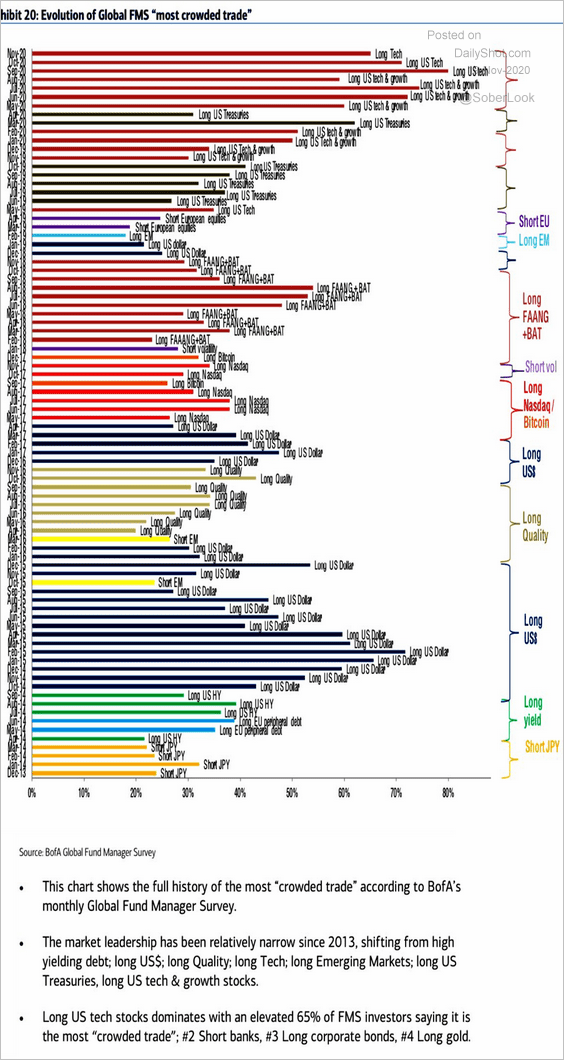 Source: BofA Global Research, @WallStJesus
7. The price-to-sales ratio shows that US stock valuations are rich.
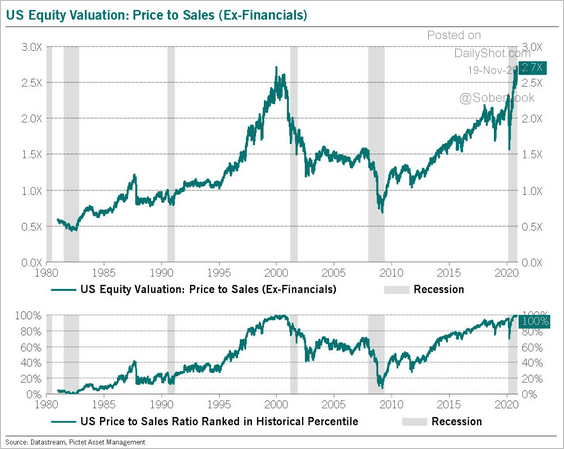 Source: @BittelJulien
8. Who thinks they can beat the market?
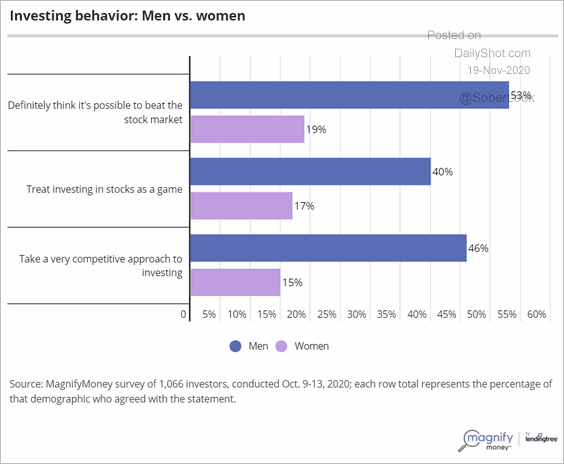 Source: MagnifyMoney
——————–
Food for Thought
1. Busiest US domestic flight routes:
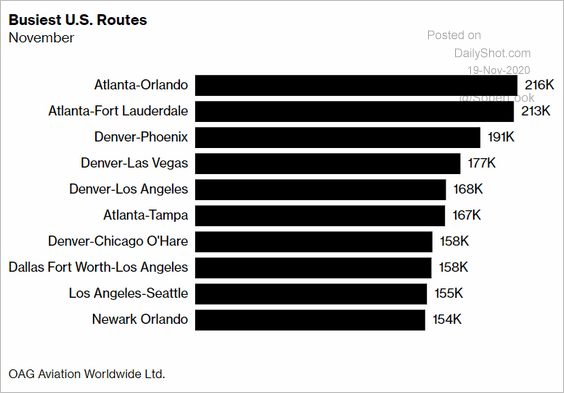 Source: @markets Read full article
2. Airbnb domestic vs. international bookings:
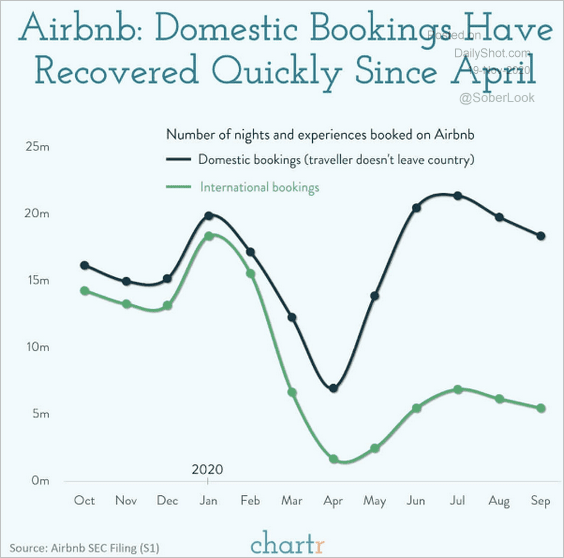 Source: @chartrdaily
3. Consumer goods data in the US show that this year was about baking, washing, and drinking.
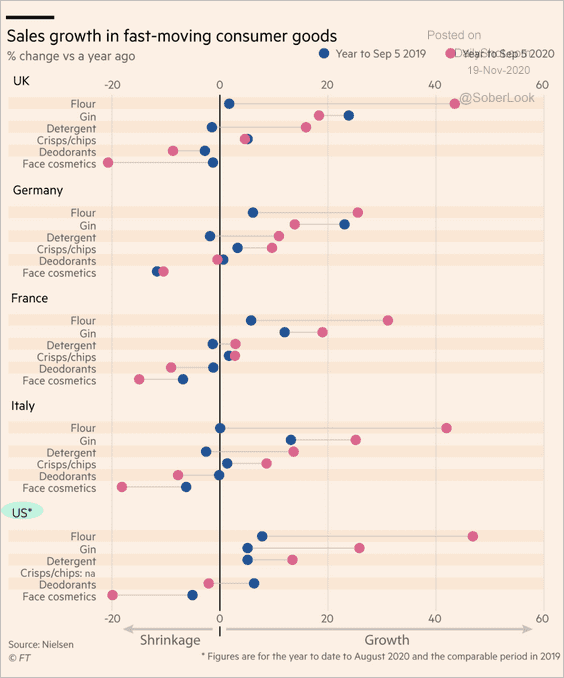 Source: @FT Read full article
4. Biggest importers of US used cars:
 Source: Statista
5. Views on how well governments have dealt with COVID:
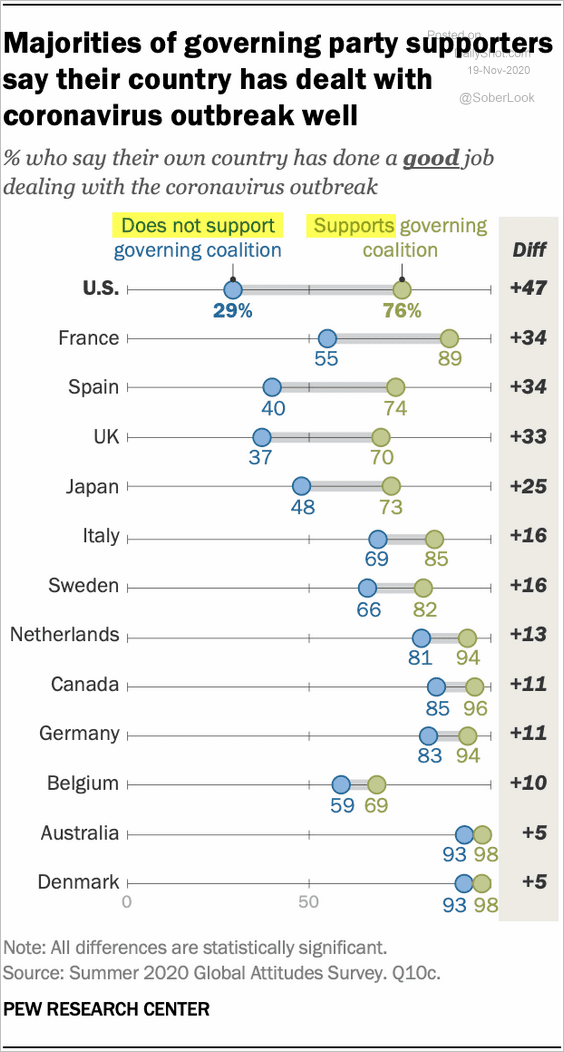 Source: Pew Research Center
6. White House executive orders:
 Source: MarketDesk Research
7. Net gains for Republicans and Democrats since 2016, by county:
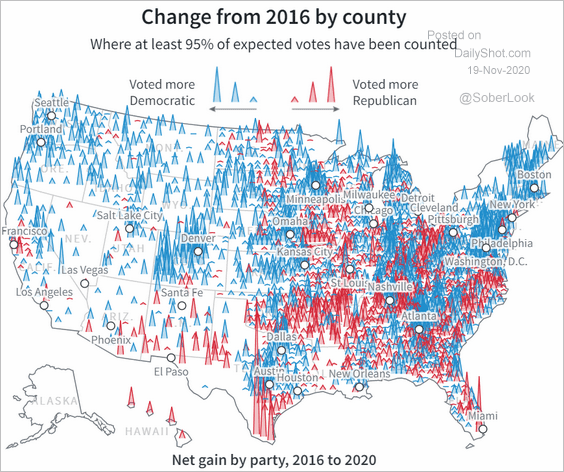 Source: Reuters Read full article
8. Sharing articles on social media:
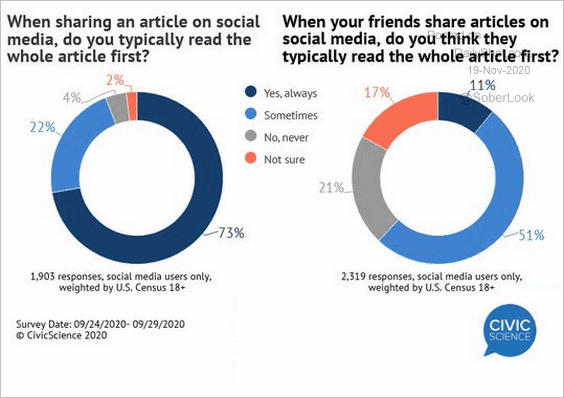 Source: @CivicScience
9. How much do Americans like/dislike other countries?
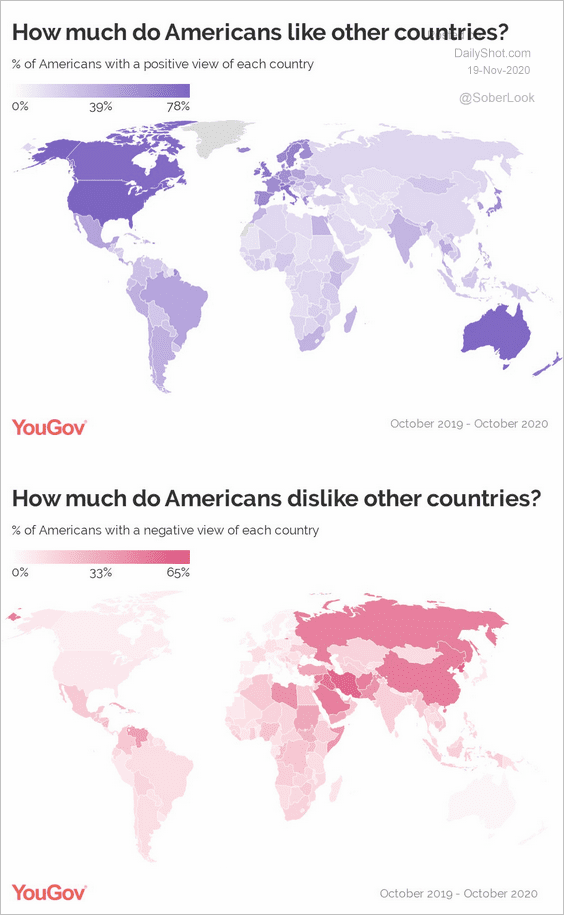 Source: @YouGovAmerica Read full article
——————–