
The Daily Shot: 08-Dec-20
• Equities
• Credit
• Rates
• Energy
• Emerging Markets
• China
• Asia – Pacific
• The Eurozone
• Europe
• The United Kingdom
• The United States
• Global Developments
• Food for Thought
Equities
1. The 2020 liquidity boost from monetary and fiscal stimulus programs was helpful for stocks.
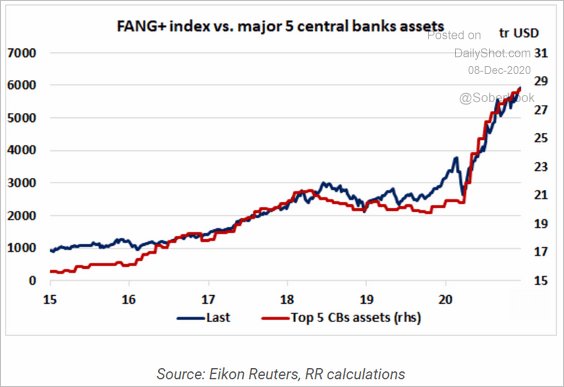 Source: Rothko Research
2. US-focused ETFs took in $62 billion of inflows in November – the highest monthly inflow in history, according to State Street.
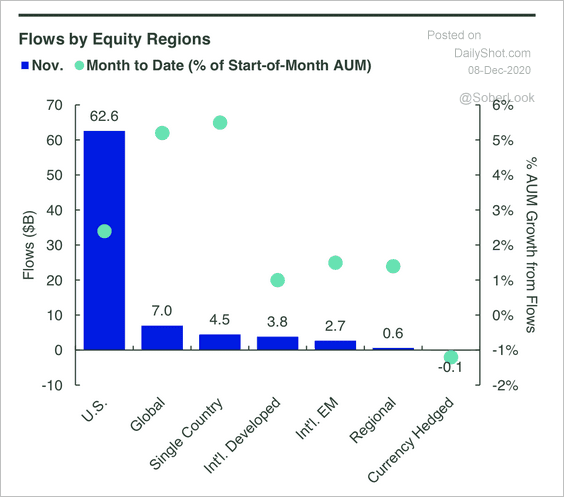 Source: SPDR Americas Research, @mattbartolini
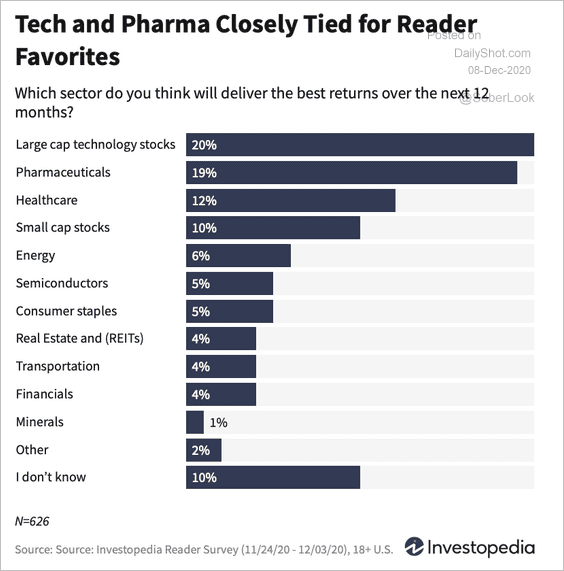
3. Investopedia readers (mostly retail investors) expect strong equity returns next year, led by large-cap tech and pharma stocks (two charts).
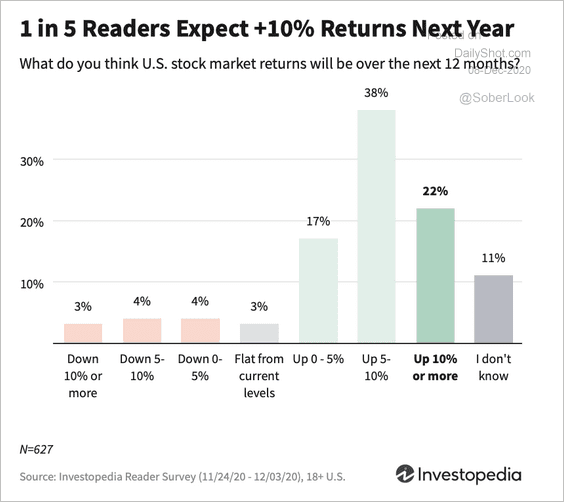 Source: Investopedia Read full article
 Source: Investopedia Read full article
——————–
4. Companies continue to set aside significant amounts of cash (the most since the 1950s).
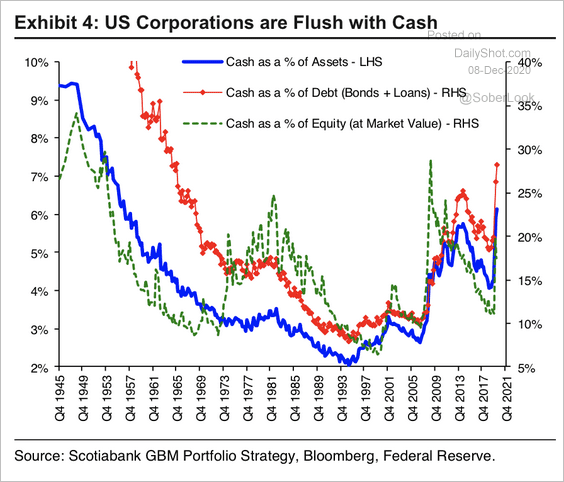 Source: Hugo Ste-Marie, Portfolio & Quantitative Strategy Global Equity Research, Scotia Capital
Here’s a breakdown of corporate cash as a percent of total assets.
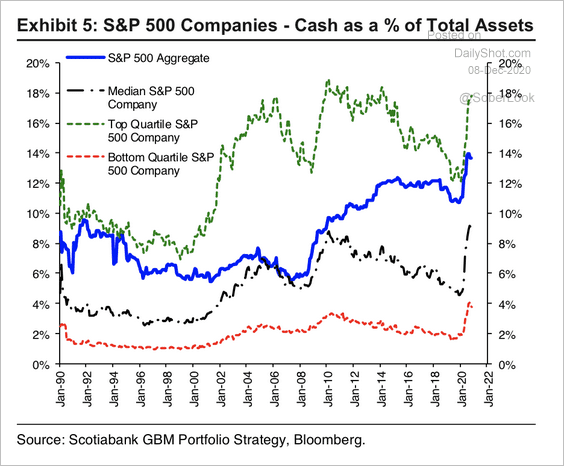 Source: Hugo Ste-Marie, Portfolio & Quantitative Strategy Global Equity Research, Scotia Capital
——————–
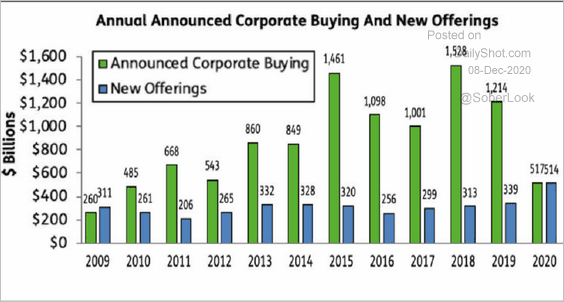
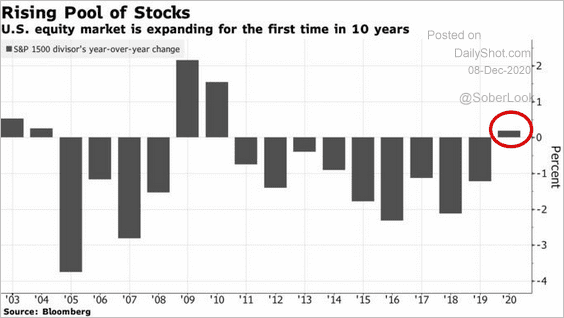
5. Higher IPO activity and a sharp decline in share buybacks have resulted in a net equity supply increase (2 charts).
 Source: EPFR, @markets Read full article
 Source: @markets Read full article
——————–
6. Elevated levels of business activity (ISM) tend to coincide with lower stock market volatility.
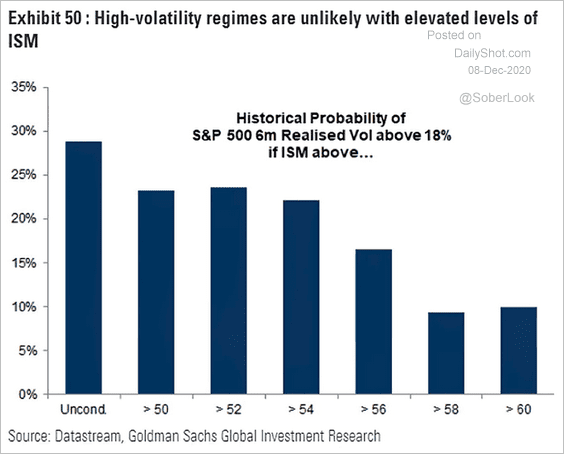 Source: @ISABELNET_SA, @GoldmanSachs
7. This rally has outperformed previous post-election gains.
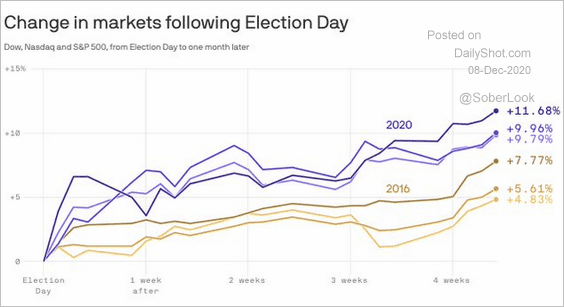 Source: @axios Read full article
8. Is the market too pessimistic on dividend growth?
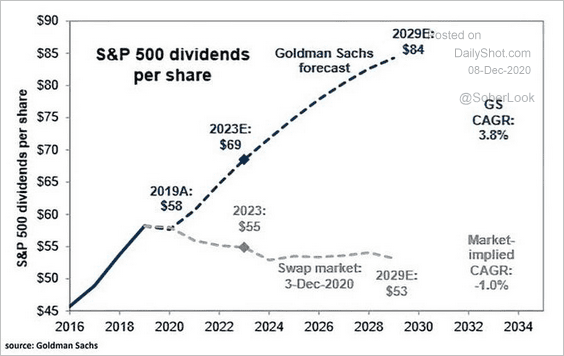 Source: Goldman Sachs, @ISABELNET_SA
9. The correlation between stocks and bonds hasn’t always been negative.
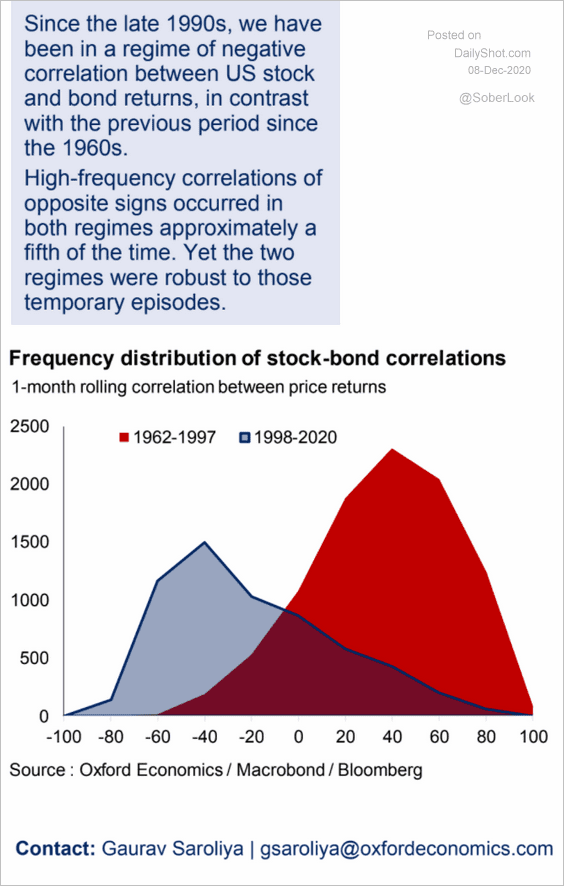 Source: Oxford Economics
10. Current valuations are unprecedented, given such low rates.
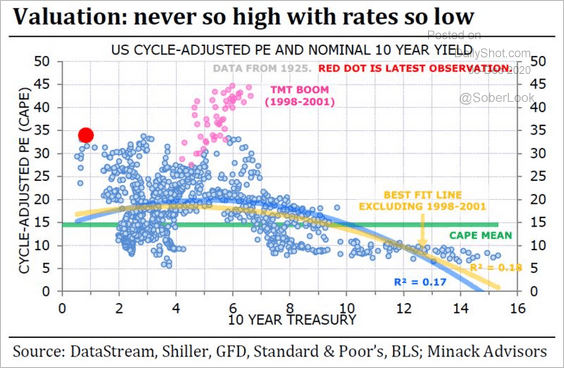 Source: Minack Advisors, @johnauthers, @bopinion Read full article
11. Average ESG ratings (and the number of stocks rated) have risen over the past decade. But this doesn’t necessarily mean companies have become better corporate citizens. The increase in scores is due to more data becoming available over time, according to Factor Research.
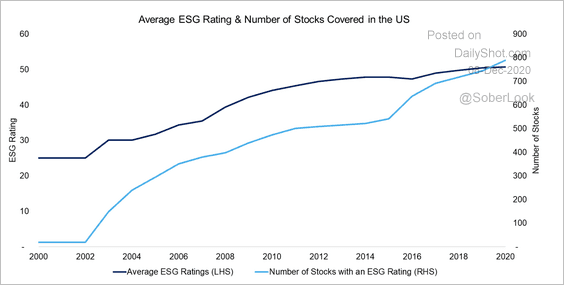 Source: FactorResearch
Stocks with the lowest ESG scores were more volatile this year but also generated the highest returns.
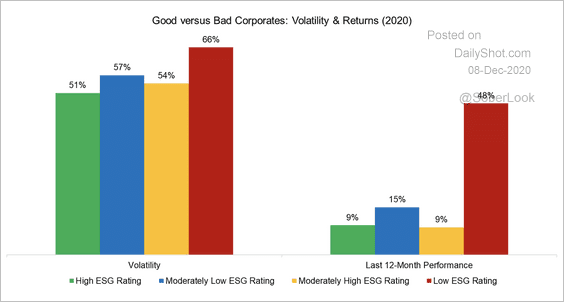 Source: FactorResearch
——————–
12. Next, we have some sector-specific updates.
• “Going-out” (as opposed to “staying in”) industries have been playing catch-up since March lows and recently benefitting from positive vaccine news.
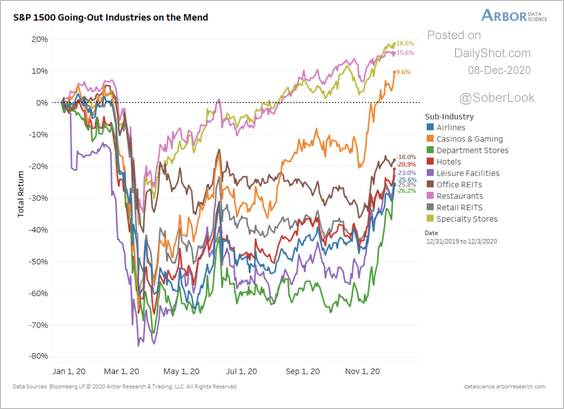 Source: Arbor Research & Trading
• Valuations for energy and financials remain low even after the November rally.
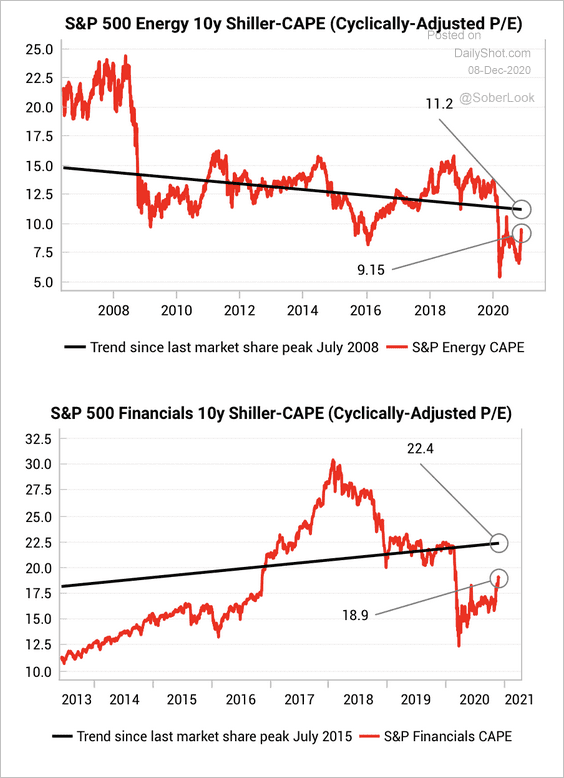 Source: Variant Perception
• The charts below show sector performance since the end of August. We also have some of the sectors’ exposure to equity factors, which helps explain post-vaccine performance shifts.
– Healthcare:
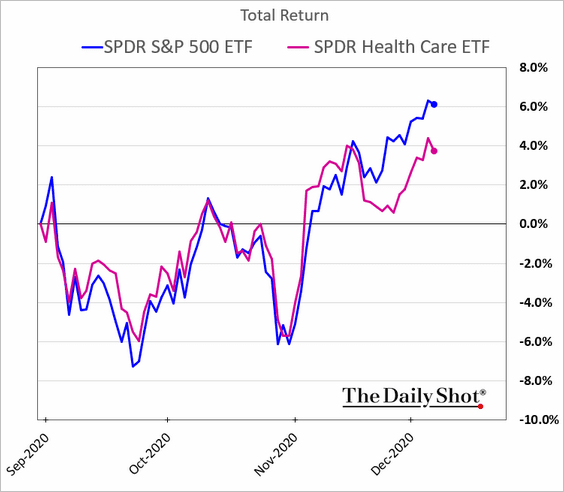
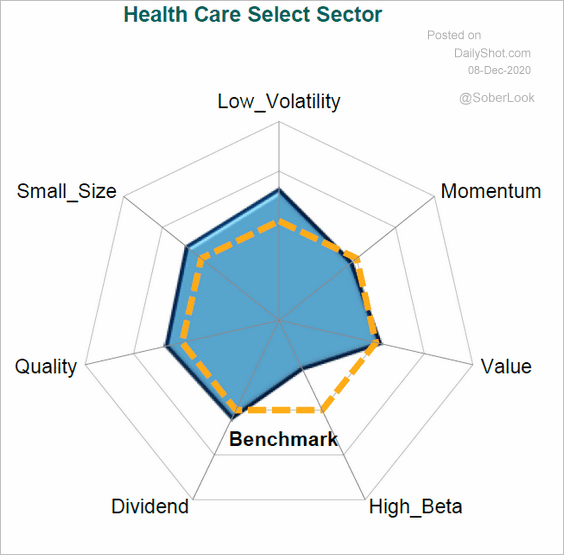 Source: S&P Global Market Intelligence
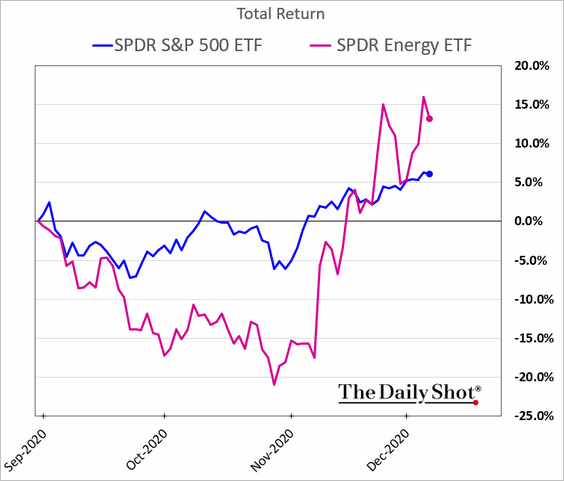
– Utilities:
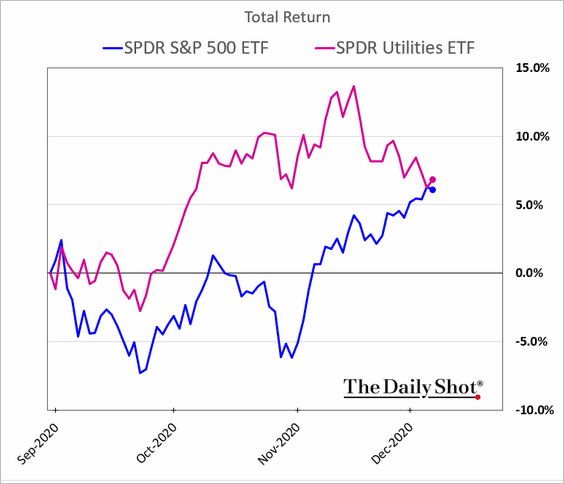
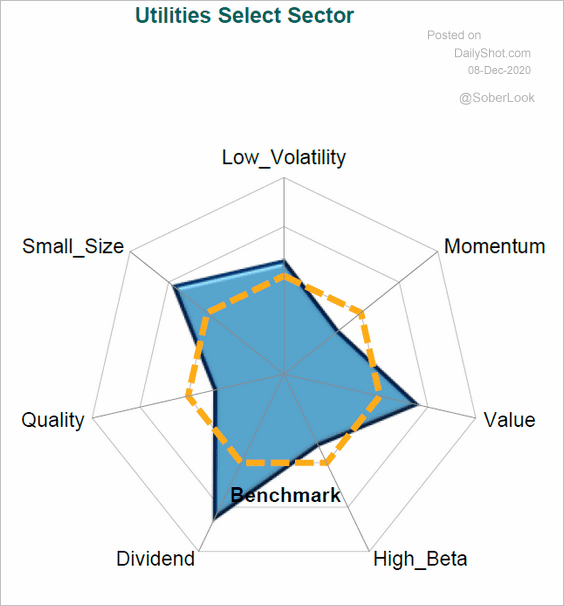 Source: S&P Global Market Intelligence
– Energy:
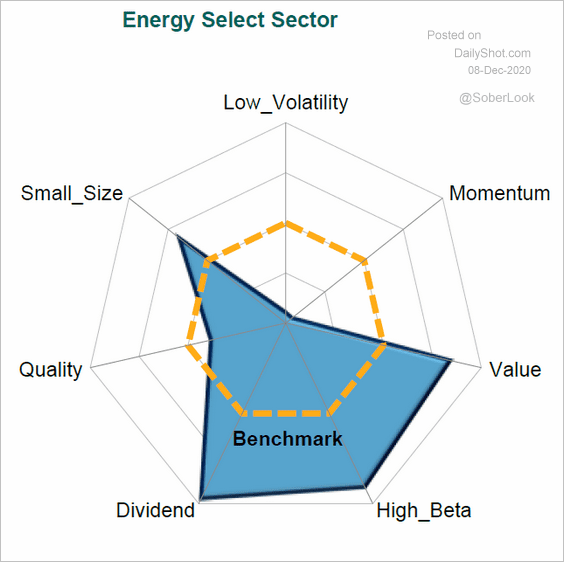 Source: S&P Global Market Intelligence
– Banks:
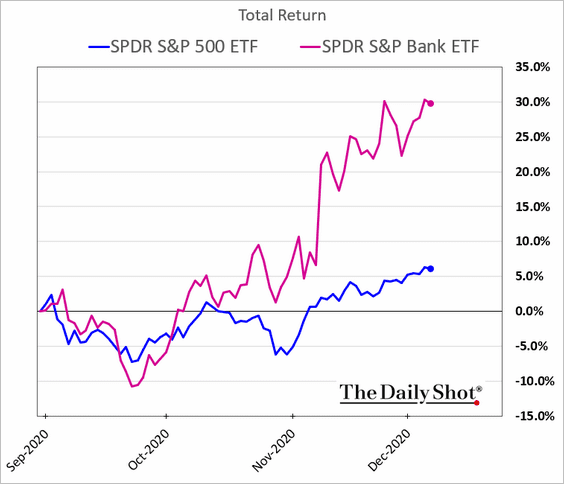
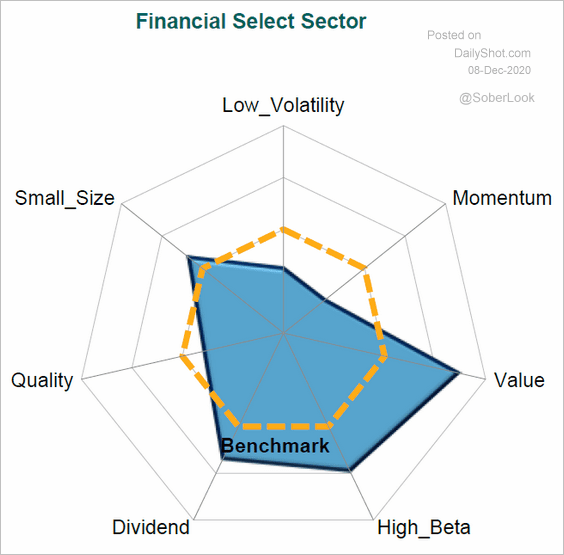 Source: S&P Global Market Intelligence
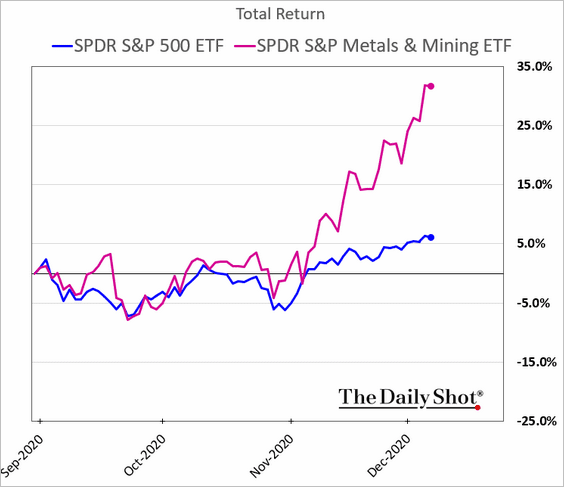
– Metals & Mining:
– Transportation:
![]()
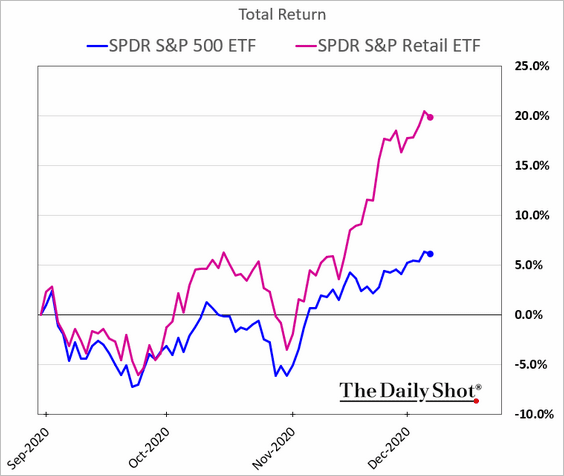
– Retail:
– Consumer Staples:
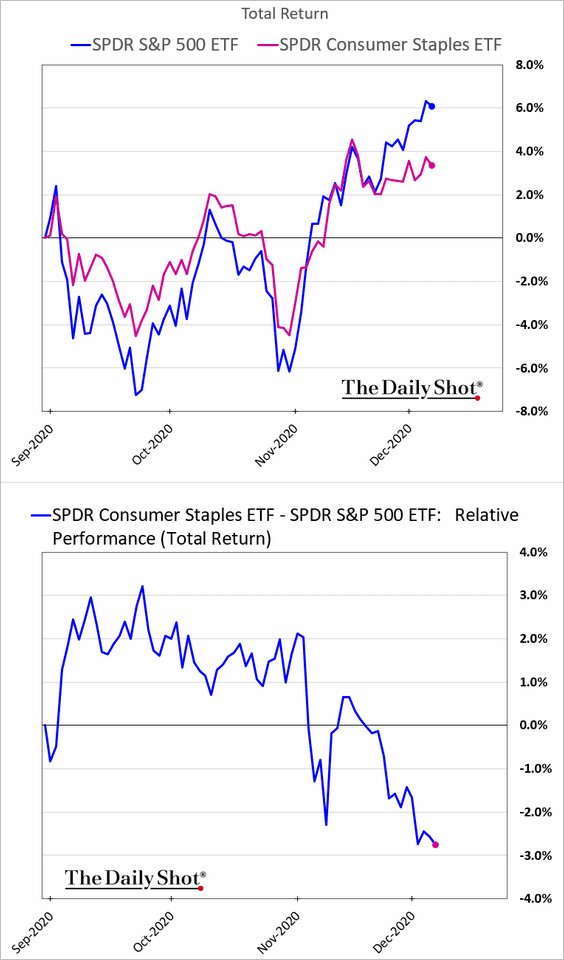
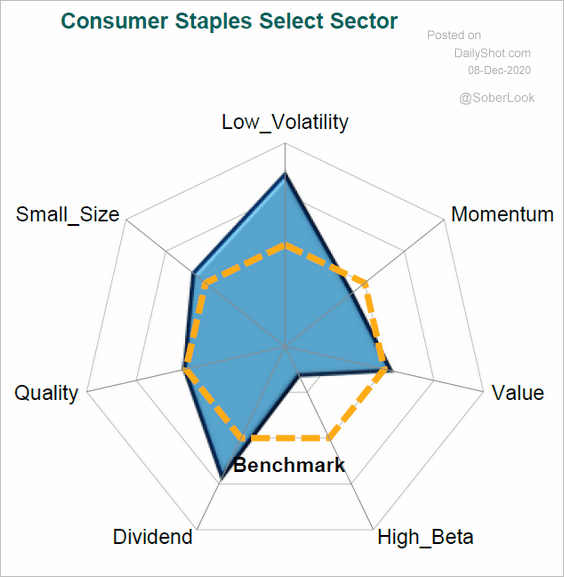 Source: S&P Global Market Intelligence
– The rebound in US office and apartment REITs is starting to stall.
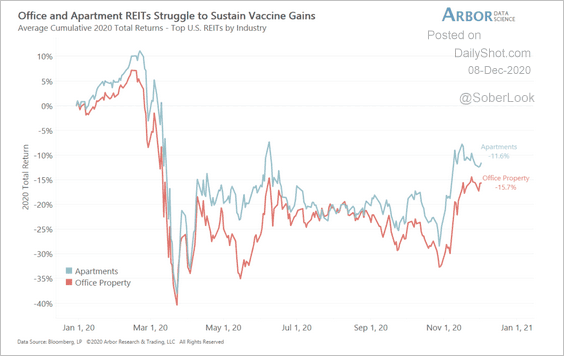 Source: Arbor Research & Trading
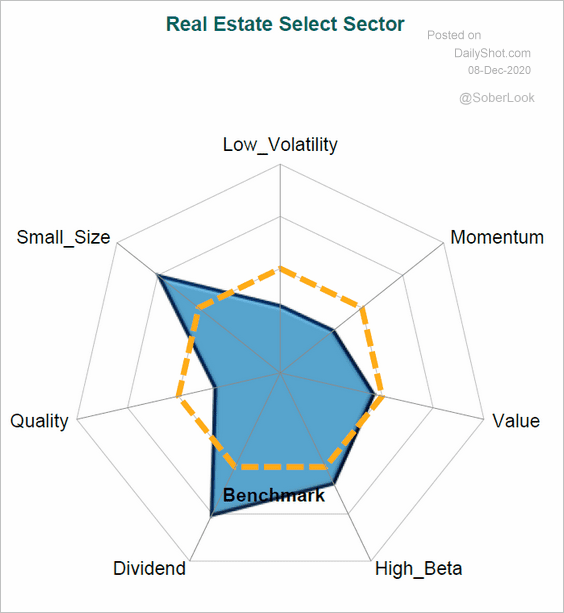 Source: S&P Global Market Intelligence
• Finally, this scatterplot shows each sector’s exposure to value vs. growth.
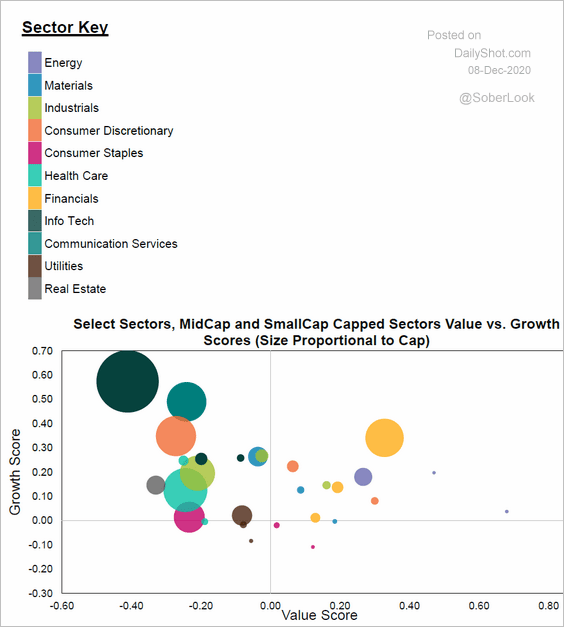 Source: S&P Global Market Intelligence
Credit
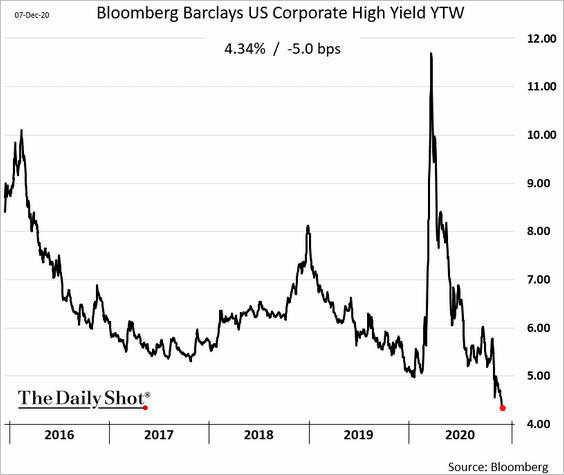
1. Yields on sub-investment-grade bonds continue to hit record lows.
2. A large proportion of the “stressed names” in high yield (trading below $85) are energy firms.
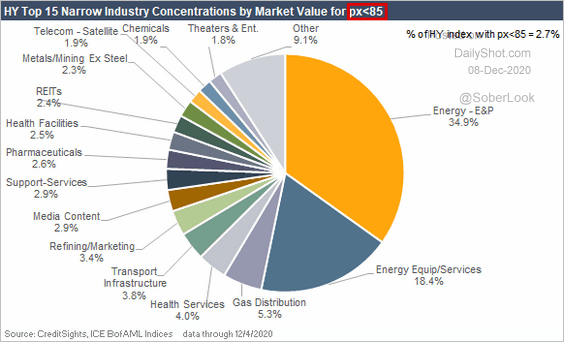 Source: CreditSights
3. Interest coverage is deteriorating in some of the weaker names.
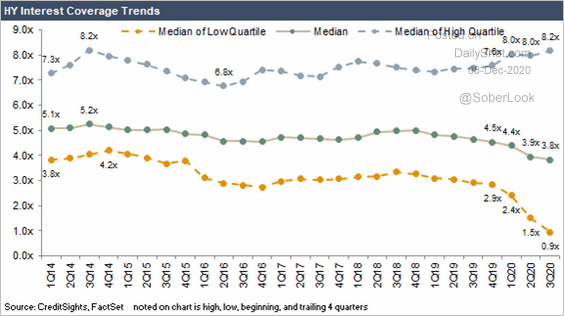 Source: CreditSights
4. The US middle-market loan volume is at multi-year lows.
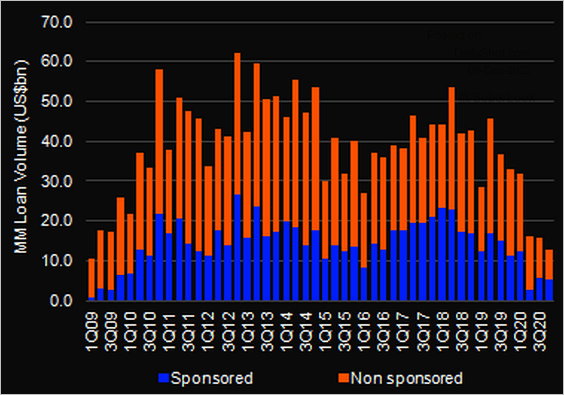 Source: @LPCLoans
Rates
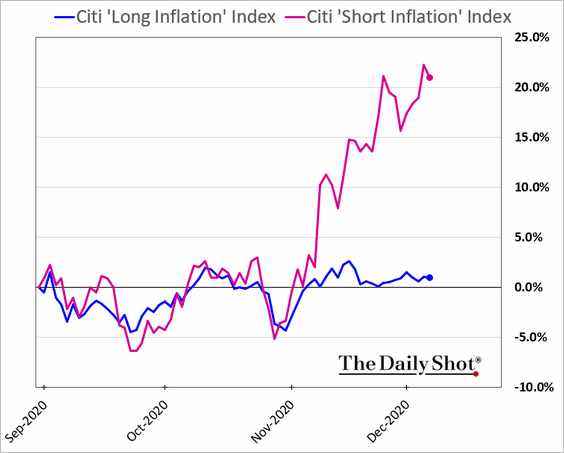
1. The markets are signaling higher inflation ahead.
• Stocks that benefit from higher inflation are outperforming.
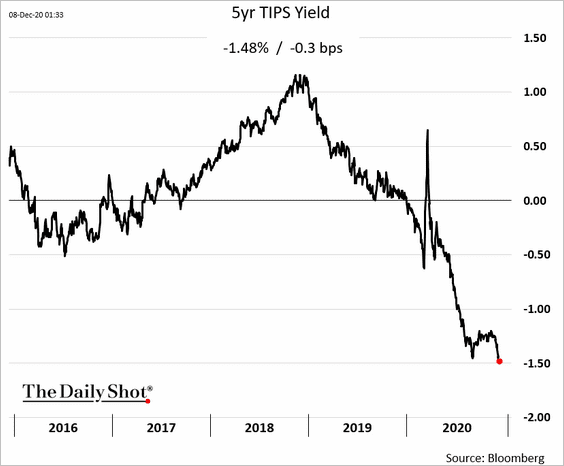
• Demand for inflation-protected securities (TIPS) remains elevated, …
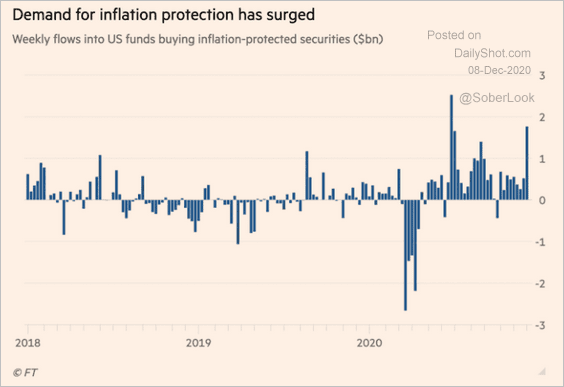 Source: @financialtimes Read full article
… pulling TIPS yields deeper into negative territory.
——————–
2. The US dollar’s weakness has been boosting inflation expectations.
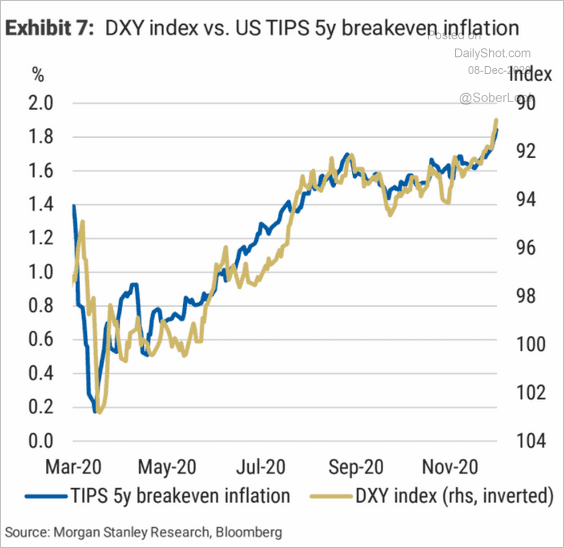 Source: Morgan Stanley Research
Are commodity and other risk-on markets pointing to further gains in inflation expectations?
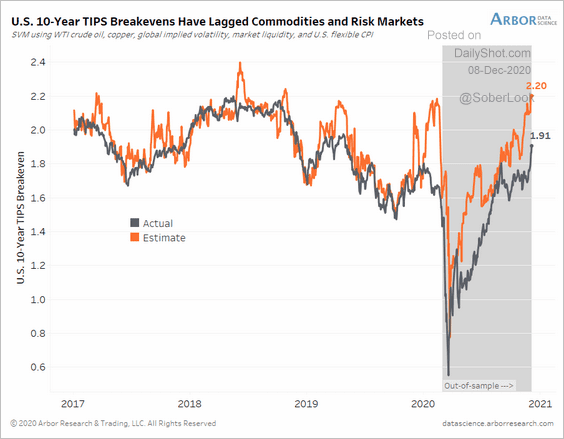 Source: Arbor Research & Trading
——————–
3. The iShares 20+ year Treasury bond ETF (TLT) is below its 200-day moving average.
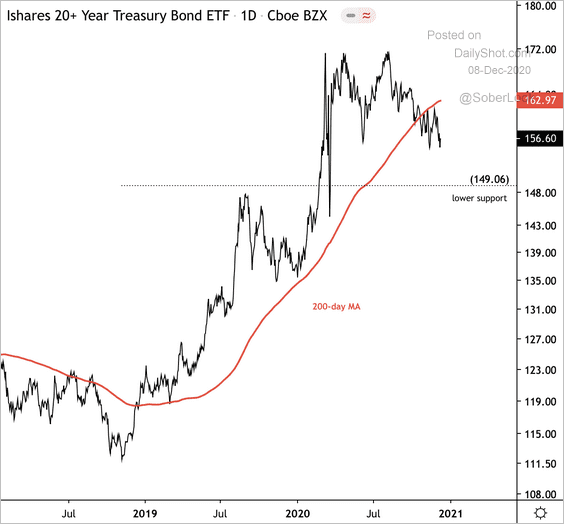 Source: @DantesOutlook
4. The copper-to-gold ratio is widening its gap vs. Treasury yields.
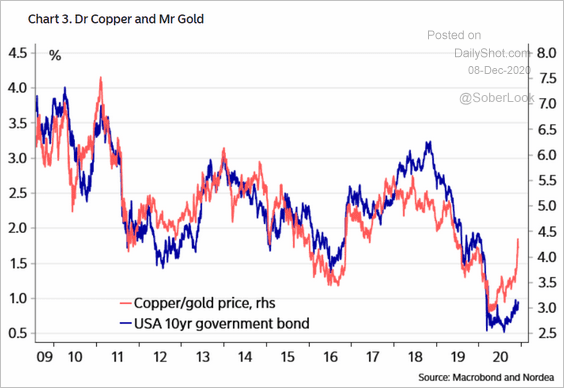 Source: Nordea Markets
5. Lower supply and greater demand for safe government bonds have helped drive down yields over the past 20 years, according to Oxford Economics. Are we at a turning point?
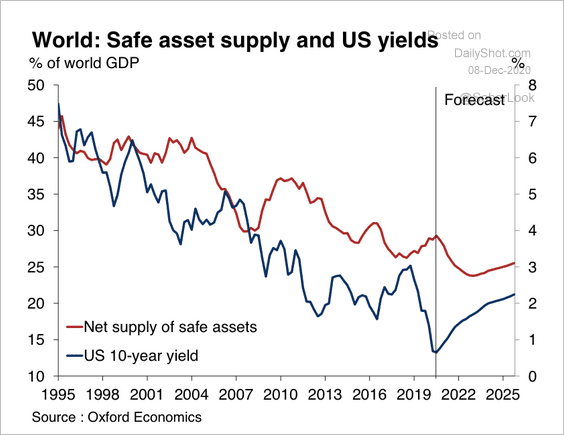 Source: Oxford Economics
6. The Fed now owns more Treasury securities than all the foreign central banks and governments.
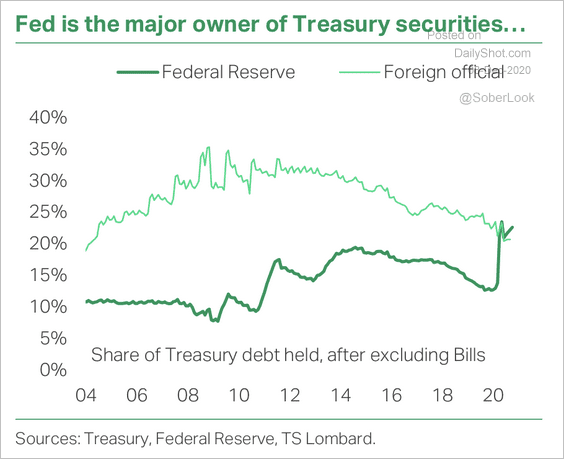 Source: TS Lombard
7. Chris Waller appears to be a dove.
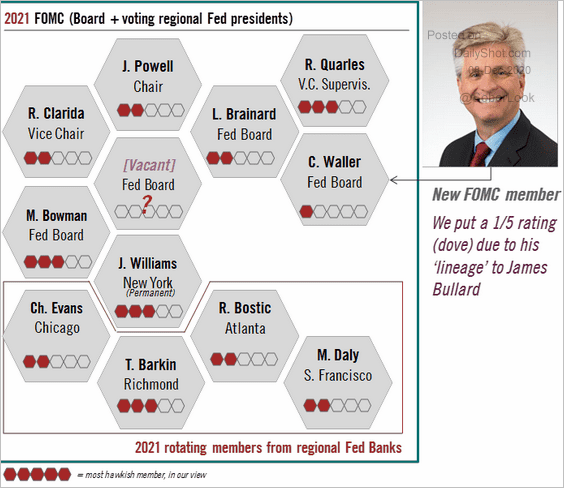 Source: @TCosterg
Energy
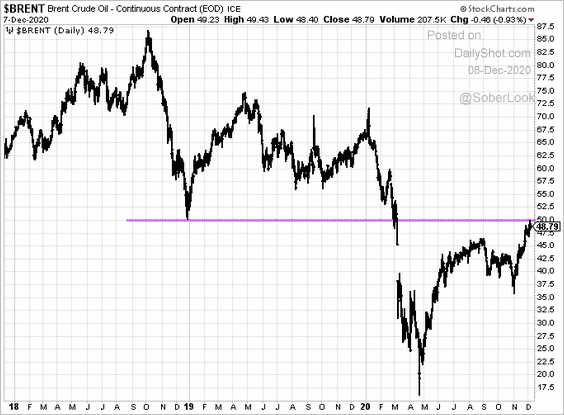
1. Brent held resistance at $50/bbl.
2. Oil floating storage is declining as the futures curve pulls out of contango.
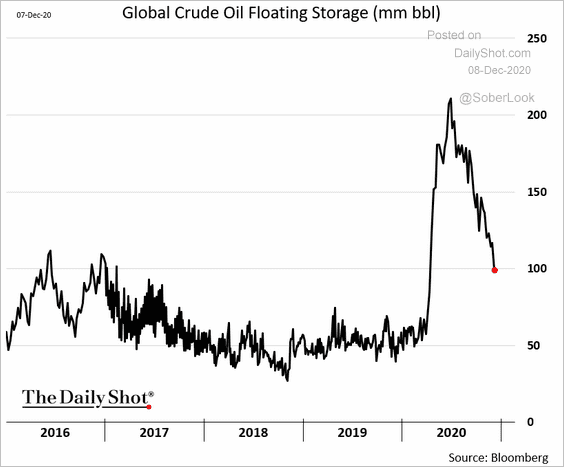 h/t @alfarotiago
3. This chart shows the evolution of global refinery capacity.
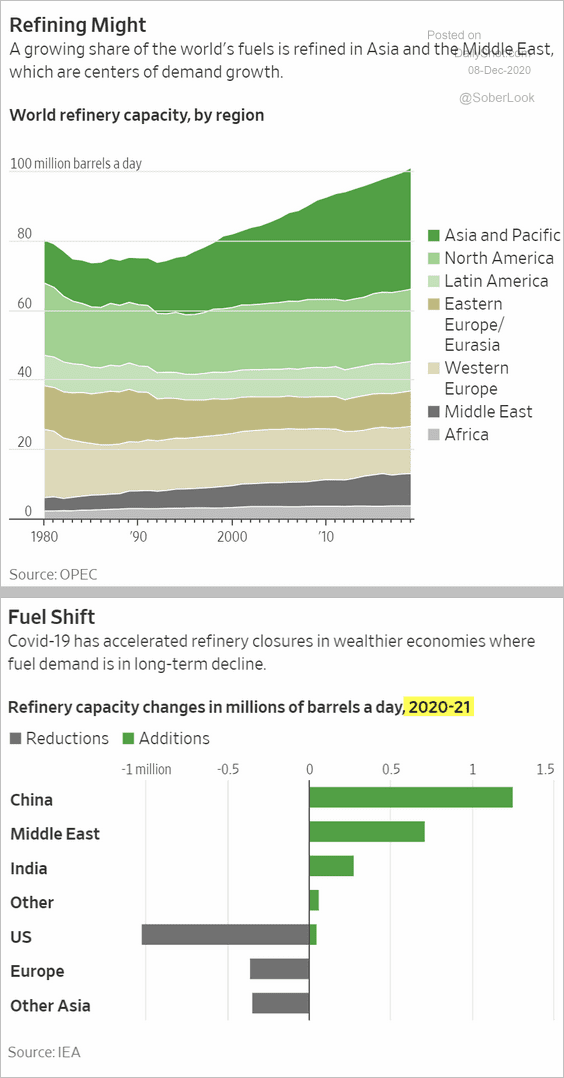 Source: @WSJ Read full article
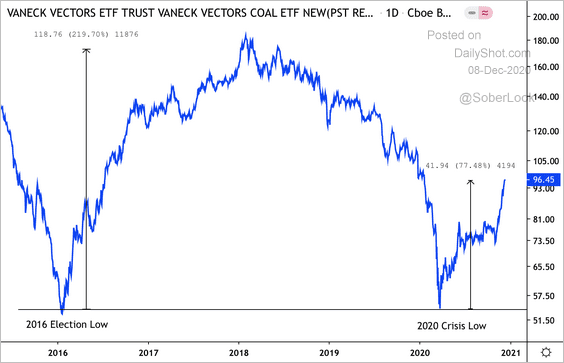
4. Coal is back. The VanEck Vectors Coal ETF is rallying after a two-year downtrend.
 Source: @DantesOutlook
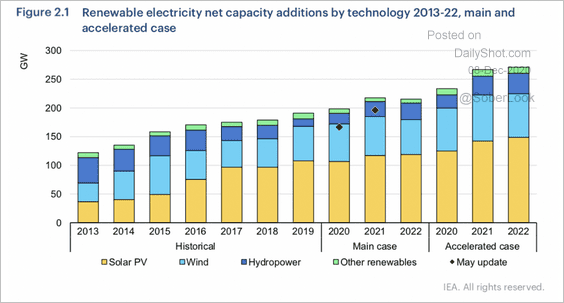
5. Next, we have some updates on renewables.
• Will we see an acceleration of renewable net capacity additions over the next few years?
 Source: IEA
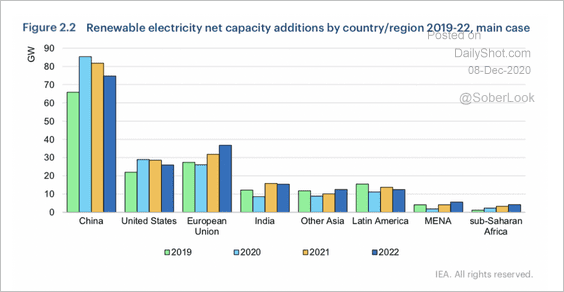
• China leads the world in renewable capacity additions. However, among the three largest players, only the EU will increase its growth over the next two years, according to IEA.
 Source: IEA
• Wind and solar PVs are expected to surpass coal and natural gas as the largest source of power capacity.
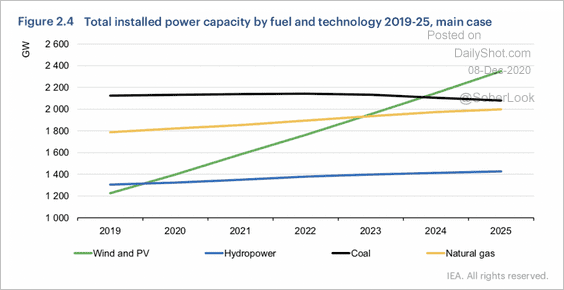 Source: IEA
• US ‘red’ states lead the nation’s clean energy generation.
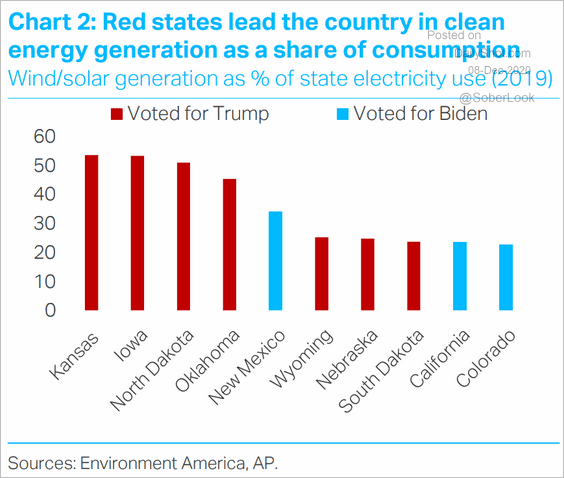 Source: TS Lombard
Emerging Markets
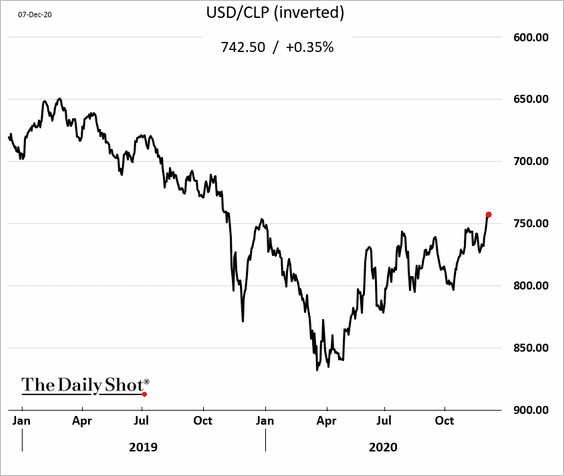
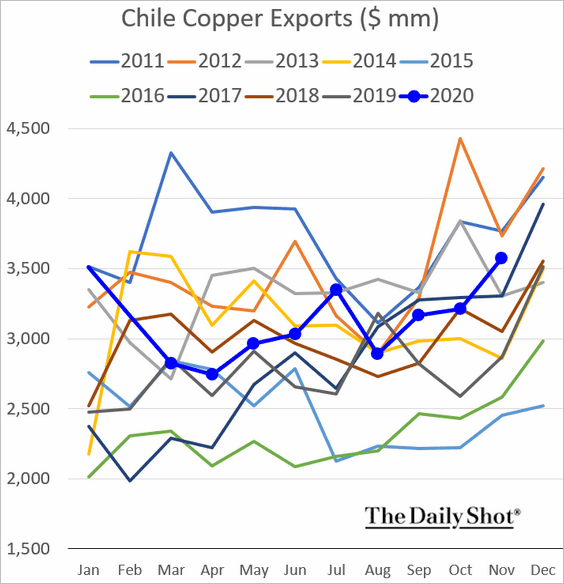
1. Let’s begin with Chile.
• The Chilean peso:
• Inflation:
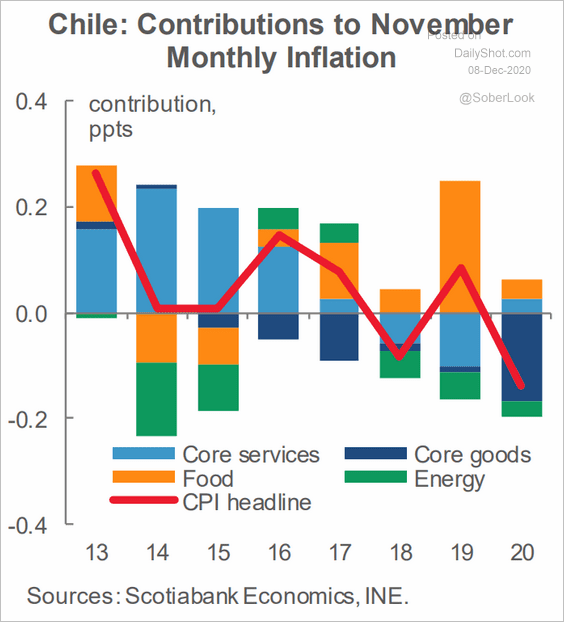 Source: Scotiabank Economics
• Copper exports:
——————–
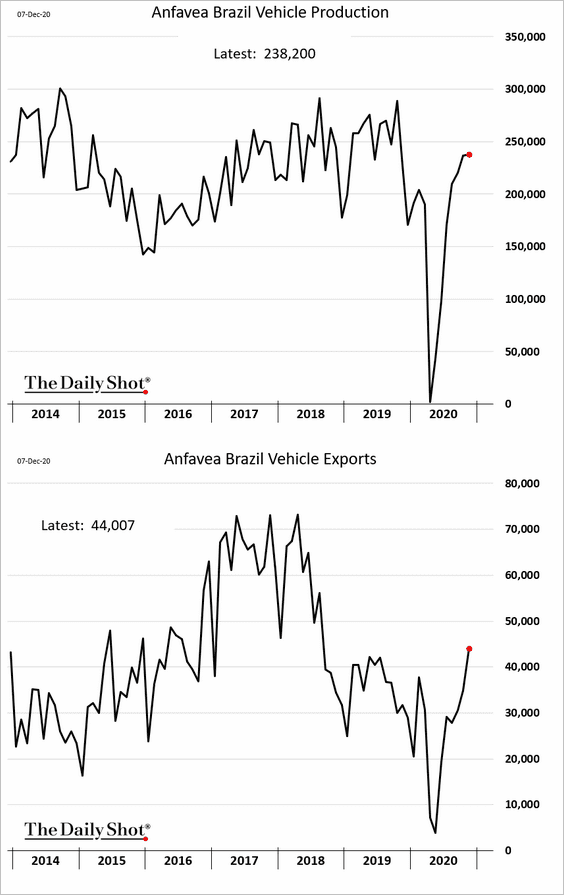
2. Brazil’s vehicle production and exports have recovered to pre-pandemic levels.
3. Fiscal stimulus among Middle-East oil exporters has been limited.
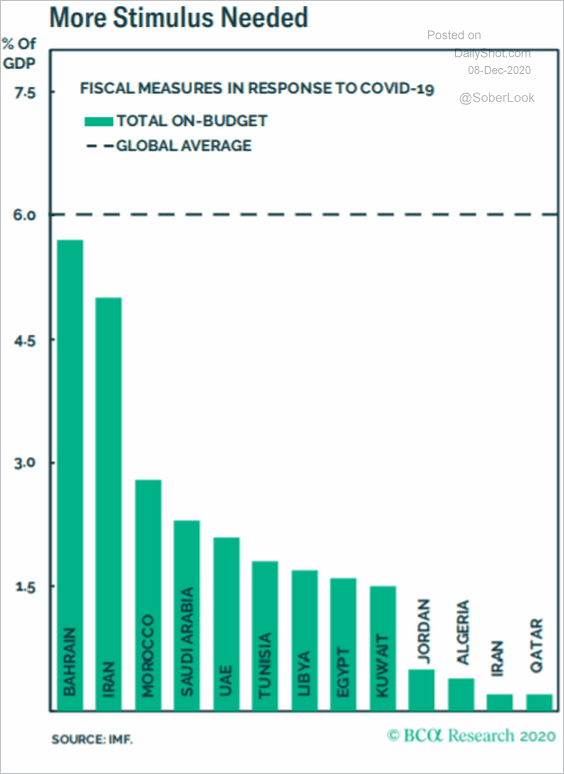 Source: BCA Research
The Arab region could see social unrest next year.
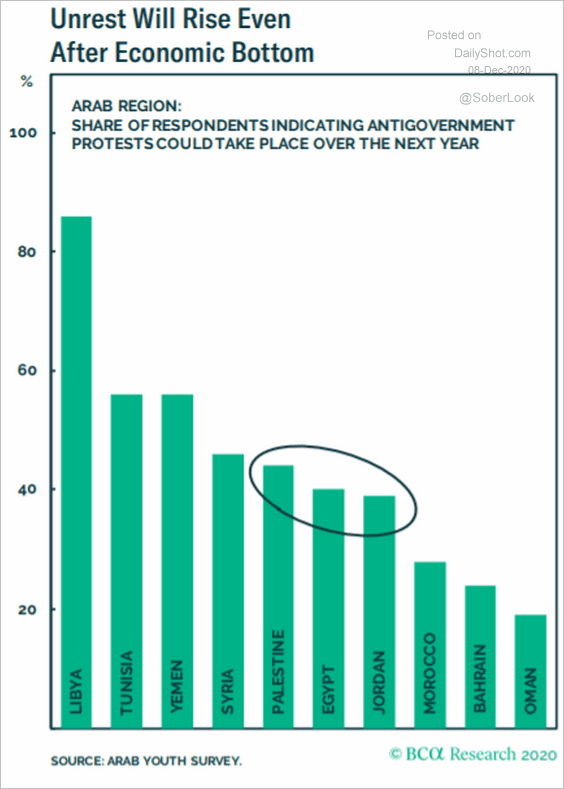 Source: BCA Research
——————–
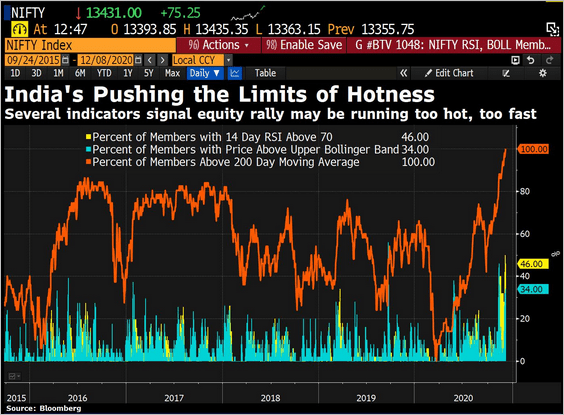
4. India’s stock market looks frothy.
5. Putin’s political party is losing support.
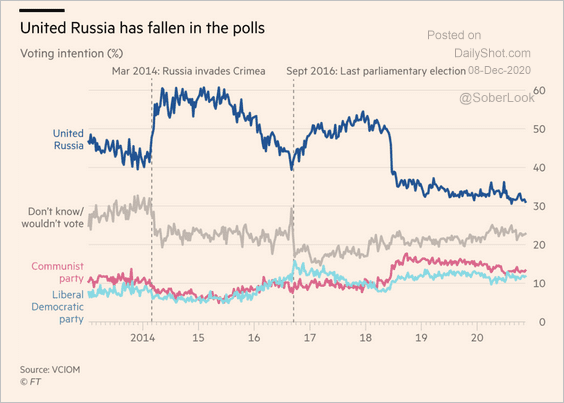 Source: @financialtimes Read full article
6. Here is debt sustainability vs. inflationary risks.
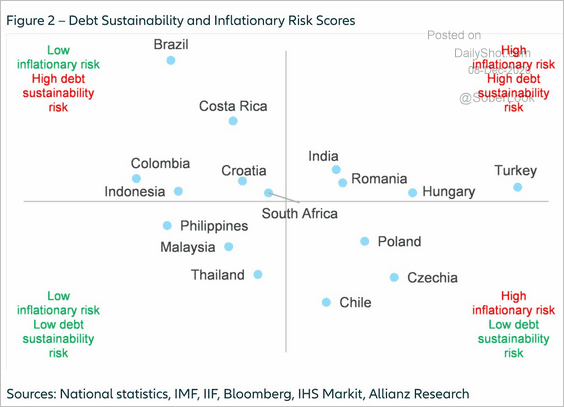 Source: @adam_tooze, @eulerhermes Read full article
7. EM currencies look set to follow China’s renminbi higher.
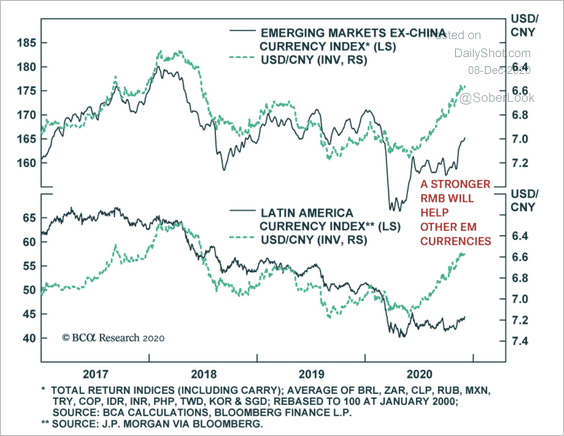 Source: BCA Research
8. This chart shows the number of EM crises by region.
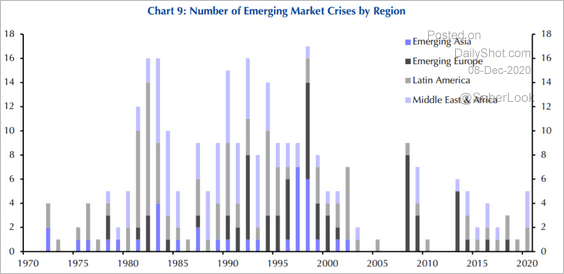 Source: Capital Economics
China
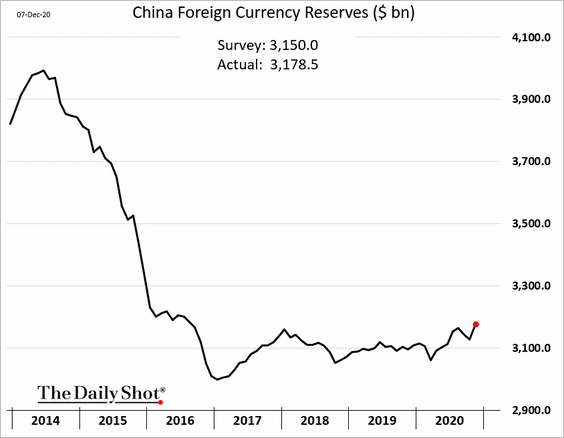
1. FX reserves are moving higher.
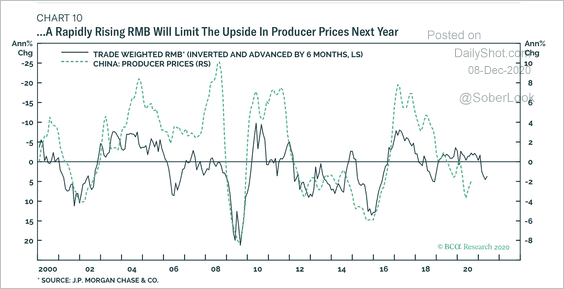
2. Deflation risk is rising, especially with currency appreciation (two charts).
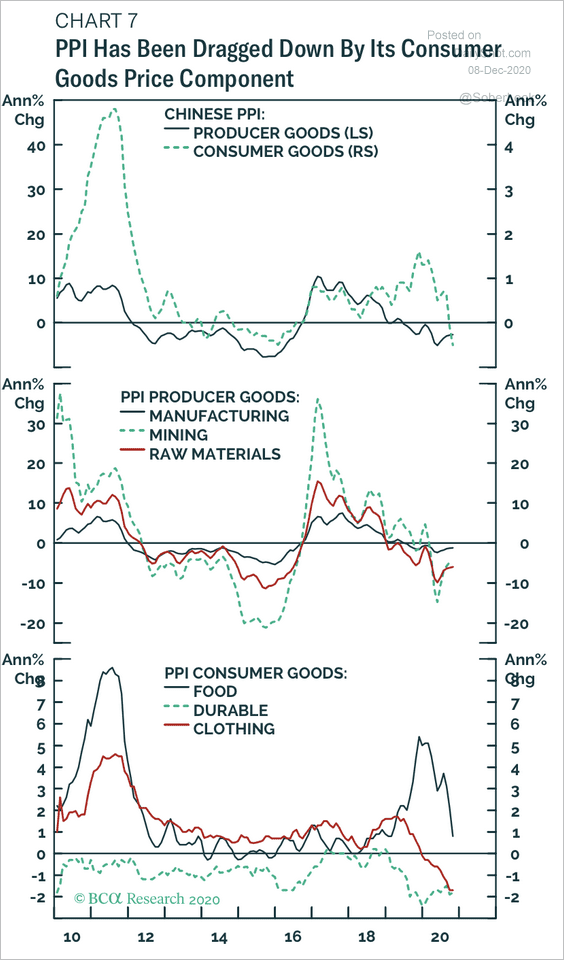 Source: BCA Research
 Source: BCA Research
——————–
3. Disposable incomes in rural areas have improved relative to urban households.
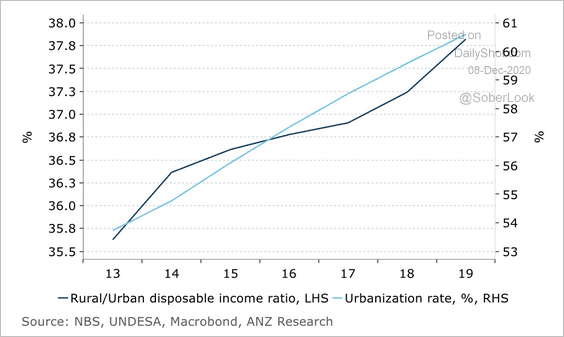 Source: ANZ Research
4. China’s share of the global GDP is expected to keep climbing.
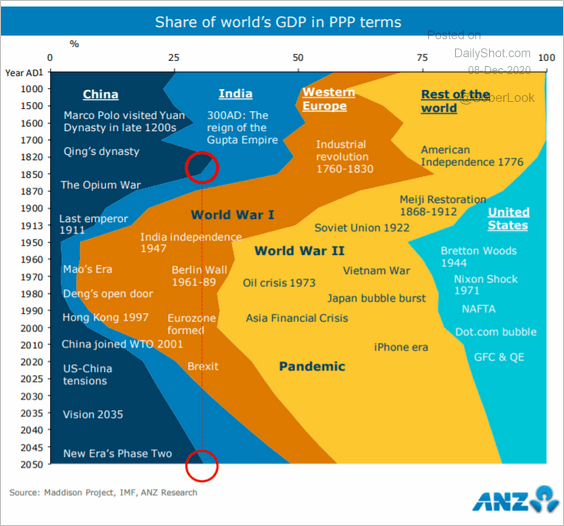 Source: ANZ Research
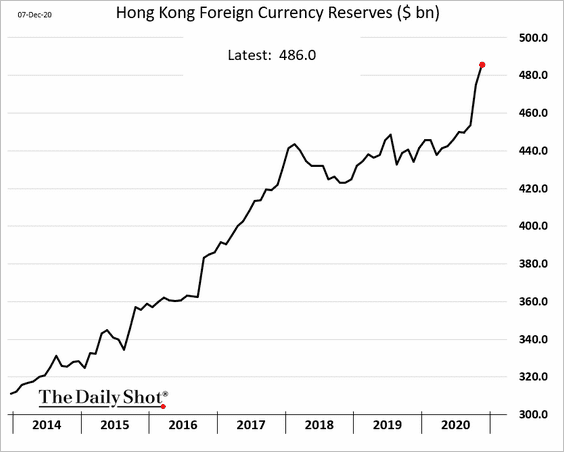
5. Hong Kong’s FX reserves spiked this year amid increased capital inflows.
Asia – Pacific
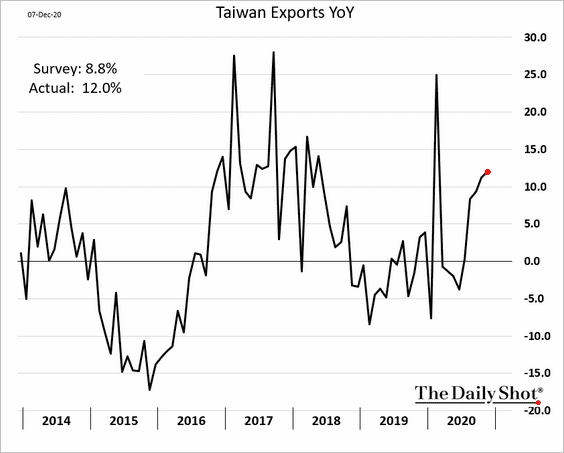
1. Taiwan’s exports have been exceeding expectations.
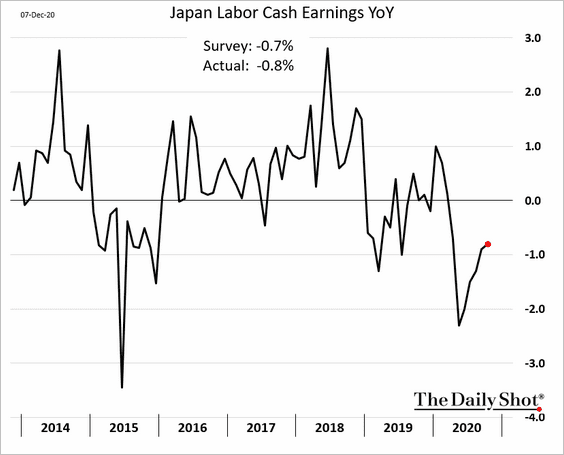
2. Japan’s wages will take a while to recover.
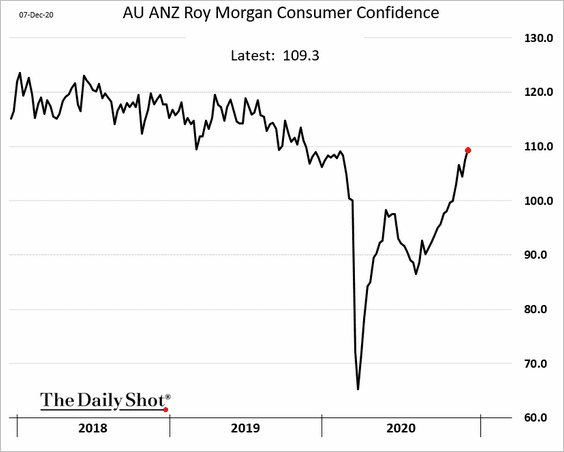
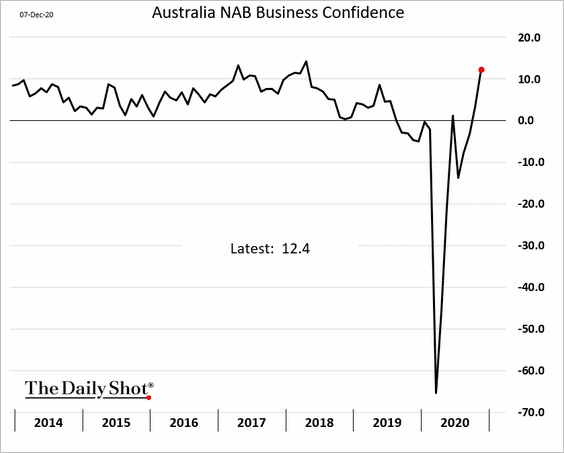
3. Here are some updates on Australia.
• Consumer confidence:
• Business confidence:
• Capacity utilization (based on NAB’s survey):
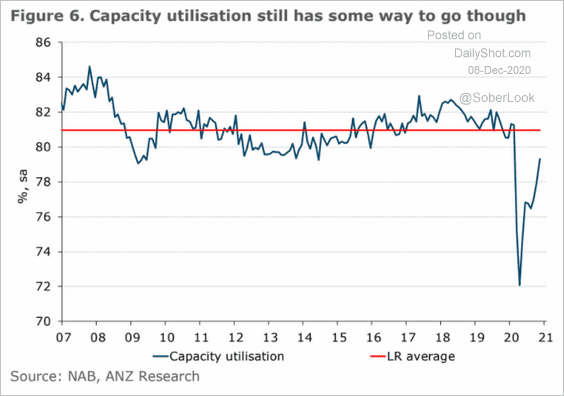 Source: ANZ Research
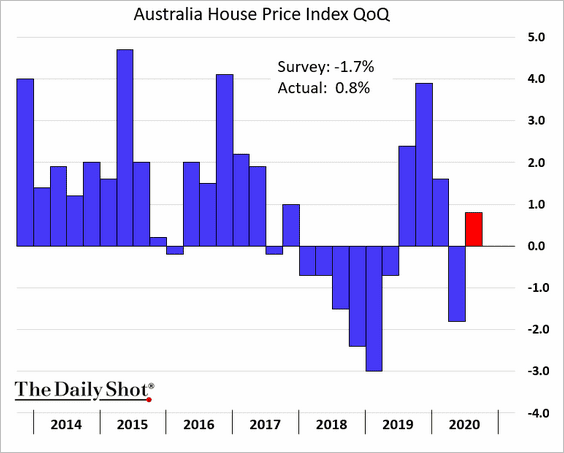
• Home price appreciation (Q3):
• Consumption, disposable income, and the savings ratio:
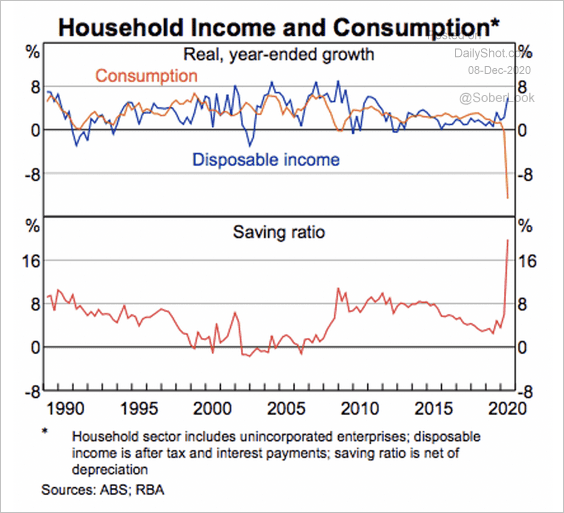 Source: RBA
• Foreign purchases of government debt:
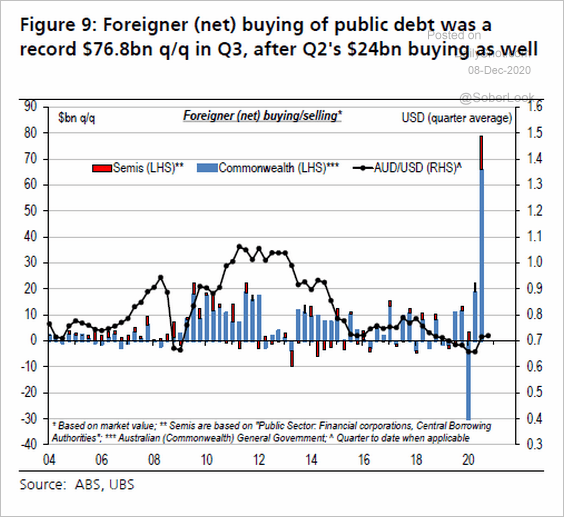 Source: UBS, @kit_lowe
The Eurozone
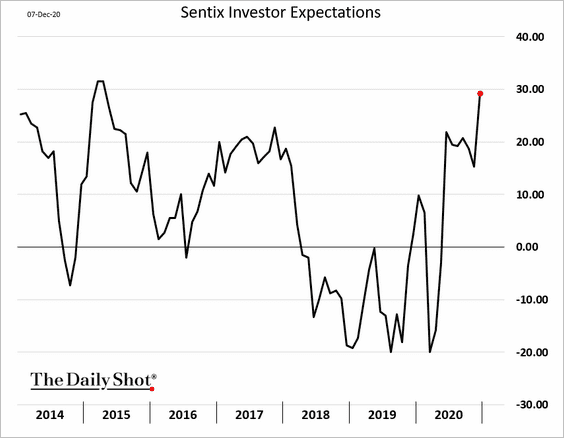
1. Investor confidence surprised to the upside.
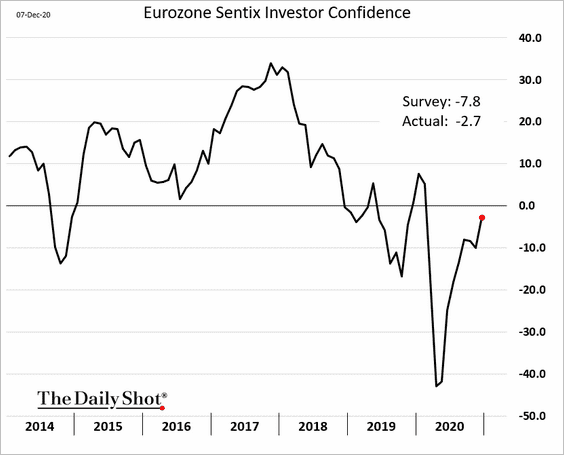
Investor expectations are at multi-year highs.
——————–
2. Here are the contributions to Germany’s industrial production.
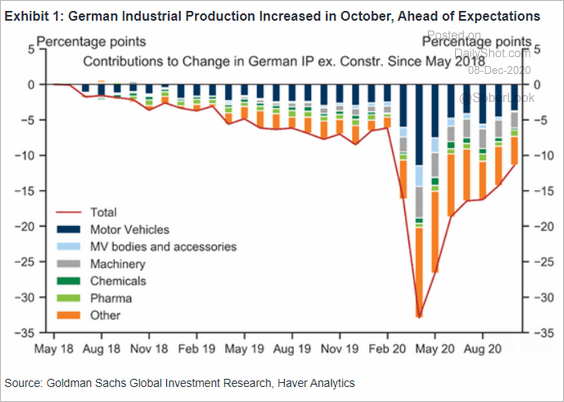 Source: Goldman Sachs
3. This chart shows Bloomberg’s activity indices.
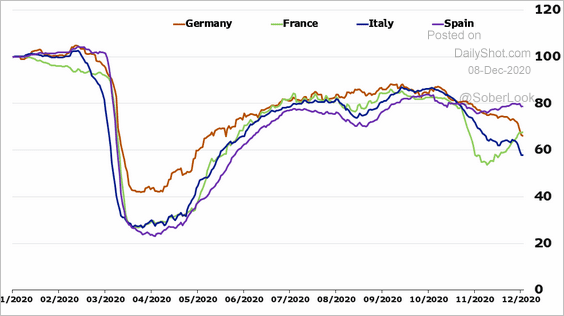 Source: @RoyeBjorn
4. EUR/USD is breaking above a decade long downtrend.
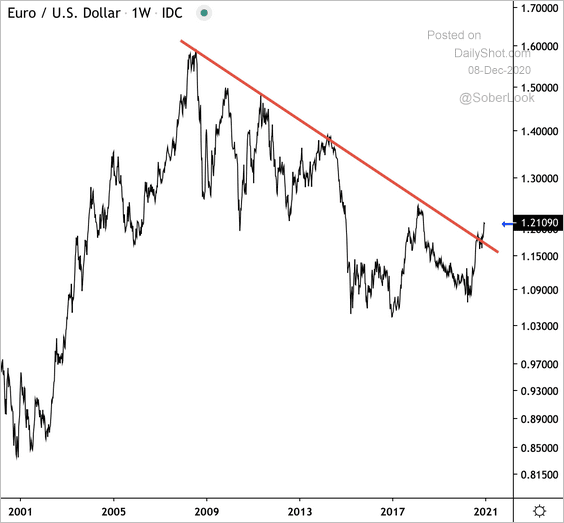 Source: @DantesOutlook
The rally in copper prices suggests more upside for EUR/USD.
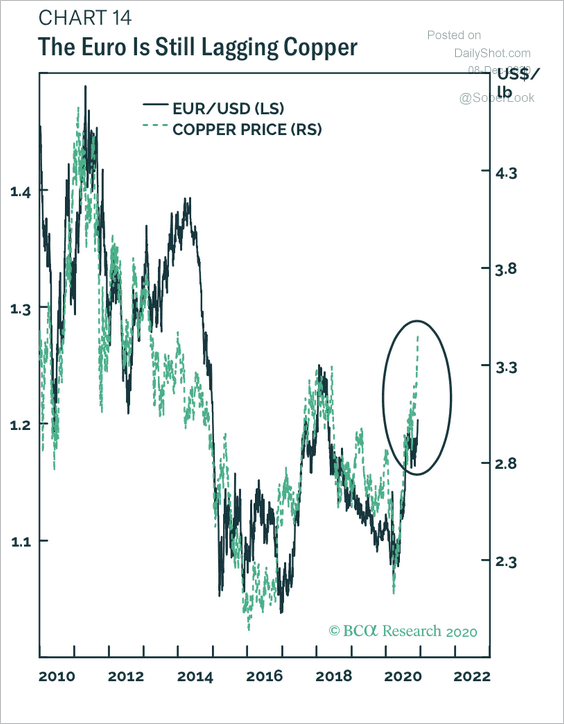 Source: BCA Research
But will the ECB talk down the strengthening euro?
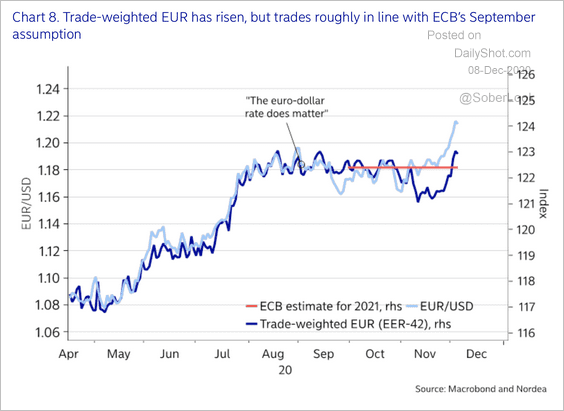 Source: Nordea Markets
——————–
5. The ECB’s (Eurosystem) balance sheet continues to climb.
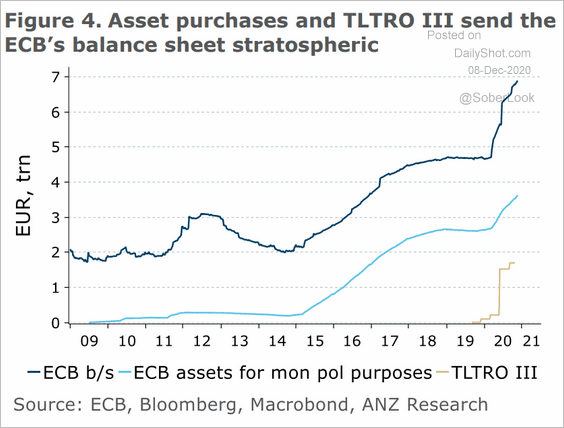 Source: ANZ Research
• Here is Germany’s share of the ECB’s QE programs (% of eligible securities).
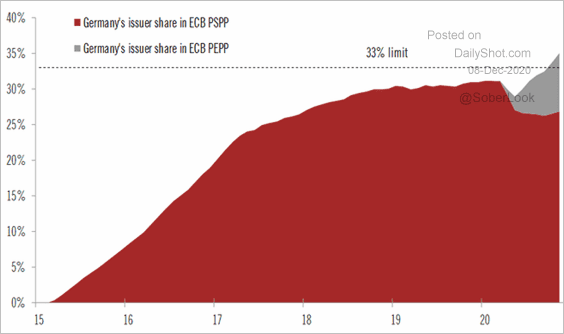 Source: @fwred
• Negative rates will be with us for some time.
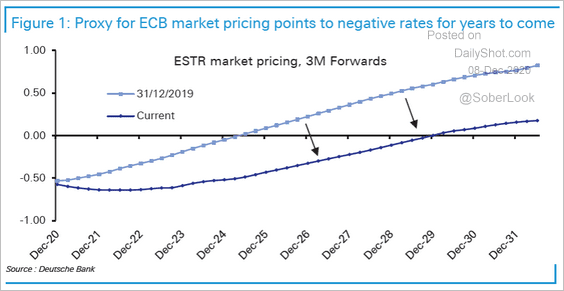 Source: Deutsche Bank Research
Europe
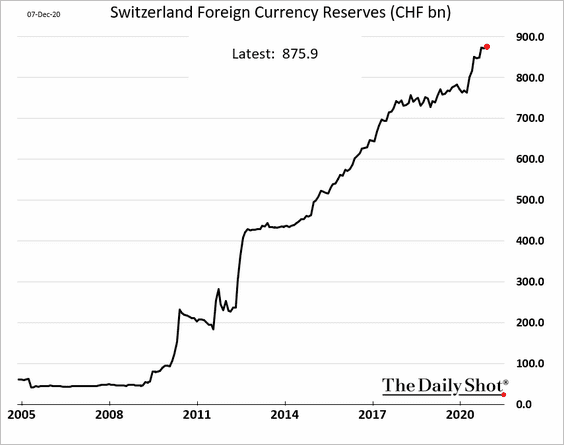
1. Swiss FX reserves continue to rise (now larger than the nation’s annual GDP).
Here is the composition (by currency and asset class).
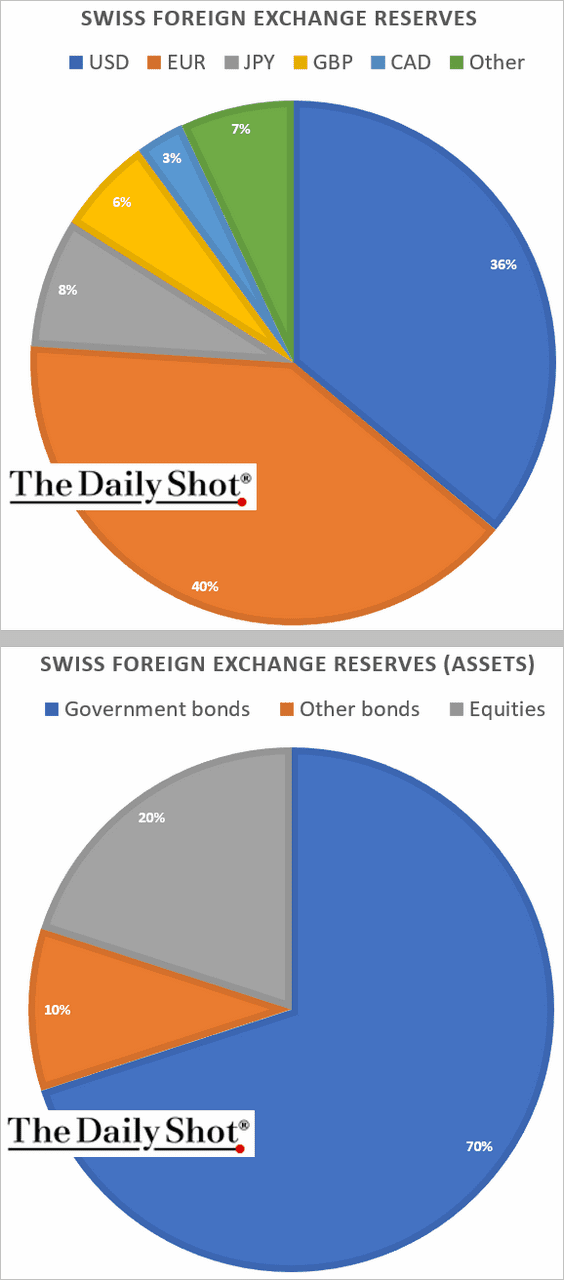
The euro has gained versus other major currencies except for the Swiss franc. Is the bottom in for EUR/CHF?
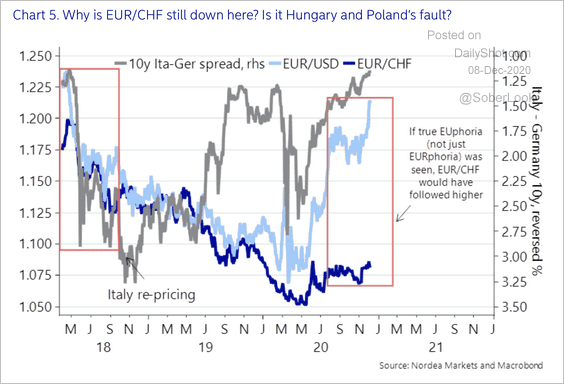 Source: Nordea Markets
——————–
2. Norway’s industrial production stalled in October.

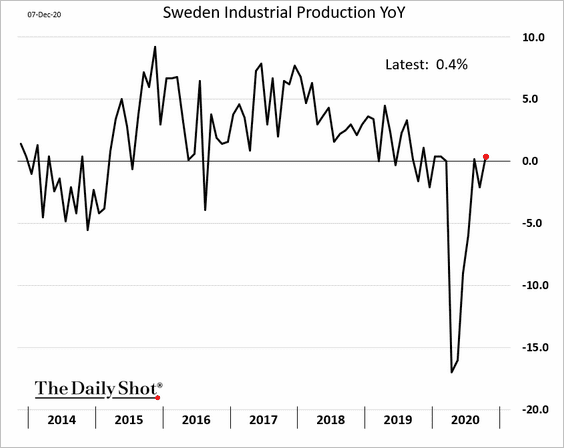
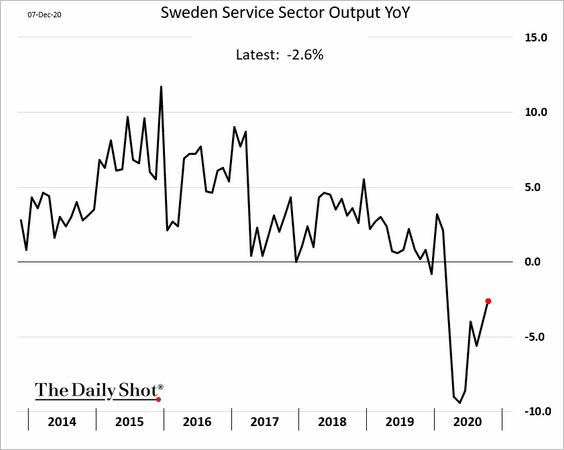
3. Sweden’s industrial output is back at last year’s levels.
Services will take longer to recover.
——————–
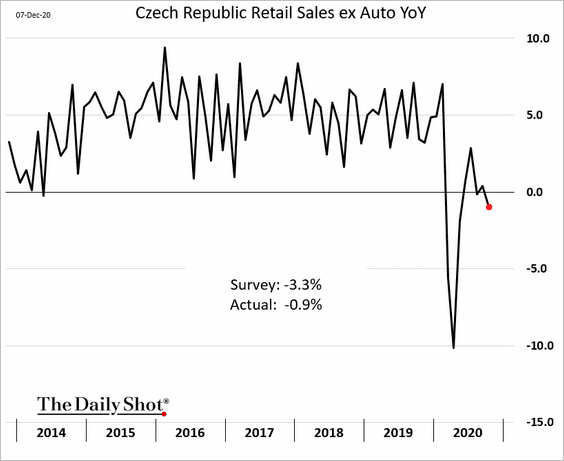
4. Czech retail sales have been more resilient than expected.
The United Kingdom
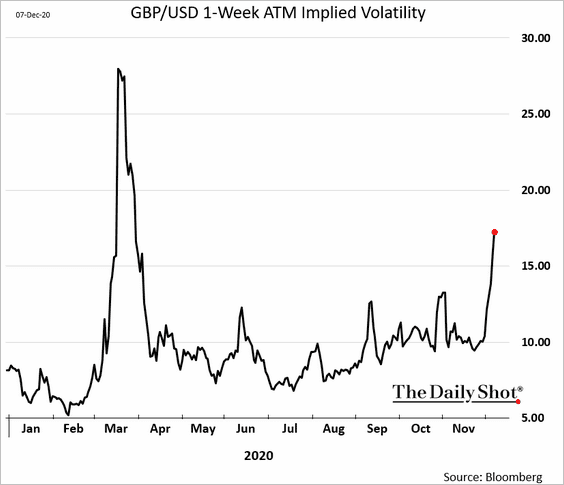
1. Options markets continue to show nervousness around Brexit negotiations.
• GBP/USD implied volatility:
• 1-week risk reversal:
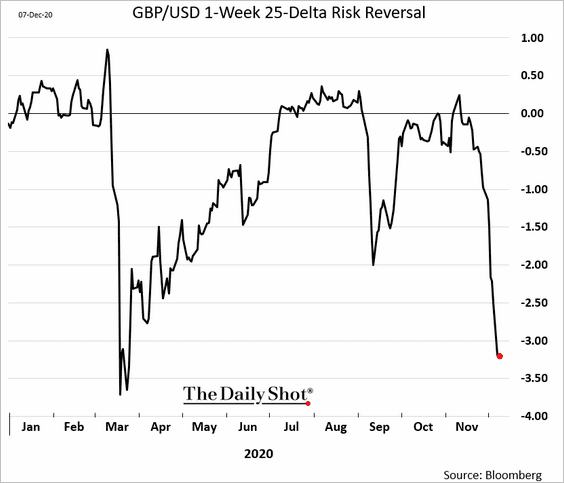
However, other markets don’t seem to be too concerned.
 Source: @tracyalloway
——————–
2. How do the House of Commons demographics compare to the broader population?
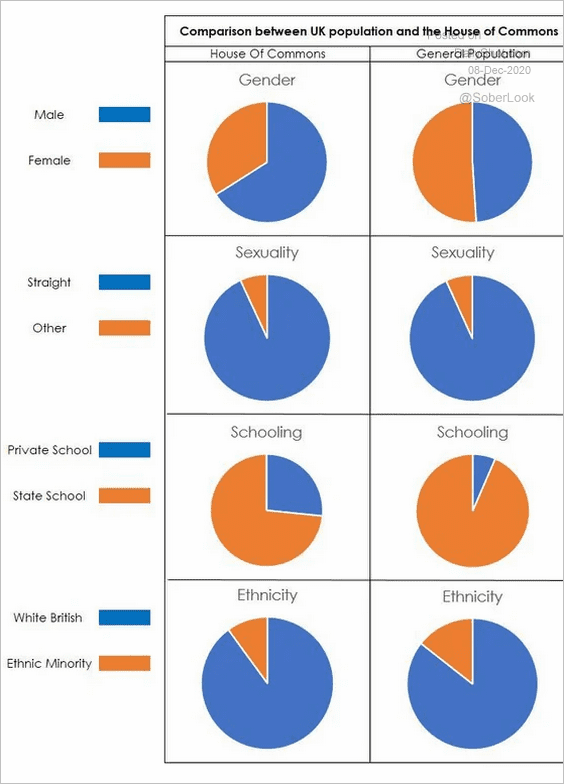 Source: Data Is Beautiful
The United States
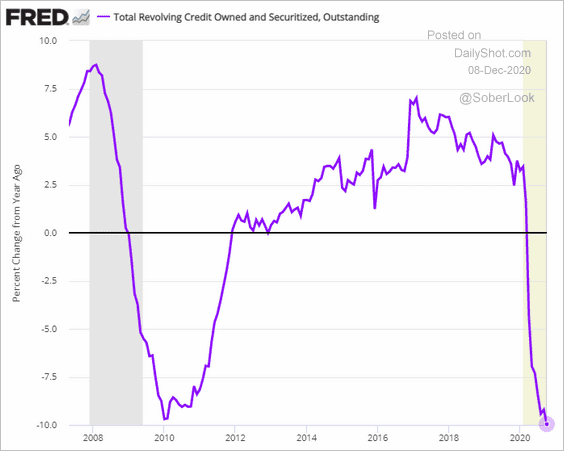
1. Consumer credit expansion has been weak since the start of the pandemic.
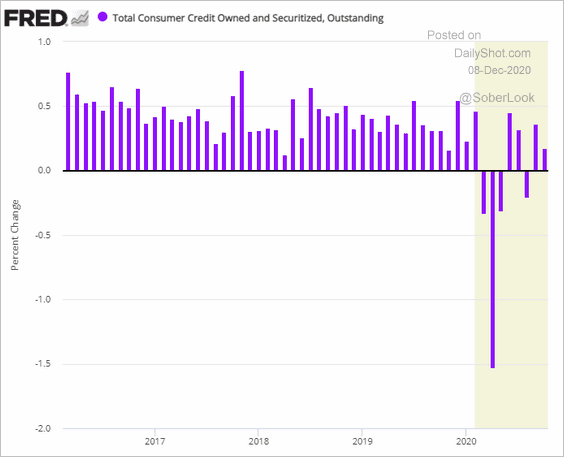
Credit card balances are down 10% from a year ago, a bigger decline than what we saw after the financial crisis.
——————–
2. Here is how different fiscal stimulus scenarios may impact the unemployment rate.
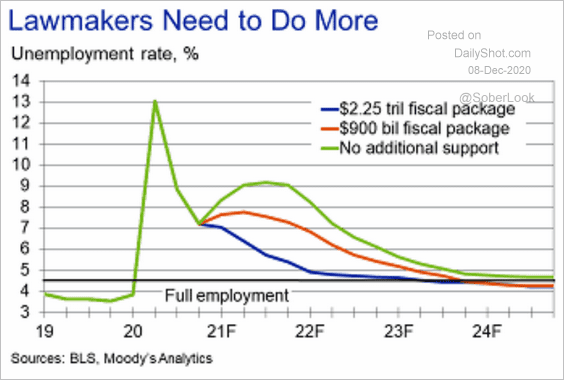 Source: Moody’s Analytics
3. Below is a look at federal debt and real interest payment projections based on tax cuts and social security reforms (“baseline” is from CBO projections).
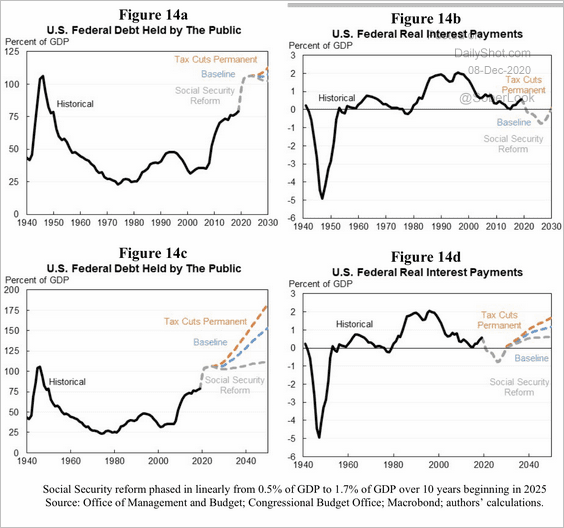 Source: Brookings Read full article
Global Developments
1. Will the dollar hold near-term support?
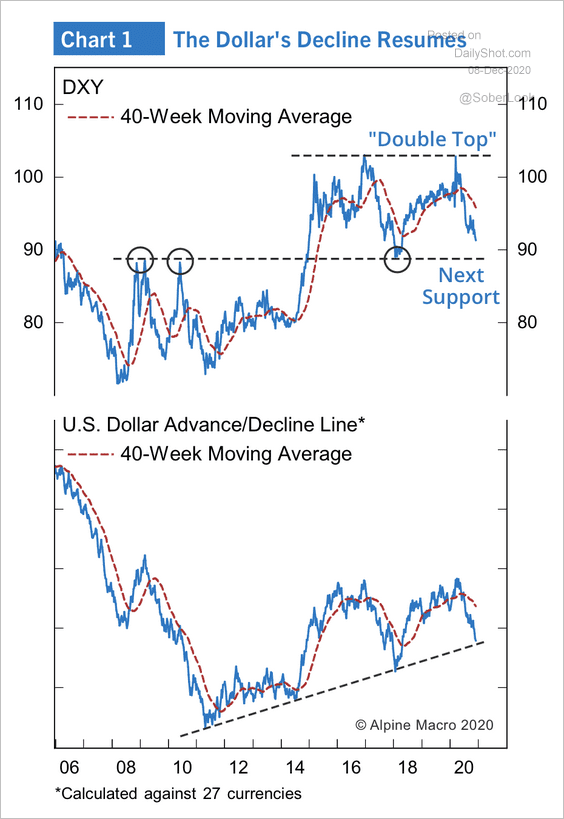 Source: Alpine Macro
2. This chart shows global fund flows since the start of 2019.
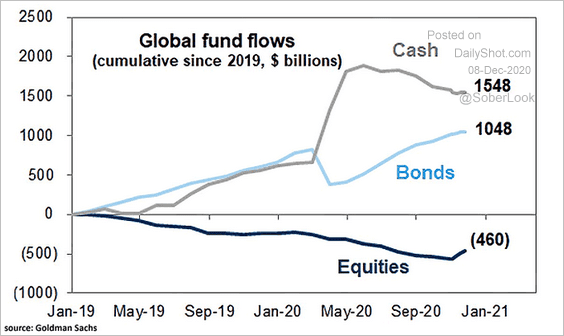 Source: @ISABELNET_SA, @GoldmanSachs
3. Global mobility trends are deteriorating.
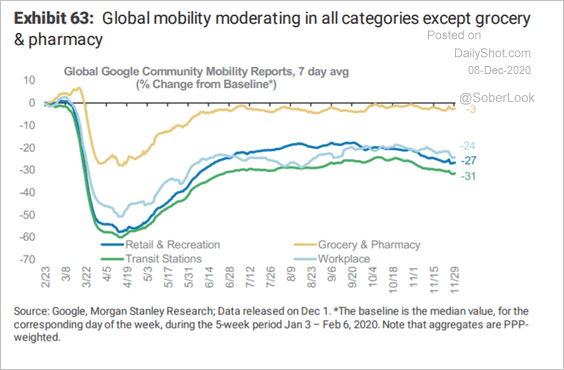 Source: Morgan Stanley Research
4. Industrial momentum has been strong.
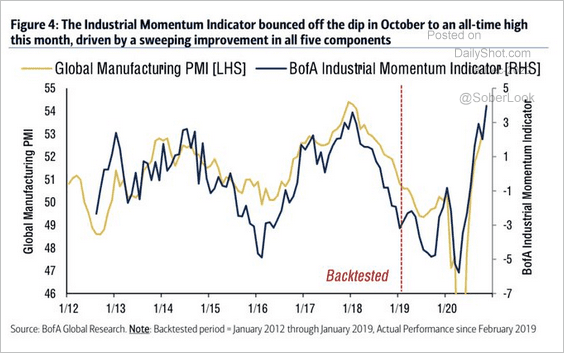 Source: BofA Global Research, @WallStJesus
5. What will central banks do in 2021?
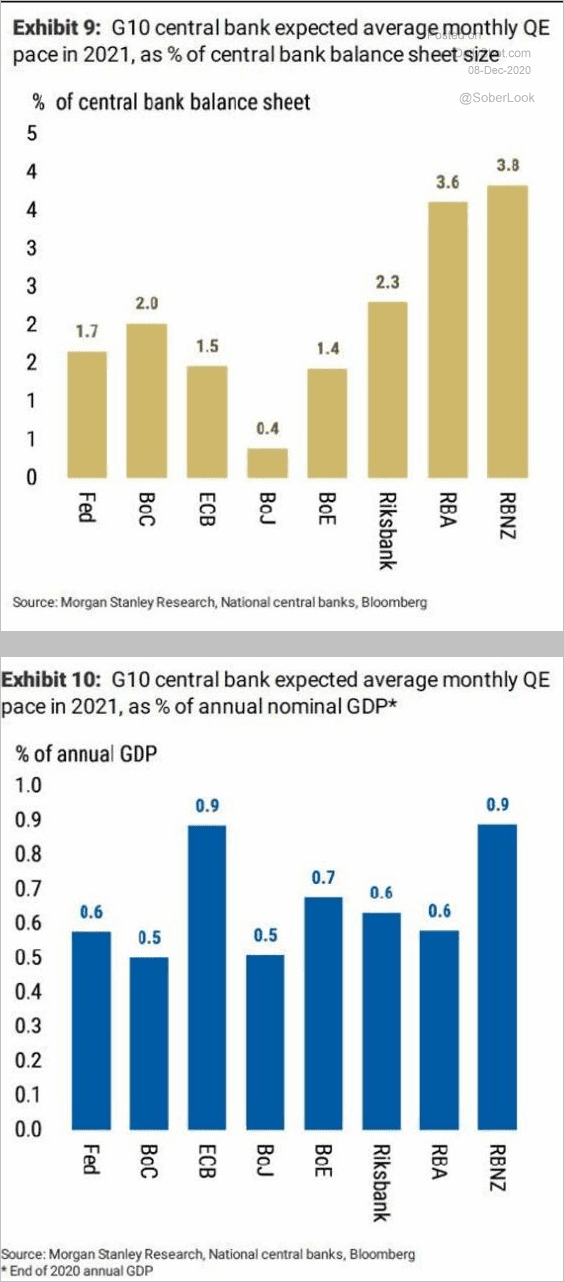 Source: Morgan Stanley Research, @jsblokland
——————–
Food for Thought
1. Layoffs and working from home prompted many Americans to start a business.
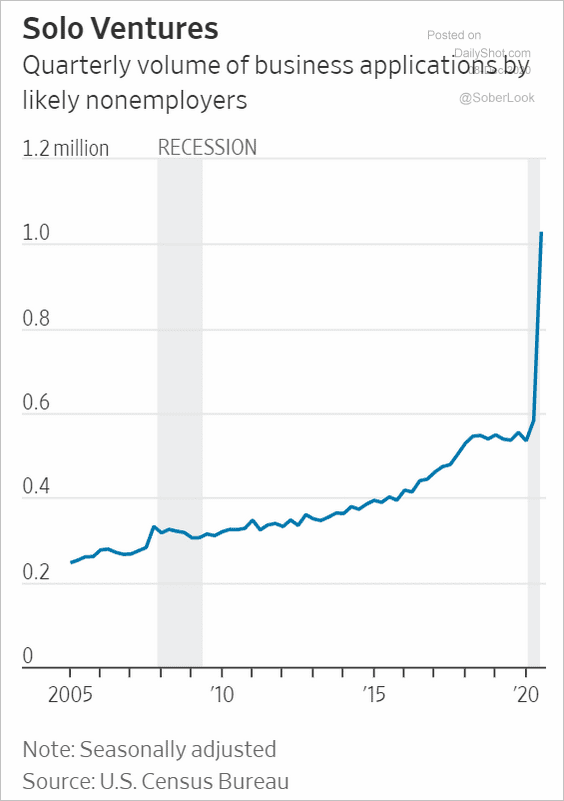 Source: @WSJ Read full article
2. Income growth of the bottom 50% of the population:
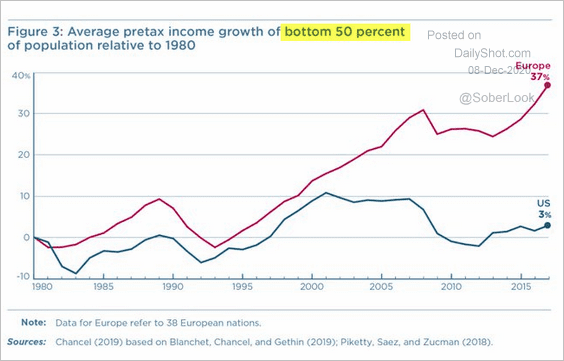 Source: @adam_tooze, @PIIE, @lucas_chancel Read full article
3. Population projections for China and India:
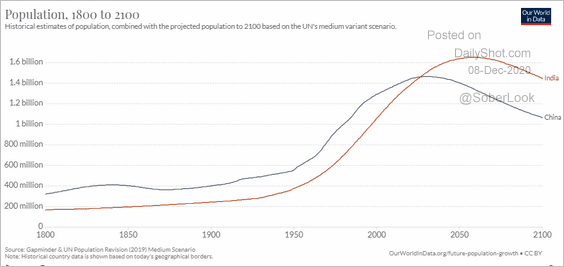 Source: Visual Capitalist Read full article
4. Employment at US colleges:
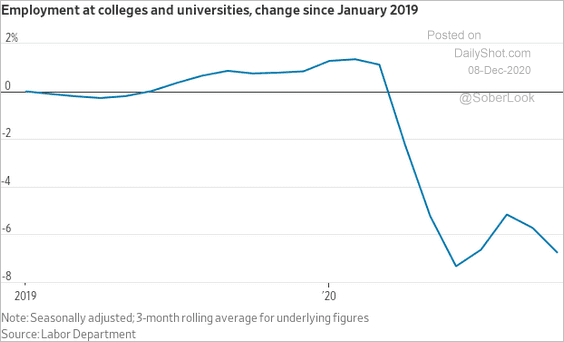 Source: @WSJ Read full article
5. Students falling behind in math during the pandemic:
 Source: @financialtimes Read full article
6. Vaccine efficacy rates:
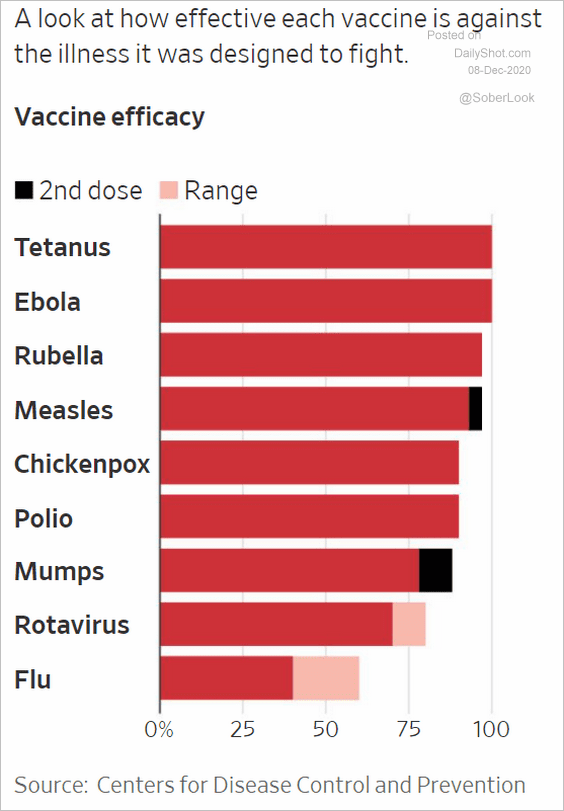 Source: @WSJ Read full article
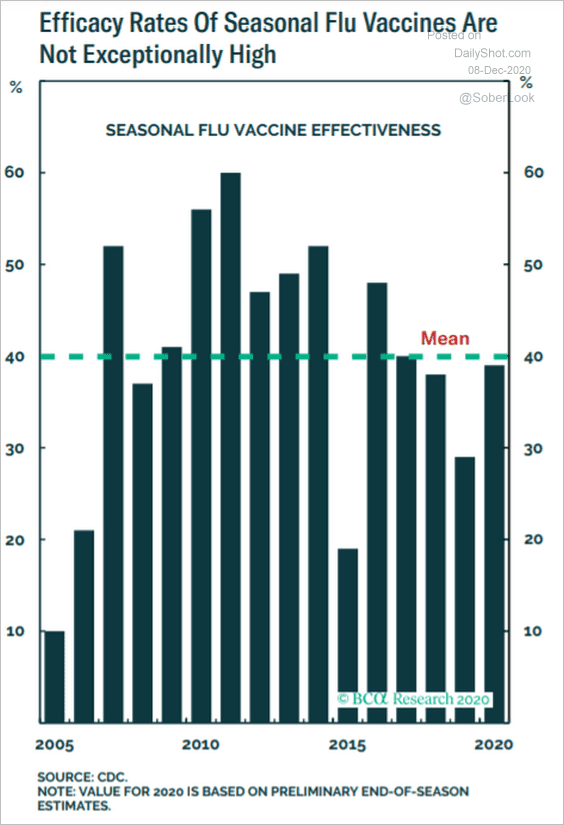 Source: BCA Research
——————–
7. How mRNA vaccines work:
 Source: @financialtimes Read full article
8. US government shutdowns:
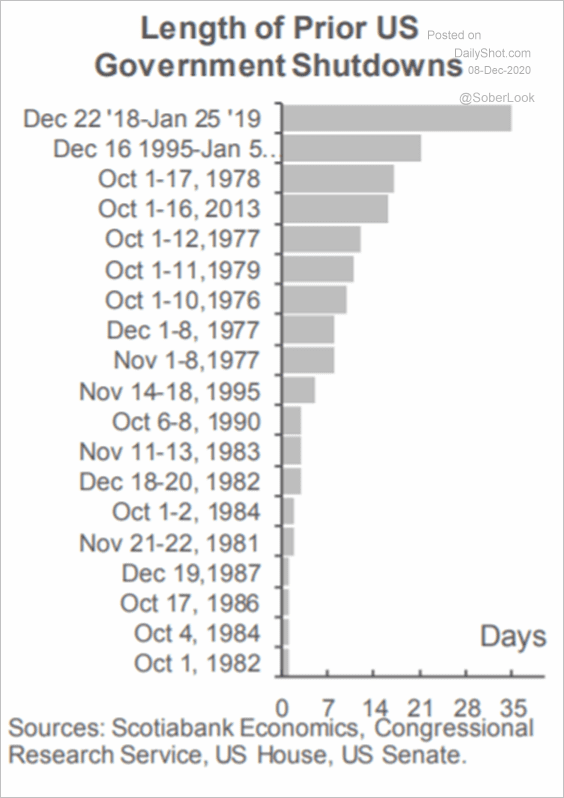 Source: Scotiabank Economics
9. Perception of crime:
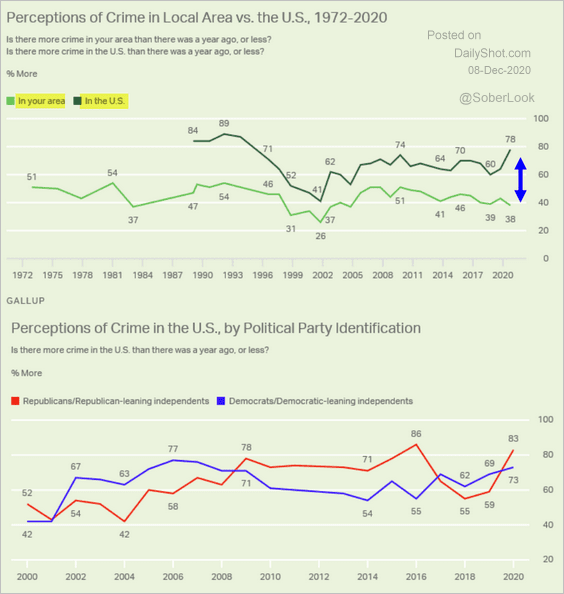 Source: Gallup Read full article
10. McDonald’s around the world:
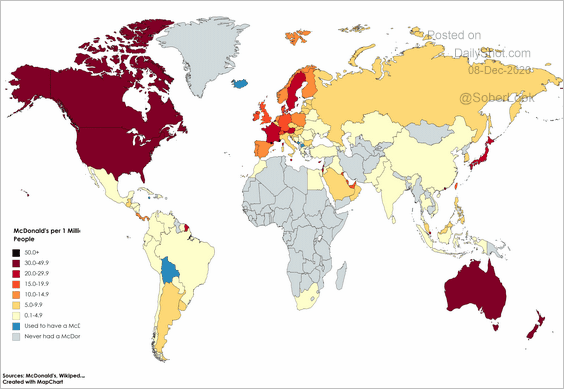 Source: @DataIsBeautiful
——————–