
The Daily Shot: 11-Jan-21
• The United States
• Canada
• The United Kingdom
• The Eurozone
• Europe
• Japan
• Asia – Pacific
• China
• Emerging Markets
• Cryptocurrency
• Commodities
• Energy
• Equities
• Credit
• Rates
• Global Developments
• Food for Thought
The United States
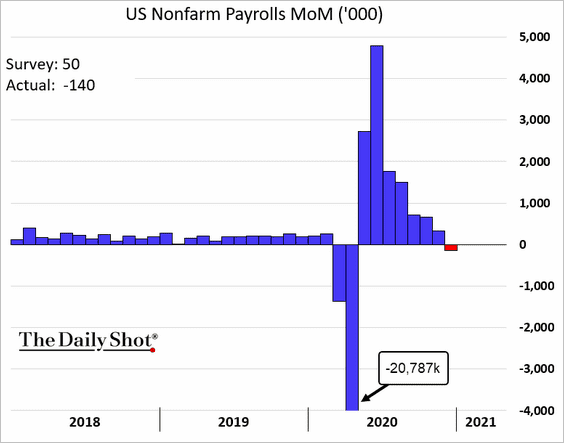
1. The December employment report was substantially stronger than the headline figures would suggest. While the US lost 140k payrolls last month, there was also an upward revision of 135k jobs for October and November.
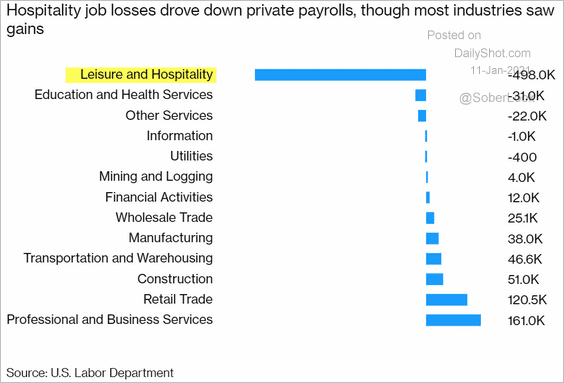
• Most of the losses were in leisure and hospitality.
 Source: @markets Read full article
– The bottom panel charts show the impact of the pandemic’s second wave.
 Source: @bbgvisualdata Read full article
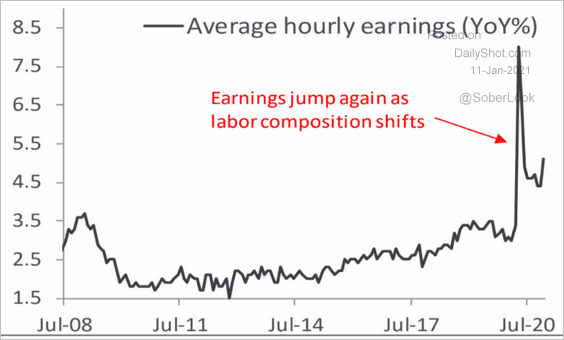
– The layoffs in low-wage sectors changed the labor force’s composition, boosting the average wage.
 Source: Piper Sandler
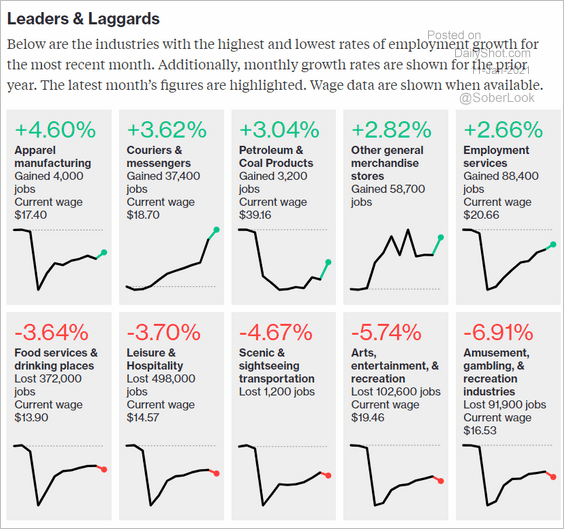
– Sectors with higher wages continued to recover.
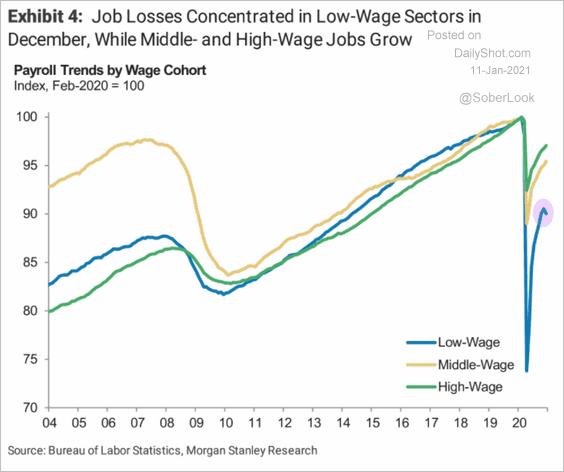 Source: Morgan Stanley Research
• This chart shows the employment trajectory compared to the 2008 recession.
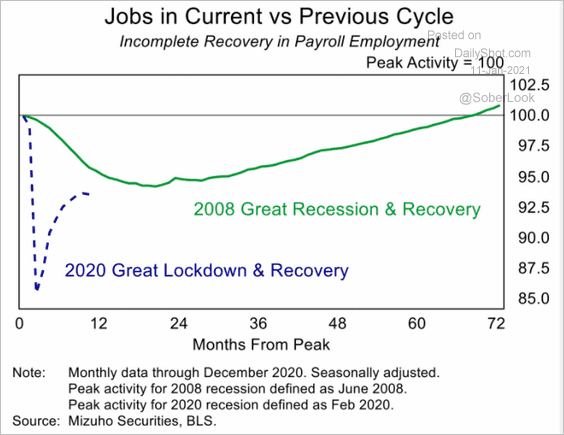 Source: Mizuho Securities USA
• How many workers have been impacted by the pandemic?
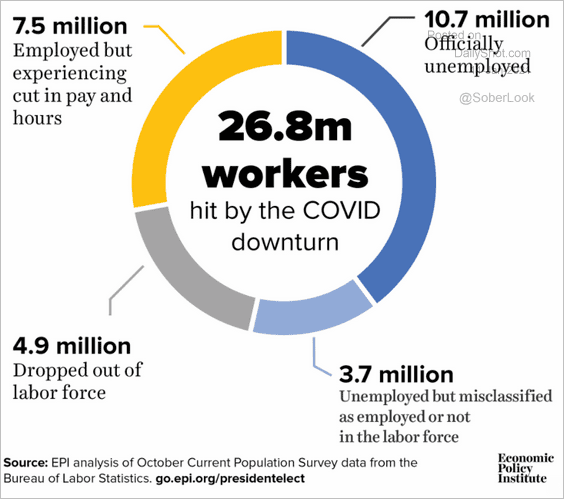 Source: @EconomicPolicy Read full article
• When will we see employment return to pre-crisis levels? Here is a forecast from Oxford Economics.
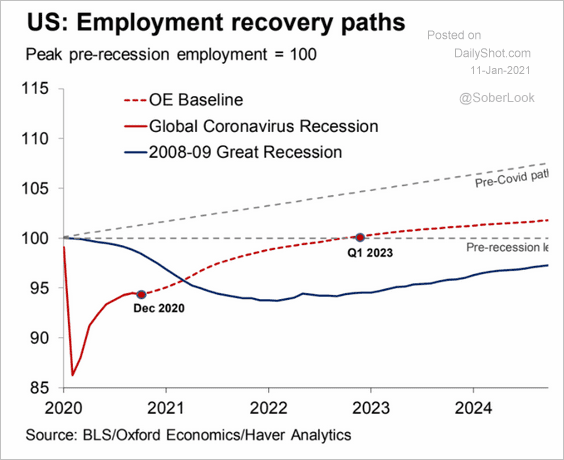 Source: Oxford Economics
And this is a forecast from Deutsche Bank.
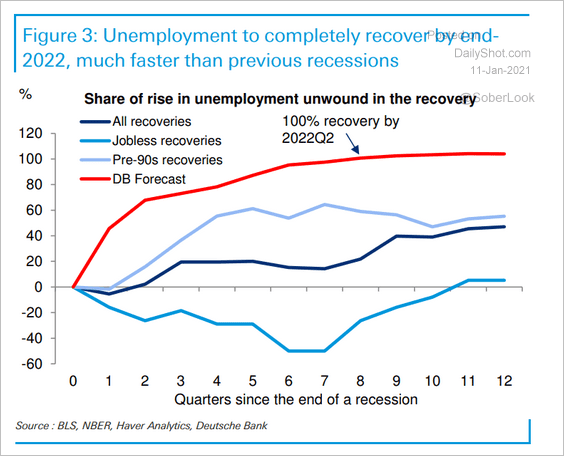 Source: Deutsche Bank Research
• The job market recovery is lagging the GDP.
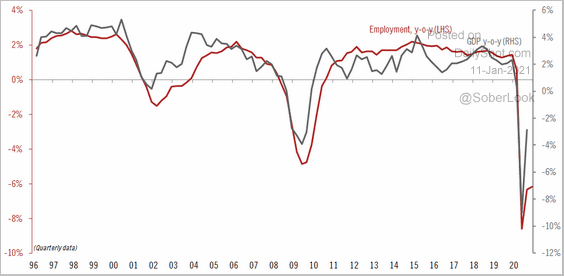 Source: @TCosterg
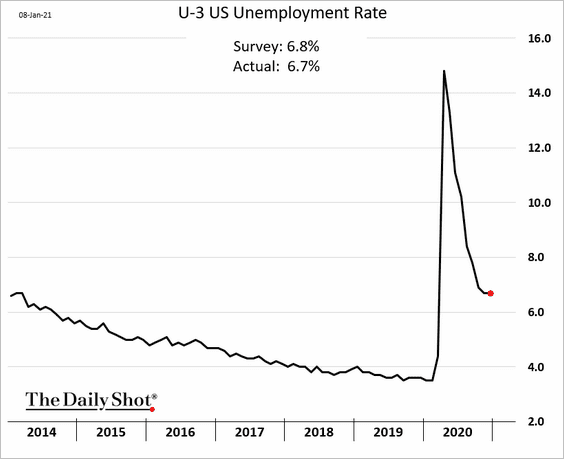
• The unemployment rate held steady (economists were expecting an increase).
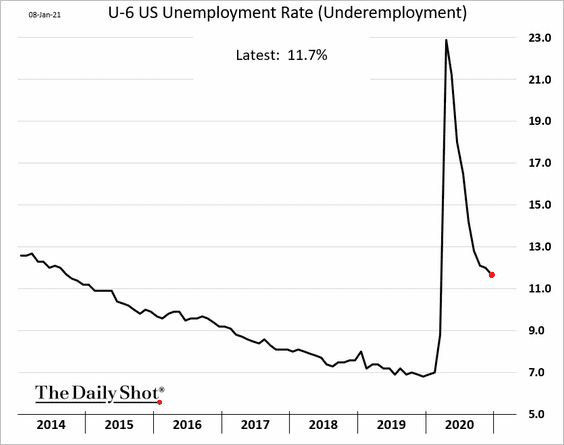
The underemployment rate continued to decline.
Here are the contributions to unemployment (New E = new employed, LF Exit = leaving the labor force, New U = newly unemployed, LF Enter = entering the labor force.)
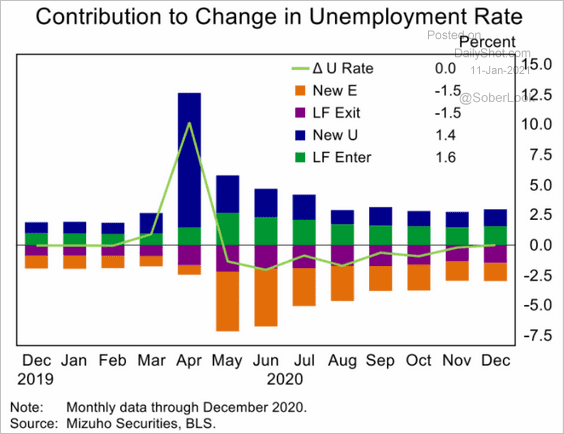 Source: Mizuho Securities USA
• The participation rate held steady.
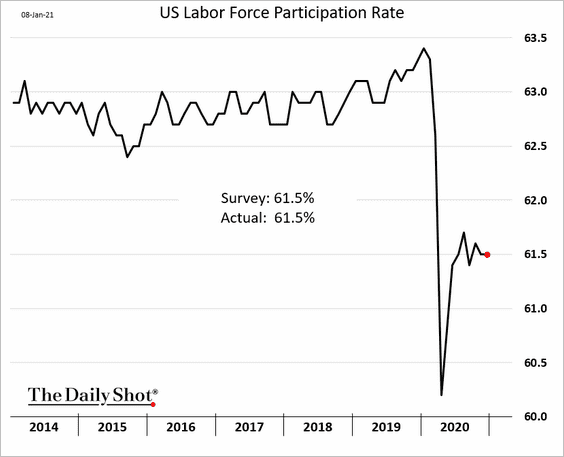
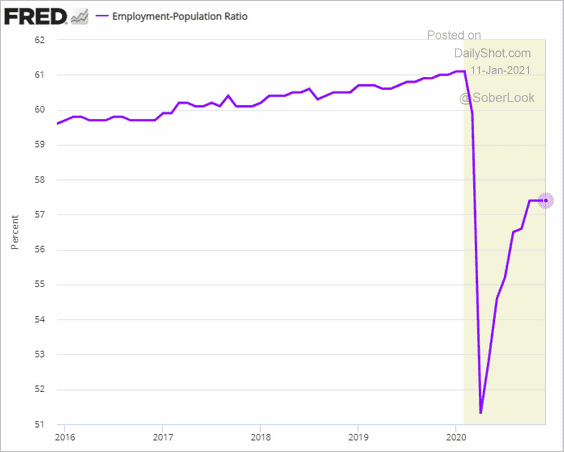
And so did the employment-to-population ratio.
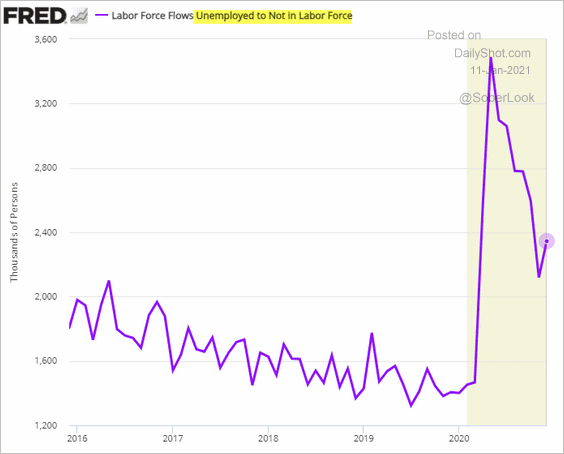
There was an increase in the number of workers leaving the labor force.
• One troubling trend in the labor market has been small-business employment.
– Homebase small business employment index:
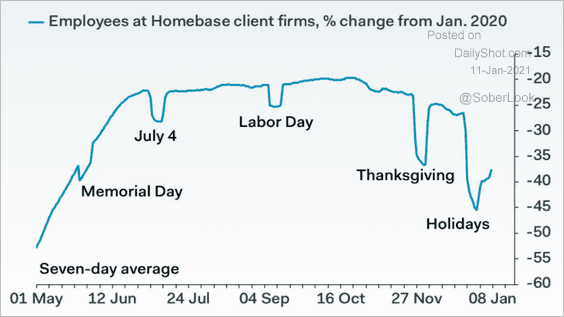 Source: Pantheon Macroeconomics
• Paychex/IHS Markit Small Business Employment Watch:
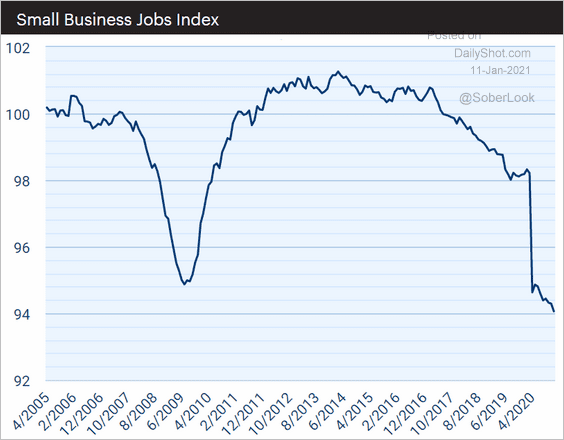 Source: Paychex | IHS Markit Small Business Employment Watch
——————–
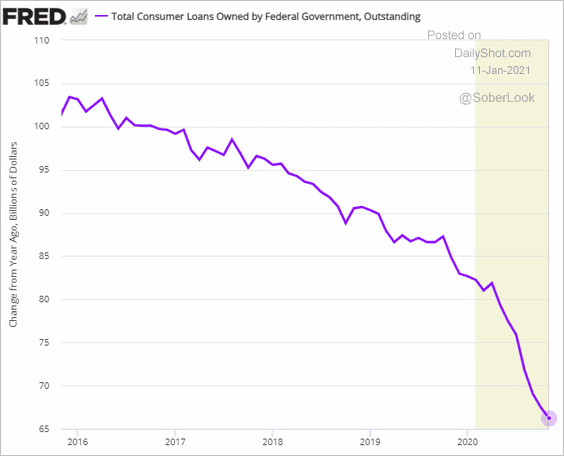
2. Revolving consumer credit (credit cards) continues to shrink.
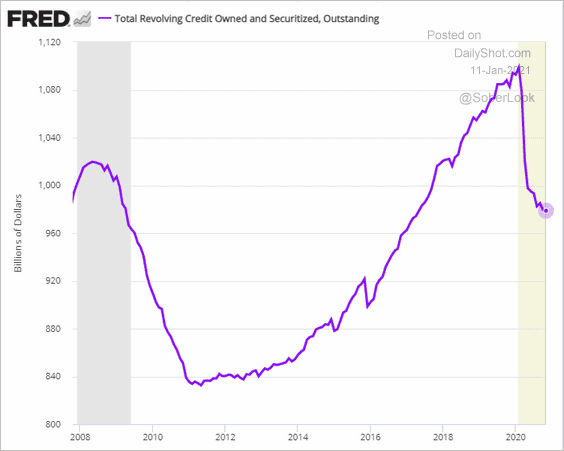
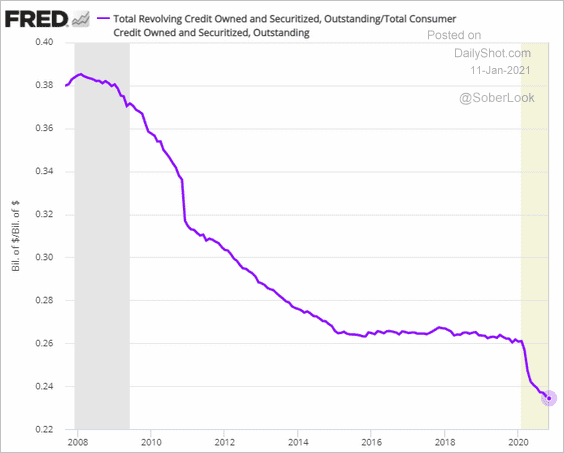
Here is revolving credit as a share of total consumer credit.
Growth in student loan balances has been slowing.
——————–
3. The US remains over-retailed compared to other countries.
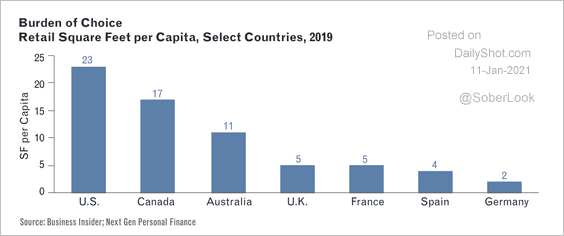 Source: Park Madison Partners
Department store retail sales have declined since the financial crisis.
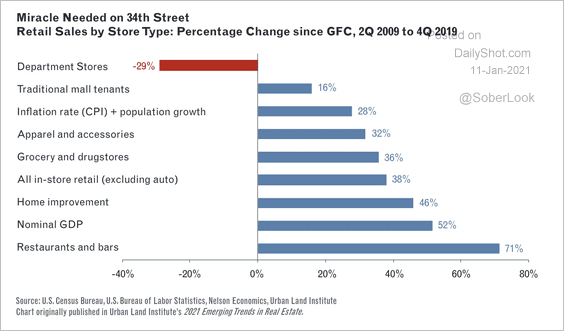 Source: Park Madison Partners
——————–
4. The COVID situation remains worrisome.
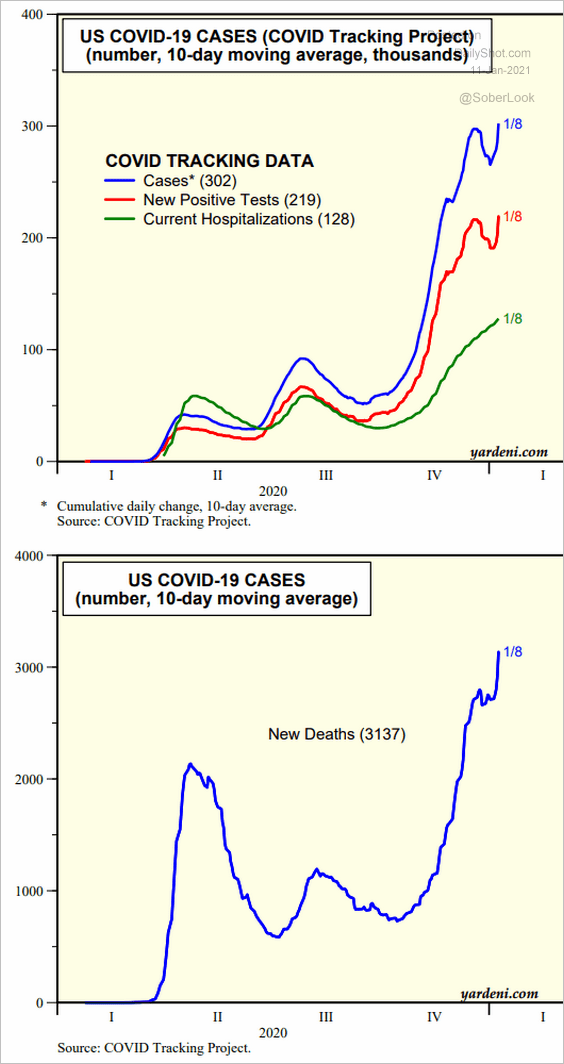 Source: Yardeni Research
Back to Index
Canada
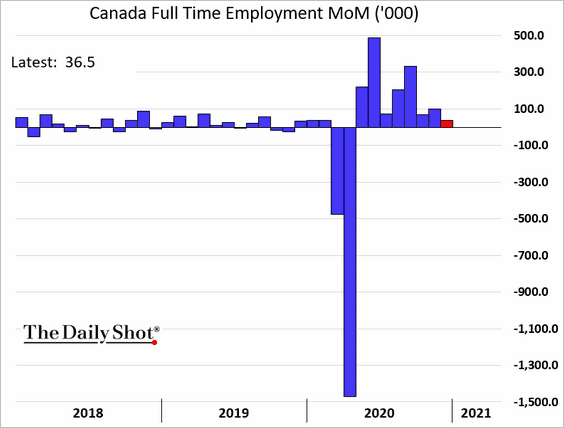
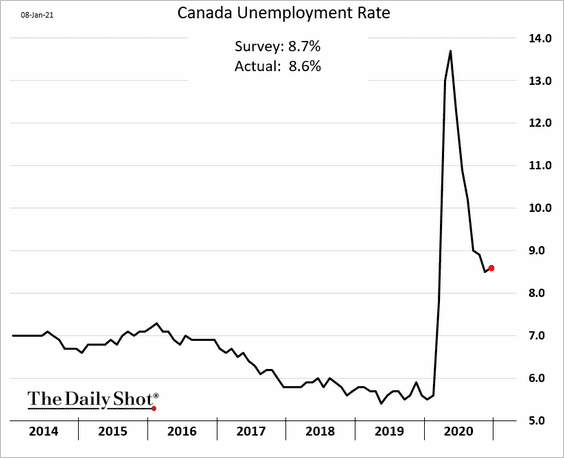
1. December job losses were higher than expected.
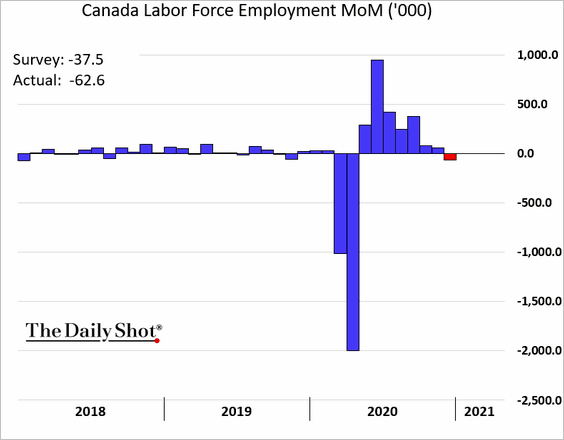
However, the layoffs were mostly in part-time positions.
• Just like in the US, the biggest job losses were in sectors most impacted by the latest pandemic wave.
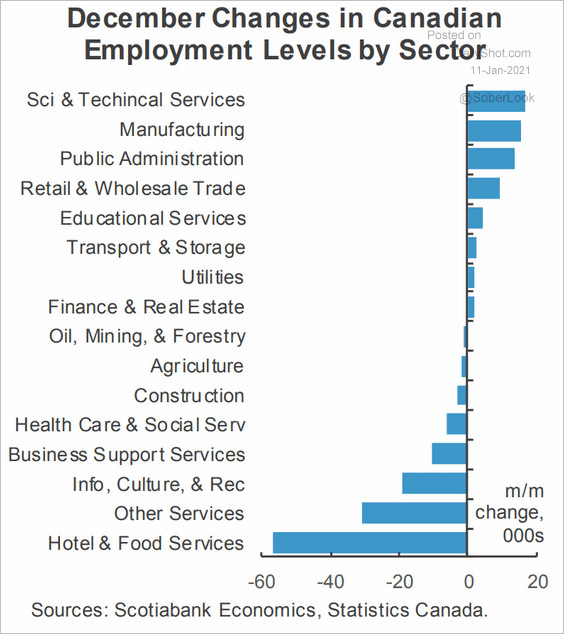 Source: Scotiabank Economics
• Here is the employment trajectory.
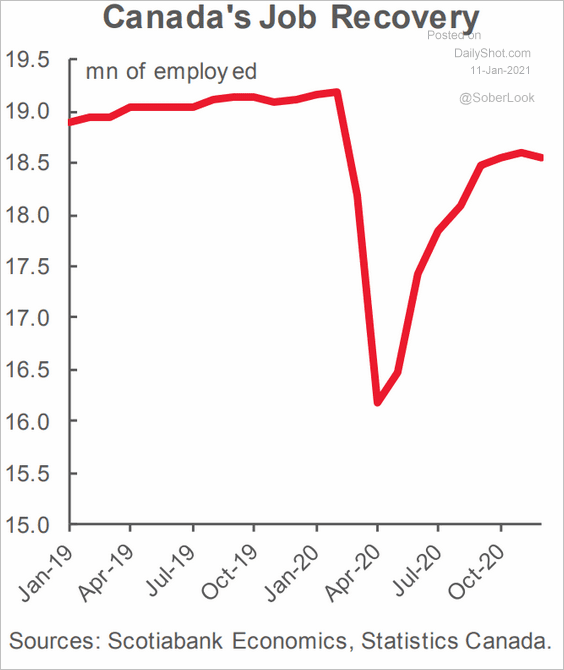 Source: Scotiabank Economics
• The unemployment rate ticked higher.
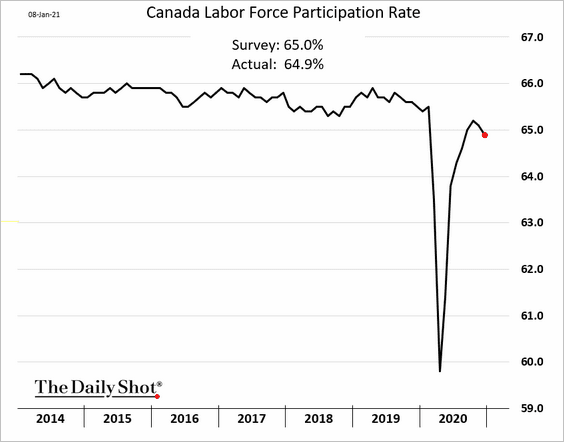
The participation rate declined.
——————–
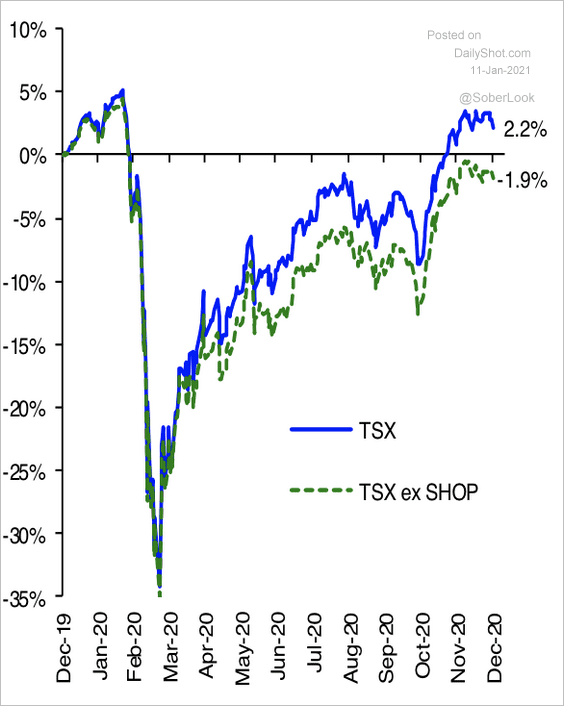
2. Without Shopify, the TSX would have ended last year down 1.9%.
 Source: Hugo Ste-Marie, Portfolio & Quantitative Strategy Global Equity Research, Scotia Capital
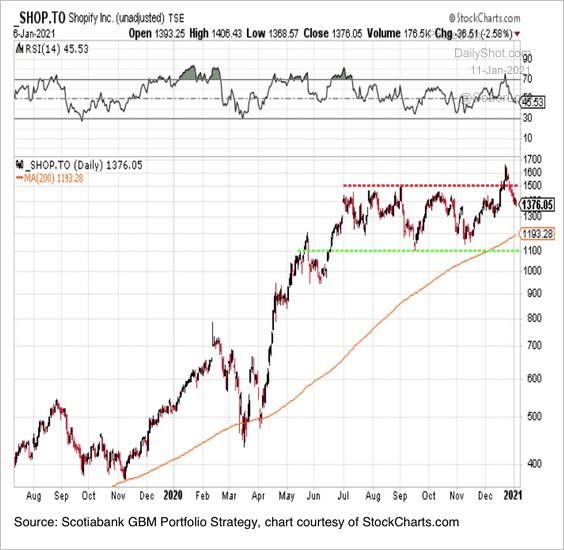
By the way, Shopify has been trading sideways over the past few months.
 Source: Hugo Ste-Marie, Portfolio & Quantitative Strategy Global Equity Research, Scotia Capital
——————–
3. The increase in Canada’s dependency ratio is expected to outpace most developed economies (Canada is aging quickly).
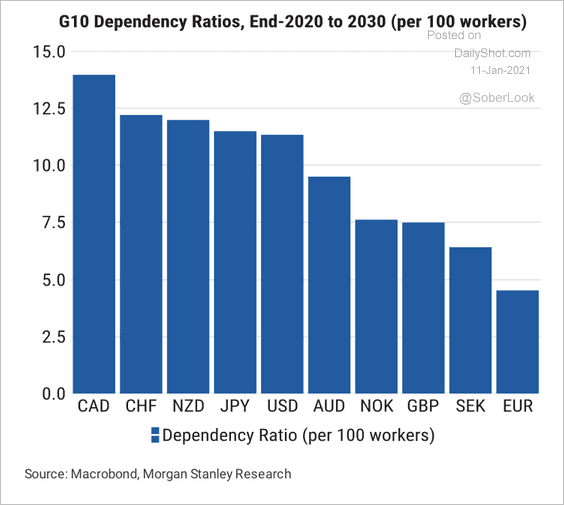 Source: Morgan Stanley Research
The government forecasts the highest immigration target on record (to mitigate the trend above).
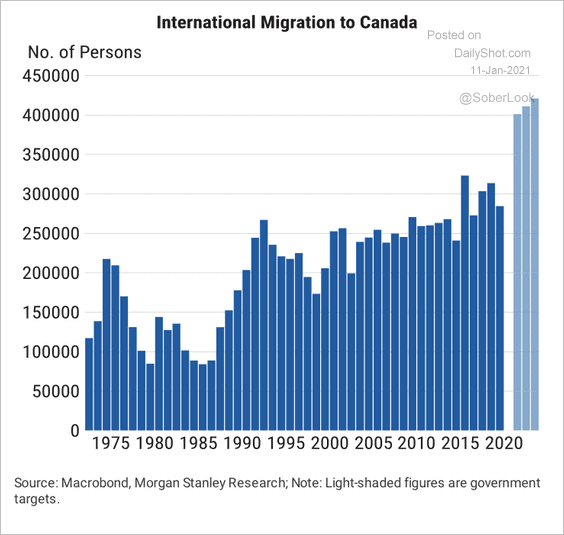 Source: Morgan Stanley Research
Back to Index
The United Kingdom
1. The markets see a 50/50 chance of negative rates by August.
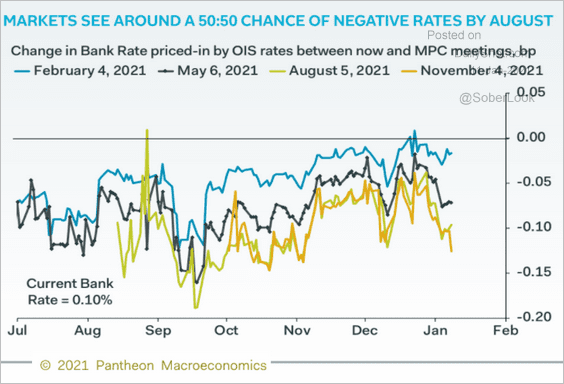 Source: Pantheon Macroeconomics
2. UK stocks are significantly undervalued vs. the rest of Europe and the US.
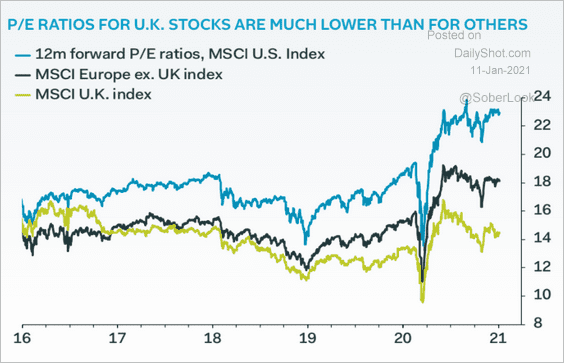 Source: Pantheon Macroeconomics
3. UK hospitals are stretched (3 charts).
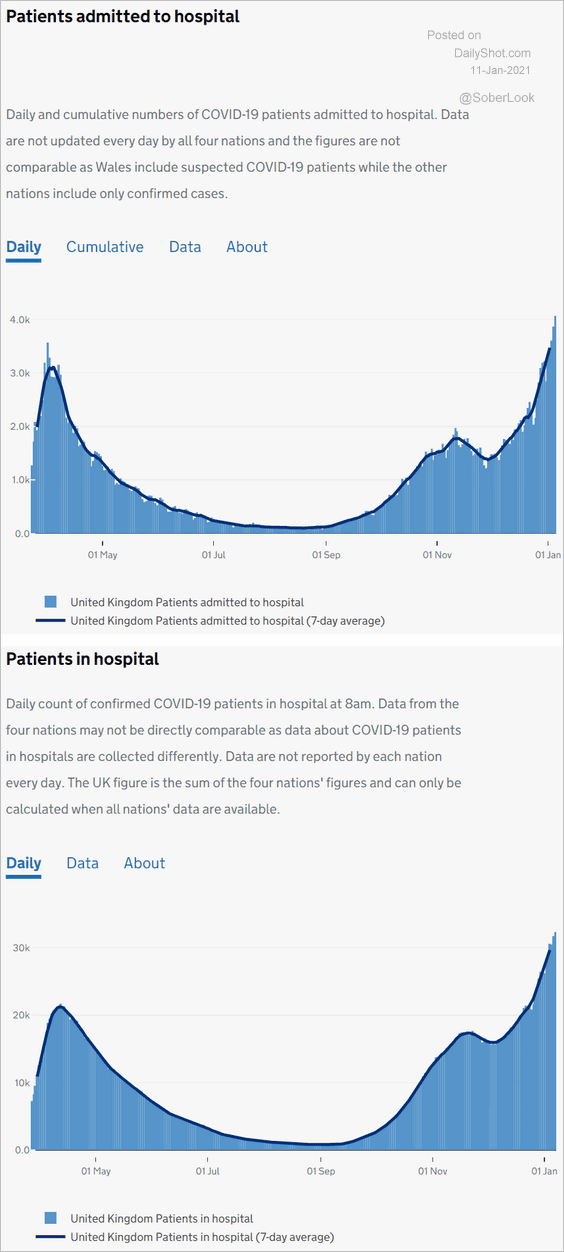 Source: Public Health England and NHSX
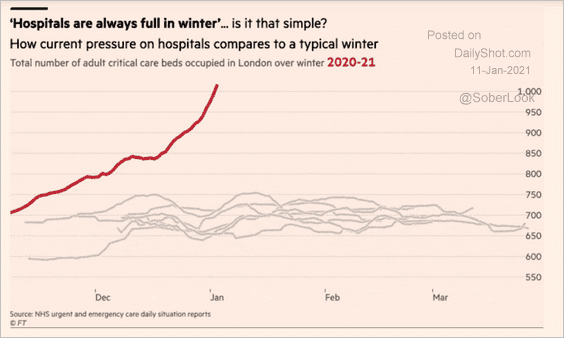 Source: @financialtimes Read full article
Back to Index
The Eurozone
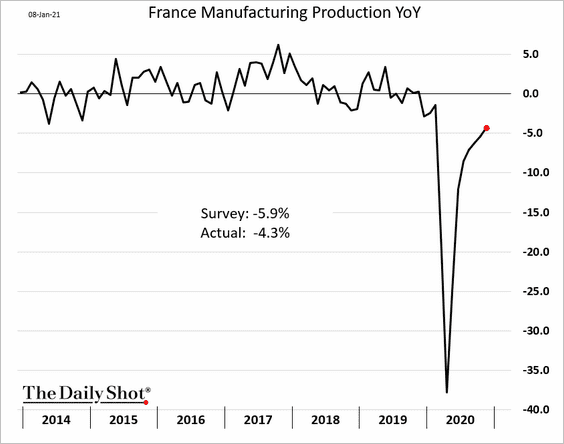
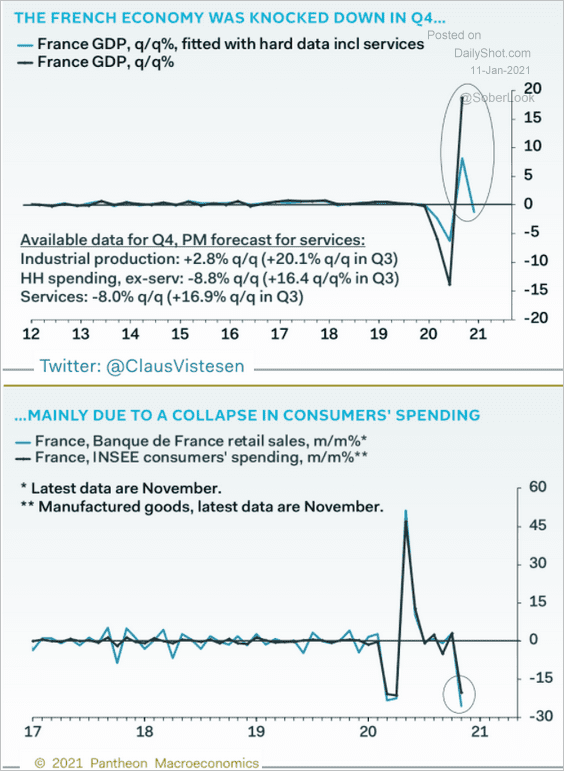
1. Let’s begin with France.
• Industrial production continues to recover.
• Household consumption took a hit in November.
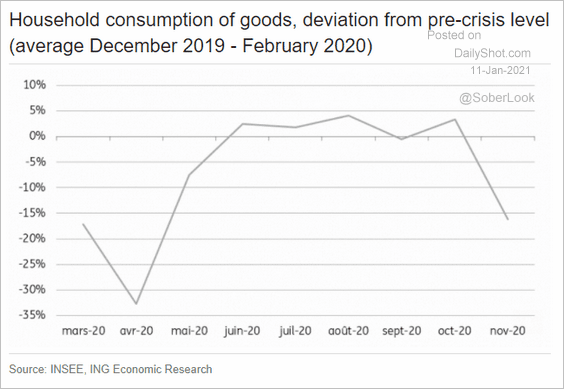 Source: ING
 Source: Pantheon Macroeconomics
——————–
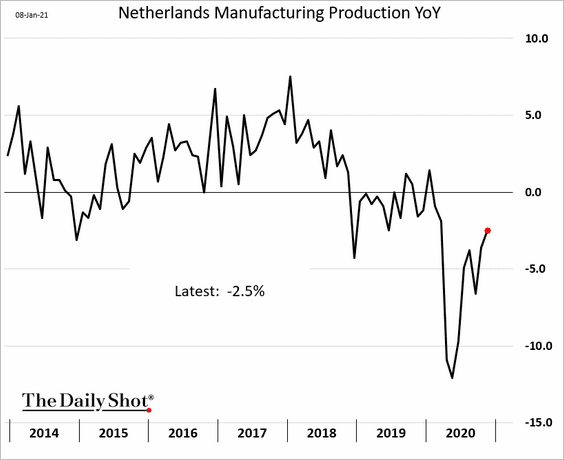
2. The Netherlands’ factory output is rebounding.
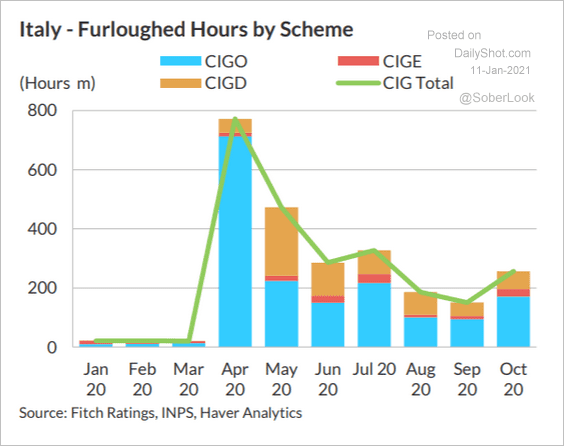
3. This chart shows Italy’s furloughed workers (by program).
 Source: Fitch Ratings
4. The Eurozone unemployment rate was lower than expected in November.
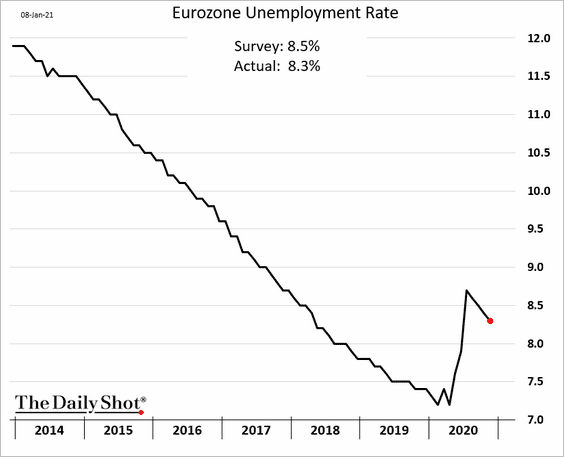
However, youth unemployment worsened.
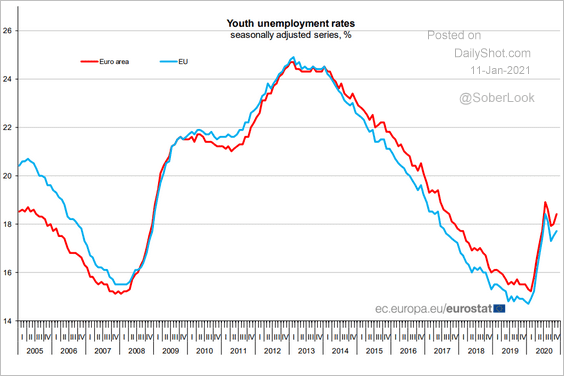 Source: Eurostat Read full article
Back to Index
Europe
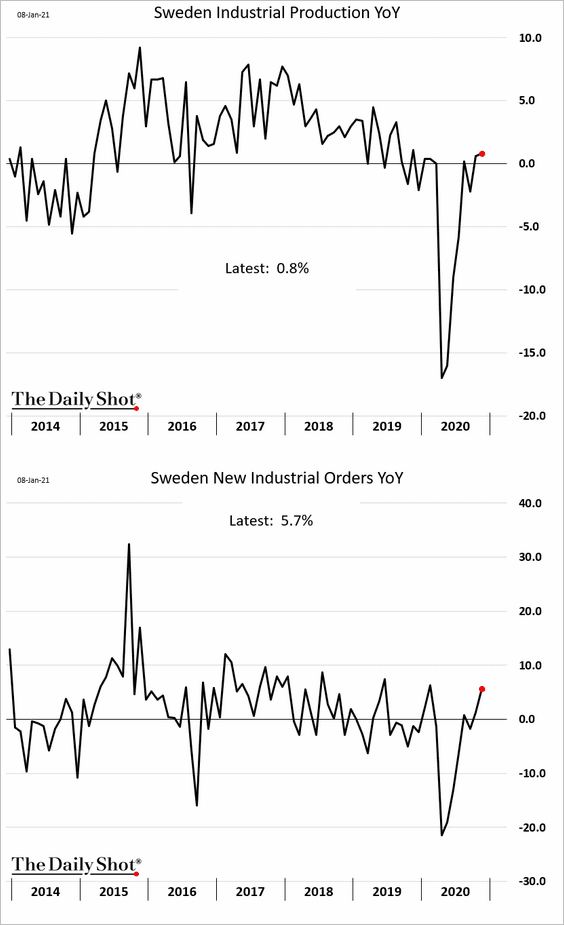
1. Sweden’s industrial activity has fully recovered, with new orders rising sharply in November.
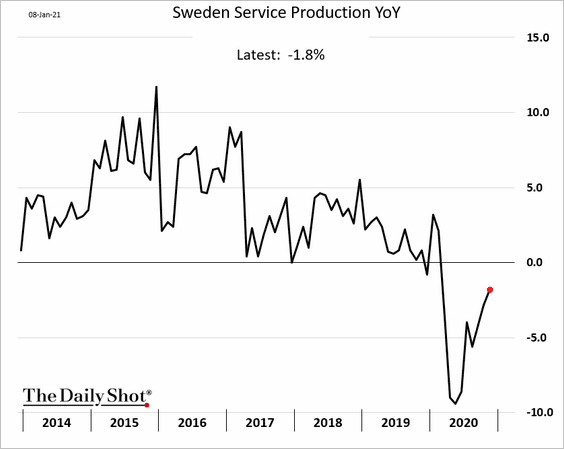
Service-sector output continues to rebound.
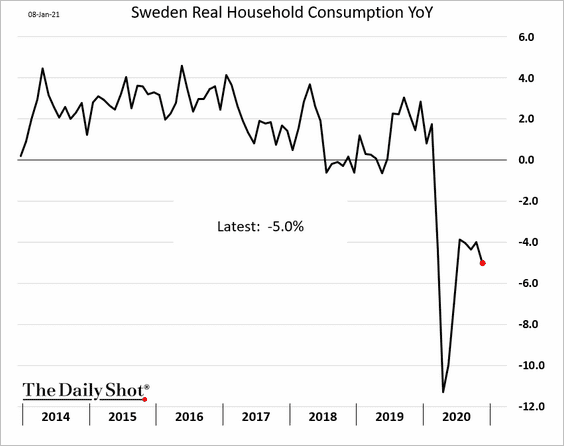
However, consumption deteriorated in November.
——————–
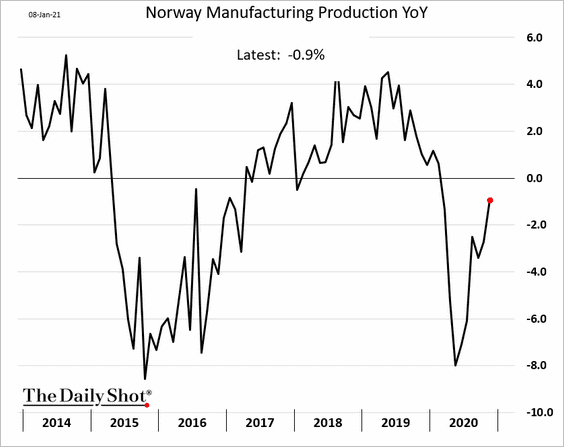
2. Norway’s industrial production has not yet fully recovered.
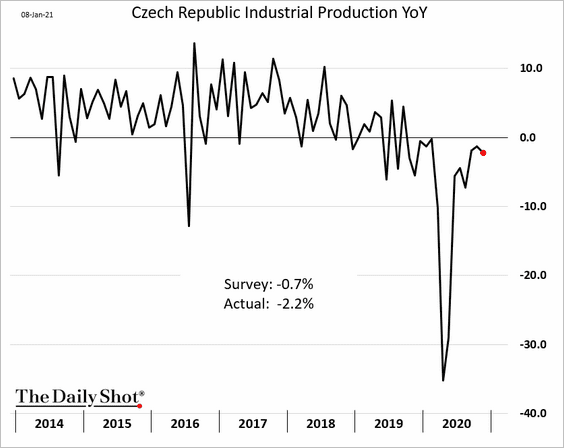
3. Industrial output in the Czech Republic deteriorated in November.
Back to Index
Japan
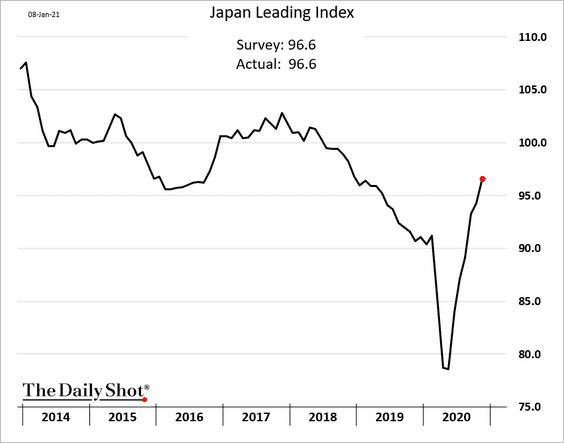
1. The leading index is improving.
2. The stock market rally accelerated last week.
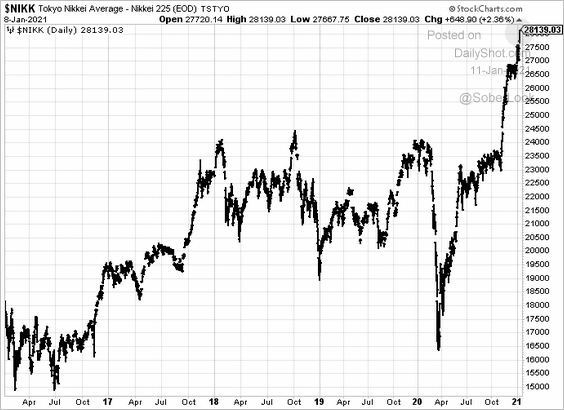
There is a divergence between the stock market and USD/JPY.
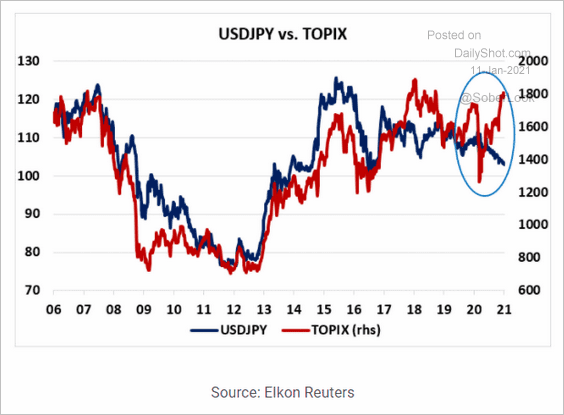 Source: Rothko Research
——————–
3. Hospitals in some areas are under strain.
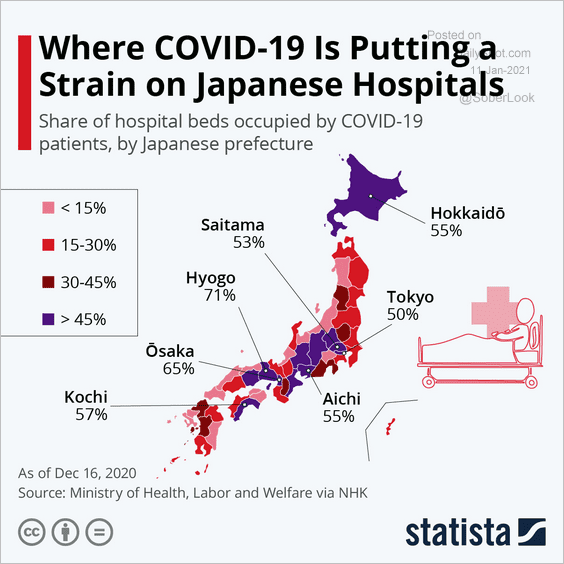 Source: Statista
Back to Index
Asia – Pacific
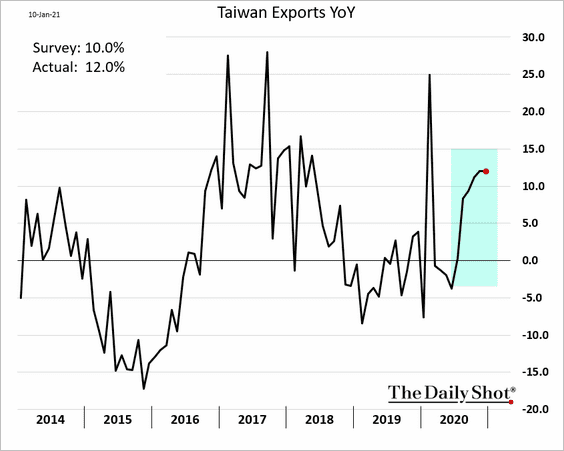
1. Taiwan’s exports remain robust.
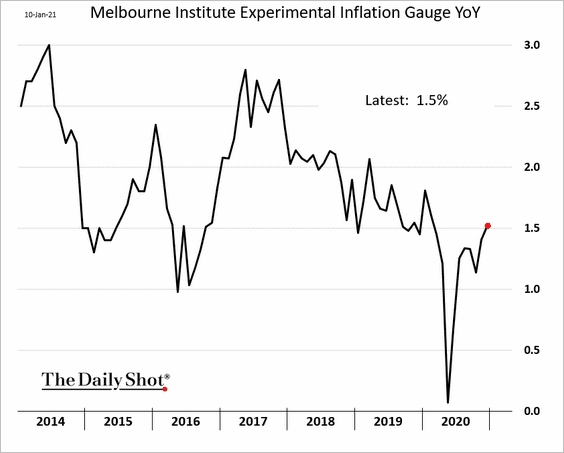
2. Below are some updates on Australia.
• The Melbourne Institute inflation index:
• Retail sales (second-highest year-over-year growth in 31 years, according to ANZ):
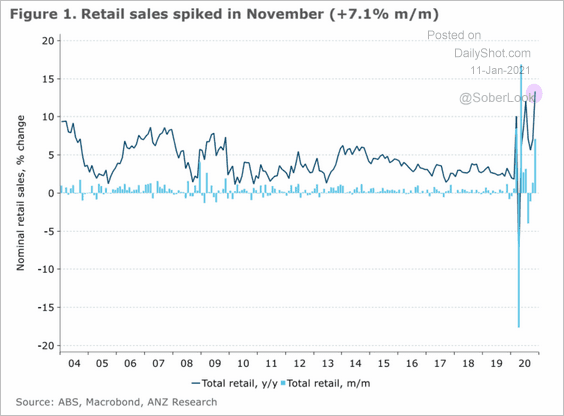 Source: ANZ Research
• RBA’s net securities purchases:
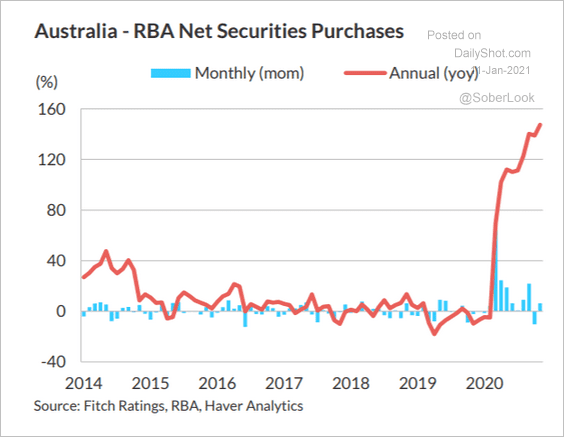 Source: Fitch Ratings
——————–
China
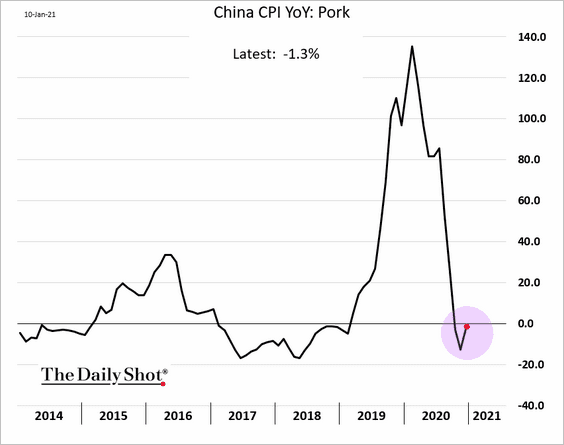
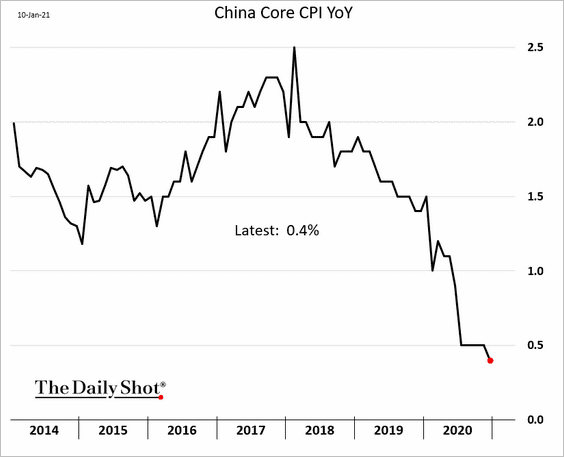
1. The CPI was a bit higher than expected, boosted by stabilization in pork prices (2nd chart).
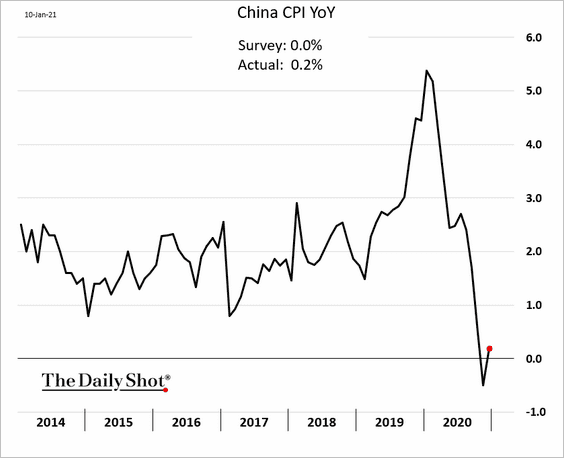
The core CPI remains soft.
——————–
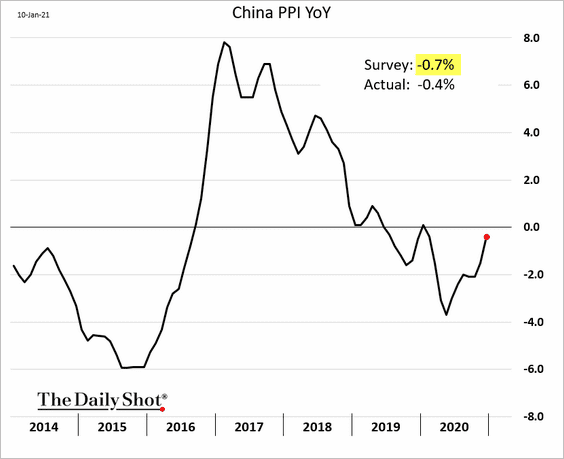
2. The PPI is recovering, with the latest report topping economists’ forecasts.
• Input costs have been rising, squeezing margins for industrial companies (the PPI will need to climb much further to boost margins).
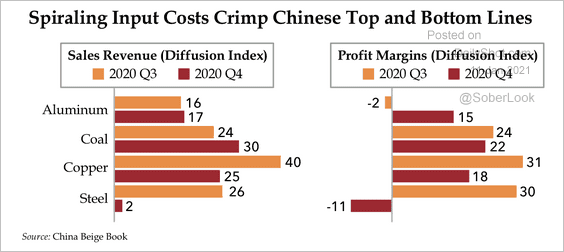 Source: Quill Intelligence
• Shipping costs have spiked.
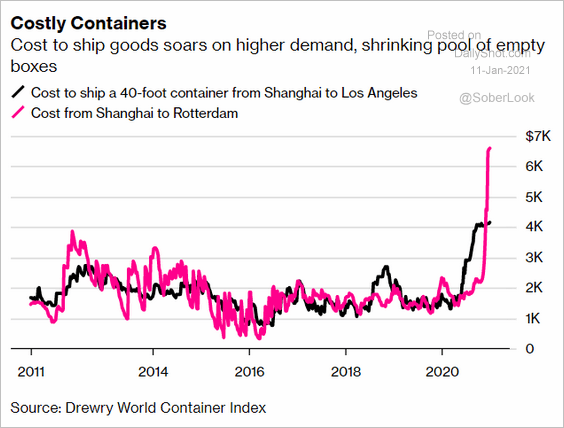 Source: @markets Read full article
——————–
3. The rally in CNY vs. the dollar has outpaced the broader renminbi index.
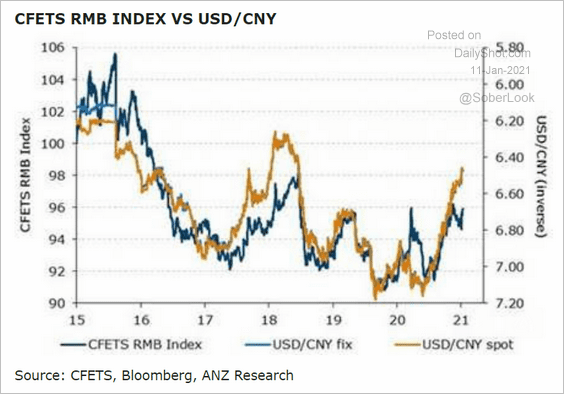 Source: ANZ Research
Back to Index
Emerging Markets
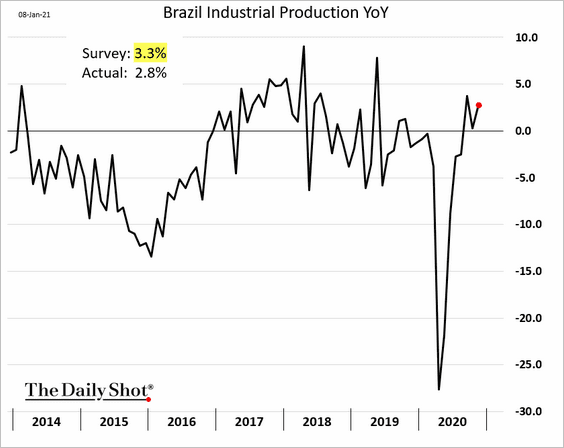
1. Brazil’s November industrial production was a bit disappointing.
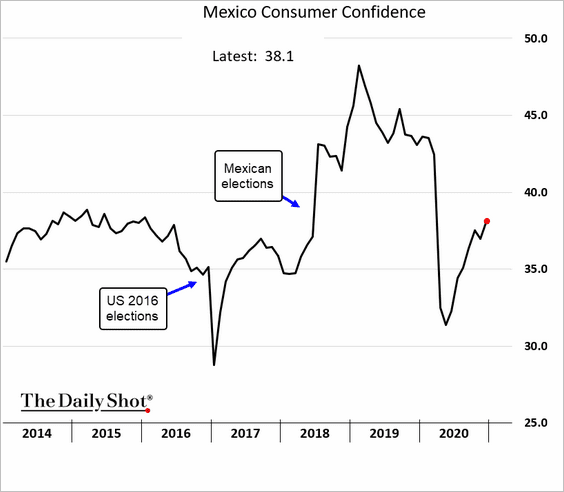
2. Mexico’s consumer confidence is recovering.
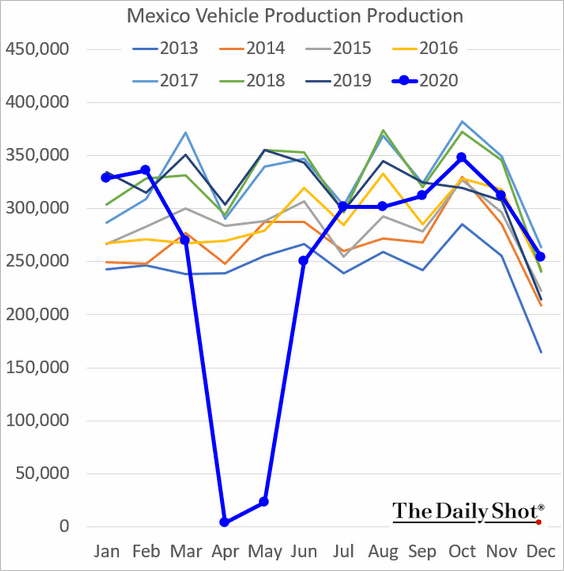
Mexican car production finished the year on a strong note.
——————–
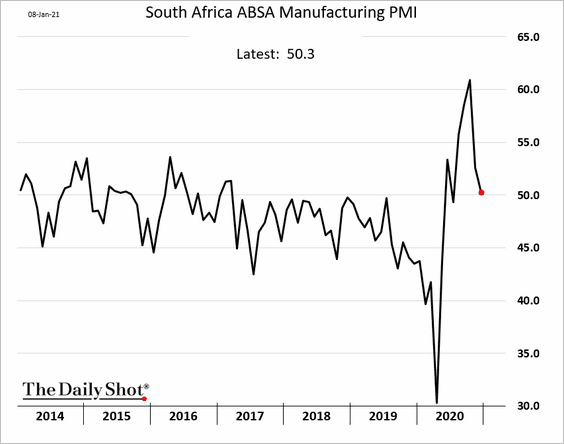
3. Growth in South Africa’s factory activity stalled last month amid new lockdowns.
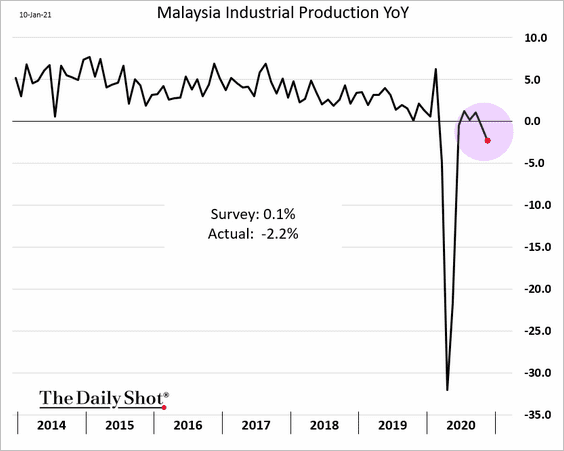
4. Malaysia’s industrial output deteriorated in November.
5. FX-hedged EM local currency bonds have a return profile that is similar to US Treasuries.
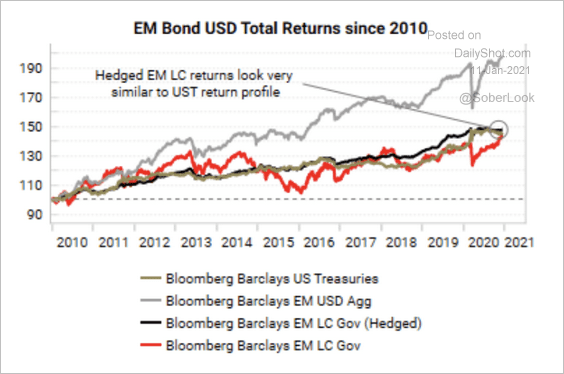 Source: Variant Perception
Back to Index
Cryptocurrency
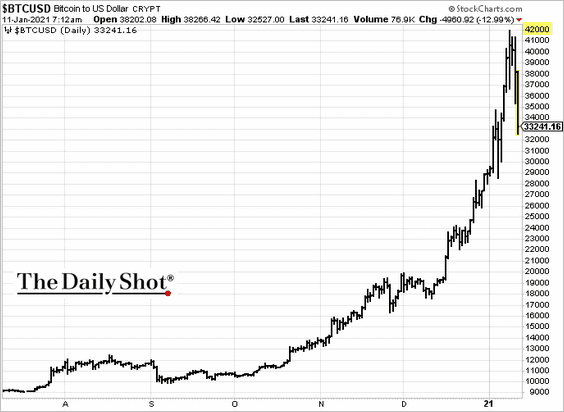
1. Bitcoin is undergoing a correction as global markets shift into risk-off mode on Monday.
2. This chart shows the implicit cost per transaction for Bitcoin.
![]() Source: Blockchain.com
Source: Blockchain.com
3. How does Bitcoin volatility compare to other markets?
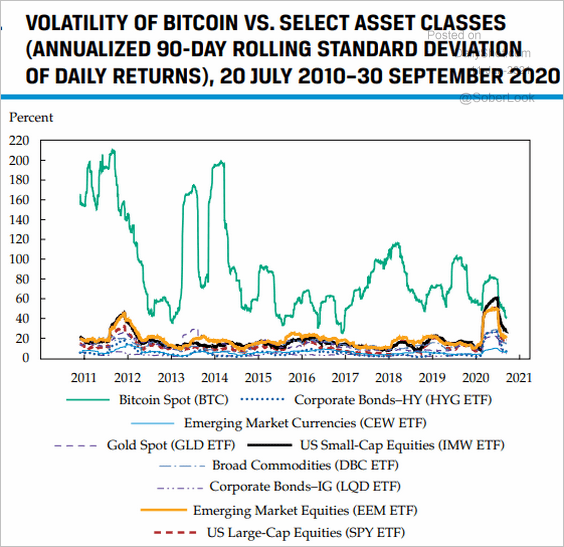 Source: CFA Institute
Back to Index
Commodities
1. China’s scrap metal prices spiked amid shortages.
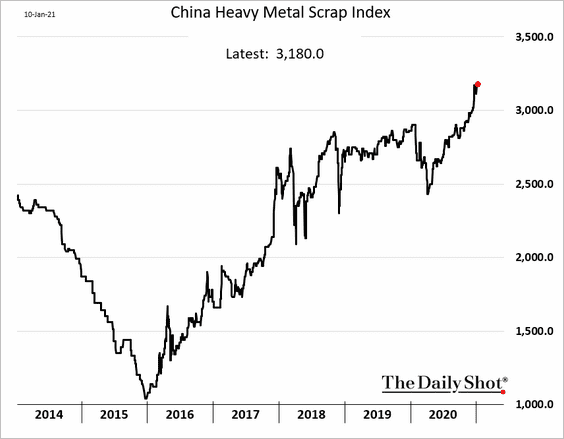 h/t @krystalchia
2. Dry bulk shipping costs jumped last week.
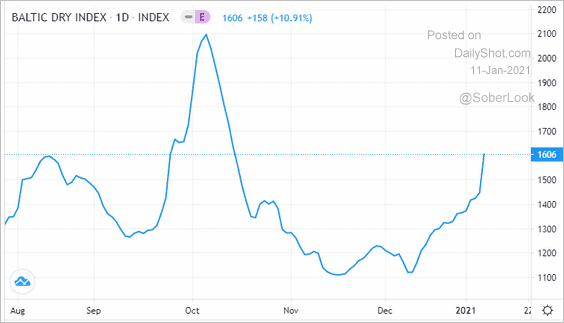 Source: Trading Economics
 Source: Seekeing Alpha, h/t Walter Read full article
——————–
3. Global food prices are climbing.
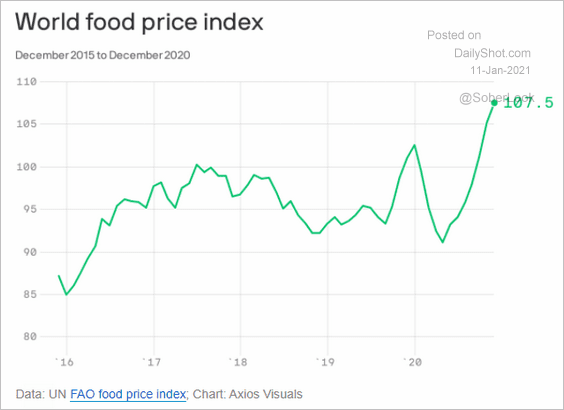 Source: @axios
4. Here is the expected demand increase for materials used in electric vehicles.
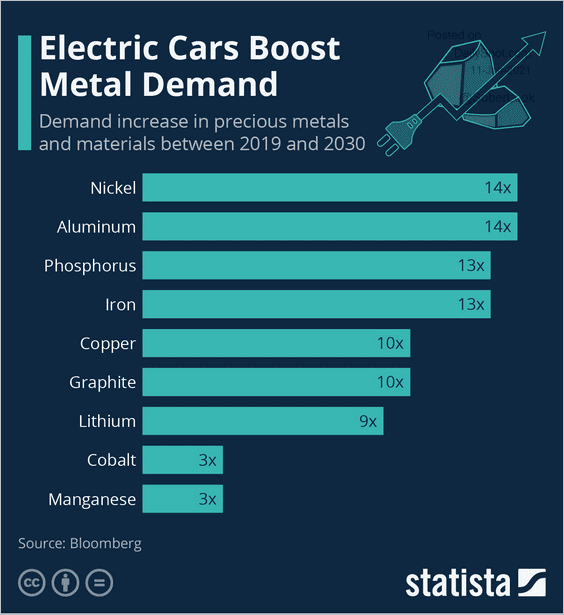 Source: Statista
Back to Index
Energy
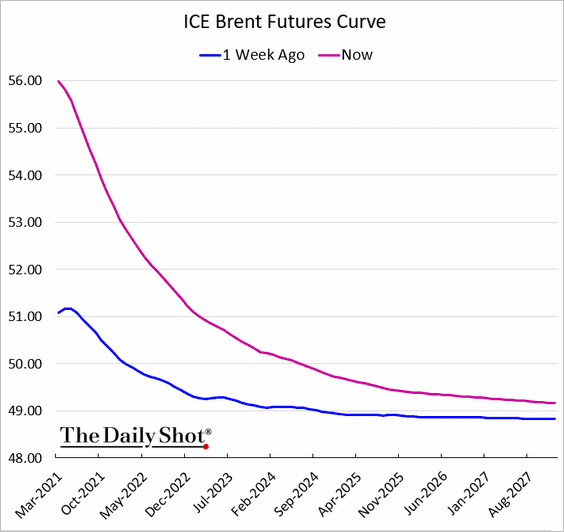
1. The Brent backwardation increased sharply last week.
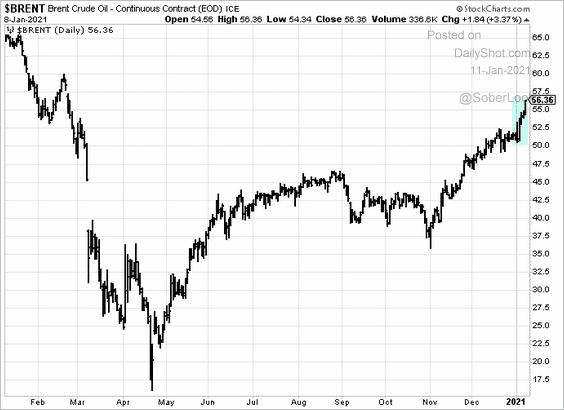
2. It’s been a strong start of the year for oil prices.
3. This chart shows Saudi oil shipments to the US.
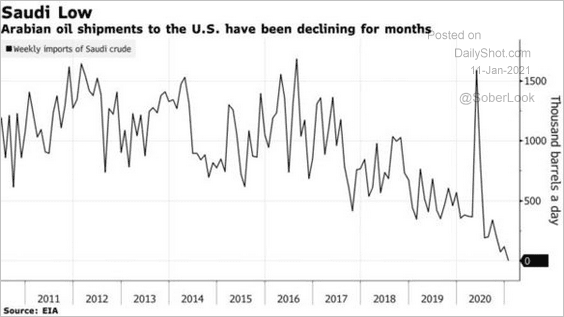 Source: @business Read full article
Back to Index
Equities
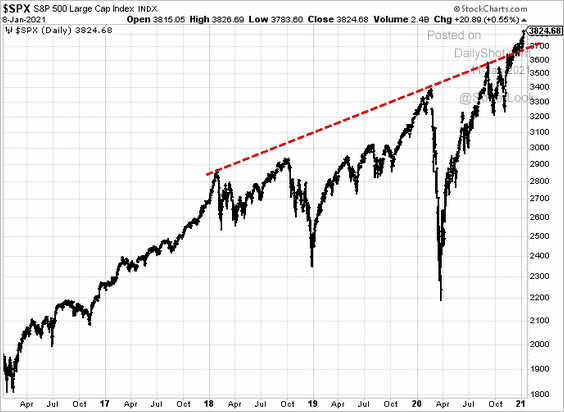
1. The S&P 500 hit a new high last week, but futures are softer this morning amid global risk-off sentiment.
2. The S&P 500 tends to produce lower returns in February.
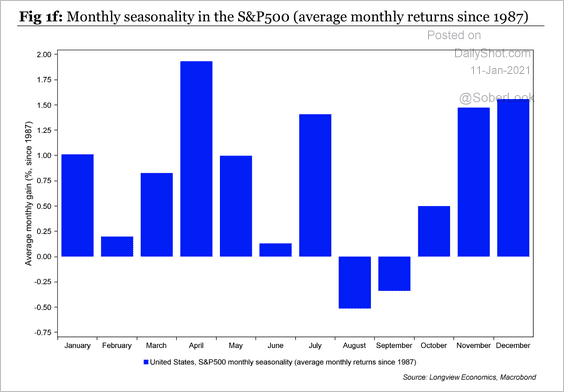 Source: Longview Economics
3. It’s been a good couple of months for equity fund inflows.
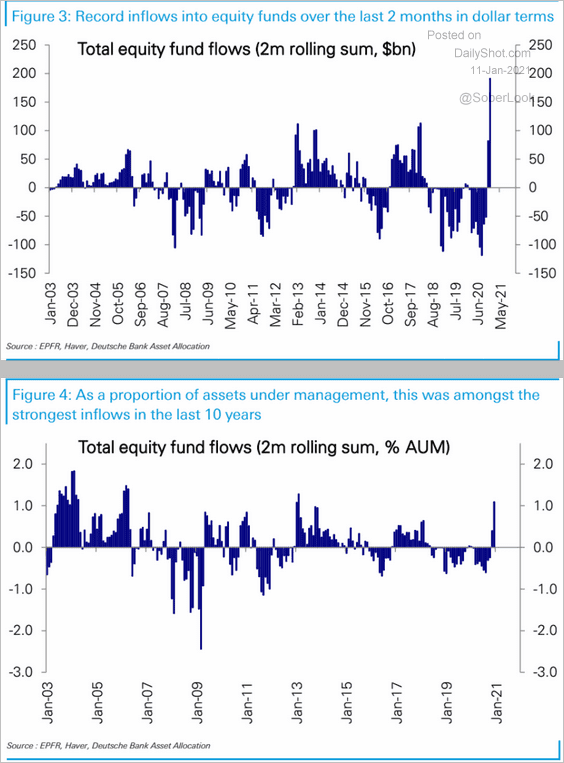 Source: Deutsche Bank Research
But equity flows have plenty of room to catch up to other asset classes.
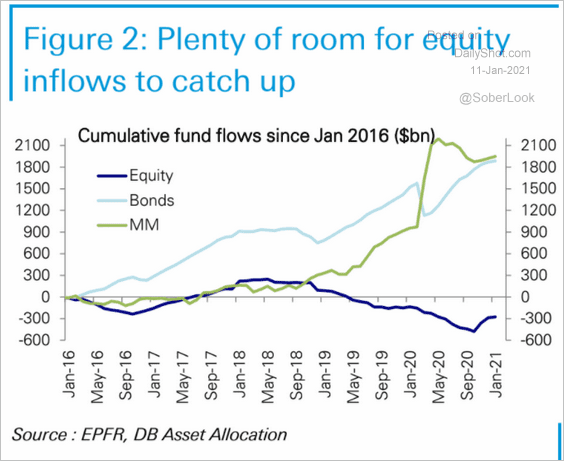 Source: Deutsche Bank Research
4. Sentiment indicators continue to show market exuberance.
• Equity call option volume (2 charts):
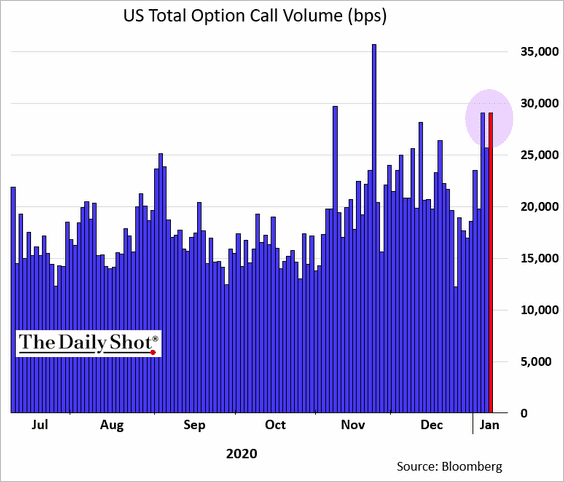
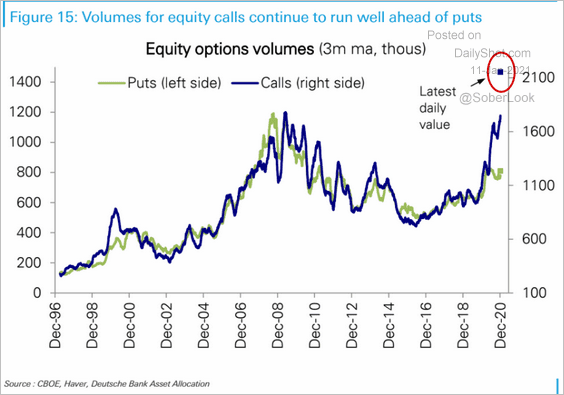 Source: Deutsche Bank Research
• The Citi euphoria/panic indicator:
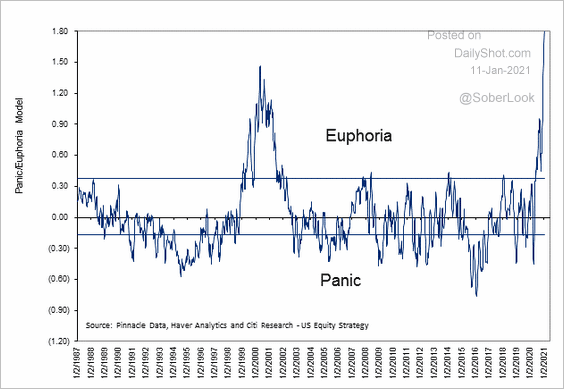 Source: Citi, @AvidCommentator
——————–
5. The S&P 500 has experienced significant upside volatility over the past year (similar to the late 1980s and 1990s).
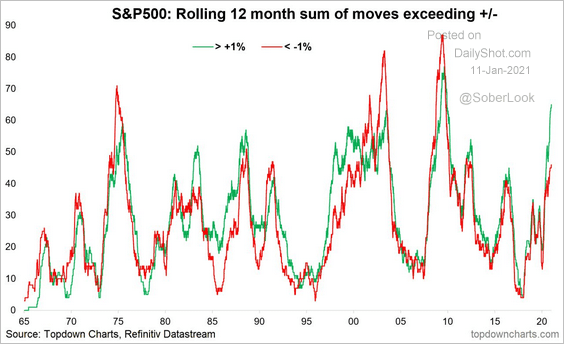 Source: Topdown Charts
6. Here is a comparison of the S&P 500 forward P/E ratios to other markets (the S&P 500 is more tech-heavy).
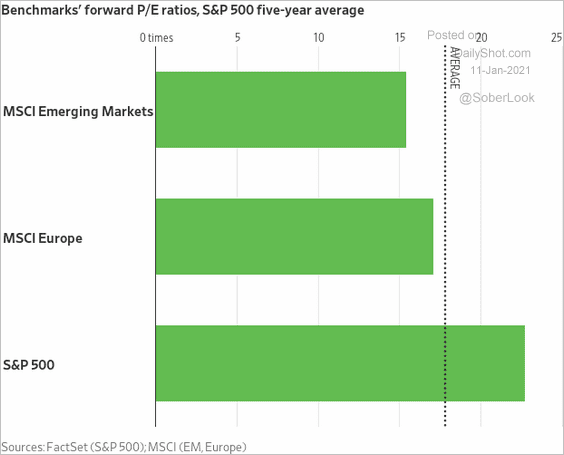 Source: @WSJ Read full article
Back to Index
Credit
1. US high-yield spreads have tightened to 2018 levels and diverged from VIX (2nd chart).
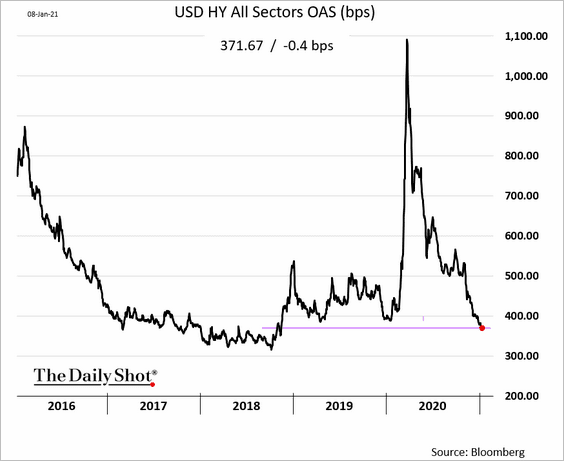
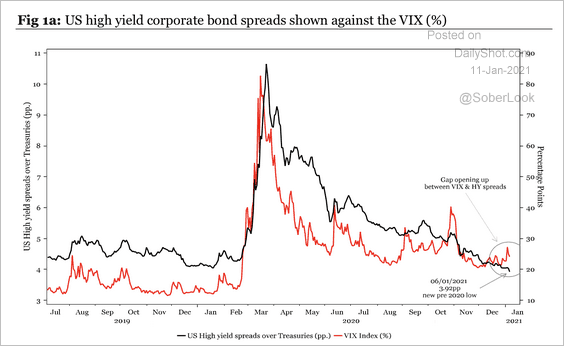 Source: Longview Economics
——————–
2. US corporate debt transactions accelerated last year.
![]() Source: Variant Perception
Source: Variant Perception
US companies issued longer-duration bonds to lock in low rates.
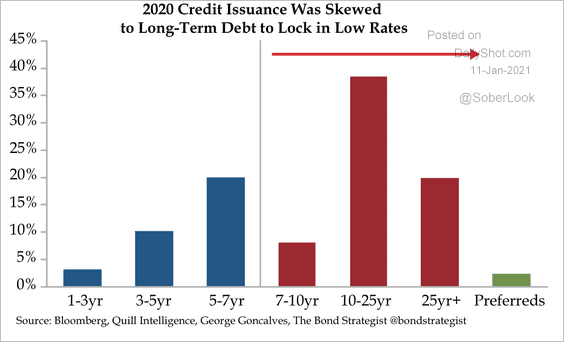 Source: Quill Intelligence
Back to Index
Rates
1. Treasury yields rose sharply last week.
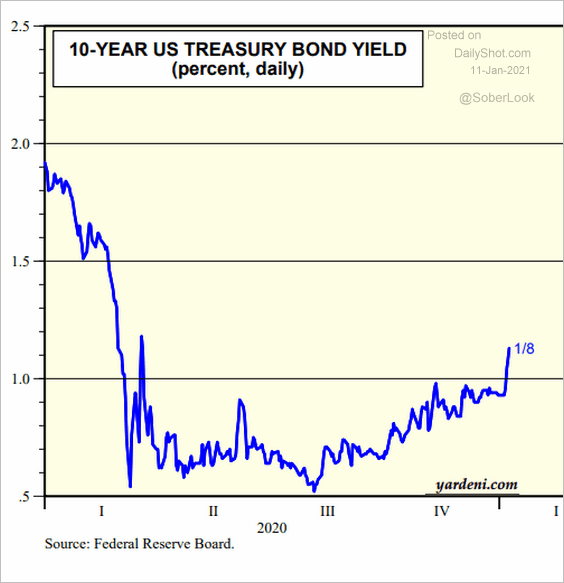 Source: Yardeni Research
2. Some traders are betting on a Fed rate hike in 2022.
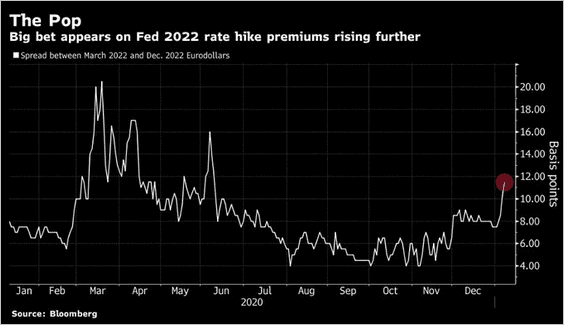 Source: @StephenSpratt, @markets
3. This chart shows the fed funds rate vs. the Taylor Rule.
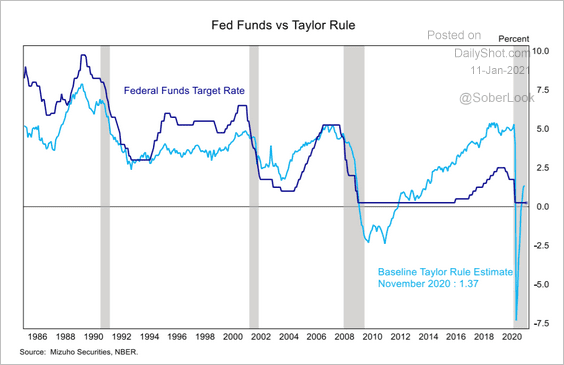 Source: Mizuho Securities USA
Back to Index
Global Developments
1. Speculative bets against the dollar are quite stretched (2 charts). Will we see a bounce?
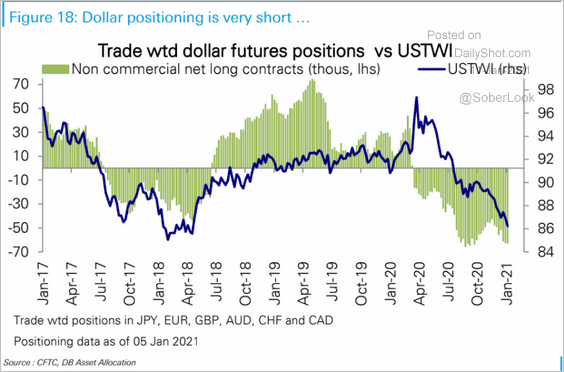 Source: Deutsche Bank Research
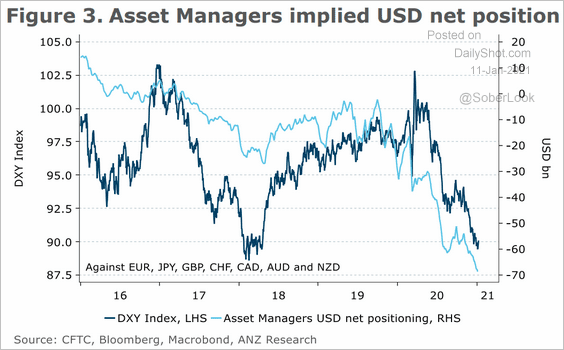 Source: ANZ Research
——————–
2. The rally in global alternative energy stocks has been impressive.
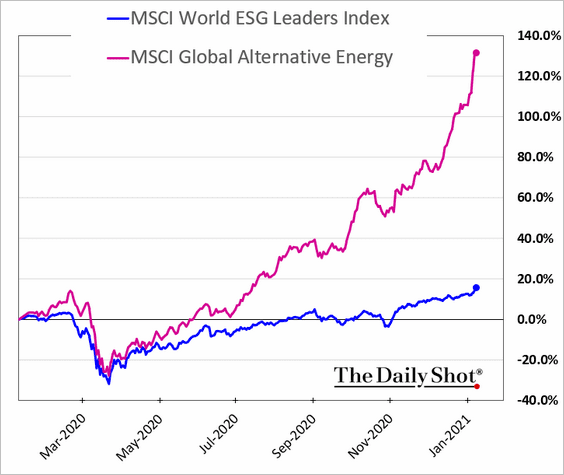 h/t @mikamsika
3. BlackRock expects ongoing fiscal and monetary support this year.
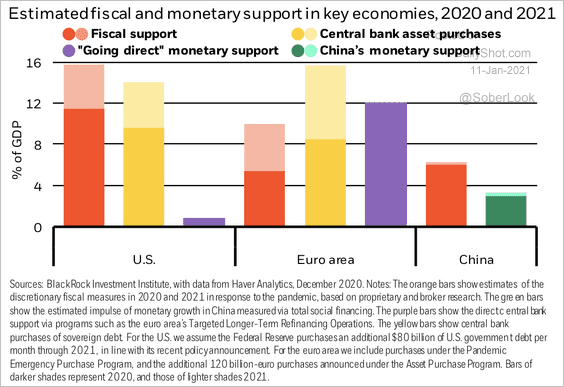 Source: BlackRock
Back to Index
Food for Thought
1. US consumer spending at restaurants:
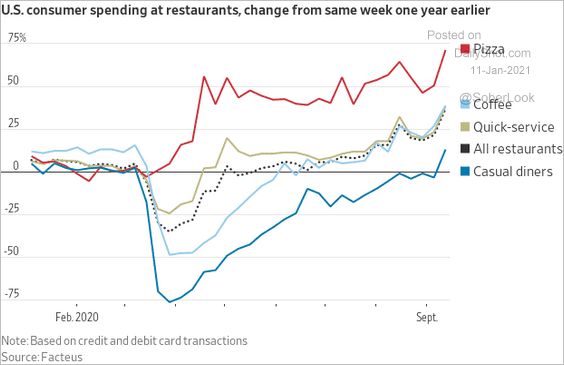 Source: @jeffsparshott
2. Who is better or worse off financially?
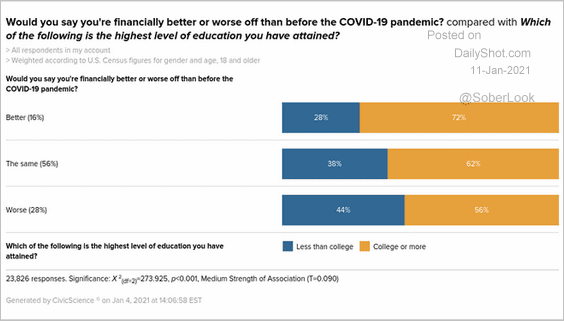 Source: @jdcivicscience, @CivicScience
3. Which bills will Americans prioritize as they receive the stimulus checks?
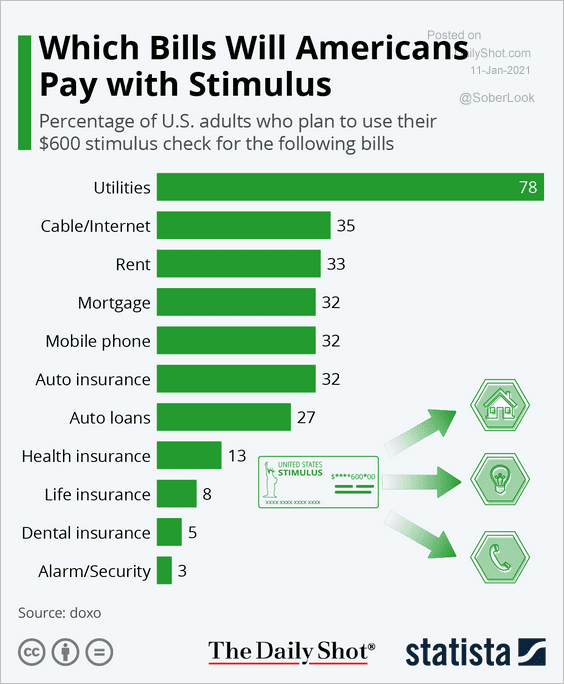 Source: Statista
4. Changes in consumer prices for selected food items:
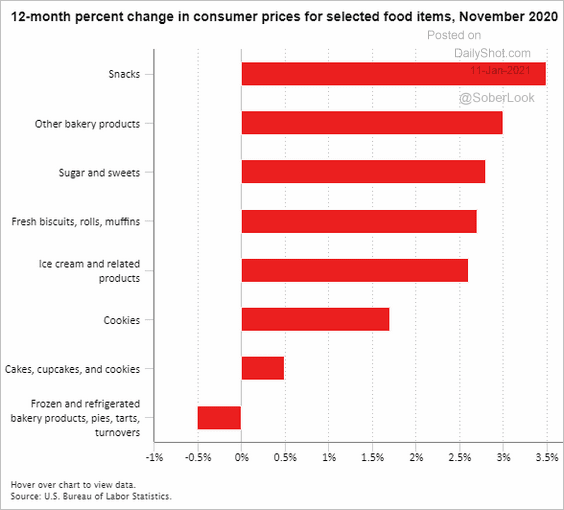 Source: BLS
5. Office occupancy rates:
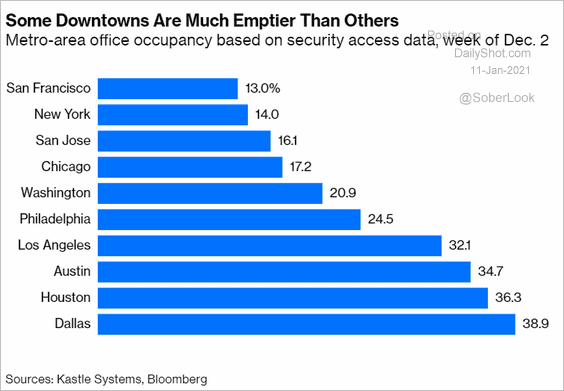 Source: @bopinion Read full article
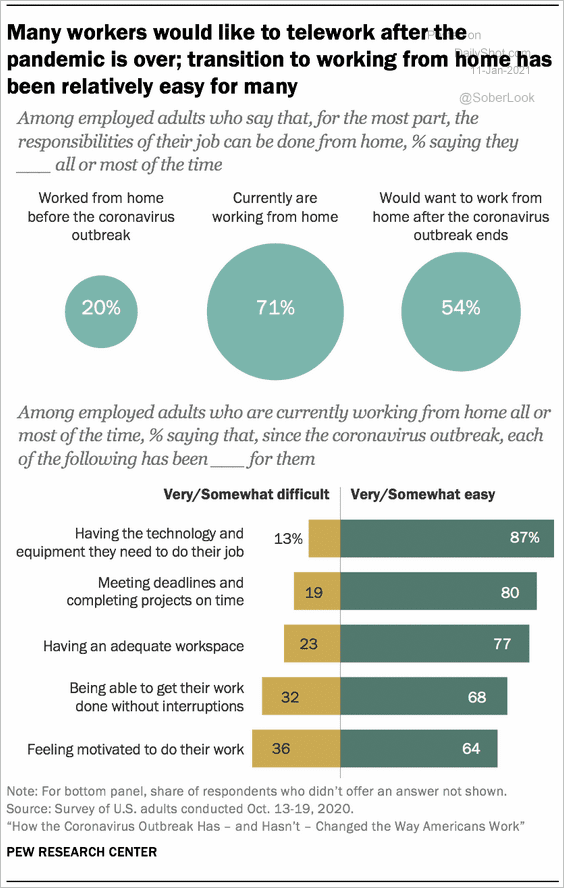
6. Who can work from home?
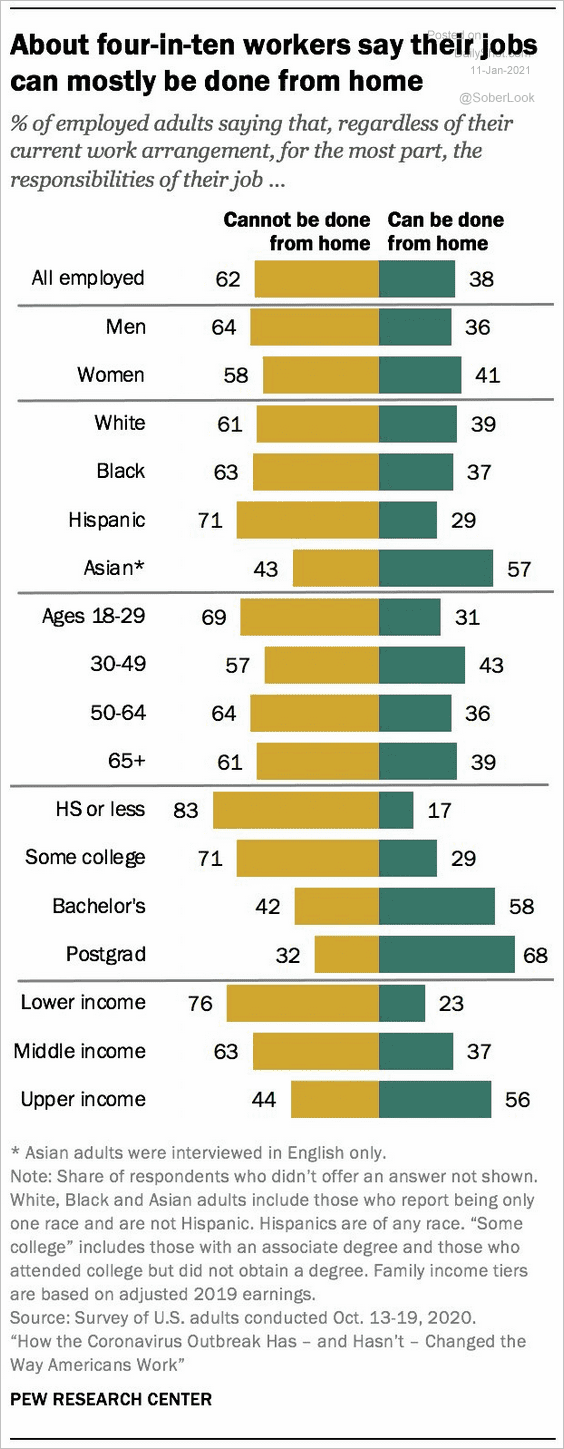 Source: @pewresearch Read full article
 Source: Pew Research Center Read full article
——————–
7. Delaying the second dose of the vaccine:
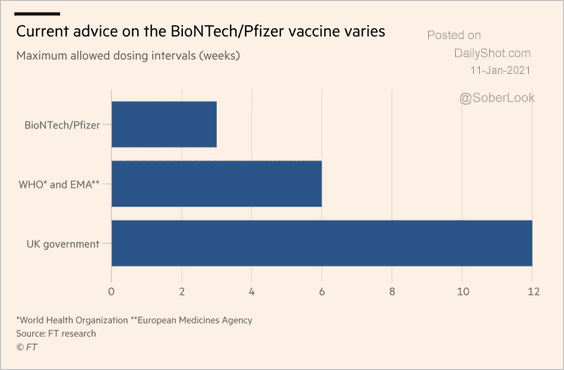 Source: @financialtimes Read full article
8. Vaccination progress:
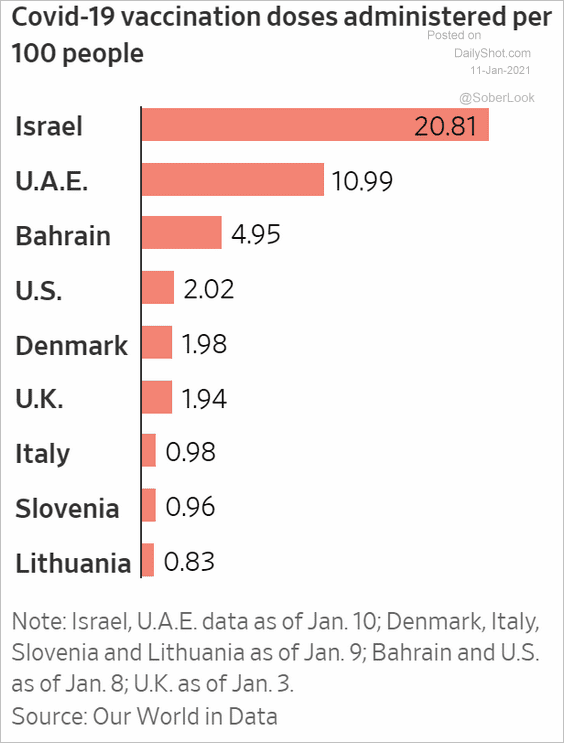 Source: @WSJ Read full article
9. Vaccination plans:
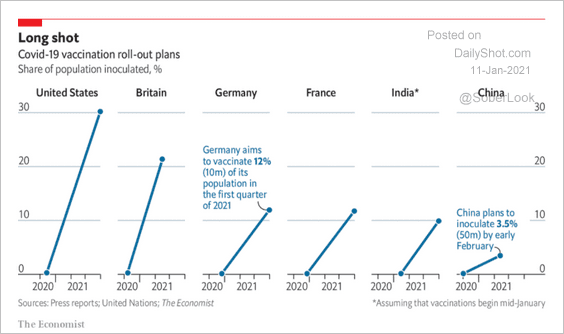 Source: The Economist Read full article
10. Dry January?
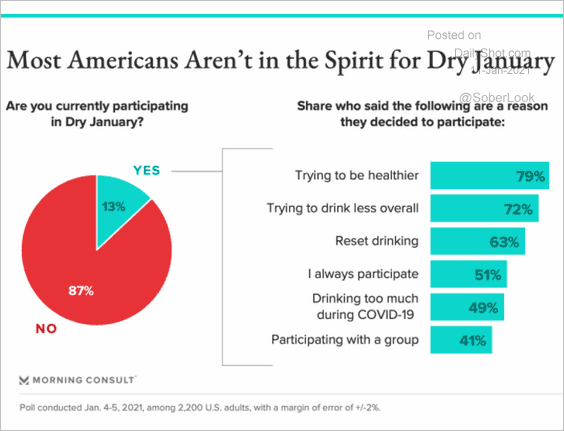 Source: Morning Consult Read full article
——————–
Back to Index