
The Daily Shot: 04-Feb-21
• The United States
• Canada
• The United Kingdom
• The Eurozone
• Europe
• Asia – Pacific
• China
• Emerging Markets
• Cryptocurrency
• Energy
• Equities
• Credit
• Rates
• Food for Thought
The United States
1. The January ADP private payrolls report topped economists’ forecasts.
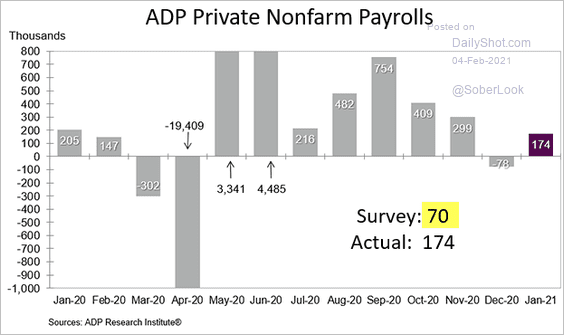 Source: ADP
Service sectors showed strength.
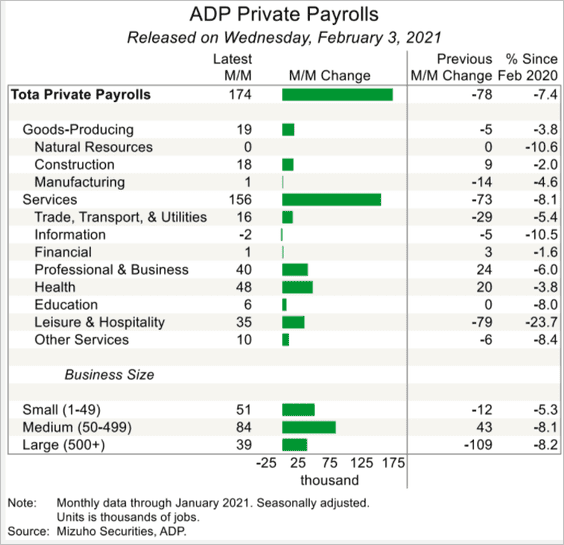 Source: Mizuho Securities USA
It suggests that we may see some gains in Friday’s employment report.
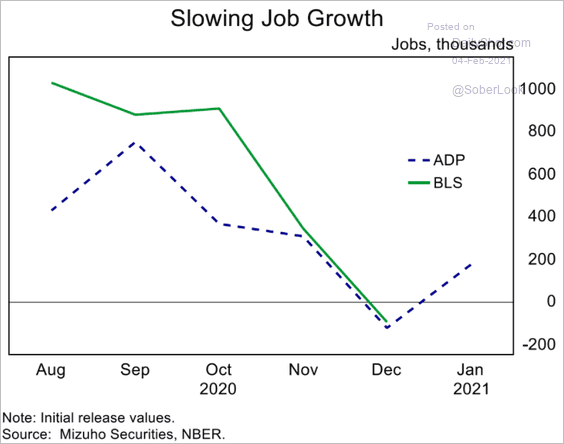 Source: Mizuho Securities USA
Here is Morgan Stanley’s forecast.
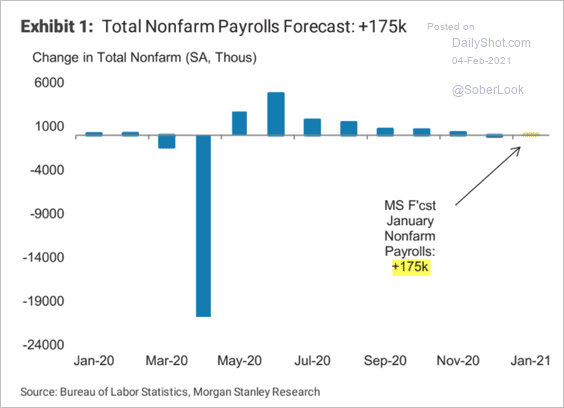 Source: Morgan Stanley Research
——————–
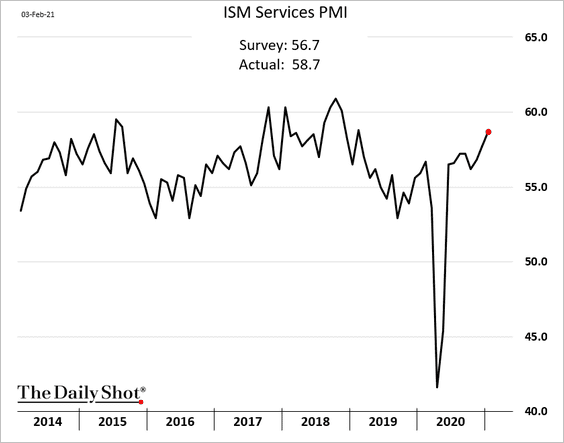
2. The ISM services PMI also exceeded expectations, showing robust expansion in business activity.
• Here are the contributions to the headline PMI.
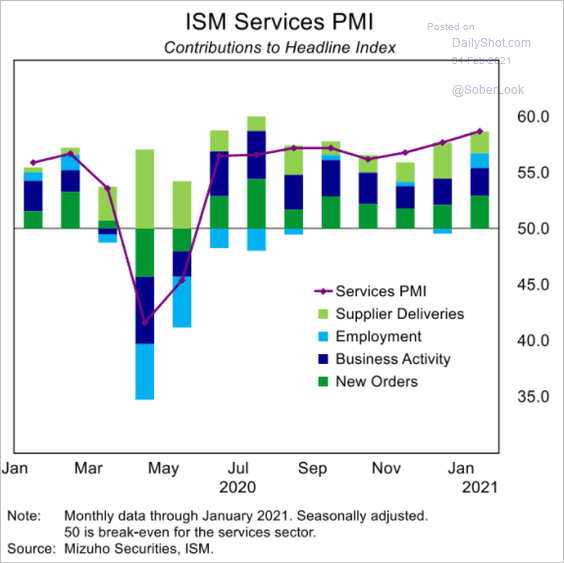 Source: Mizuho Securities USA
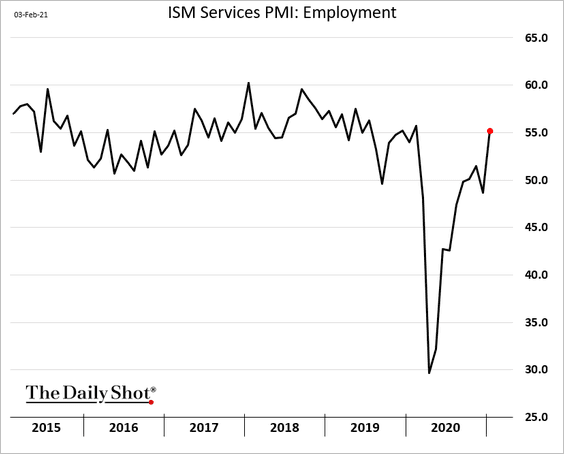
• The ISM service employment index supports the strong ADP data (above).
• The ISM Services price index points to higher consumer inflation (similar to the manufacturing-sector trend).
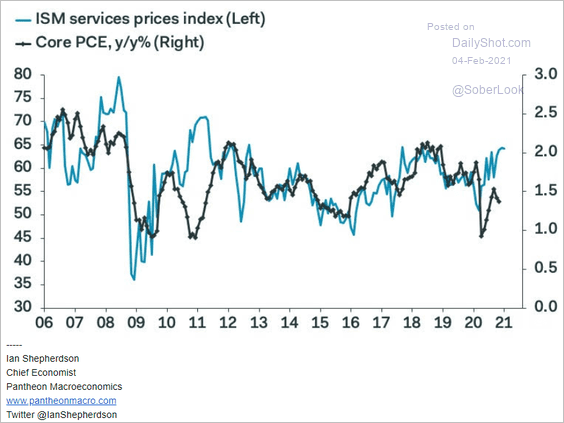 Source: Pantheon Macroeconomics
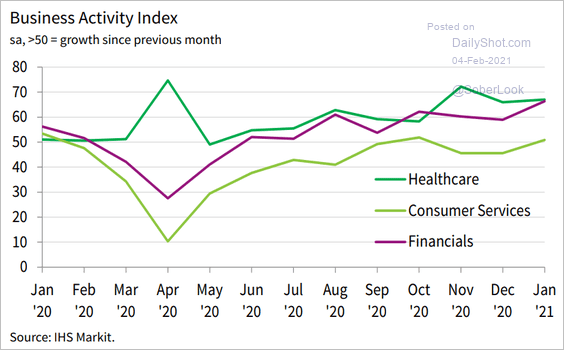
• The updated Markit Services PMI (similar to the ISM index above) is near multi-year highs.
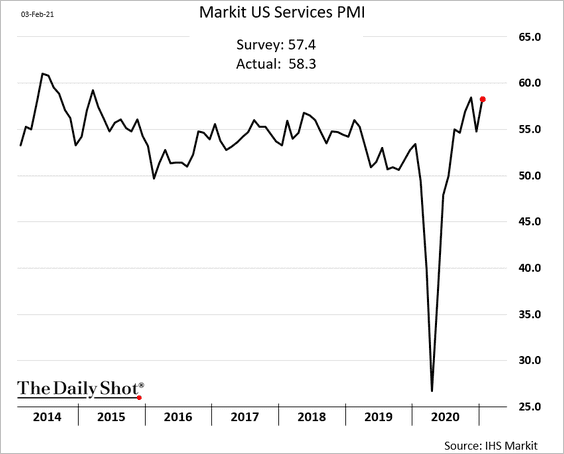
Activity in healthcare and financials is growing quickly, while consumer services continue to struggle (PMI < 50).
 Source: IHS Markit
——————–
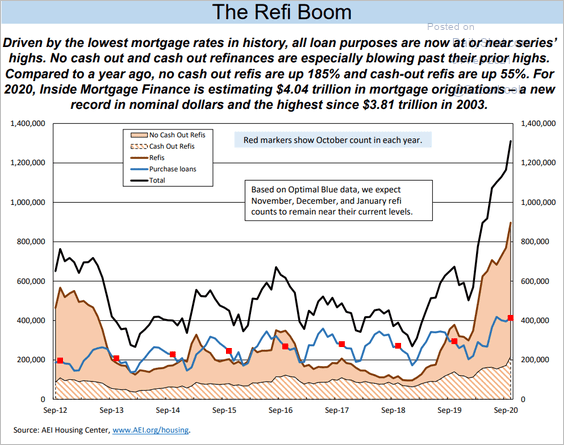
3. The strength in mortgage applications has been impressive.
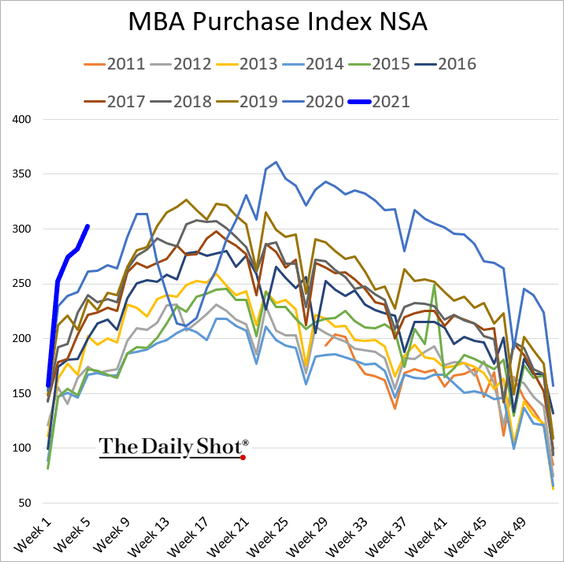
Refi activity remains elevated, which has been putting additional cash in homeowners’ pockets (via lower payments or cash-out refis).
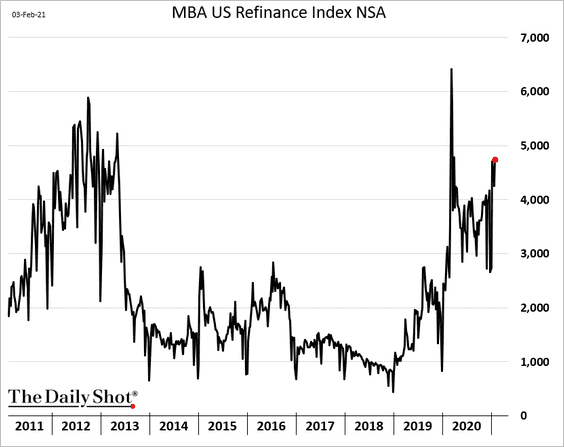
Here is an overview.
 Source: AEI Housing Center
——————–
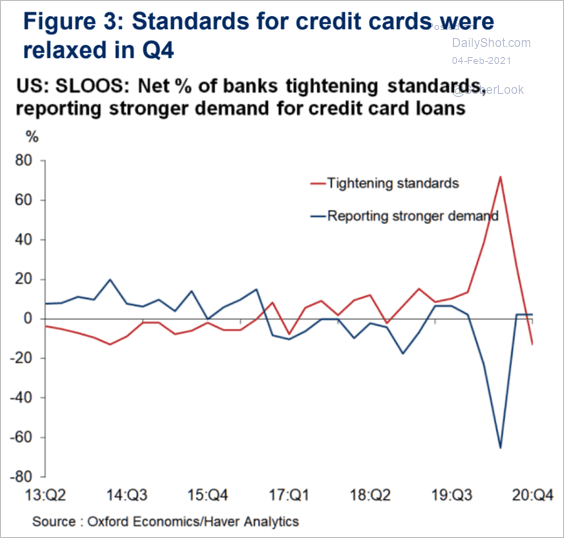
4. Next, let’s take a look at some consumer credit trends.
• Banks are now easing lending standards on credit cards.
 Source: Oxford Economics
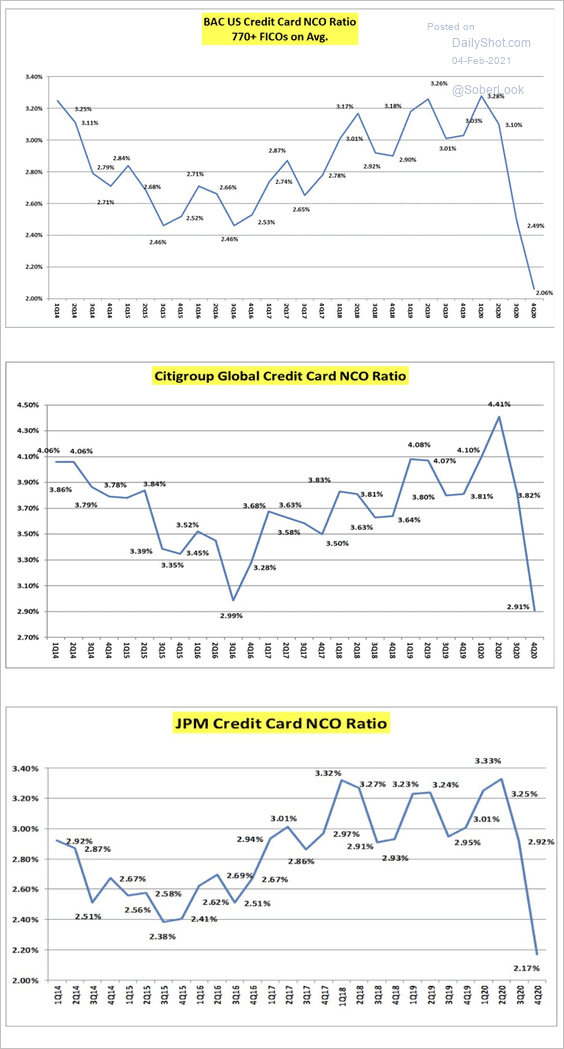
• Banks’ net charge-off (NCO) rates on credit cards have declined sharply.
 Source: @gamesblazer06
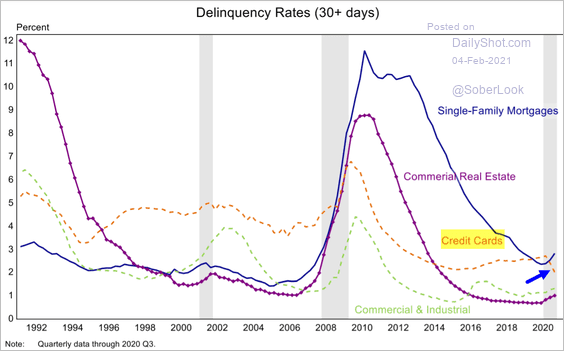
• Credit card delinquency rates fell last year.
 Source: Mizuho Securities USA
• Consumer balance sheets continue to strengthen.
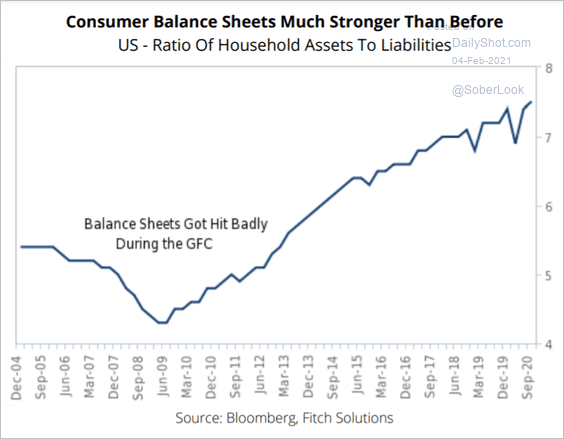 Source: Fitch Solutions Macro Research
• Consumers have been shying away from new sources of credit.
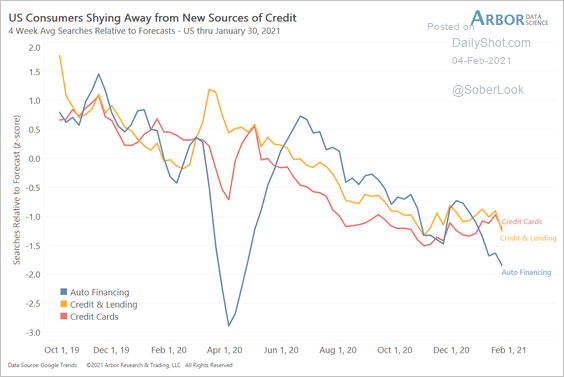 Source: Arbor Research & Trading
——————–
5. Some of the pandemic-related spending shifts remain intact.
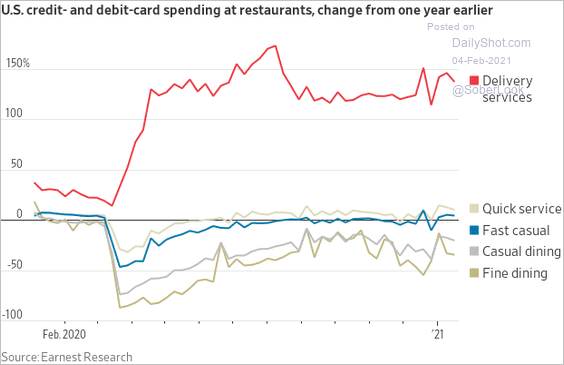 Source: @jeffsparshott
• Spending on housing-related items has been particularly strong.
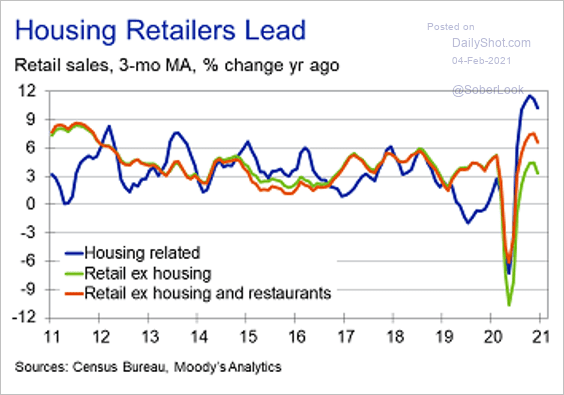 Source: Moody’s Analytics
• Credit/debit card spending by low-income households outpaced those with higher pay.
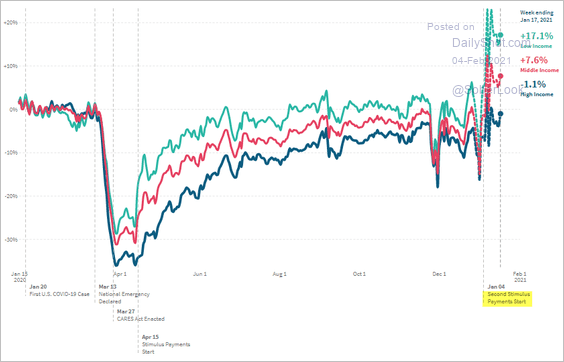 Source: Opportunity Insights
——————–
6. COVID restrictions reduced the number of cases but caused higher unemployment.
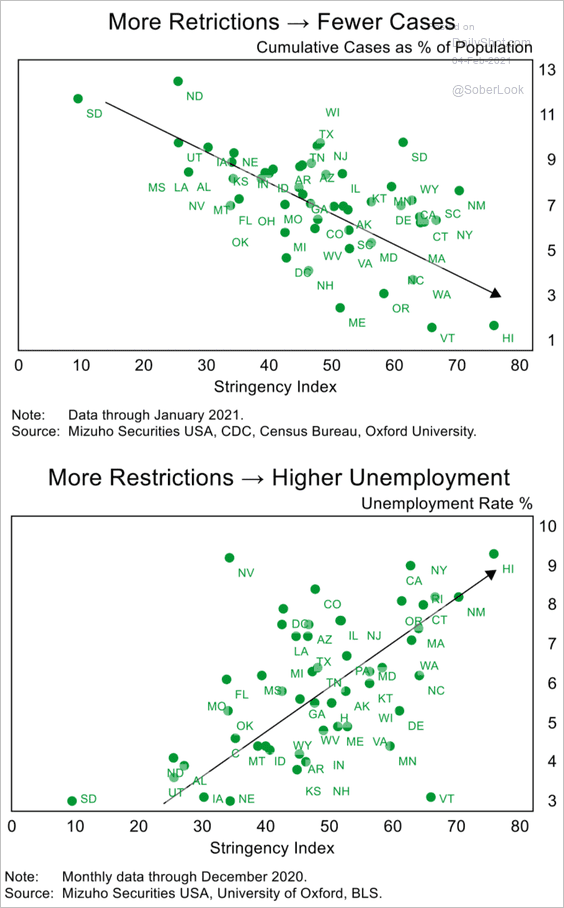 Source: Mizuho Securities USA
Back to Index
Canada
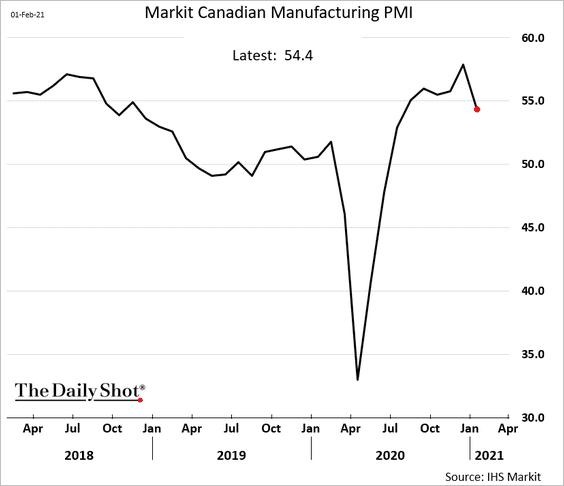
1. Manufacturing growth pulled back from a multi-year high last month.
2. The Oxford Economics Recovery Tracker has been improving.
![]() Source: Oxford Economics
Source: Oxford Economics
Back to Index
The United Kingdom
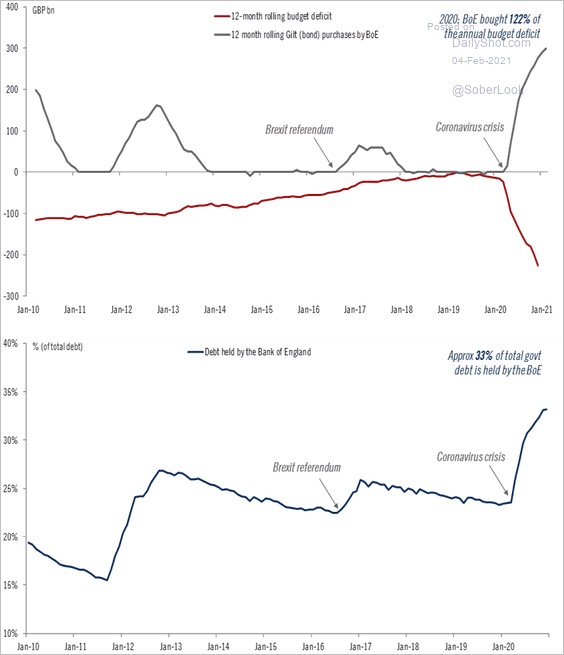
1. The BoE is expected to keep policy on hold (no new stimulus). The central bank financed 122% of the annual budget deficit last year.
 Source: @TCosterg
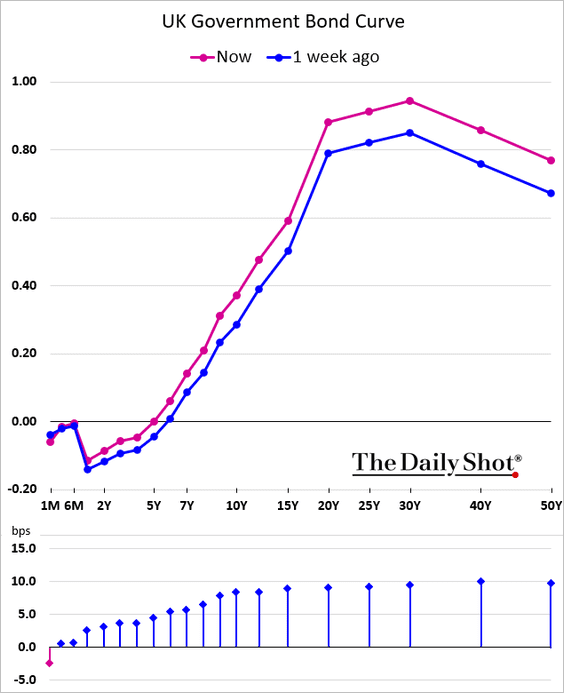
2. The gilt curve has steepened.
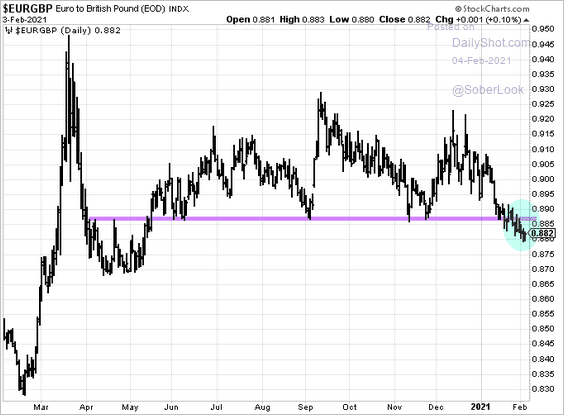
3. EUR/GBP dipped below resistance.
4. The PMI indicators point to a sharp GDP contraction last month.
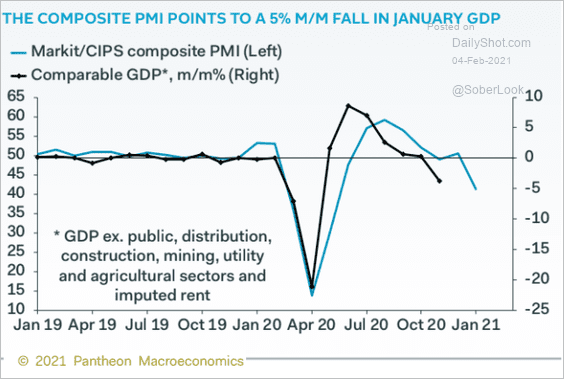 Source: Pantheon Macroeconomics
Back to Index
The Eurozone
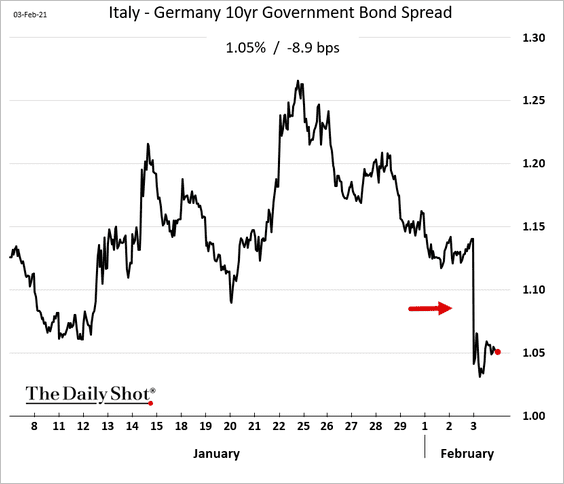
1. Mario Draghi is a good choice for Italy. The country needs a politically-neutral seasoned crisis fighter.
 Source: @axios Read full article
The market agrees.
• Italy-Germany 10yr spread:
• Equities (2 charts):
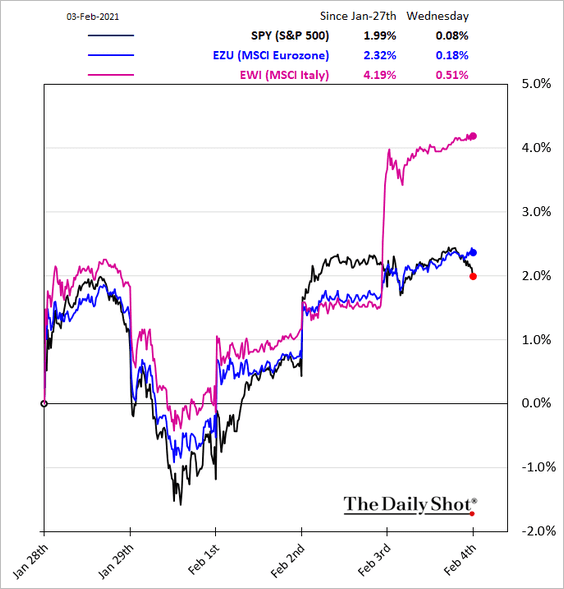
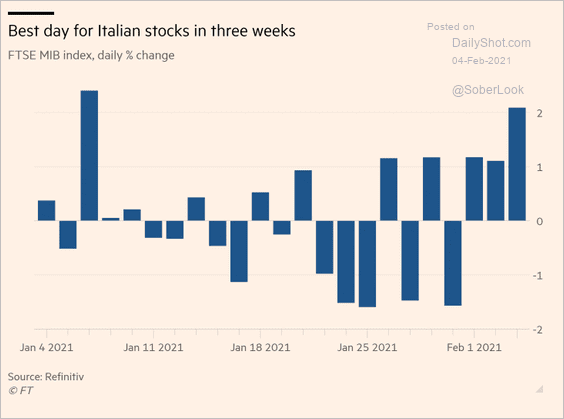 Source: @financialtimes Read full article
——————–
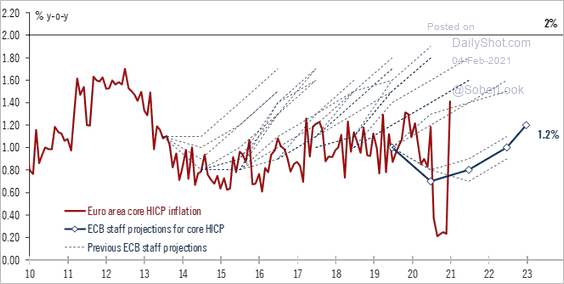
2. Inflation across the euro area climbed last month (2 charts).
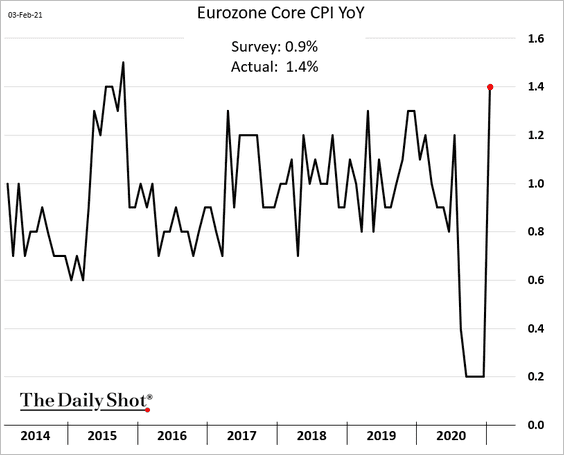
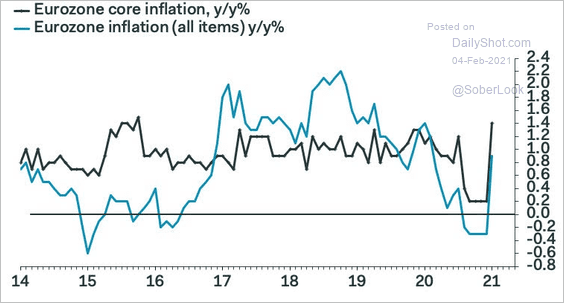 Source: Pantheon Macroeconomics
But a large portion of the increase was due to some “one-off” factors. Here is a comment from Christoph Weil of Commerzbank.
• At the beginning of the year, a CO2 tax on fuels was introduced in Germany. In addition, the temporary reduction in VAT rates expired, with the result that the previous VAT rates have applied again since January 1. Both effects taken together are likely to have increased the euro area inflation rate by around 0.4 percentage points in January.
• From January onward, the price changes of individual goods and services are aggregated with largely changed weights. In particular, the weight of package holidays has fallen significantly, which means that the seasonal decline in package tour prices puts much less downward pressure on the consumer price index in January than in the previous year.
• Due to the closure of stores, the sale of winter items is delayed this year. In France, for example, the winter sales started two weeks later than usual.
This chart shows the ECB’s core inflation forecasts (vs. actual).
 Source: @fwred
——————–
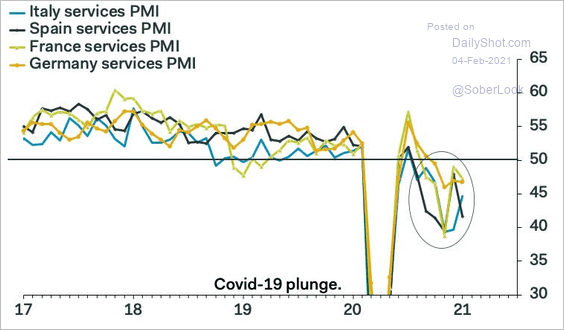
3. Service-sector PMI indicators point to ongoing contraction (PMI < 50).
 Source: Pantheon Macroeconomics
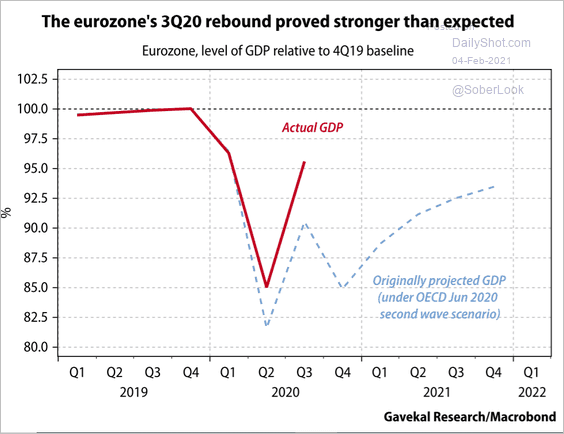
4. The euro-area GDP growth has been exceeding expectations.
 Source: Gavekal Research
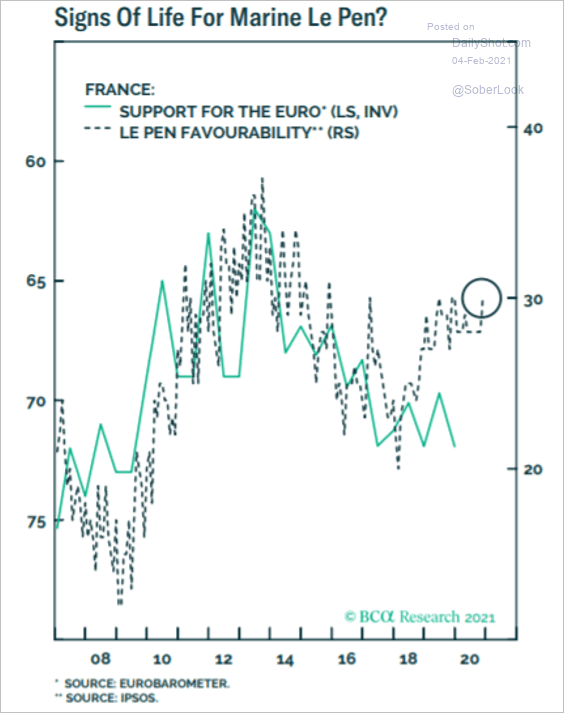
5. Le Pen’s favorability ratings have been climbing recently. Will anti-euro sentiment follow?
 Source: BCA Research
Back to Index
Europe
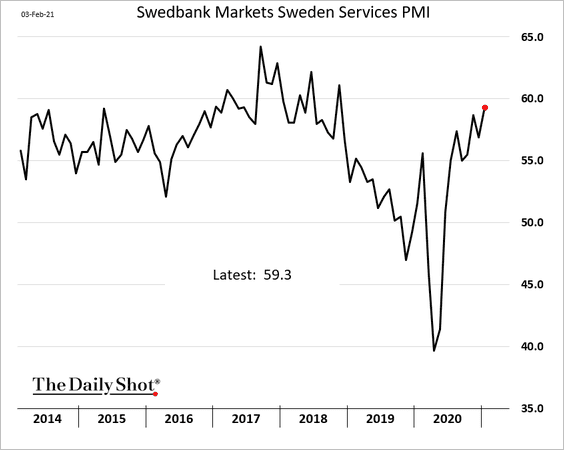
1. Sweden’s service-sector growth keeps strengthening.
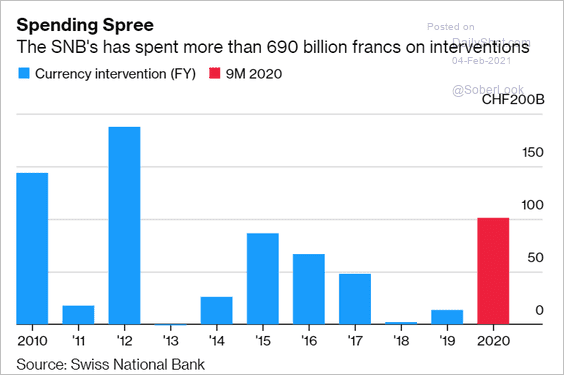
2. The Swiss central bank was quite active in F/X markets last year (buying foreign currencies).
 Source: @markets Read full article
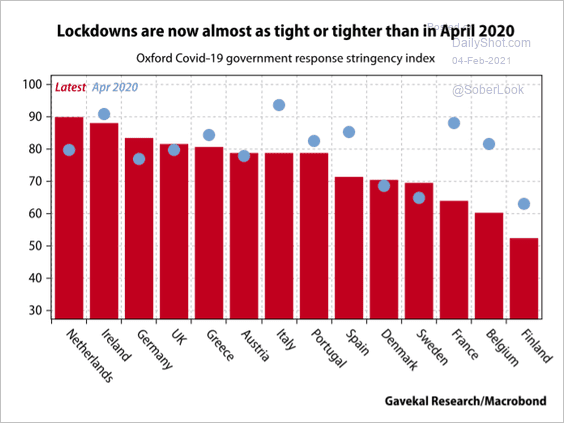
3. Lockdowns remain very stringent.
 Source: Gavekal Research
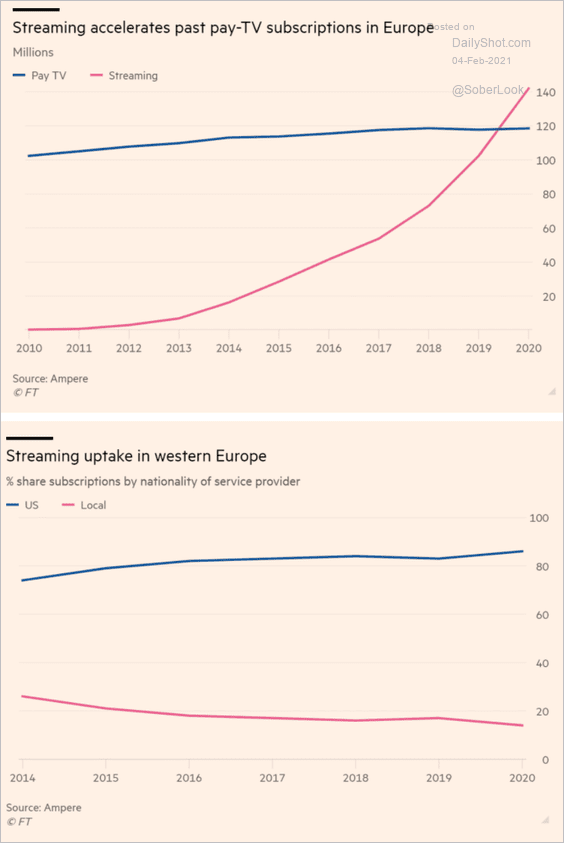
4. Streaming services have taken off in Europe.
 Source: @financialtimes Read full article
Back to Index
Asia – Pacific
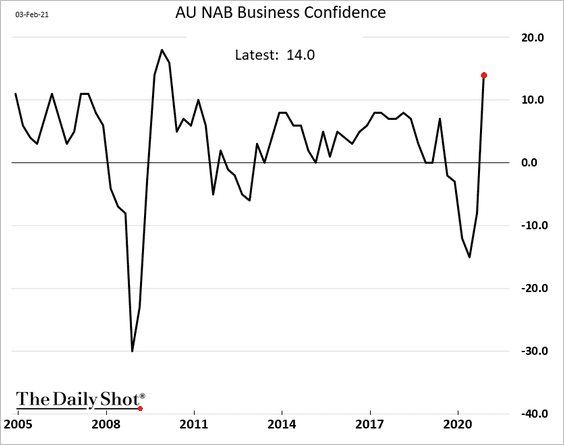
1. Australia’s business confidence hit a multi-year high last quarter.
2. Taiwan relies heavily on its semiconductor industry.
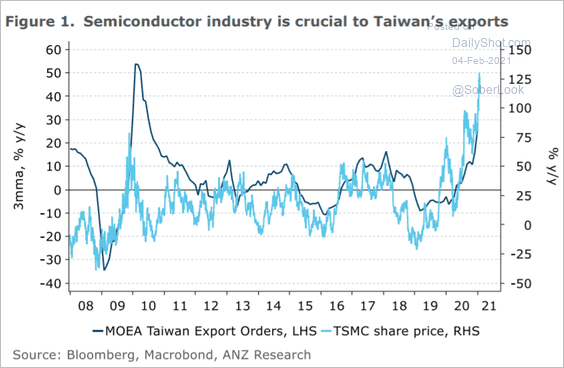 Source: ANZ Research
Analysts are concerned about China’s increasingly aggressive posture toward Taiwan.
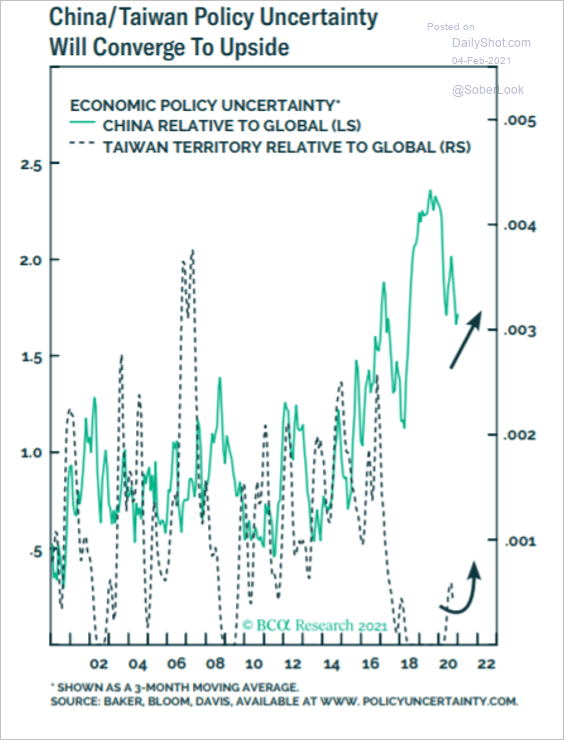 Source: BCA Research
Back to Index
China
1. The PBoC has been injecting liquidity to ease funding conditions before the holidays.
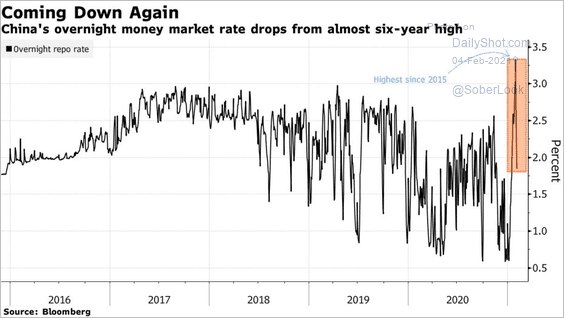 Source: @markets Read full article
2. Have freight costs finally peaked?
 Source: Deutsche Bank Research
3. According to Pantheon Macroeconomics, China’s budget deficit widened substantially last year.
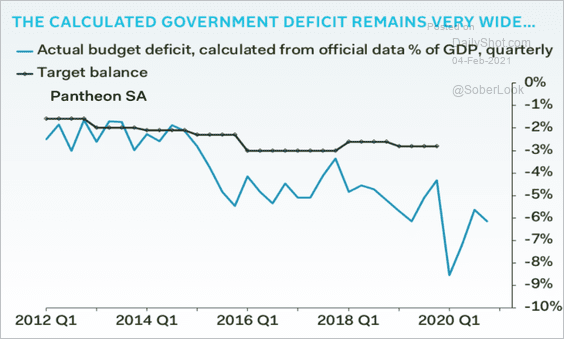 Source: Pantheon Macroeconomics
Back to Index
Emerging Markets
1. Brazil’s service sector activity deteriorated last month.
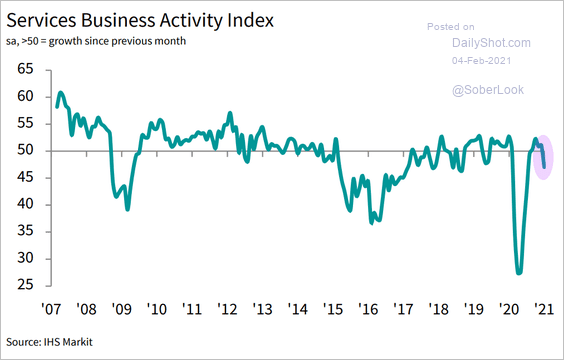 Source: IHS Markit
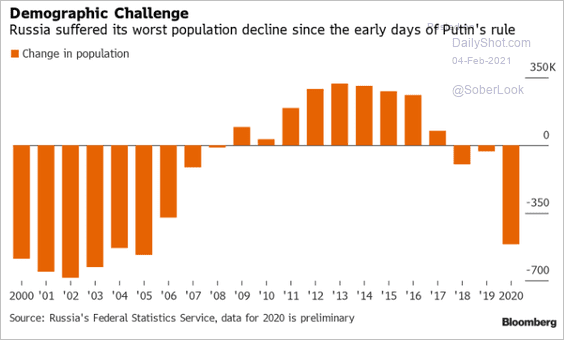
2. Here are some updates on Russia.
• Manufacturing is back in expansion mode.
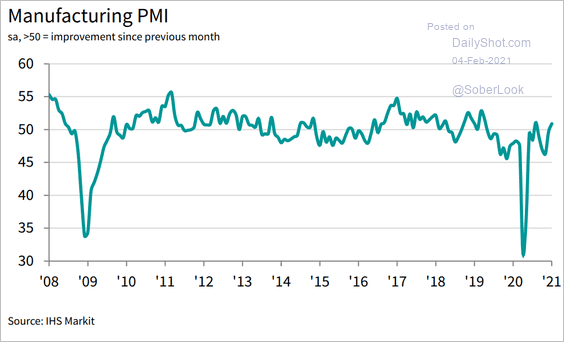 Source: IHS Markit
• Growth in retail deposits and consumer lending has been moderating.
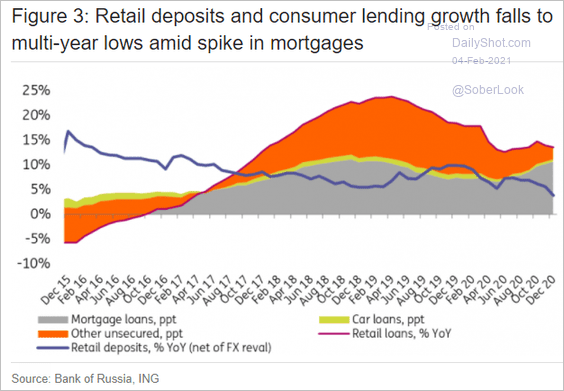 Source: ING
• Russia’s population declined sharply last year.
 Source: @natashadoff, @markets, @economics
——————–
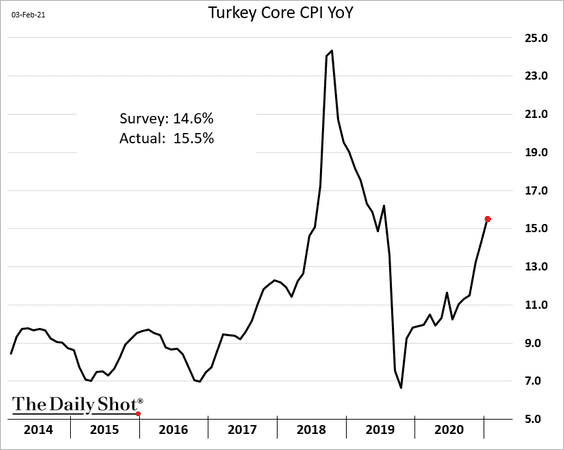
3. Turkey’s CPI surprised to the upside again.
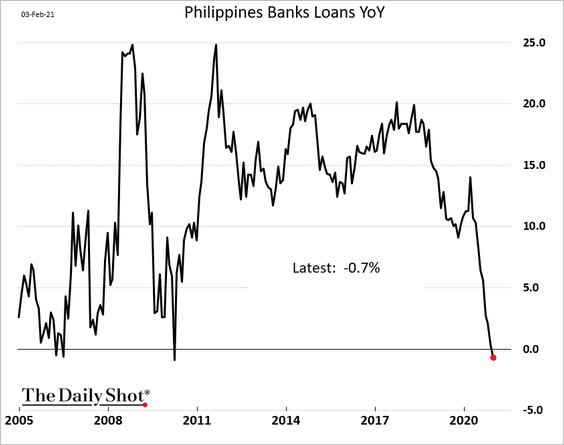
4. Philippine credit growth has turned negative.
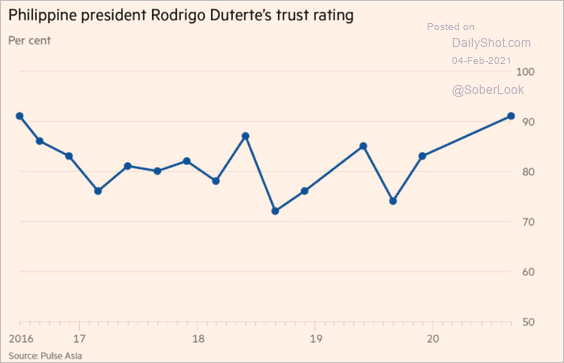
Separately, this chart shows Duterte’s trust ratings:
 Source: @financialtimes Read full article
——————–
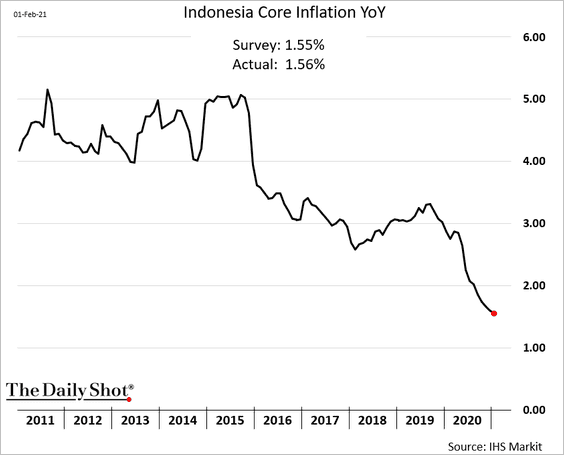
5. Indonesia’s inflation continues to fall.
6. Below is the composition of the MSCI EM (equity) Index.
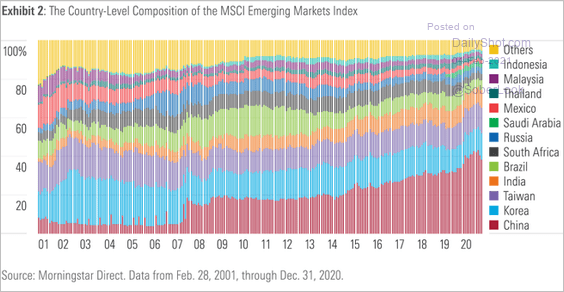 Source: @abnormalreturns Read full article
7. Here are the changes in COVID cases.
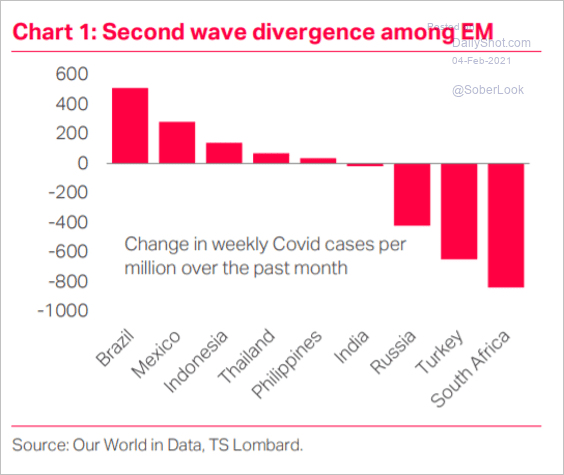 Source: TS Lombard
8. January was a good month for sovereign bond issuance.
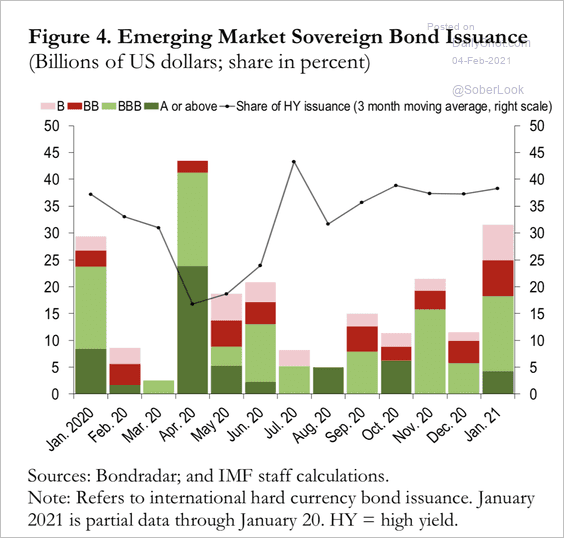 Source: IMF Read full article
9. Fund flows have been robust.
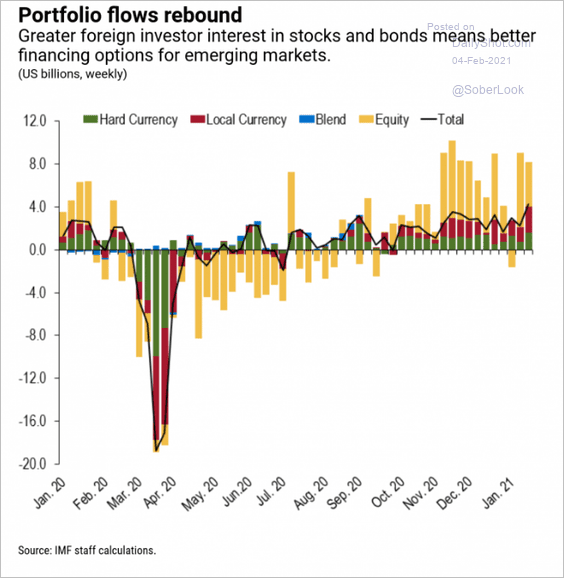 Source: IMF Read full article
10. EM earnings-per-share have been flat over the past decade, while non-financial companies’ return on assets plunged.
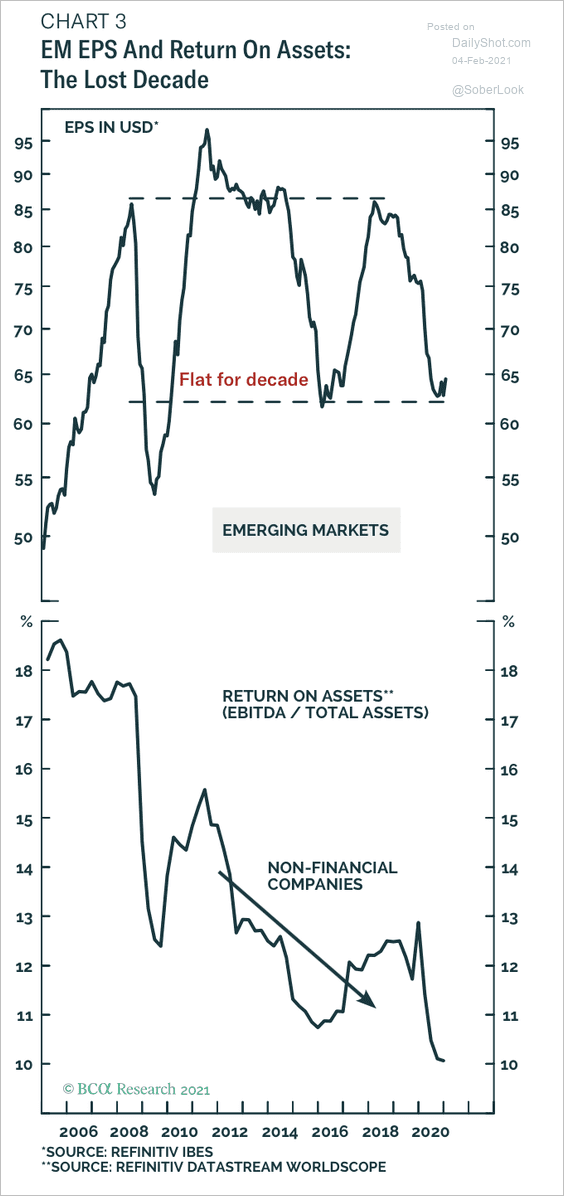 Source: BCA Research
Back to Index
Cryptocurrency
1. Ethereum’s outperformance has been impressive.
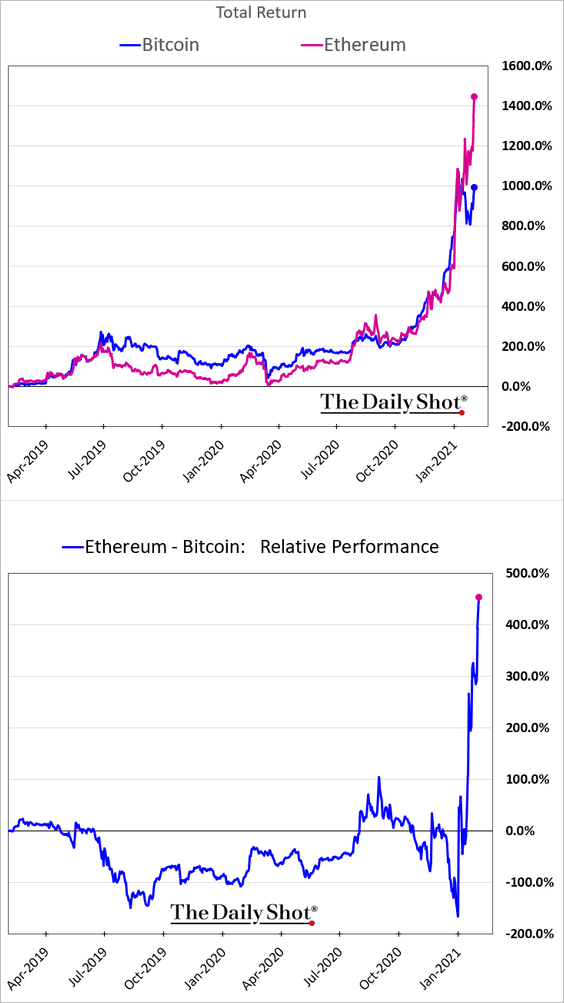 h/t @ossingerj
2. Bitcoin miners saw revenues surge over the past month, driven by higher network fees.
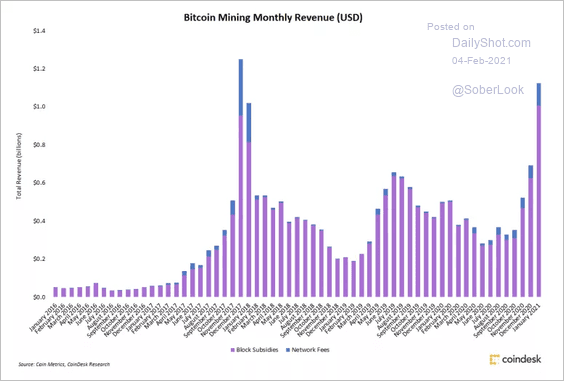 Source: CoinDesk Read full article
Back to Index
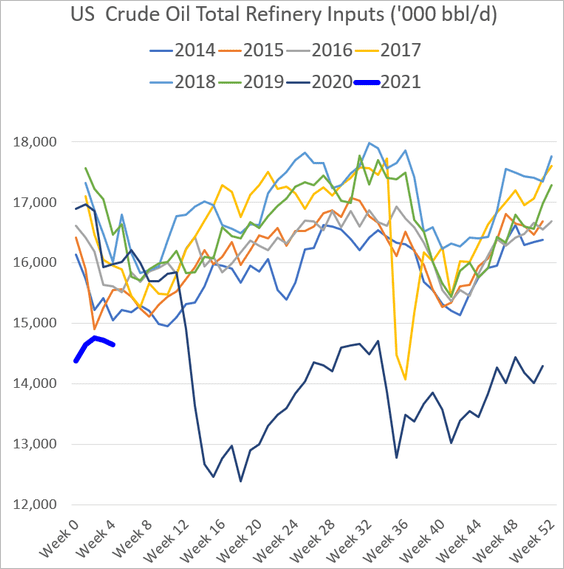
Energy
1. US gasoline demand remains soft for this time of the year.
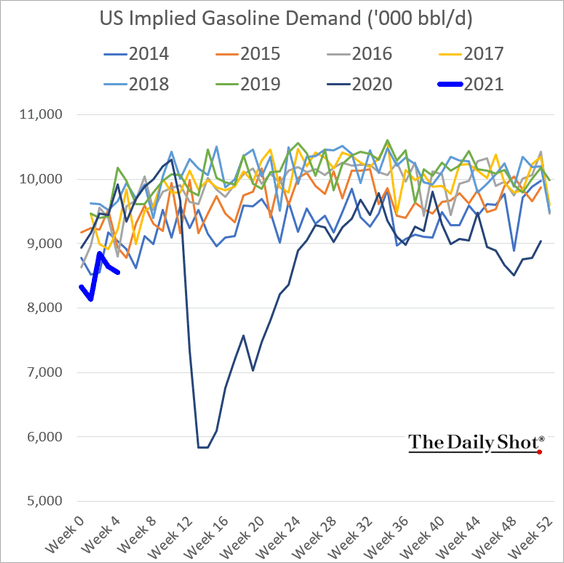
Refinery inputs are also relatively weak.
——————–
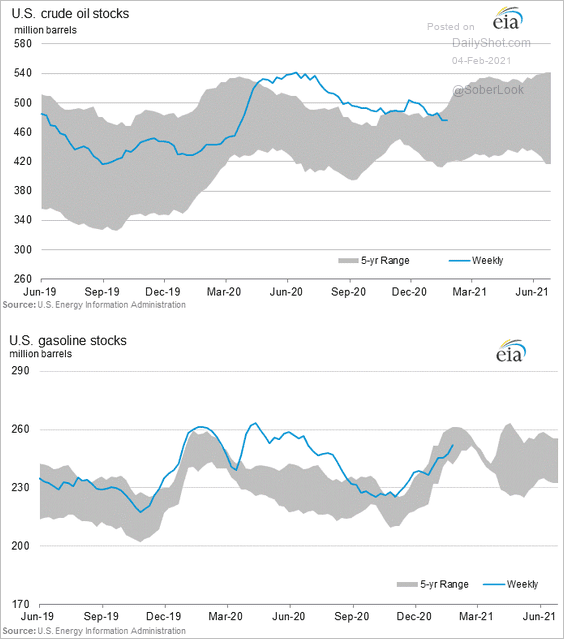
2. US crude oil and gasoline stockpiles are back inside the five-year range.
3. Fitch expects Brent prices to average around $53 per barrel this year, with risks skewed heavily to the upside
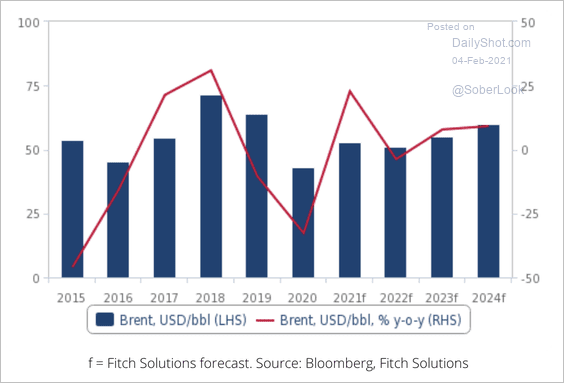 Source: Fitch Solutions Macro Research
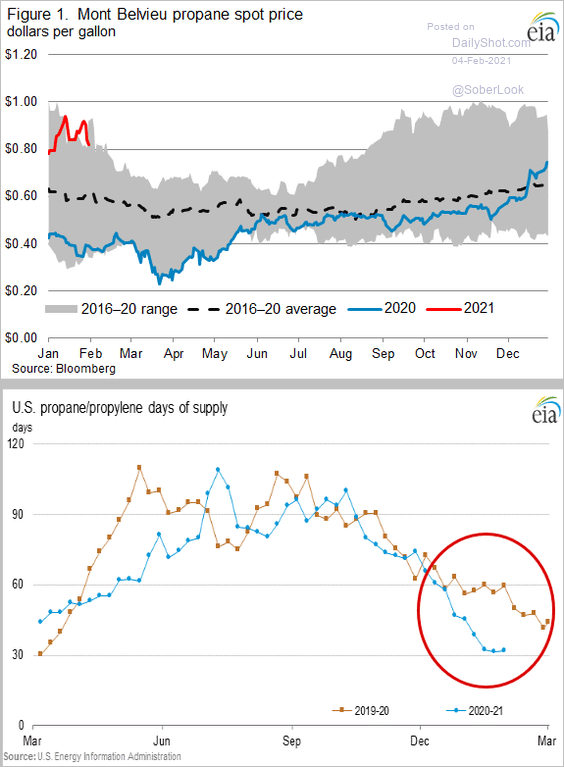
4. US propane prices are elevated as stockpiles drop well below last year’s levels.
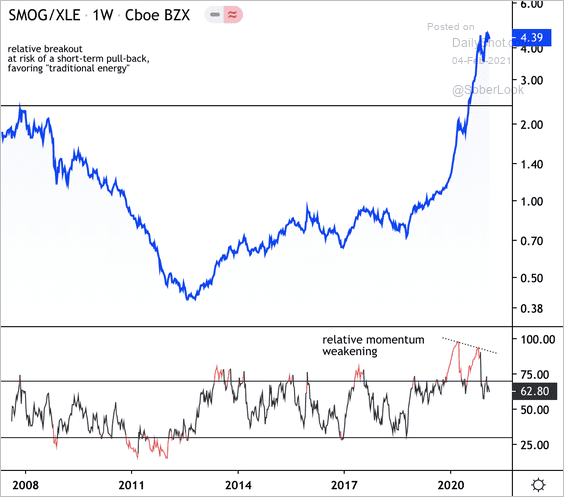
5. Technicals show the VanEck Low Carbon Energy ETF (SMOG), which holds low-carbon energy and electric vehicle companies, is at risk of a pull-back relative to the SPDR Energy ETF (XLE).
 Source: Dantes Outlook
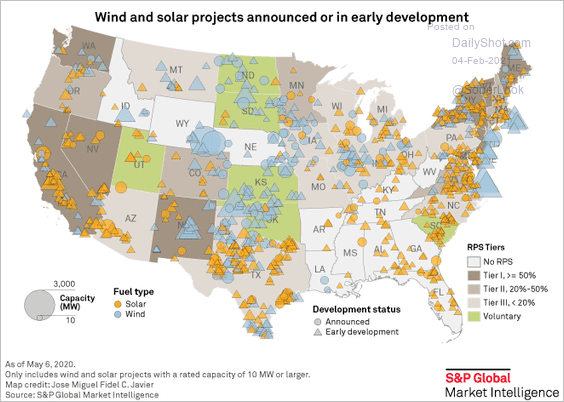
6. Here is the distribution of wind and solar projects in the US.
 Source: S&P Global Market Intelligence
Back to Index
Equities
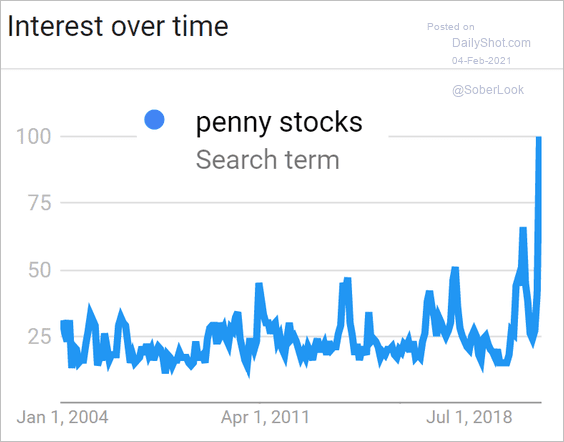
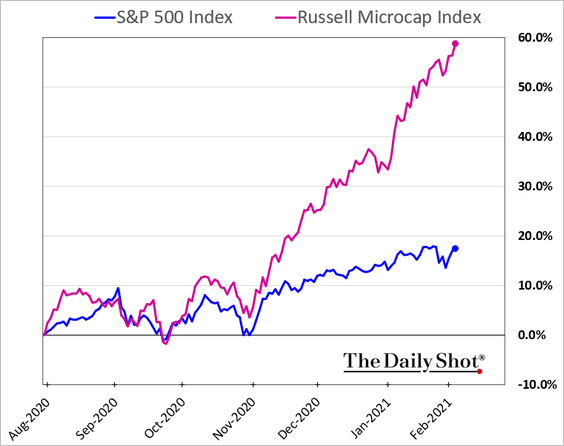
1. The Reddit crowd loves penny stocks.
 Source: @markets Read full article
This chart shows search activity for “penny stocks” on Google.
 Source: Google Trends
And here is the Russell Microcap Index.
——————–
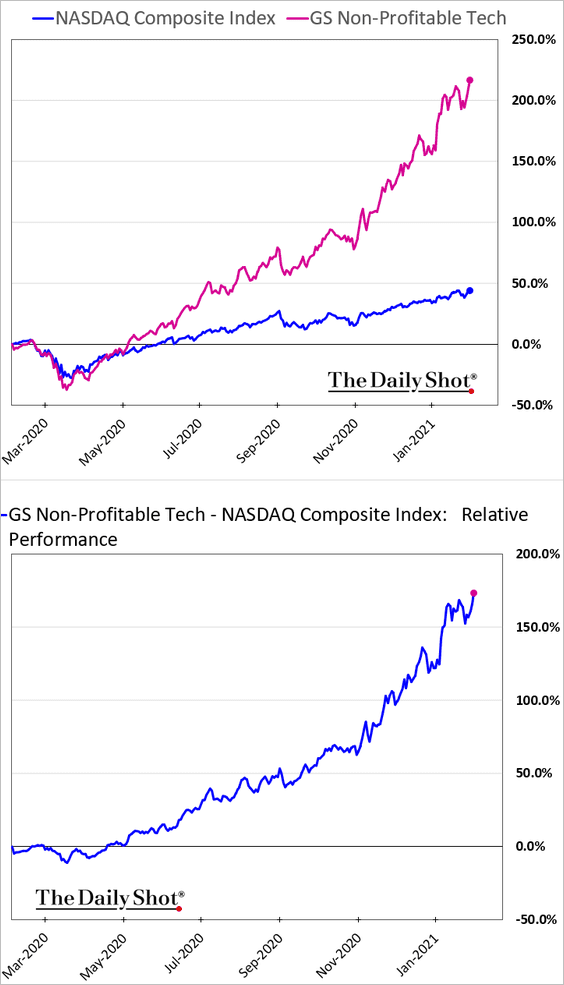
2. Related to the above, this is the relative performance of Goldman’s Non-Profitable Tech Index.
3. And here is the S&P Kensho Moonshots Index (50 most “innovative” companies).
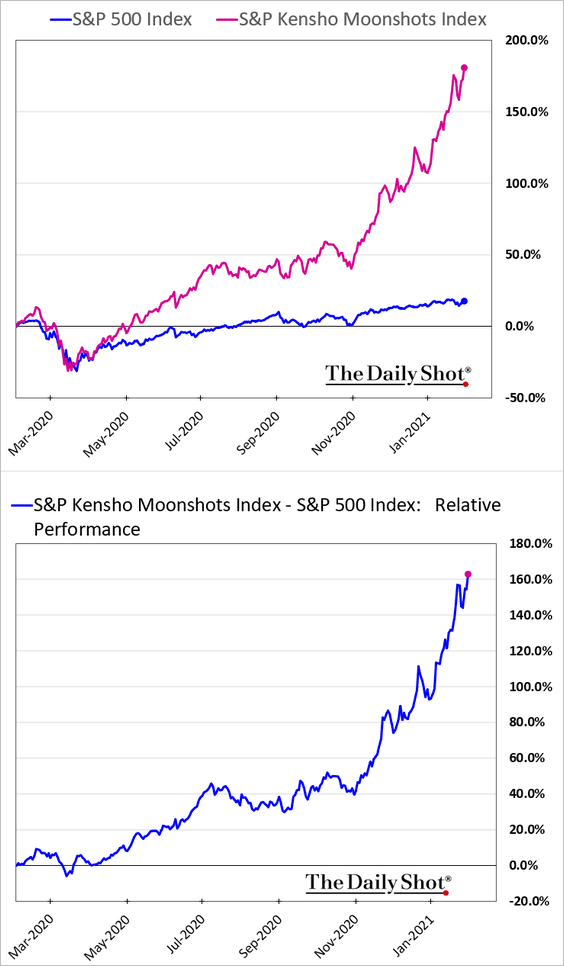 h/t Chris Bennett, S&P Dow Jones Indices
4. Who are the Reddit/Robinhood day traders?
• Demographics:
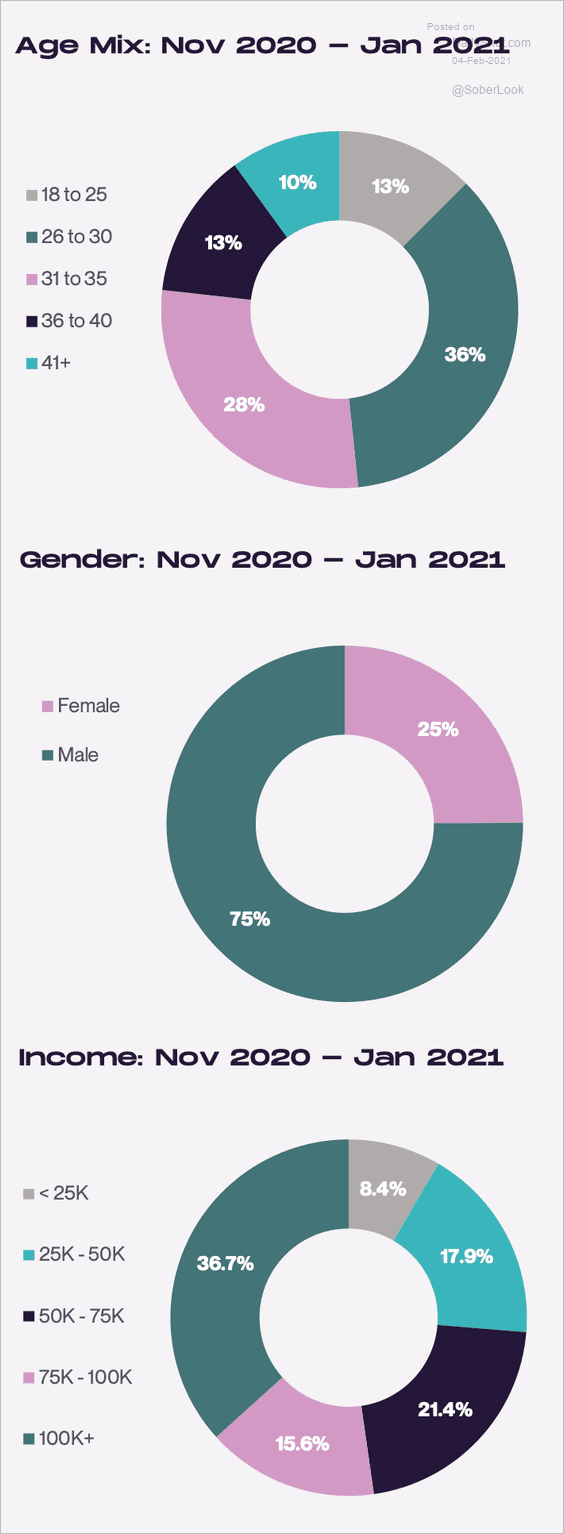 Source: Cardify
• Experience:
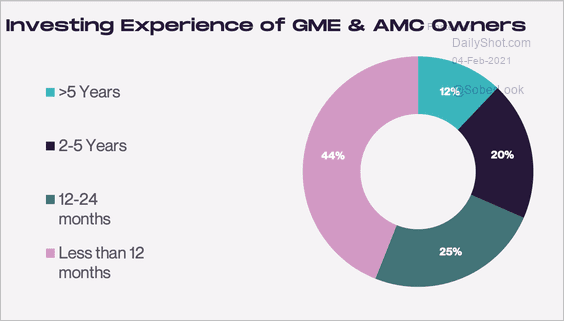 Source: Cardify
• Motivations:
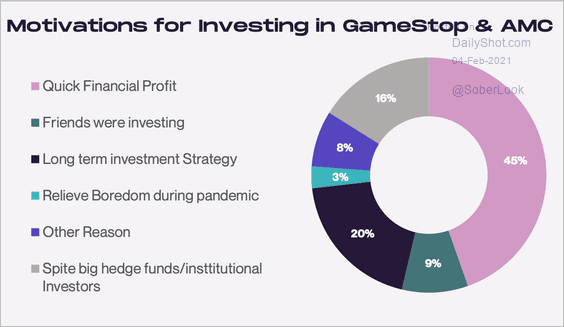 Source: Cardify
——————–
5. Below is the BofA’s sentiment indicator.
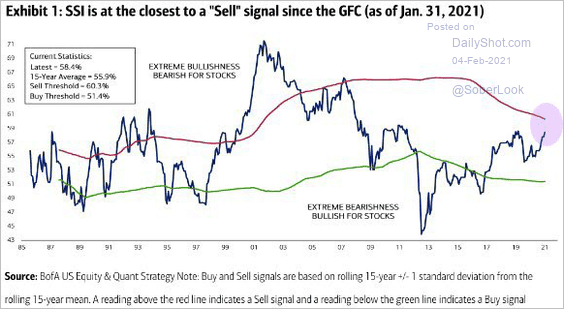 Source: @LizAnnSonders, @BankofAmerica
6. Let’s revisit this chart showing the percentage of stocks beating the S&P 500.
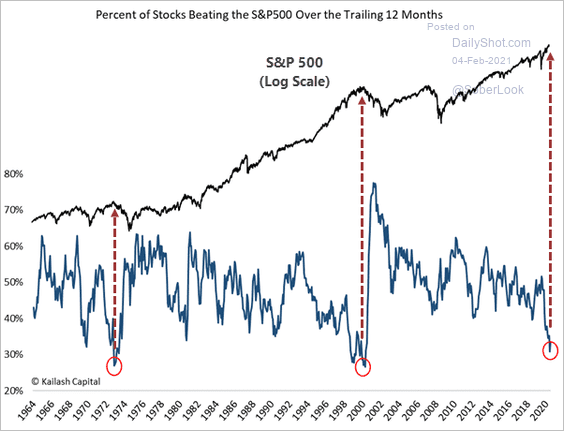 Source: @sentimentrader Read full article
7. Growth in margin debt over the past year has been spectacular.
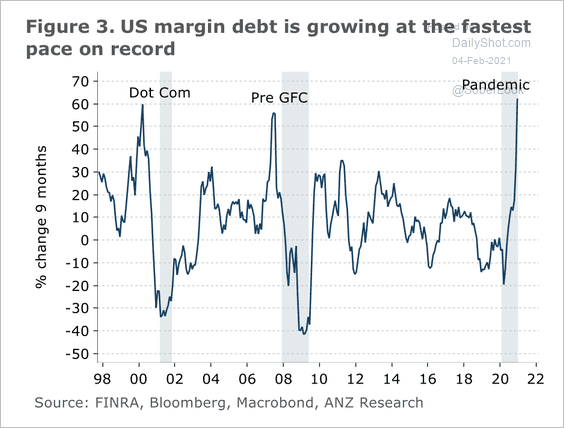 Source: ANZ Research
8. S&P 500 value and dividend factors outperformed last month.
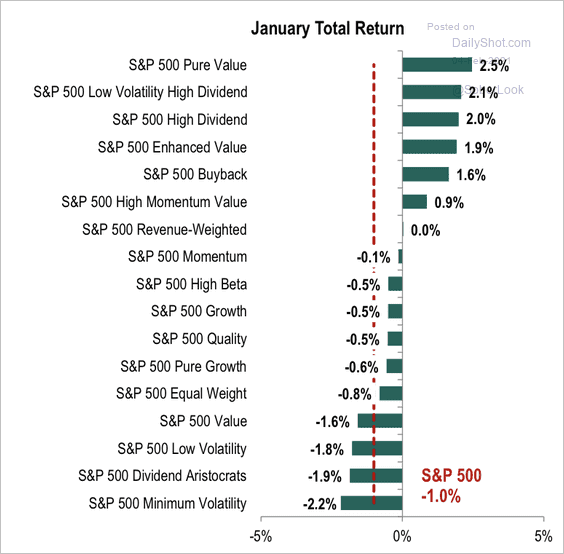 Source: S&P Global Market Intelligence
Here is a look at risk and return across factors over the past 15-years.
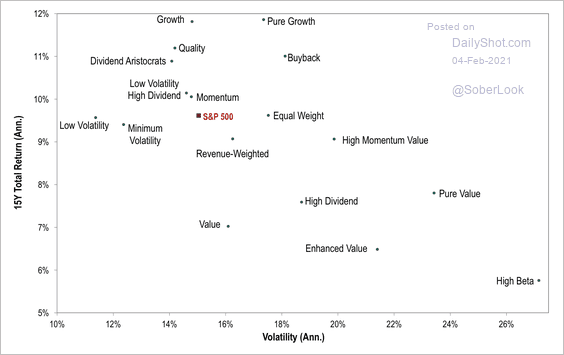 Source: S&P Global Market Intelligence
——————–
9. Finally, this chart shows Q4 revisions to consensus by sector.
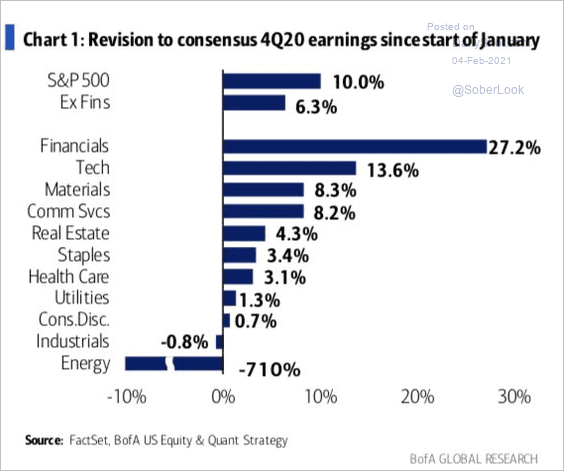 Source: BofA Global Research, @WallStJesus
Back to Index
Credit
1. This scatterplot shows spreads vs. risk for select fixed income markets.
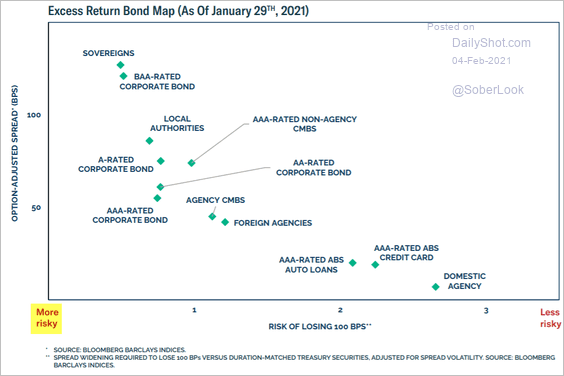 Source: BCA Research
2. Spreads between A2/P2 and AA commercial paper rates have collapsed, indicating complacency in the market.
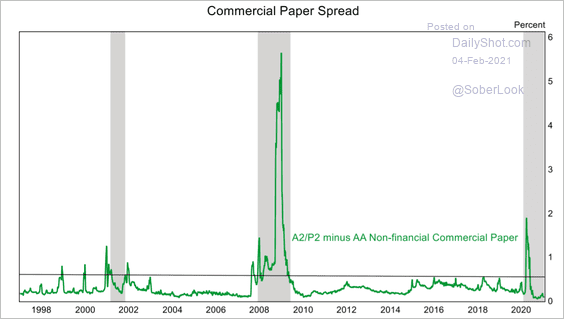 Source: Mizuho Securities USA
3. Underwriting standards for commercial real estate loans continue to tighten.
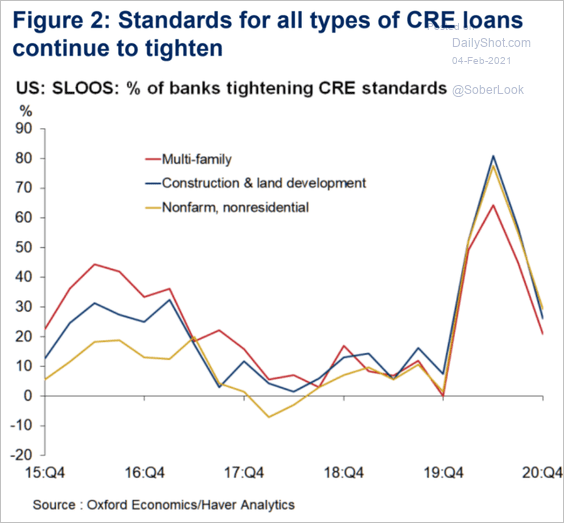 Source: Oxford Economics
Back to Index
Rates
1. The 10yr US inflation swap rate is at resistance.
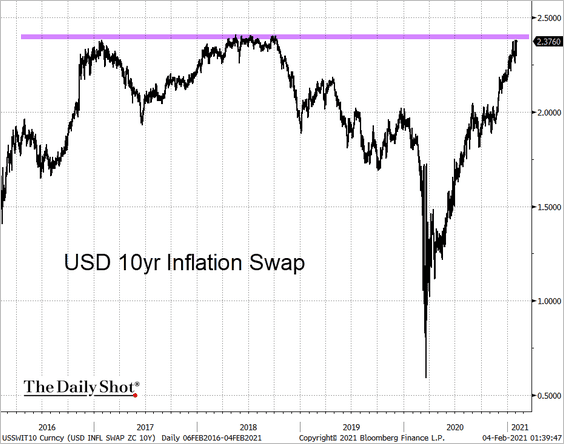 Source: @TheTerminal, Bloomberg Finance L.P.
2. Powell’s FOMC has more consensus than the committees chaired by his predecessors.
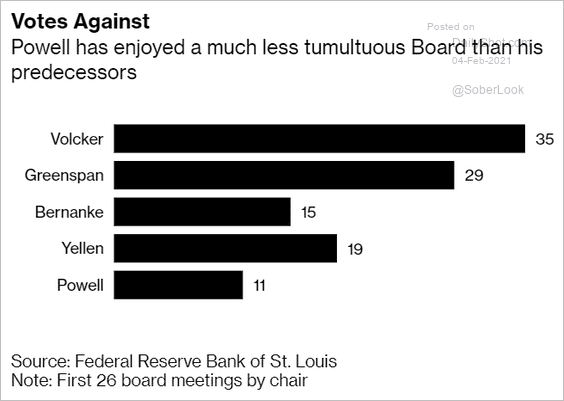 Source: @markets Read full article
——————–
Food for Thought
1. US manufacturing employment:
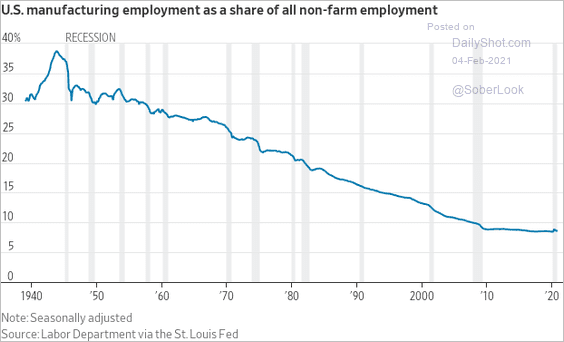 Source: @jeffsparshott
2. $15/hour as a share of median hourly wage:
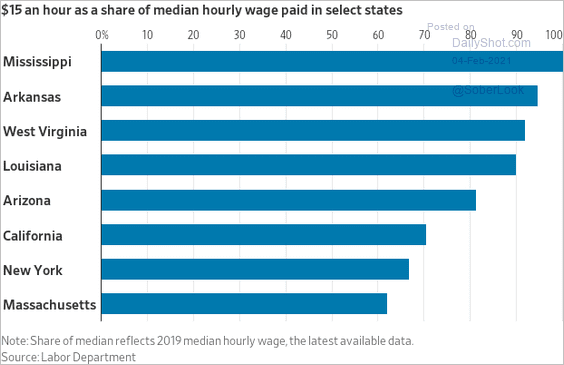 Source: @WSJ Read full article
3. Internet access:
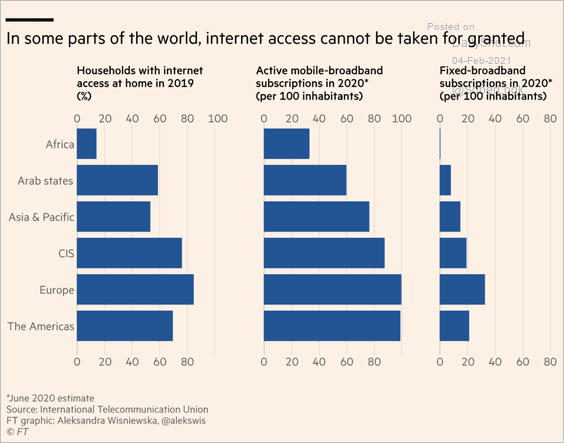 Source: @financialtimes Read full article
4. Big Tech profits:
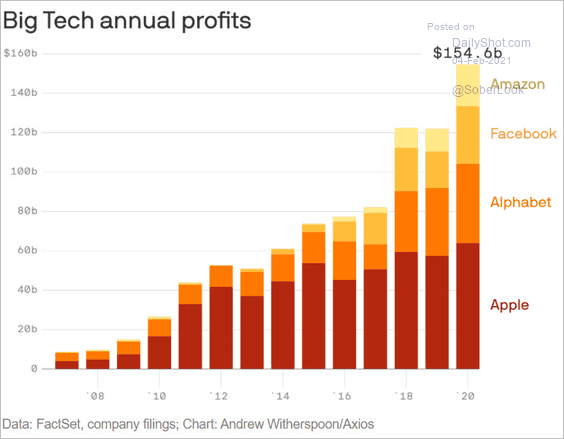 Source: @axios Read full article
5. US presidents’ Wikipedia page edits:
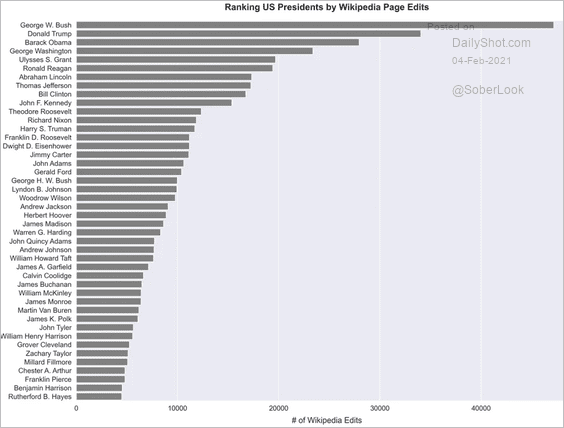 Source: Data Is Beautiful
6. US electoral maps going back to the beginning of the republic:
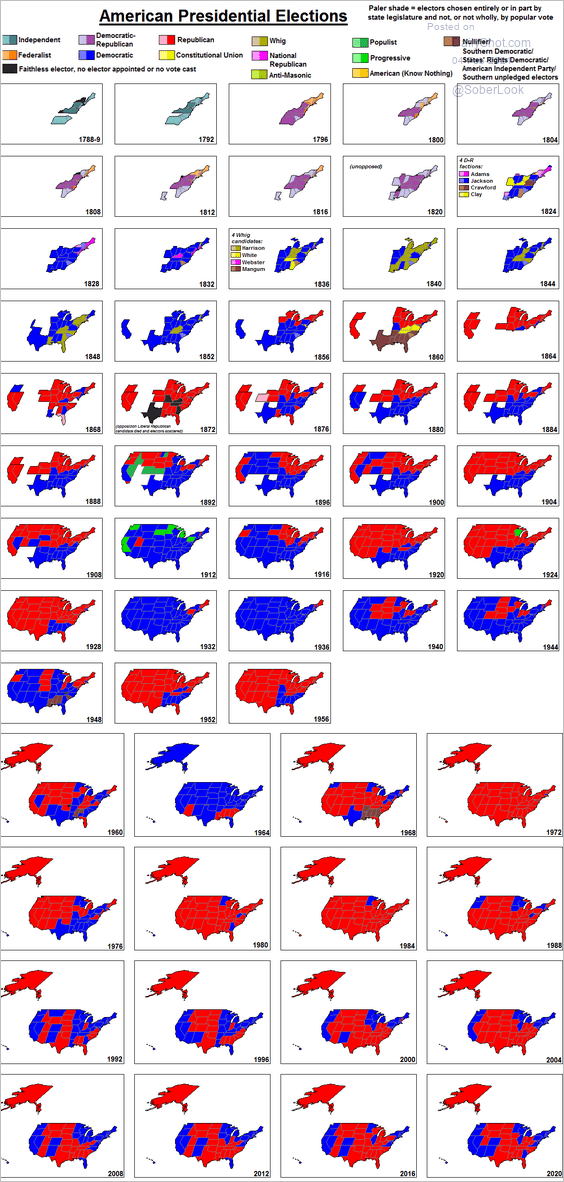 Source: T. W. Anderson
7. Executive actions:
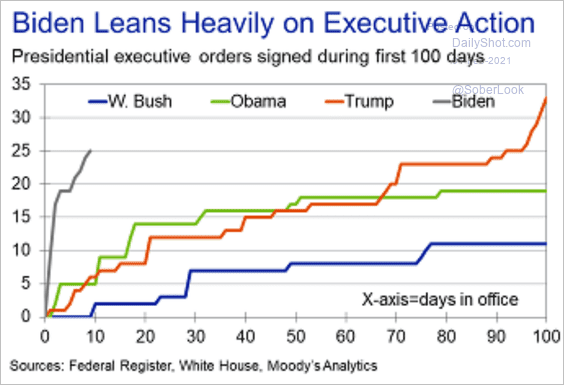 Source: Moody’s Analytics
8. Vaccinations by state:
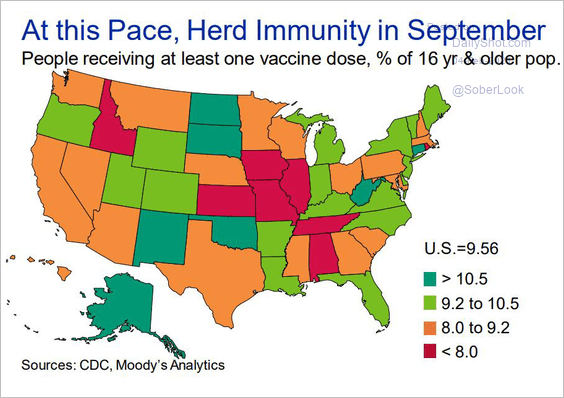 Source: Moody’s Analytics
9. Average annual snowfall:
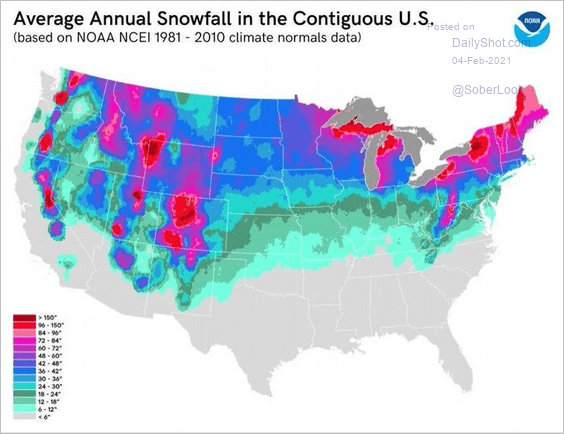 Source: @simongerman600 Read full article
——————–
Back to Index