
The Daily Shot: 24-Mar-21
• The United States
• Canada
• The United Kingdom
• Asia – Pacific
• Emerging Markets
• Commodities
• Energy
• Equities
• Rates
• Global Developments
• Food for Thought
The United States
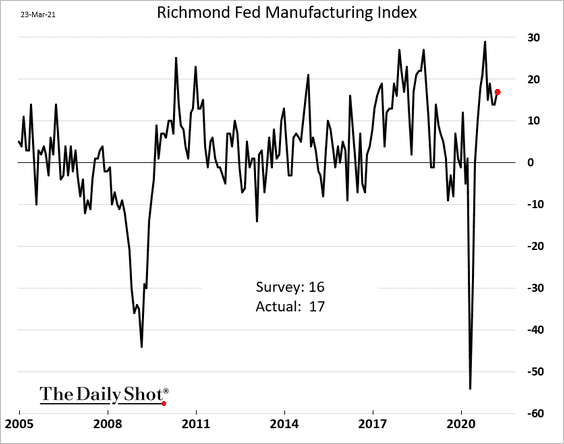
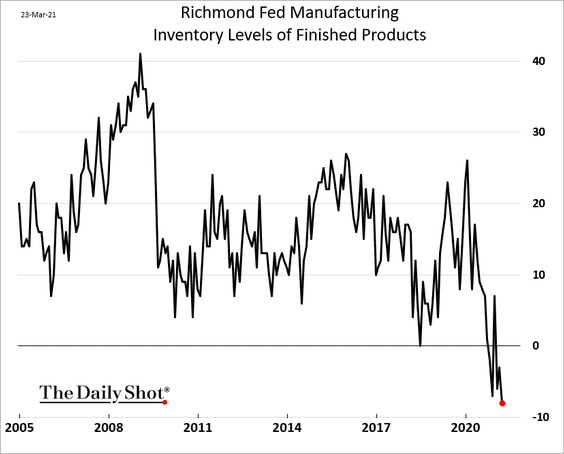
The Richmond Fed’s manufacturing index continues to show strength in the region’s factory activity.
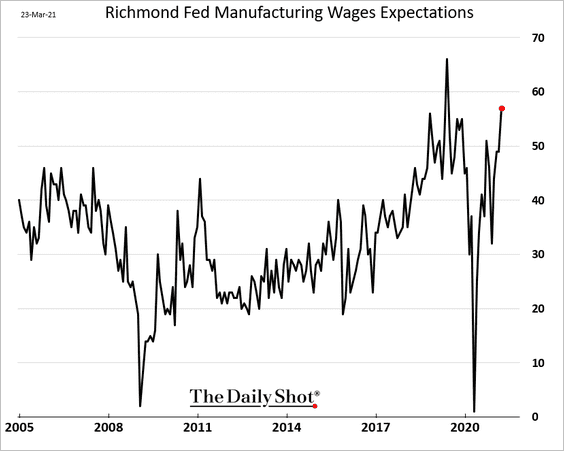
Manufacturers anticipate boosting wages amid worker shortages.
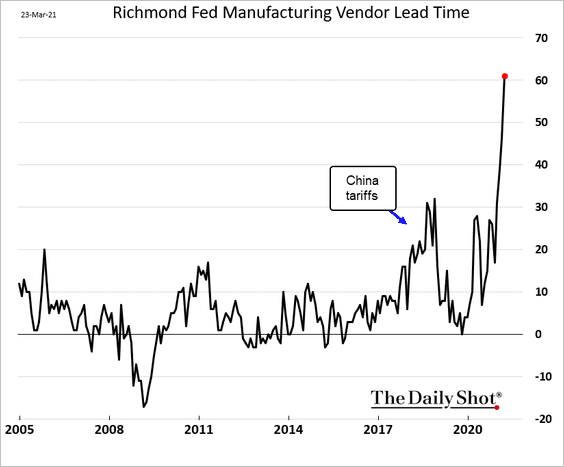
The Richmond report also illustrates the supply chain issues that many factories have been facing across the country.
• The index of vendor lead times hit the highest level in decades.
• Raw materials inventories are shrinking, …
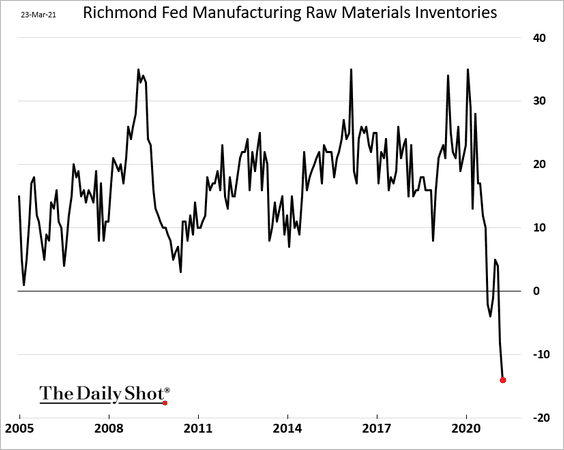
… and so are inventories of finished products.
——————–
2. Unlike other survey-based indicators, the World Economics SMI points to lackluster growth in US business activity.
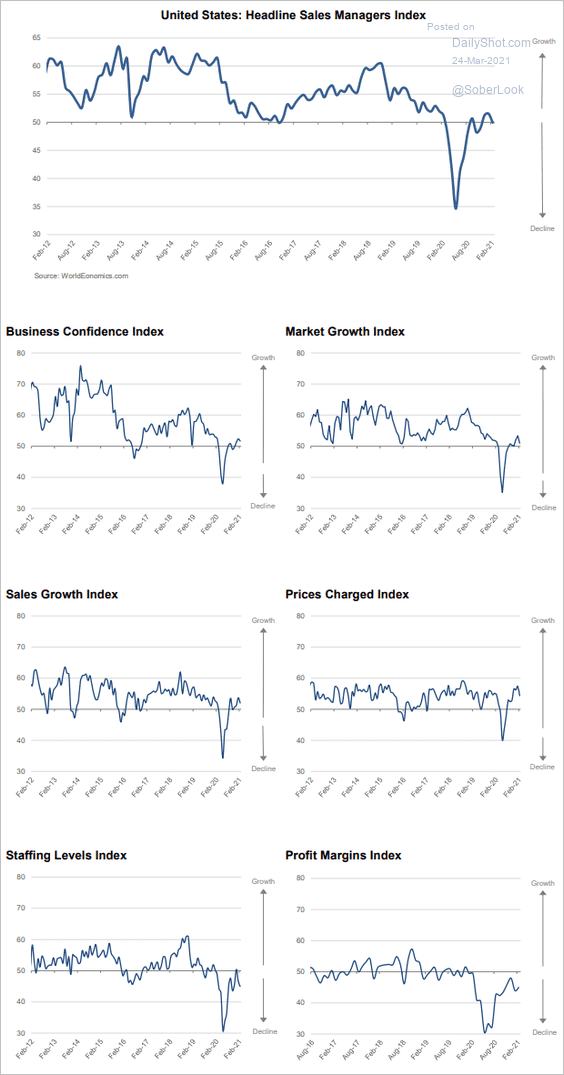 Source: World Economics
3. New home sales weakened last month primarily due to weather.
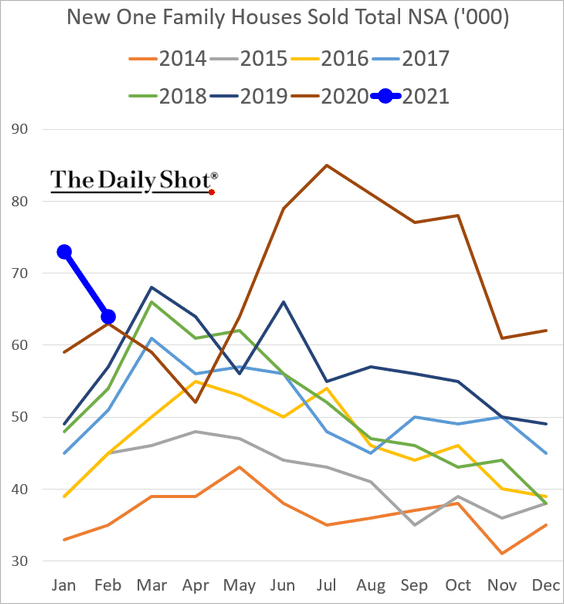
Here is the distribution of sales by price range.
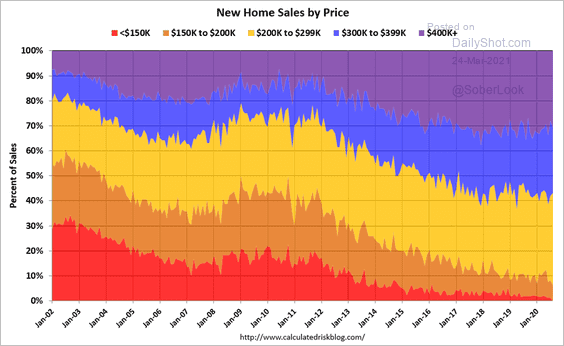 Source: @calculatedrisk Read full article
——————–
4. Next, let’s take a look at some high-frequency indicators.
• The labor market recovery is picking up momentum.
![]() Source: JP Morgan; @MylesUdland
Source: JP Morgan; @MylesUdland
• Consumer sentiment is strengthening.
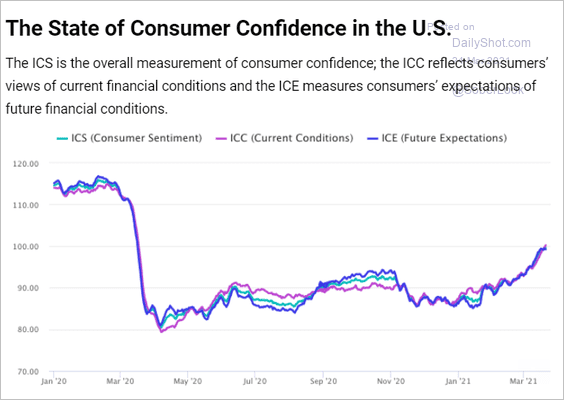 Source: Morning Consult Read full article
• Credit/debit card data point to an acceleration in consumer spending.
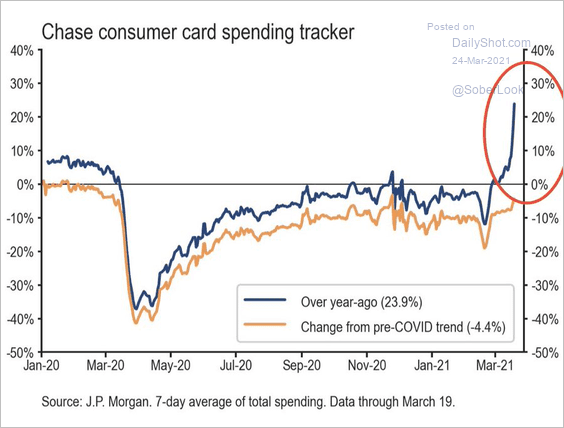 Source: JP Morgan; @carlquintanilla
• Air travel is improving.
 Source: Scotiabank Economics
• Consumers are more comfortable with various social activities, according to an Evercore ISI survey.
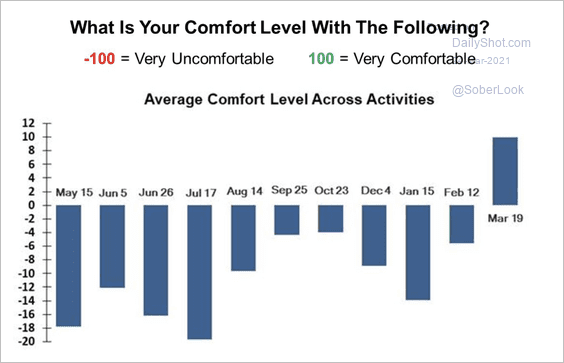 Source: Evercore ISI
• Mobility is rebounding. Here is the breakdown by day of the week.
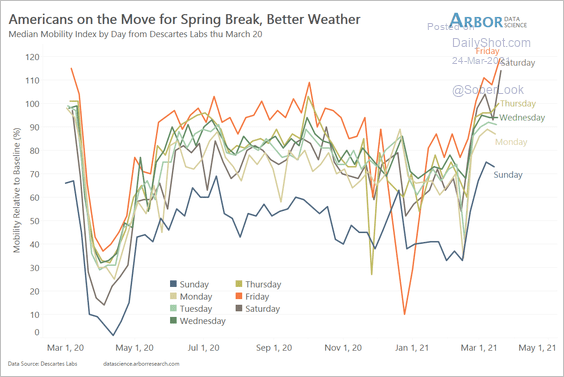 Source: Arbor Research & Trading
——————–
5. This chart shows the composition of US consumer spending (healthcare is 16.7%).
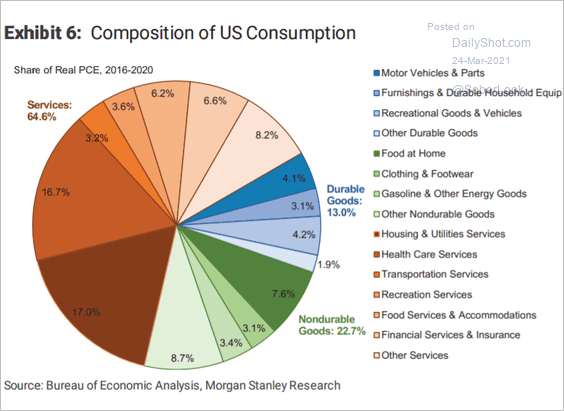 Source: Morgan Stanley Research
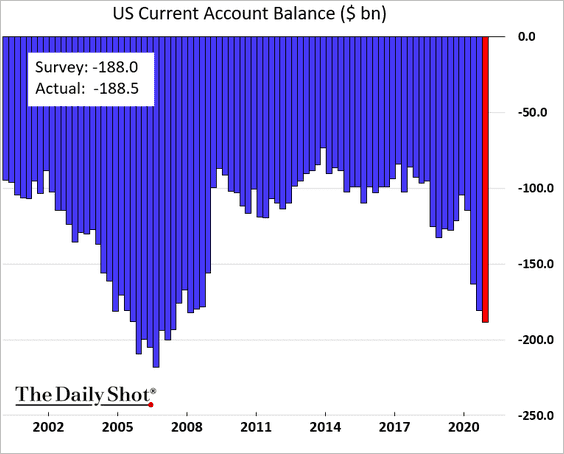
6. The current account deficit hit a 12-year high in Q4.
 Source: Reuters Read full article
Back to Index
Canada
1. The nation’s labor market continues to recover.
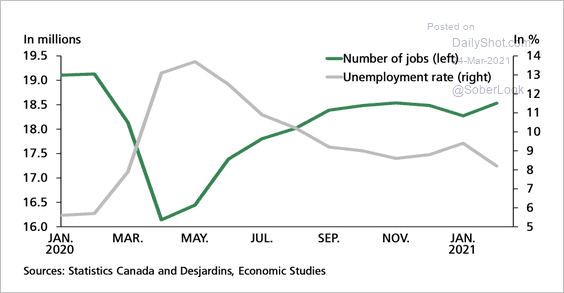 Source: Desjardins
Full-time employment in Nova Scotia is now above pre-pandemic levels.
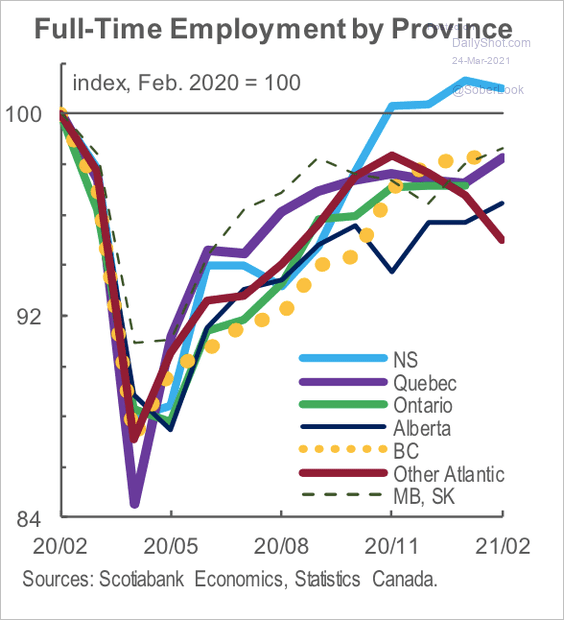 Source: Scotiabank Economics
——————–
2. Desjardins expects real GDP to return to its pre-pandemic level by next summer.
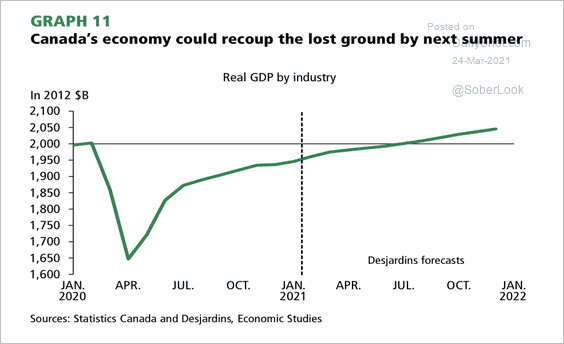 Source: Desjardins
Back to Index
The United Kingdom
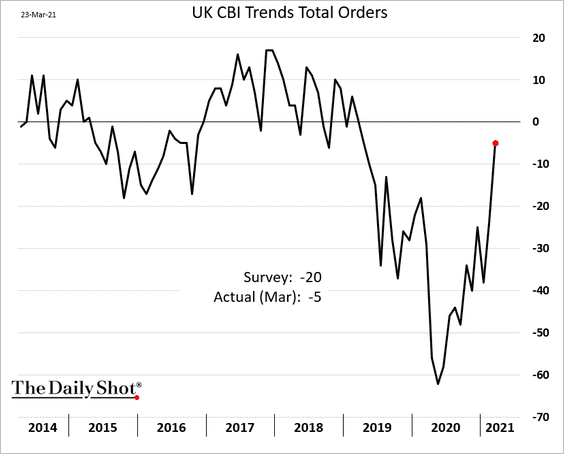
1. The CBI report showed a sharp recovery in industrial orders, which points to a rebound in manufacturing production (2nd chart).
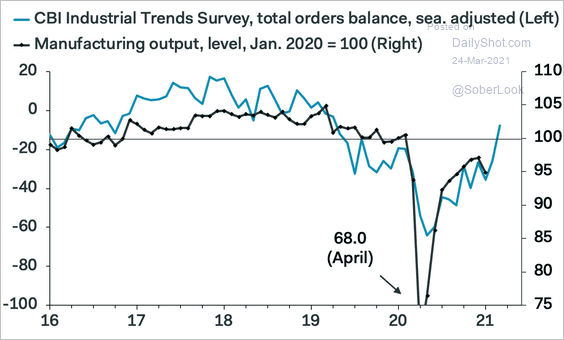 Source: Pantheon Macroeconomics
——————–
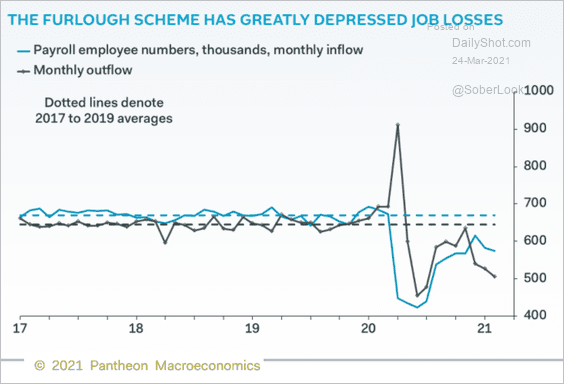
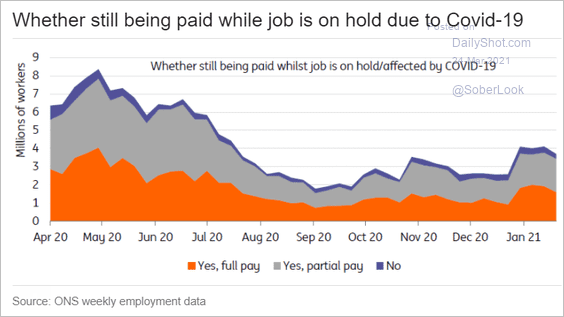
2. The unemployment rate was lower than expected.
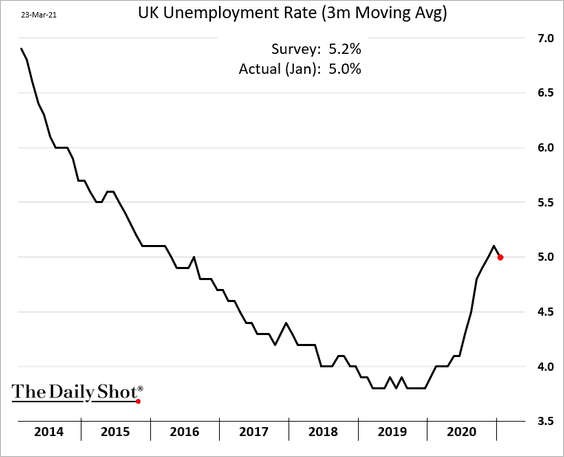
The UK’s furlough program has capped unemployemnt.
 Source: Pantheon Macroeconomics
 Source: ING
As a result, employment has disconnected from GDP.
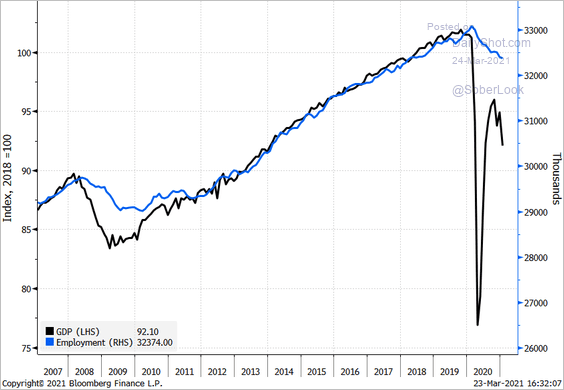 Source: Dan Hanson, @TheTerminal, Bloomberg Finance L.P.
——————–
3. There is also a disconnect between mobility and GDP.
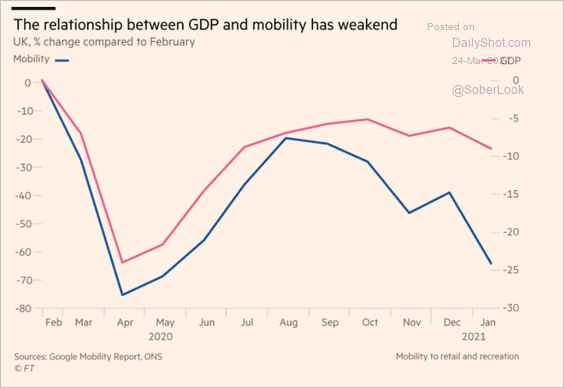 Source: @financialtimes Read full article
4. 2020 was a rough year for the economy.
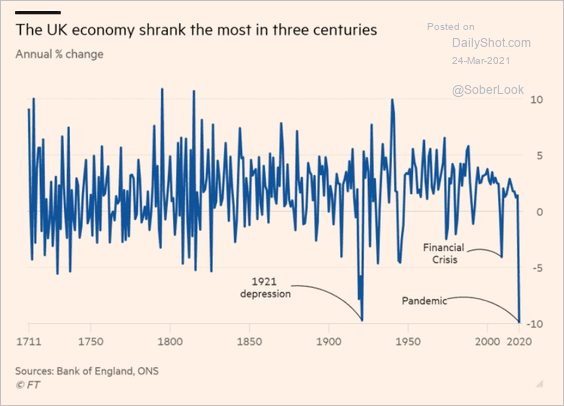 Source: @financialtimes Read full article
5. Fiscal support for households in the UK exceeded that of other European economies.
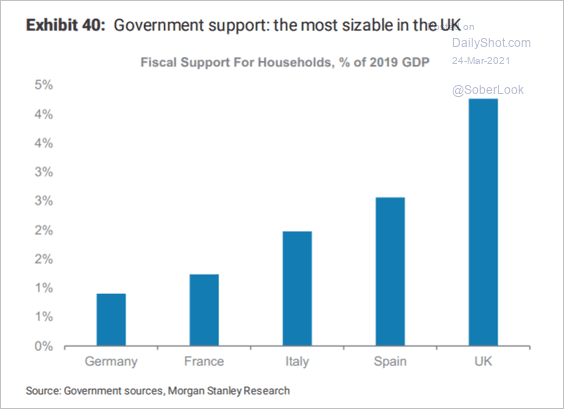 Source: Morgan Stanley Research
6. This chart shows the composition of UK consumer spending.
 Source: Morgan Stanley Research
Back to Index
Asia – Pacific
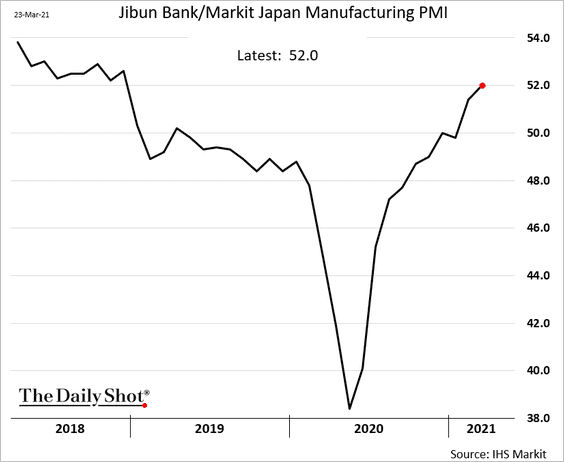
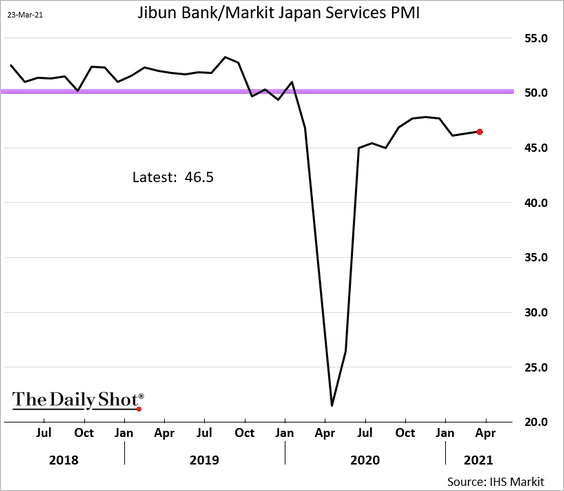
1. The divergence between Japan’s manufacturing and service business growth persists.
——————–
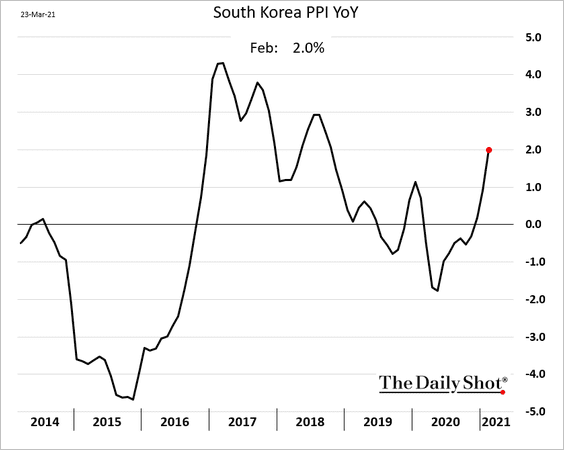
2. South Korea’s producer prices are rebounding.
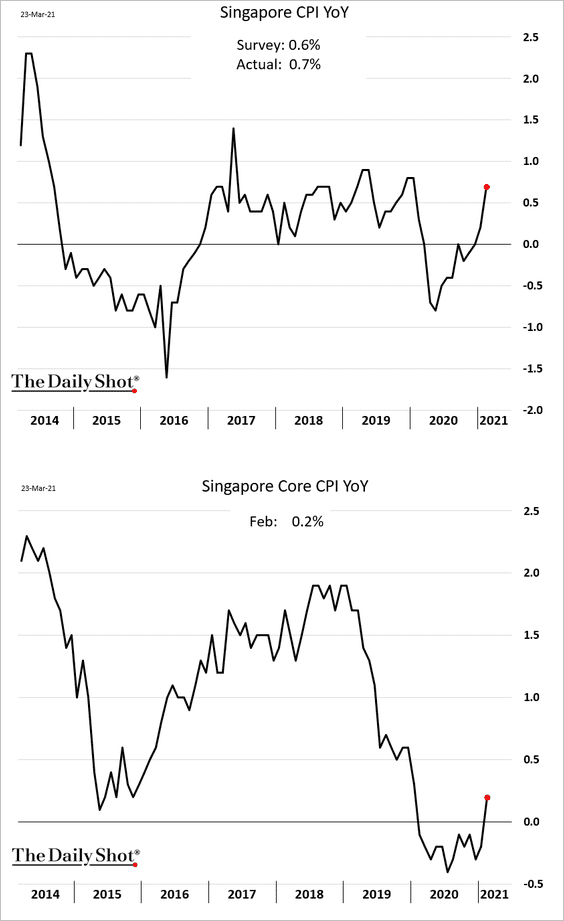
3. Singapore’s CPI is back at pre-COVID levels.
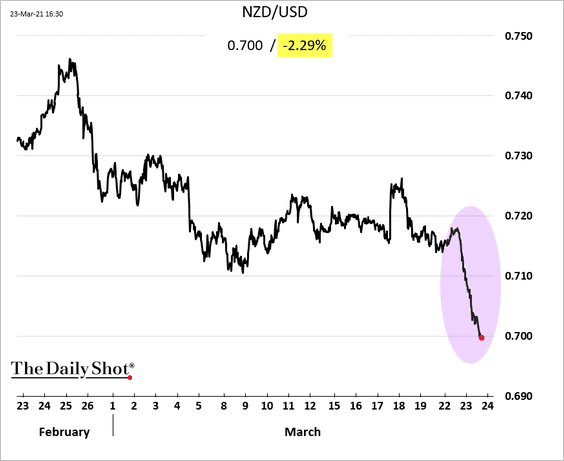
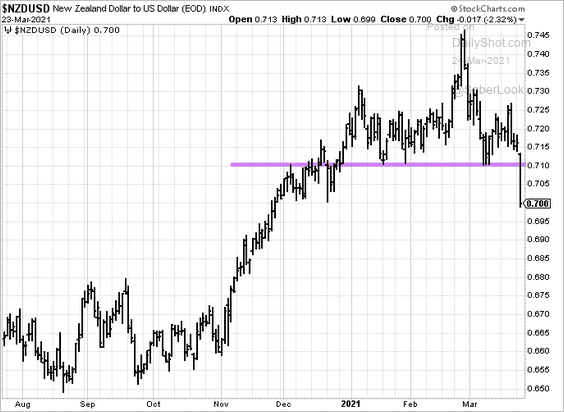
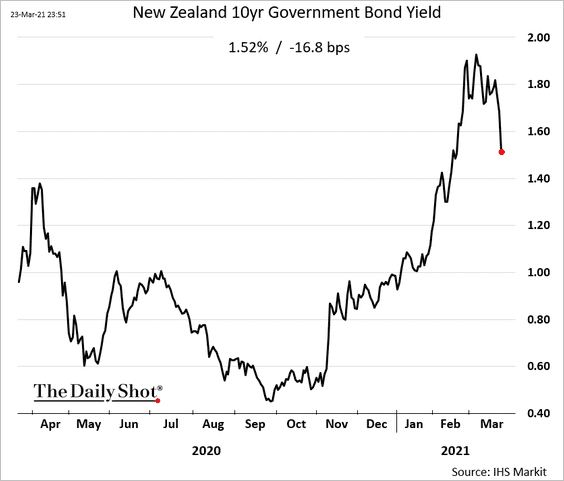
4. New Zealand’s government is taking measures to cool the housing market.
 Source: Bloomberg Read full article
As a result, the RBNZ is expected to be less hawkish, which sent the Kiwi dollar and bond yields sharply lower.
——————–
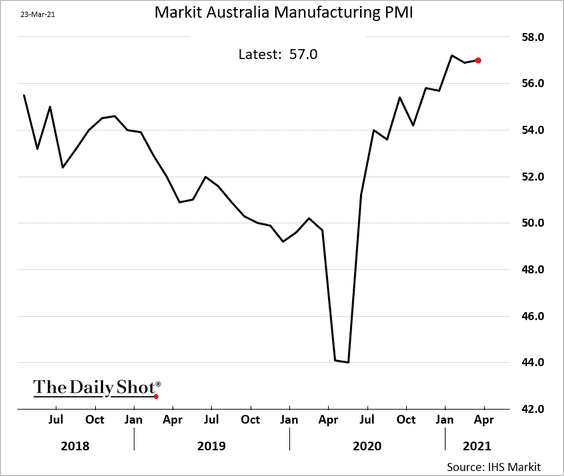
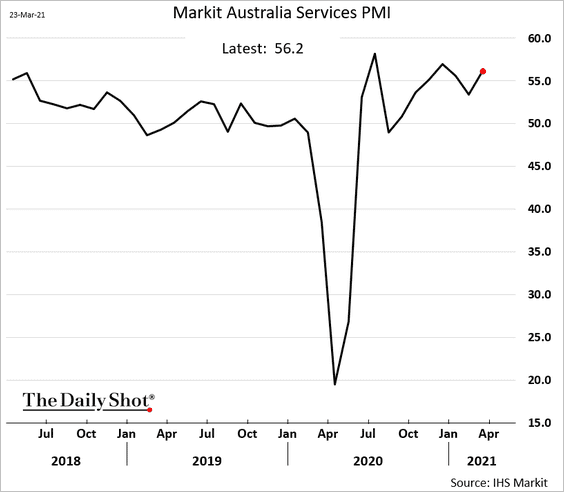
5. Australia’s business activity continues to expand at a solid pace.
• Manufacturing PMI:
• Services PMI:
Economists have been upgrading their growth forecasts.
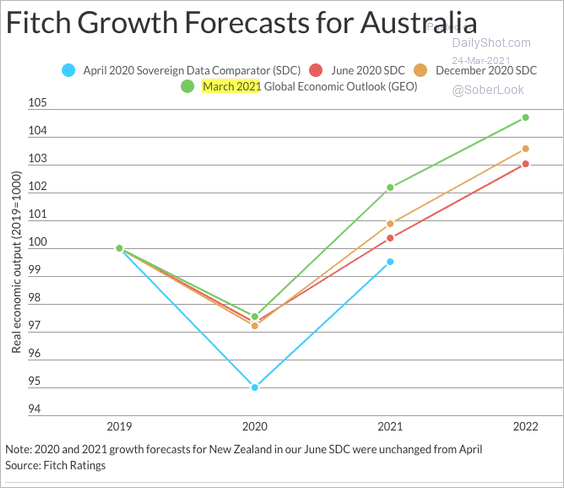 Source: Fitch Ratings
Back to Index
Emerging Markets
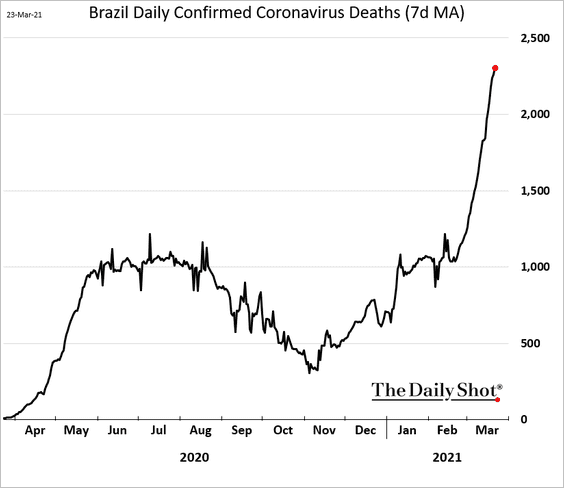
1. Brazil’s health situation continues to deteriorate.
 Source: Reuters Read full article
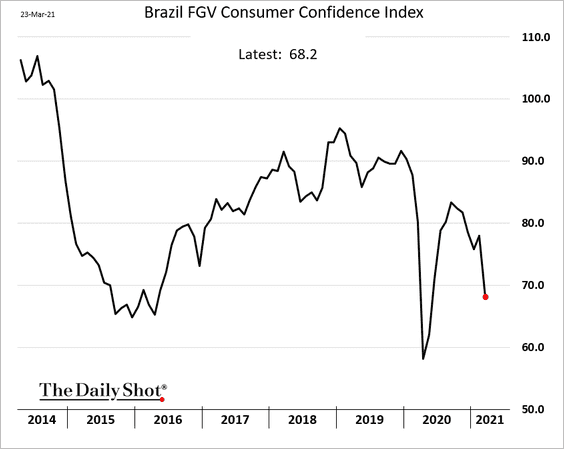
Consumer confidence slumped.
——————–
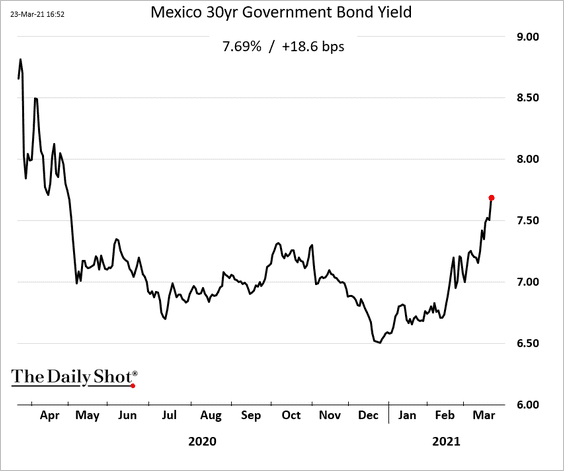
2. Mexico’s bond yields keep climbing.
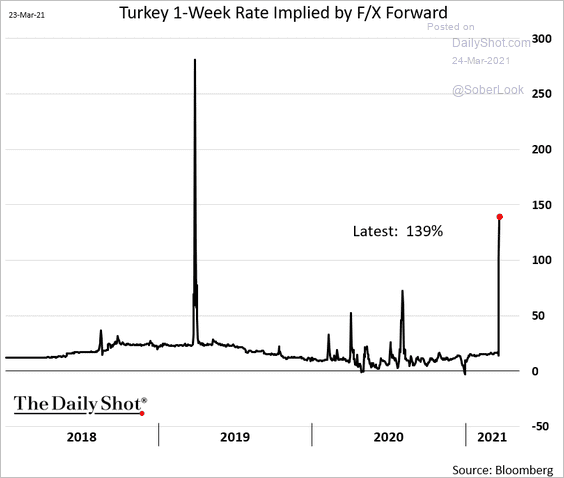
3. The selloff in Turkish debt markets continues.
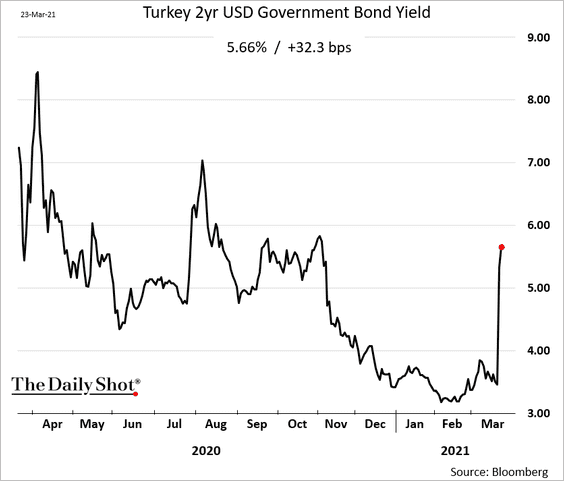
F/X-implied short-term Turkish rates spiked, driven in part by investors’ attempts to hedge lira exposure.
 h/t @SriniSivabalan, @markets
Turkey’s F/X reserves were just starting to recover.
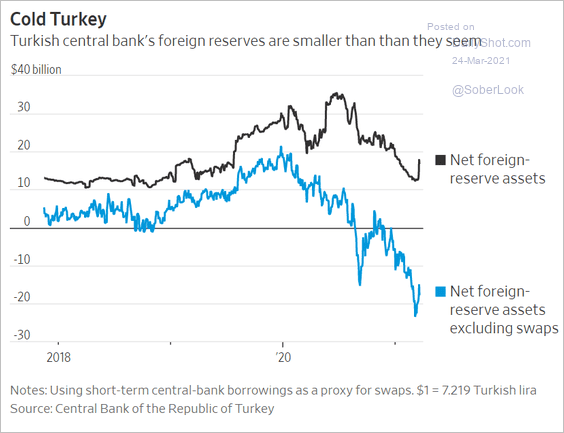 Source: @WSJ Read full article
——————–
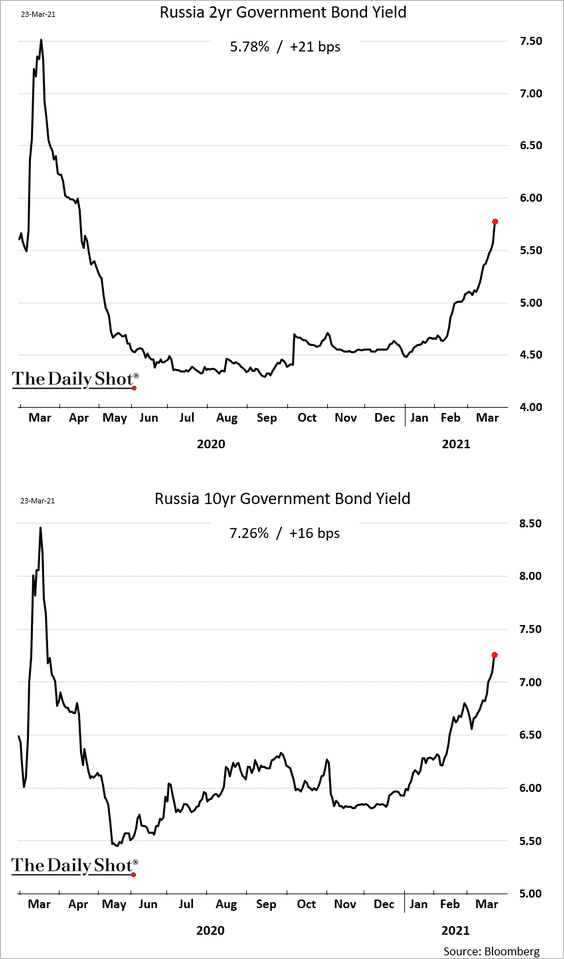
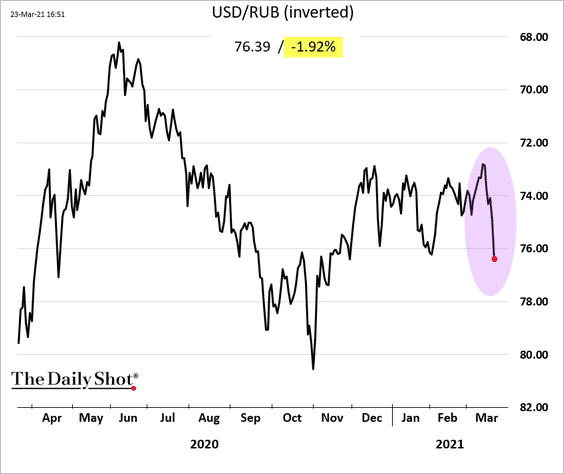
4. Russian bonds and the ruble remain under pressure due in part to sanctions risk and softer oil prices.
——————–
5. Markets expect South Africa’s central bank to raise rates this year.
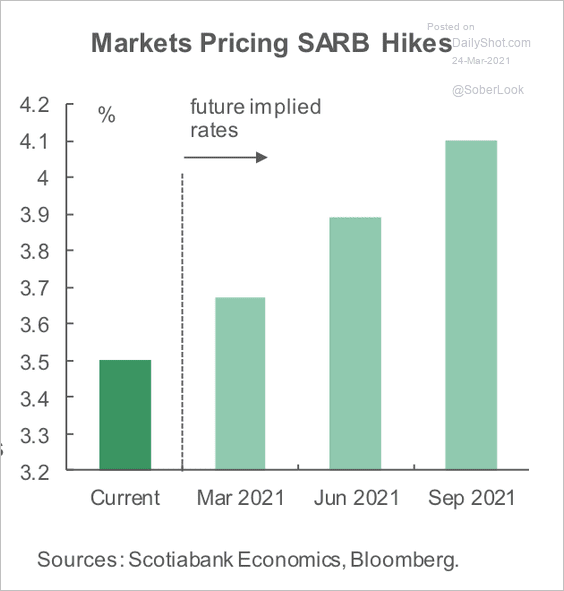 Source: Scotiabank Economics
6. EM sovereign spreads are factoring in an optimistic scenario for oil prices.
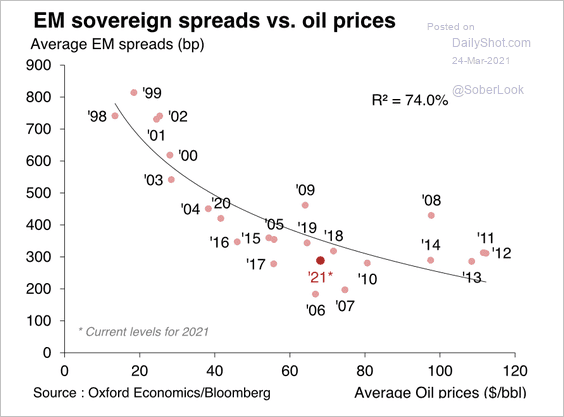 Source: Oxford Economics
Oxford Economics expects EM sovereign spreads to widen.
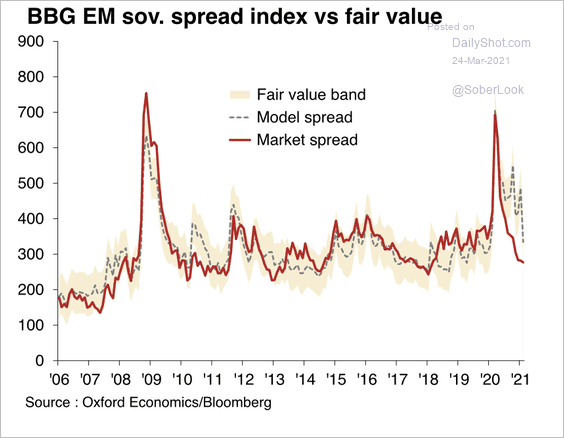 Source: Oxford Economics
——————–
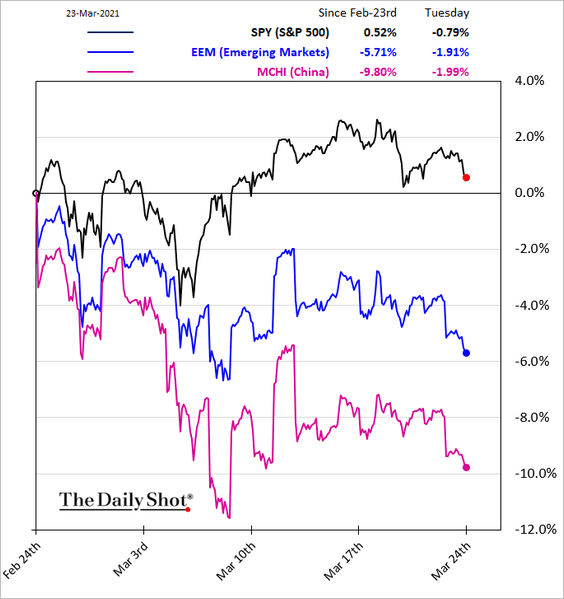
7. EM stocks have underperformed this month in dollar terms.
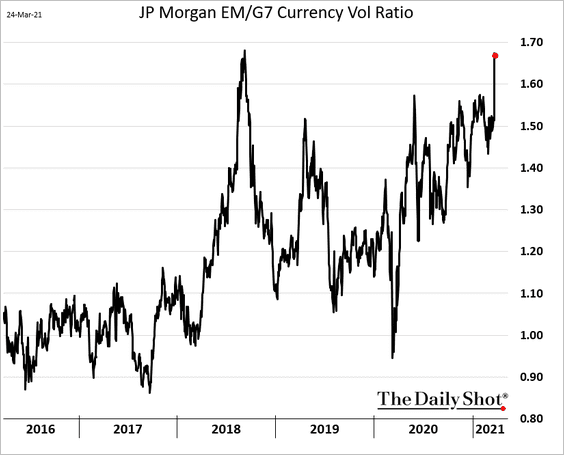
8. EM currency implied volatility has been climbing relative to G7 currencies. Turkey caused the latest spike in this ratio.
Back to Index
Commodities
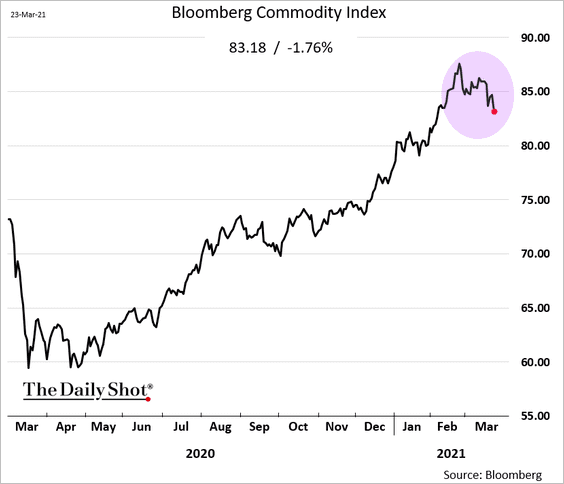
1. The rally in commodities has stalled.
2. Technicals suggest that gold is oversold.
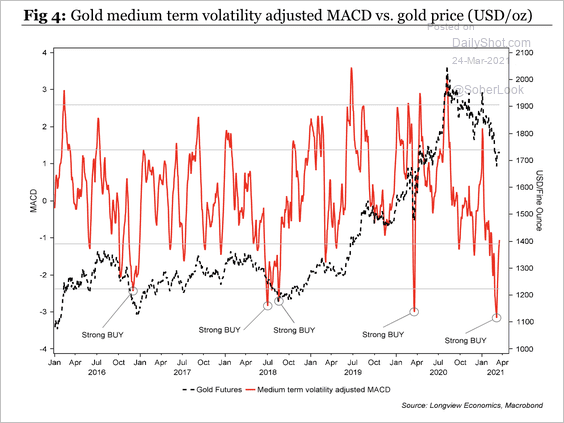 Source: Longview Economics
Back to Index
Energy
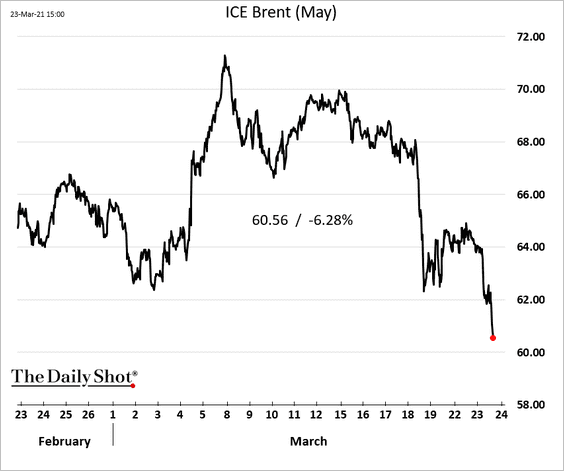
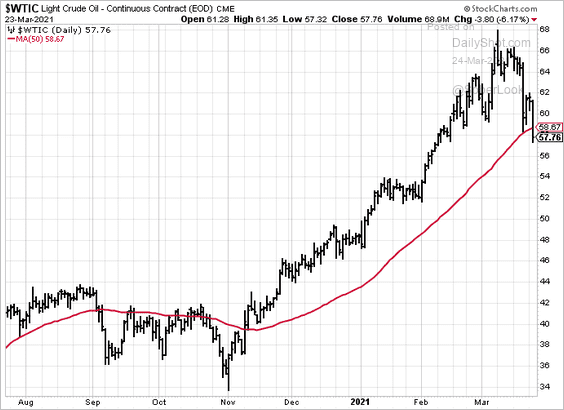
1. Oil sold off on Tuesday.
WTI futures broke below the 50-day moving average.
 h/t @jessicaisummers, @markets
——————–
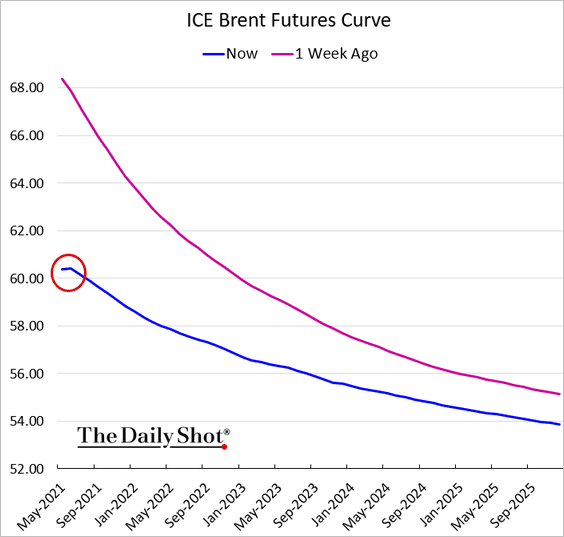
2. The front end of the Brent curve shifted into contango (positive-sloping).
3. Oil demand and global growth are unlikely to catch up to the pre-pandemic trajectory.
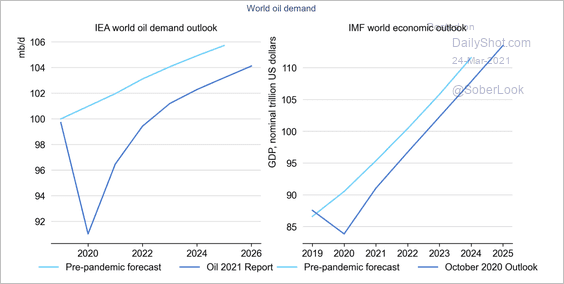 Source: IEA
4. Which countries will contribute most to global growth in biofuels production?
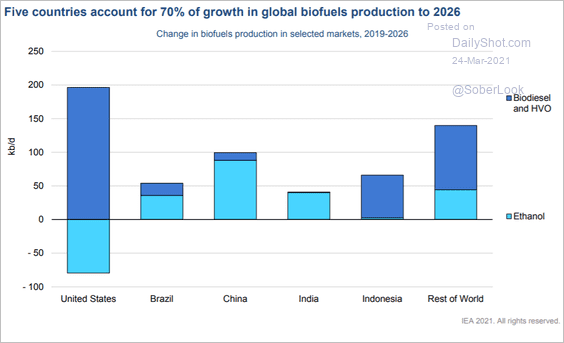 Source: IEA
Back to Index
Equities
1. Small caps have been under pressure in recent days.
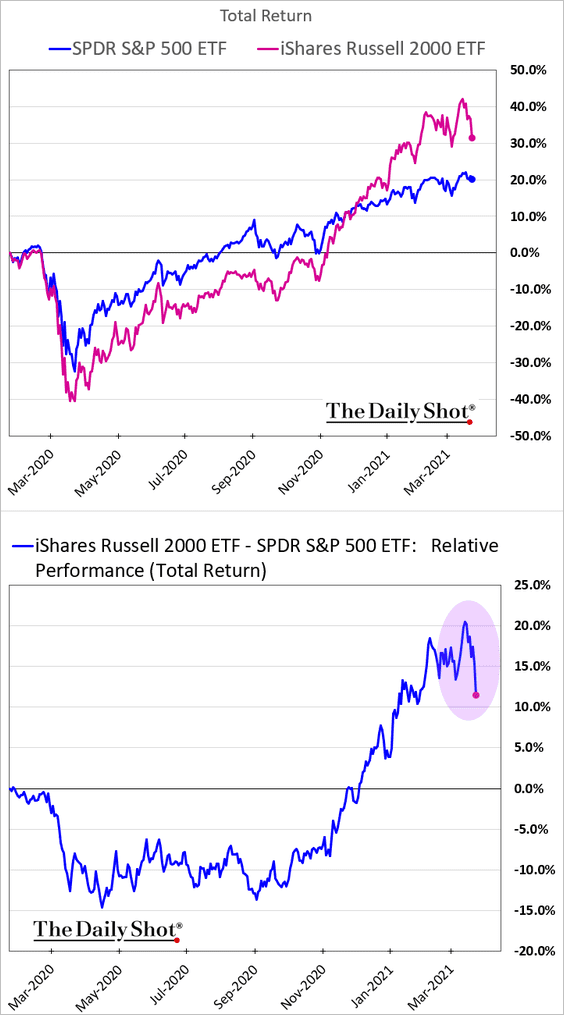
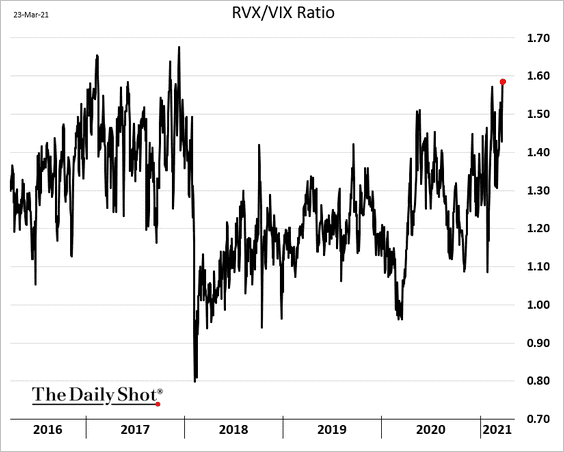
2. The Russell 2000 implied volatility index (RVX) has been rising relative to VIX.
3. QQQ (Nasdaq 100 ETF) saw a massive inflow this week.
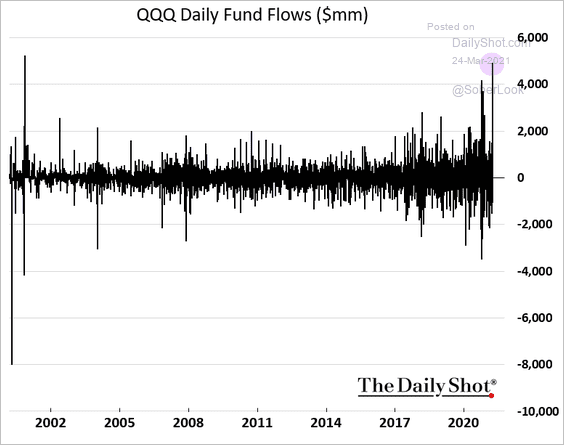 h/t @cfb_18, @markets
4. Call options volume is off the highs.
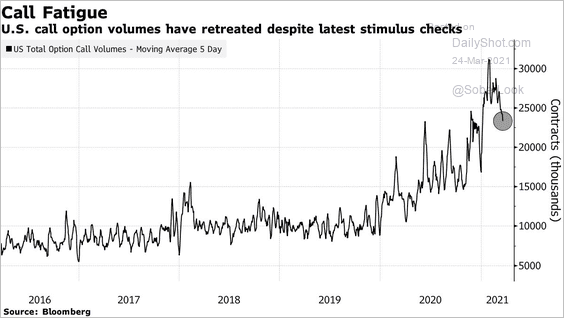 Source: @markets Read full article
5. It’s been a spectacular twelve months for stocks.
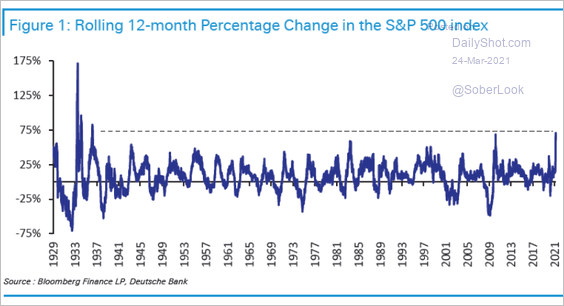 Source: Deutsche Bank Research
6. The increase in forward real rates points to a sharp downward adjustment to the forward P/E ratio. Either analysts will further boost their earnings expectations (see chart) or prices will have to come down.
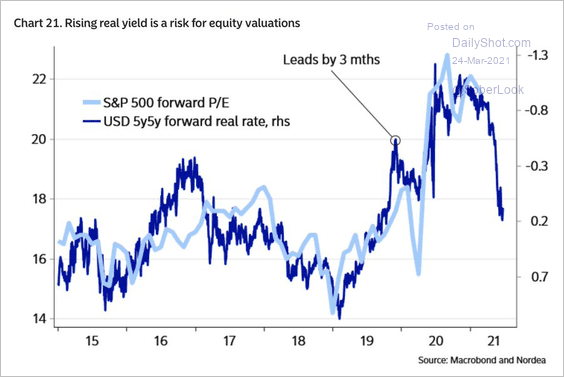 Source: @jessefelder, @MikaelSarwe Read full article
7. Here is a look at month-to-date equity factor performance.
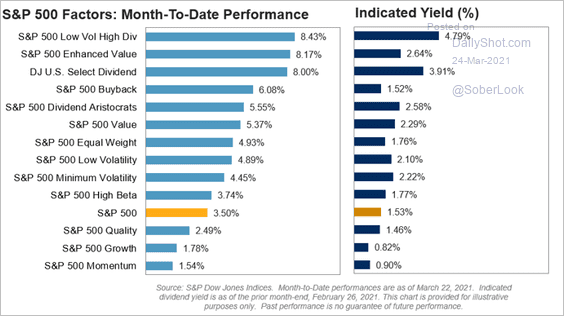 Source: S&P Global Market Intelligence
8. Proposed tax increases will shave 9% off next year’s S&P 500 earnings per share, according to Goldman.
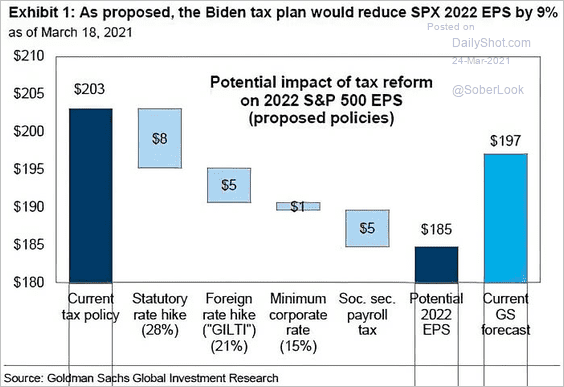 Source: @ISABELNET_SA, @GoldmanSachs
The market doesn’t seem to care, with companies paying higher effective tax rates outperforming this month.
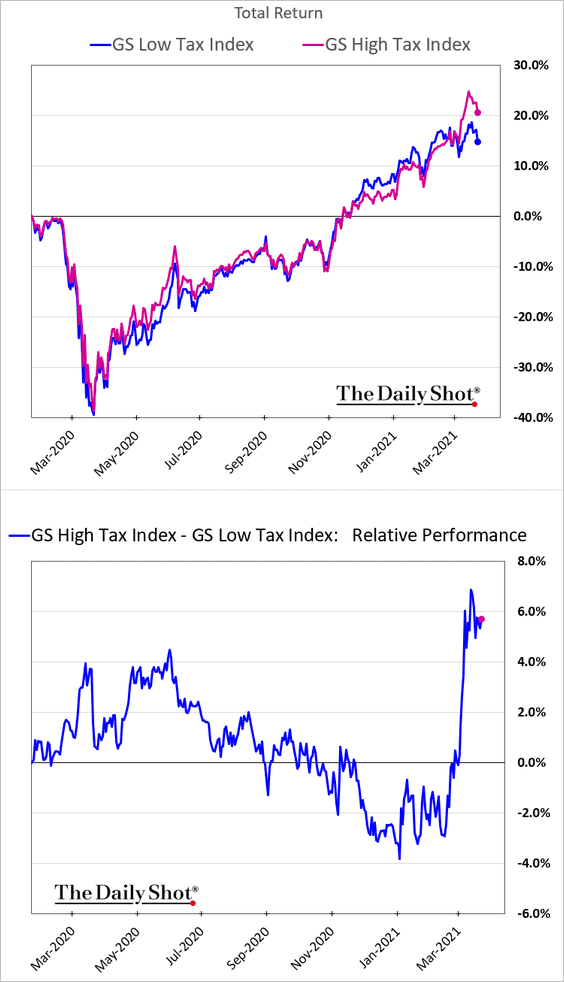
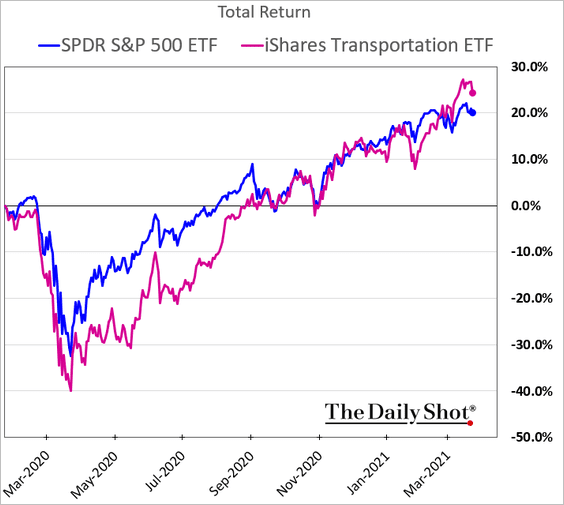
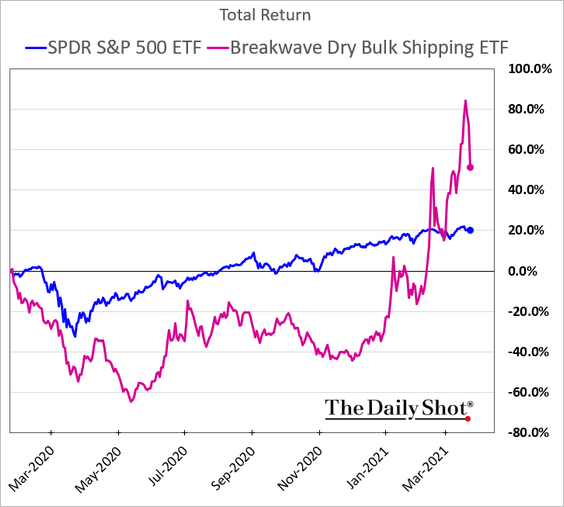
Several sectors where tax rates have been relatively high have been rallying lately. Retail is one of them (boosted by reopening hopes and stocks like Gamestop). Transportation and shipping companies are also in that high-tax category.
Back to Index
Rates
1. Bearish sentiment on Treasury bonds is at an extreme.
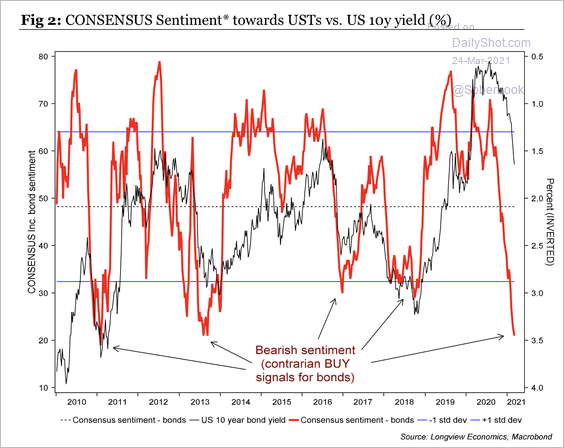 Source: Longview Economics
2. The 10-year Treasury is offering the highest yield since 2015 when FX-hedged.
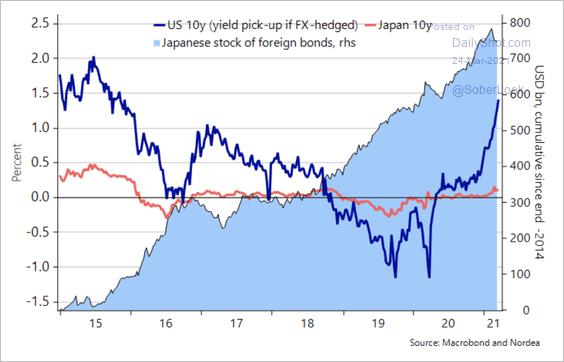 Source: Nordea Markets
Back to Index
Global Developments
1. The number of CTA launches has declined over the past decade.
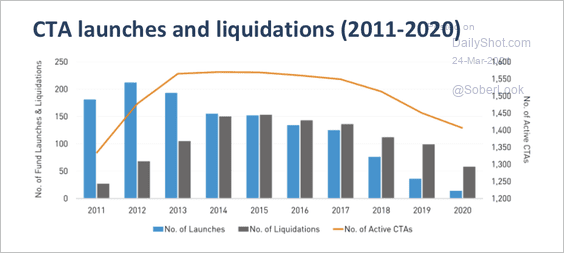 Source: Preqin
2. Fund managers view equity markets rising near the peak, debt markets in decline, and commodities entering the early cycle.
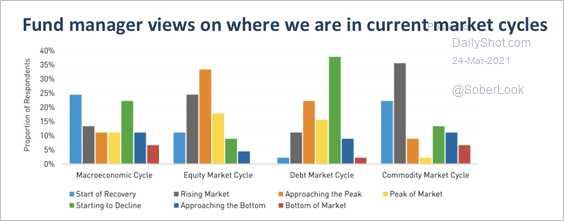 Source: Preqin
3. Technicals suggest the outperformance of global equities relative to long-term Treasuries is stretched and at risk of a reversal.
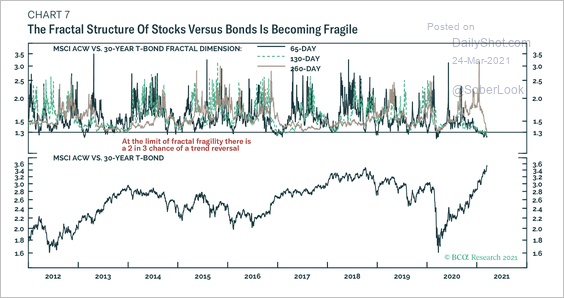 Source: BCA Research
4. Here are some of the famous financial bubbles.
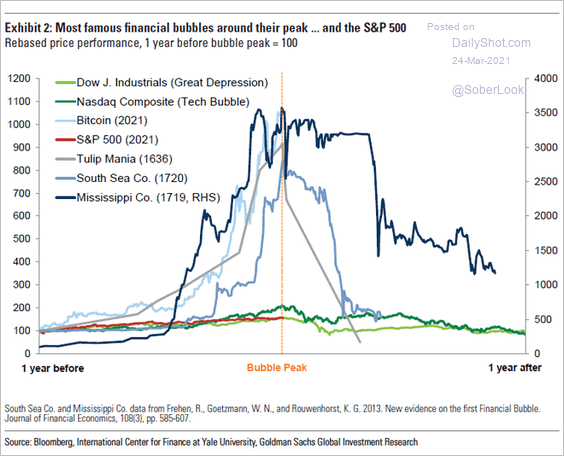 Source: Goldman Sachs; @tracyalloway
5. Global trade has fully recovered.
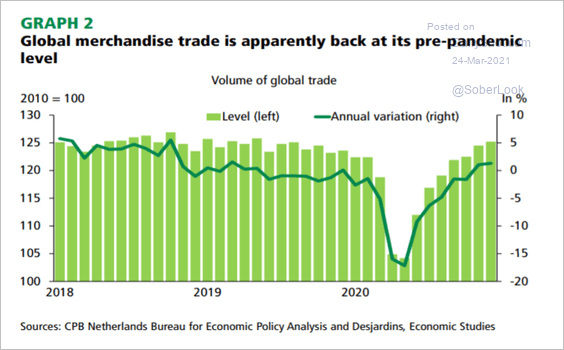 Source: Desjardins
——————–
Food for Thought
1. Workplace visits:
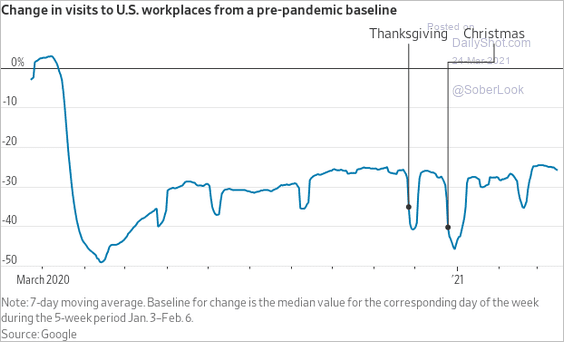 Source: @WSJ Read full article
2. Where online subscribers are spending their money:
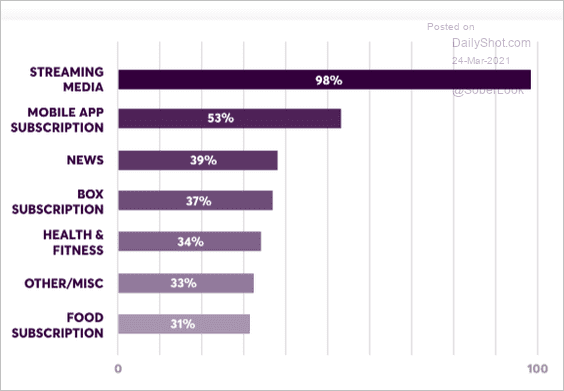 Source: Brightback
3. DC statehood proposal:
 Source: @WSJ Read full article
4. News stories on vaccines and immigration:
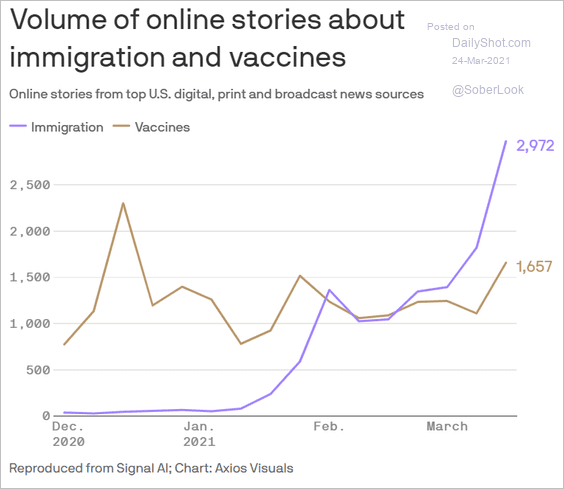 Source: @axios Read full article
5. Green cards awarded over time:
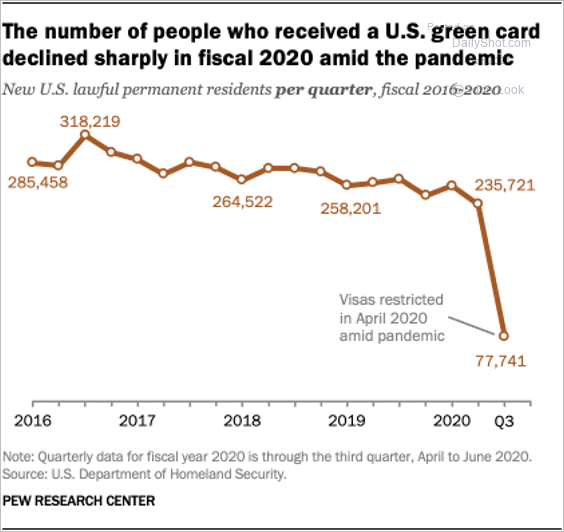 Source: @FactTank Read full article
6. US drought monitor:
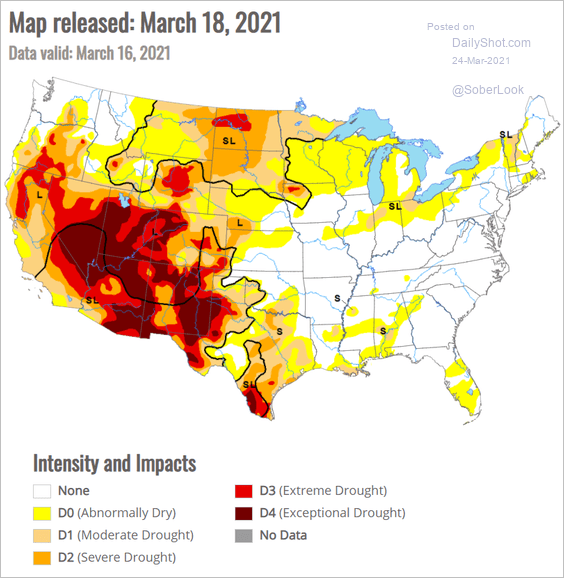 Source: United States Drought Monitor Further reading
7. Michigan COVID cases:
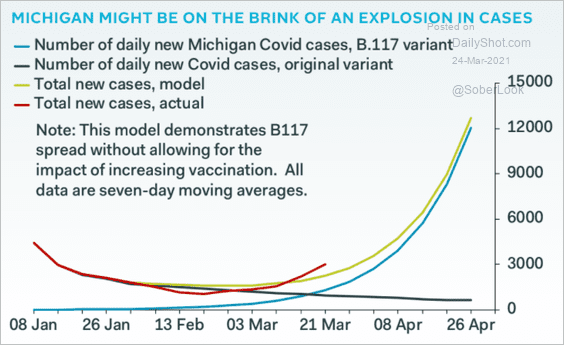 Source: Pantheon Macroeconomics
8. Asian Americans in high-contact essential roles:
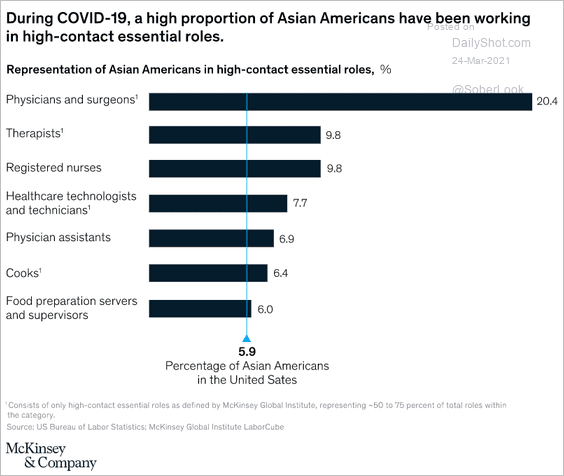 Source: @McKinsey Read full article
9. The population of Rome:
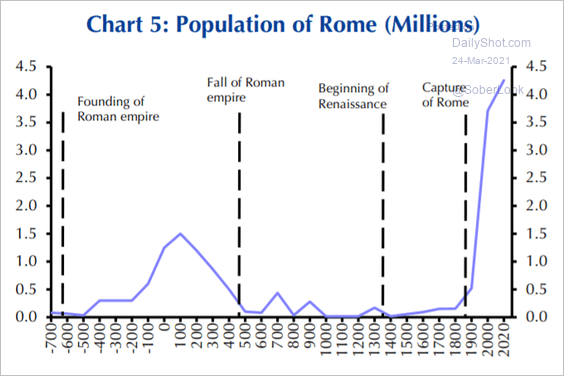 Source: Capital Economics
——————–
Back to Index