
The Daily Shot: 13-Apr-21
• The United States
• Canada
• The United Kingdom
• The Eurozone
• Europe
• Asia – Pacific
• China
• Emerging Markets
• Cryptocurrency
• Commodities
• Equities
• Credit
• Rates
• Global Developments
• Food for Thought
The United States
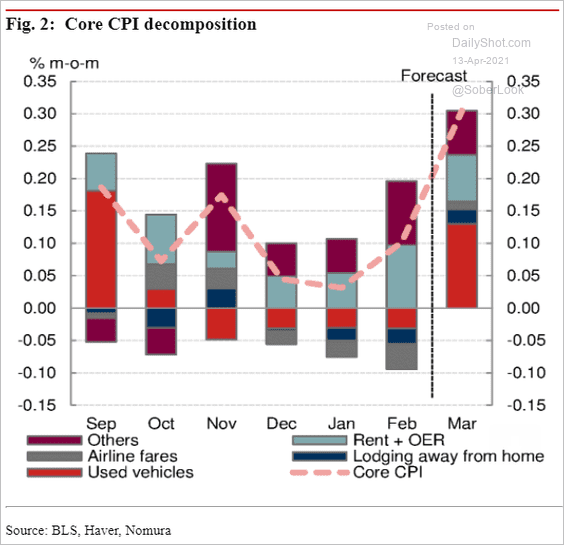
1. Let’s start with some updates on inflation.
• Nomura’s estimates show faster price increases last month. Here is the core CPI forecast.
 Source: Nomura Securities
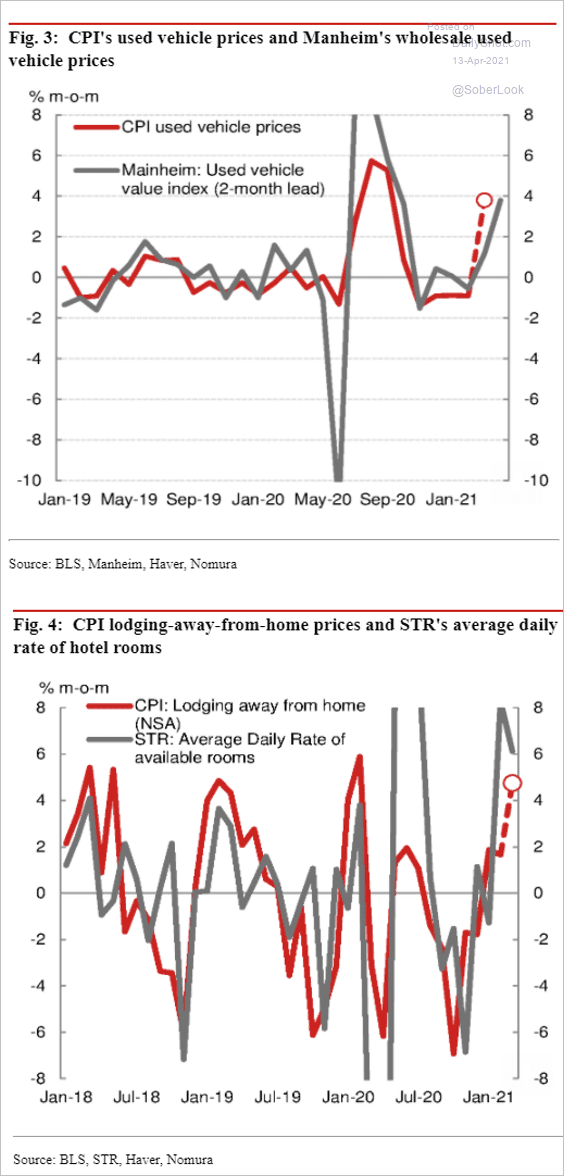
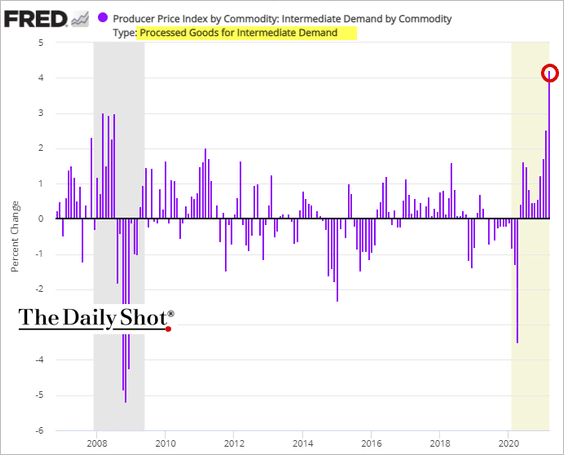
• High-frequency indicators point to robust monthly gains in used car prices and hotel rates.
 Source: Nomura Securities
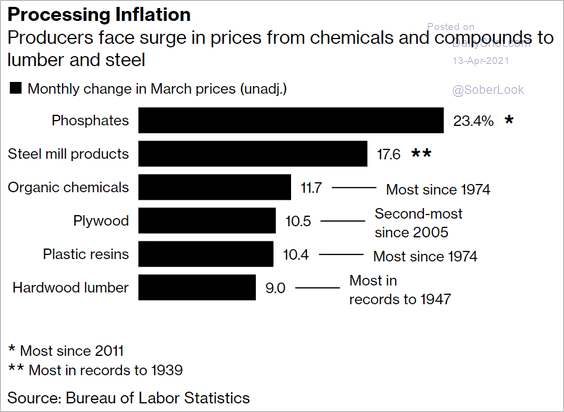
• Manufacturers reported substantial gains in input costs last month. The PPI report confirmed that trend, with processed intermediate goods prices rising sharply (2 charts).
 Source: @markets Read full article
——————–
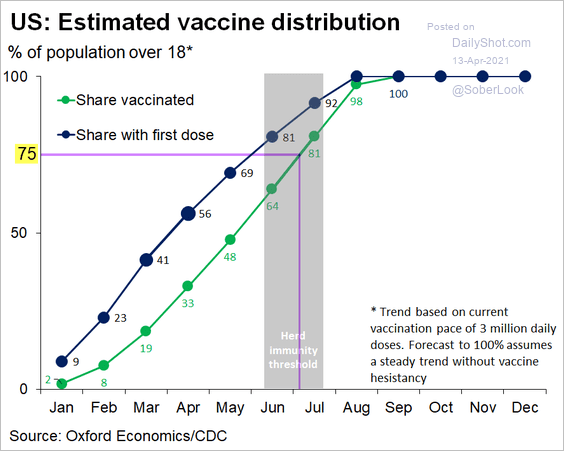
2. James Bullard suggested that the Fed will review its QE policy when the US hits a 75% vaccination rate.
 Source: @markets Read full article
According to Oxford Economics, that will occur in July. Perhaps the Fed will wait until the Jackson Hole Symposium. Are markets prepared for QE taper to start later this year?
 Source: @GregDaco, @OxfordEconomics
——————–
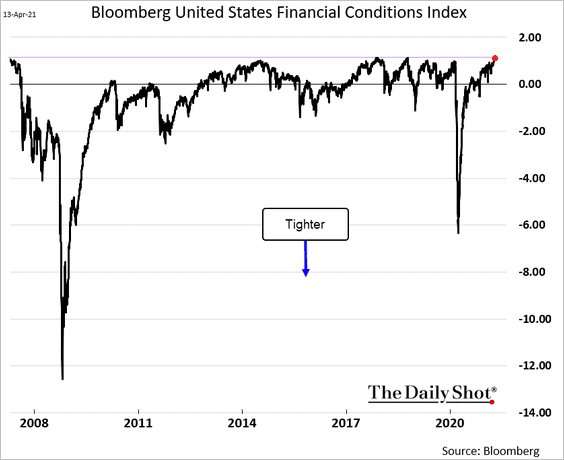
3. Bloomberg’s US financial conditions index is nearing the highest (most accommodative) level in years.
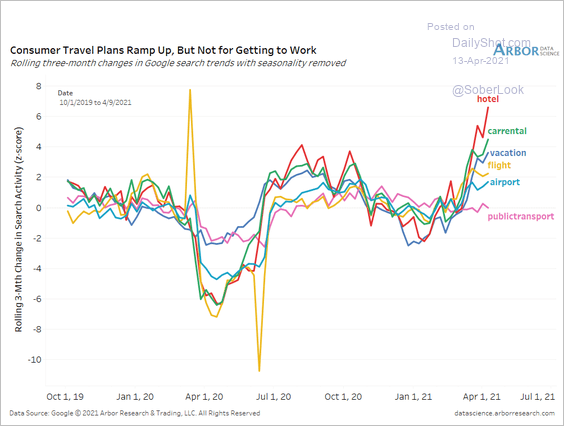
4. US consumers are ramping up their travel plans.
 Source: Arbor Research & Trading
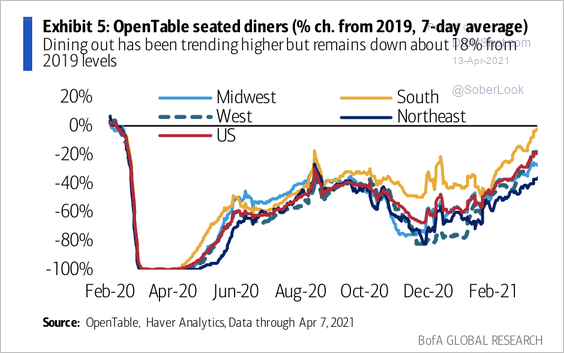
Dining out is recovering, led by southern states.
 Source: BofA Global Research
——————–
5. Strong capital goods orders point to CapEx improvements.
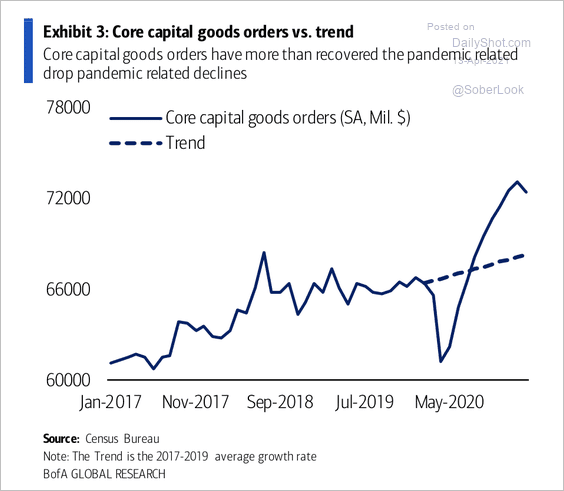 Source: BofA Global Research
6. The Evercore ISI Company Survey index (focused on cyclical sectors) is at multi-year highs.
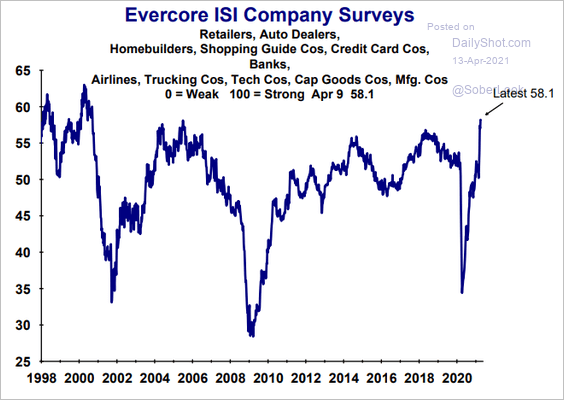 Source: Evercore ISI
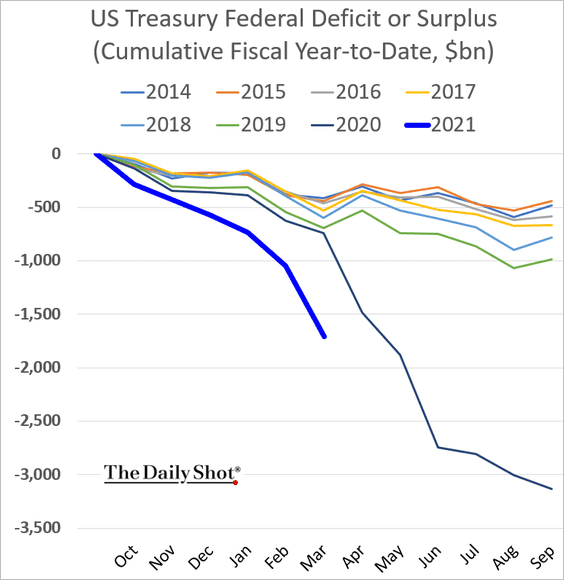
7. The budget deficit continues to widen.
Back to Index
Canada
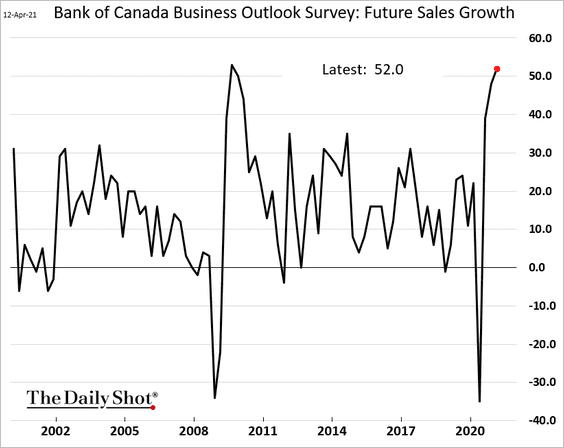
1. Just like in the US, Canada’s businesses are increasingly optimistic.
2. Base effects will drive sharp increases in the year-over-year CPI inflation.
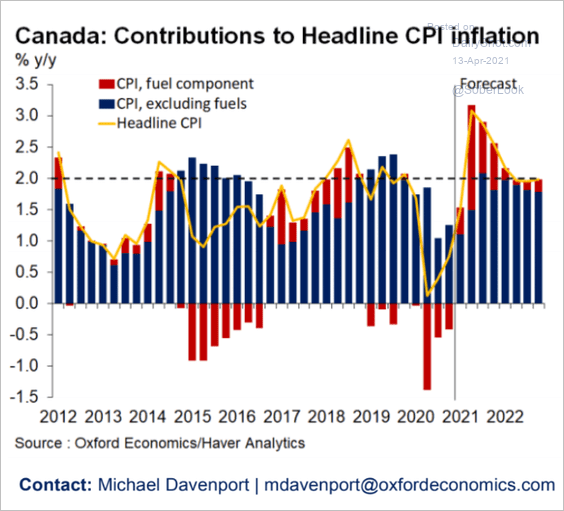 Source: Oxford Economics
Back to Index
The United Kingdom
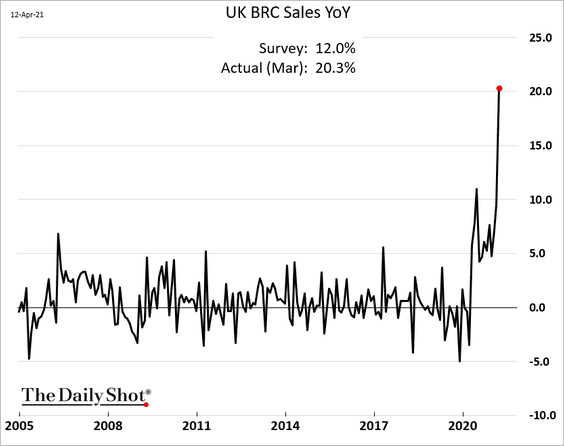
1. Retail sales strengthened last month, according to the BRC report.
 Source: Reuters Read full article
• But retail traffic slowed again this month.
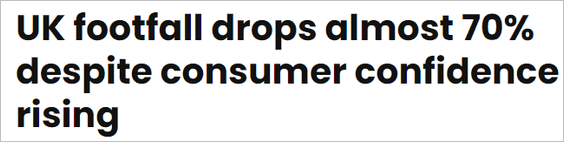 Source: Retail Gazette Read full article
• Search activity for restaurants and pubs shows only modest recovery.
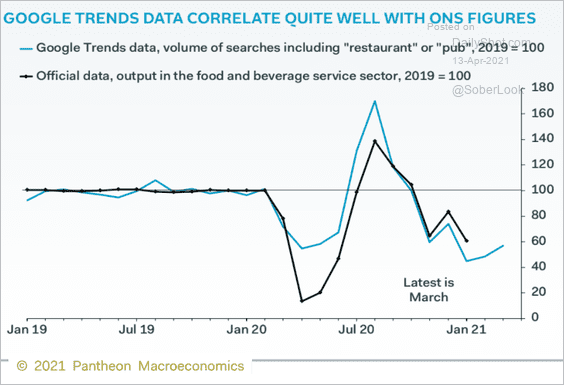 Source: Pantheon Macroeconomics
• Here are the trends in credit/debit card spending.
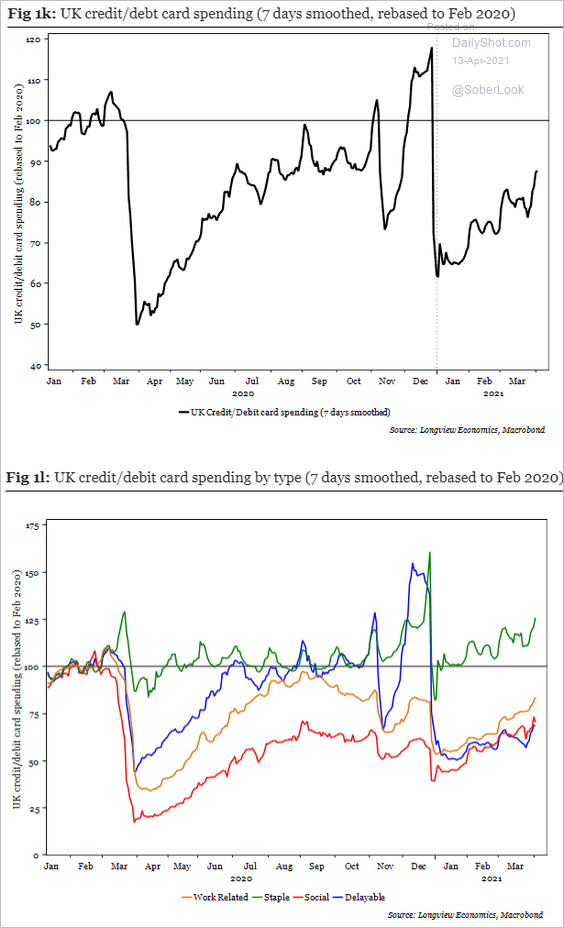 Source: Longview Economics
——————–
2. Corporate CFOs are increasingly optimistic.
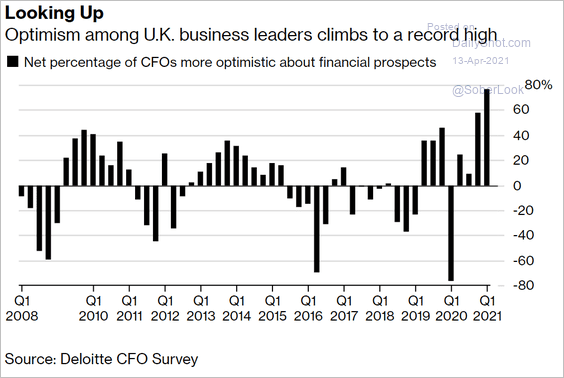 Source: Bloomberg Read full article
Back in the office in Q3?
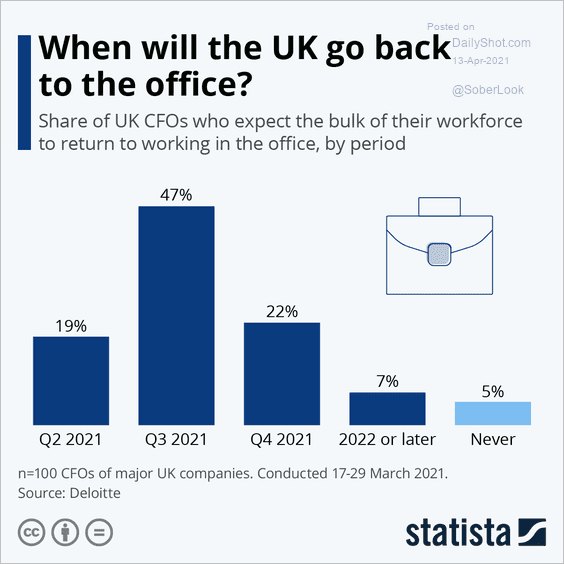 Source: Statista
——————–
3. The furlough program utilization is still elevated.
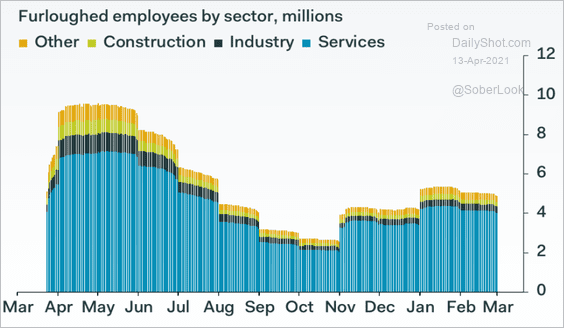 Source: Pantheon Macroeconomics
4. The UK vaccination program is working.
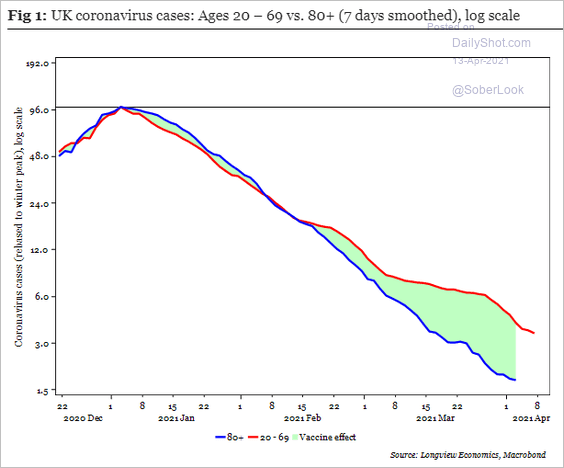 Source: Longview Economics
5. This chart shows the UK’s electricity generation by source.
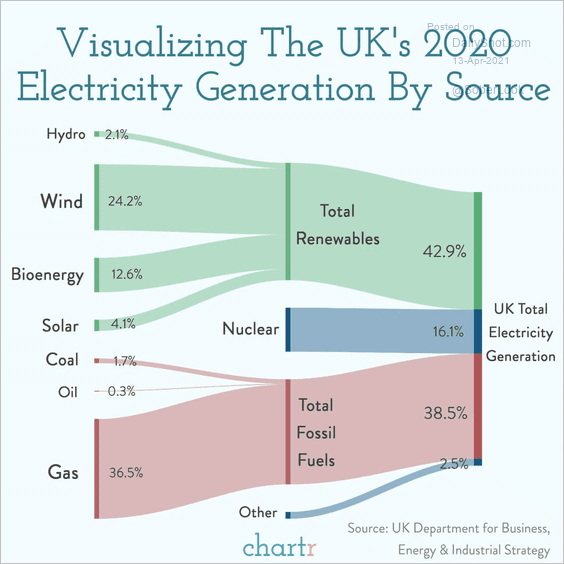 Source: @chartrdaily
Back to Index
The Eurozone
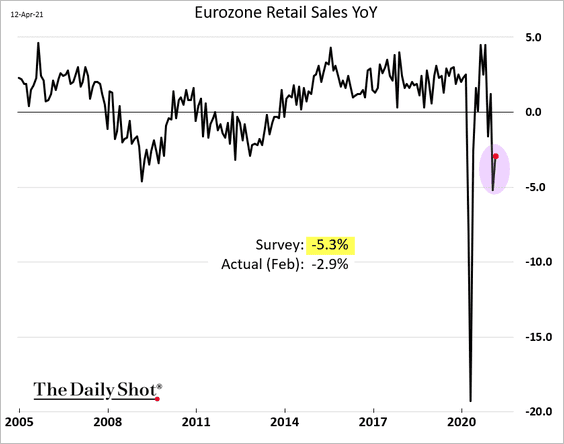
1. Euro-area February retail sales topped forecasts.
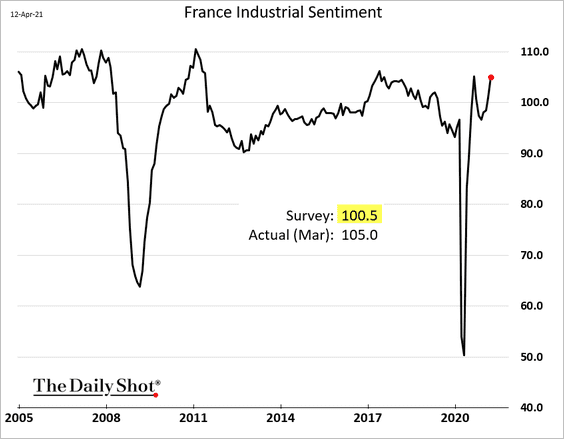
2. French industrial sentiment strengthened last month.
3. Will Spanish households boost consumption?
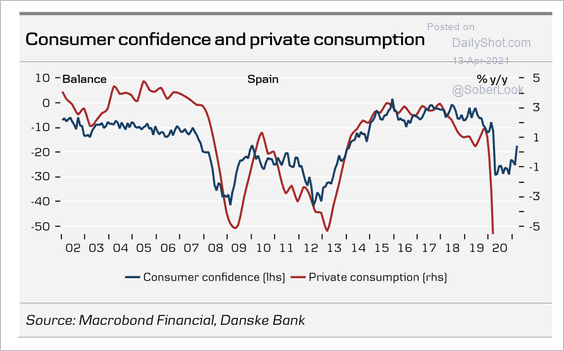 Source: Danske Bank
4. This chart shows Italy’s budget vs. historical trends.
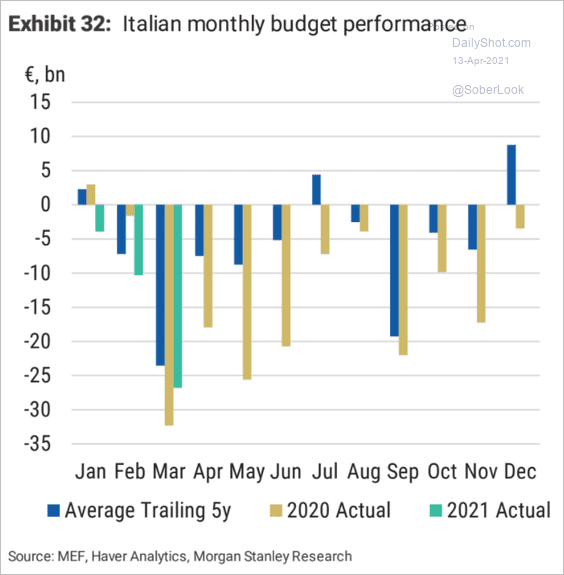 Source: Morgan Stanley Research
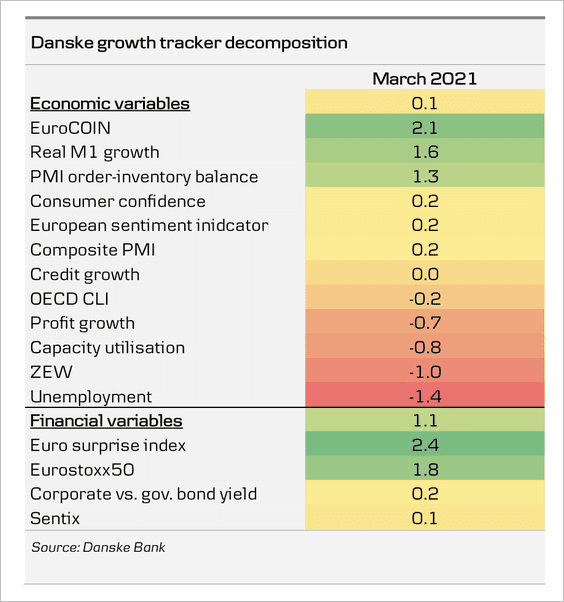
5. Danske Bank’s euro-area growth tracker is improving, with a noticeable pickup in financial and economic variables (2 charts).
![]() Source: Danske Bank
Source: Danske Bank
 Source: Danske Bank
——————–
6. Here is the GDP per capita relative to the United States.
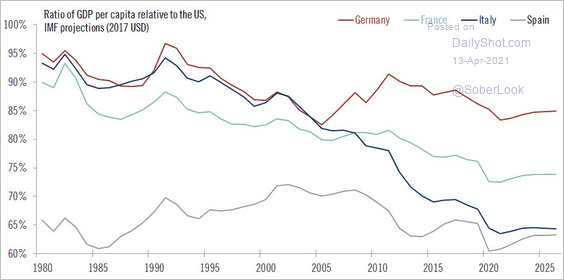 Source: @fwred
7. Finally, we have the euro-area geographic breakdown of the current account balance.
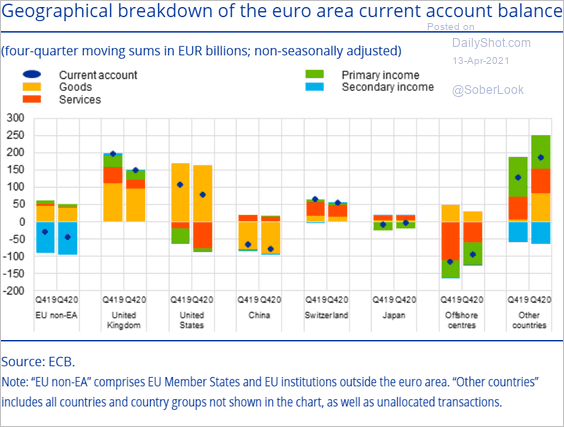 Source: ECB Read full article
Back to Index
Europe
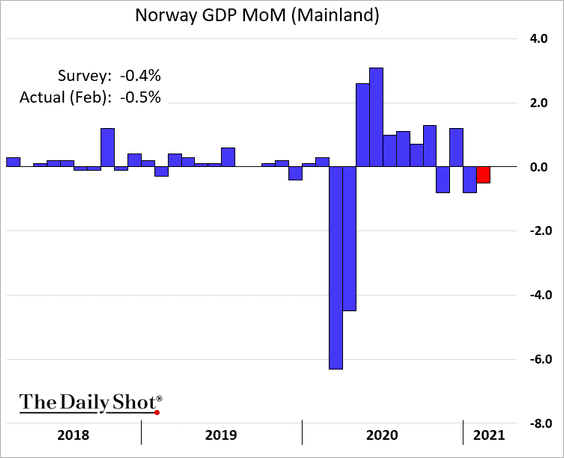
1. Norway’s economy contracted in January and February.
2. Coronavirus cases in Sweden have been climbing.
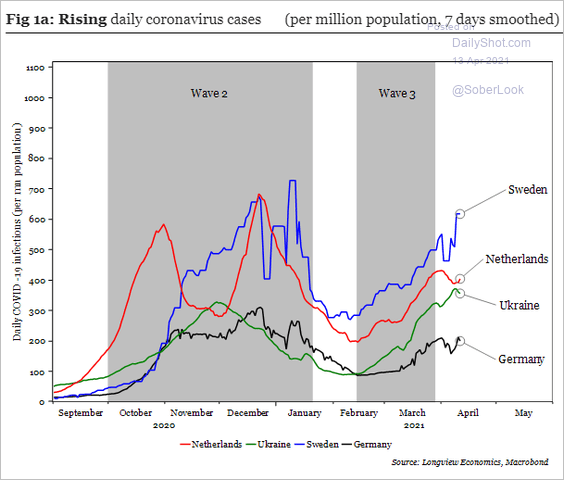 Source: Longview Economics
3. Trade shrunk last year except in pharma products.
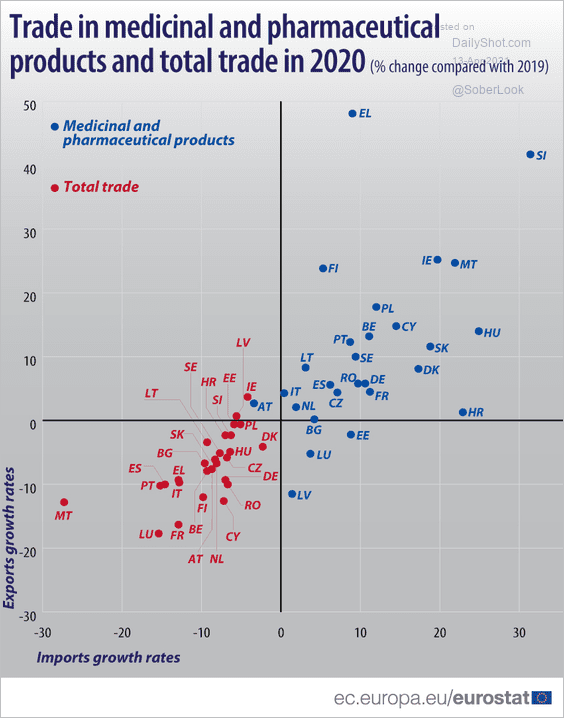 Source: @EU_Eurostat Read full article
4. Pollution is back to “normal.”
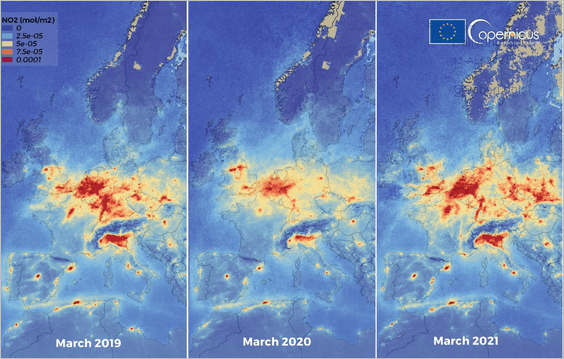 Source: @defis_eu, @CopernicusEU
5. How long did it take for different countries to join the EU? By the way, what does that mean for Scotland in an unlikely event that it tries to rejoin as a sovereign nation?
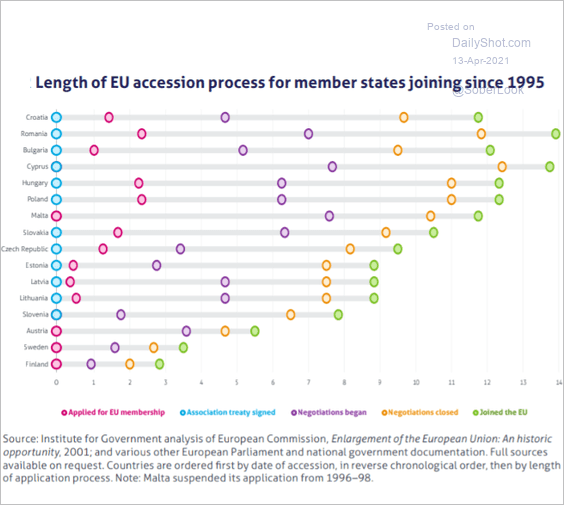 Source: Institute for Government Read full article
Back to Index
Asia – Pacific
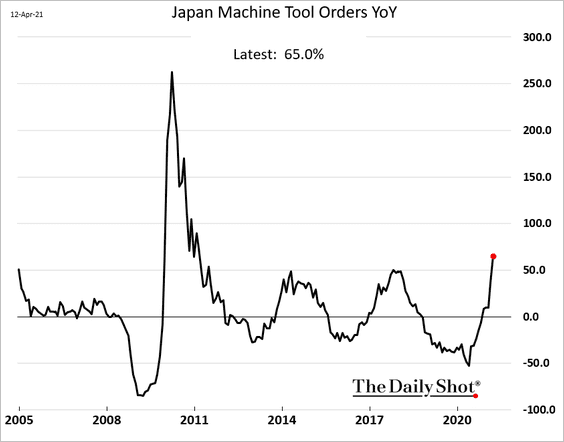
1. Japan’s machine tool orders strengthened further. Part of the 65% year-over-year jump is base effects – but not all.
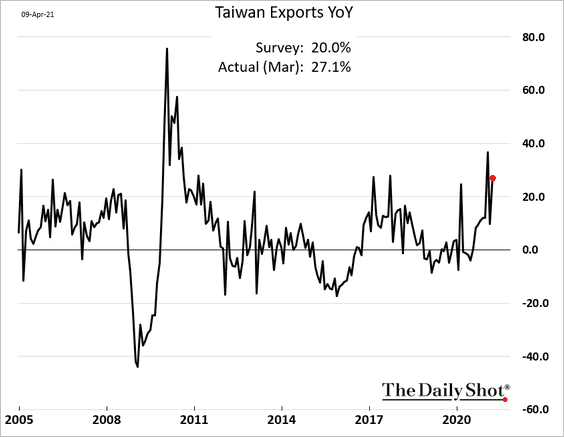
2. Taiwan’s exports remain robust.
3. Here is Australia’s monetary base (increase due to RBA’s QE).
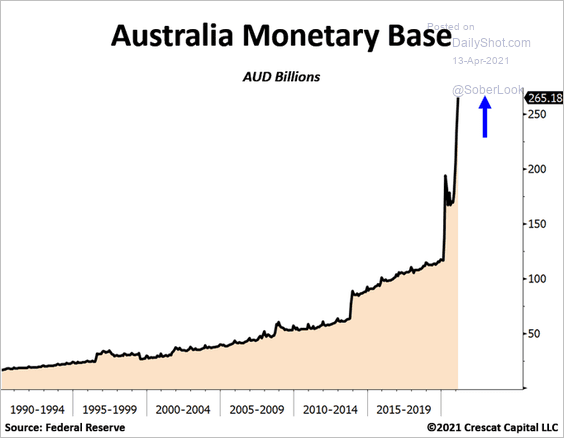 Source: @TaviCosta
4. New Zealand’s housing price gains have outpaced other advanced economies.
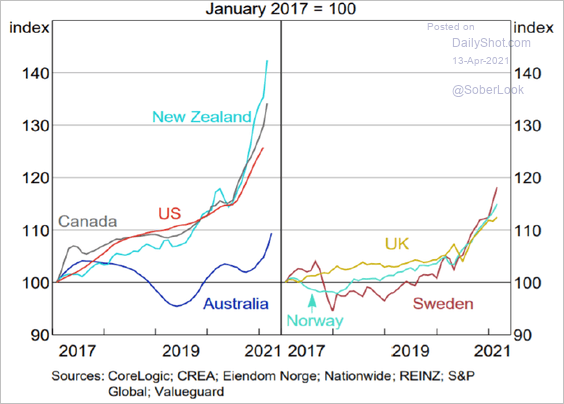 Source: ANZ Research
5. Which countries are best positioned for tourism recovery?
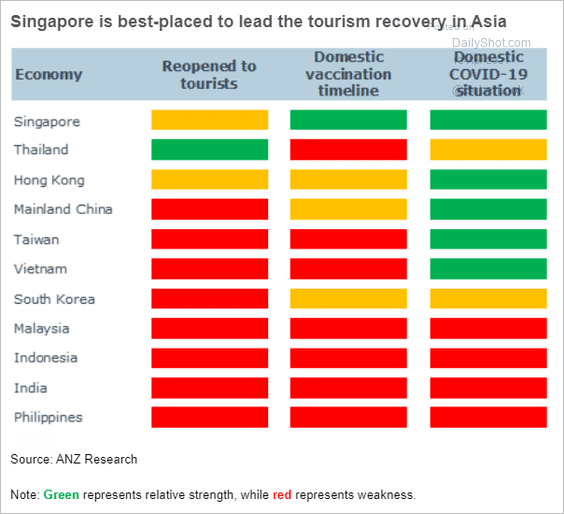 Source: ANZ Research
Back to Index
China
1. Year-to-date bank loan growth remains at the highs for this time of the year.
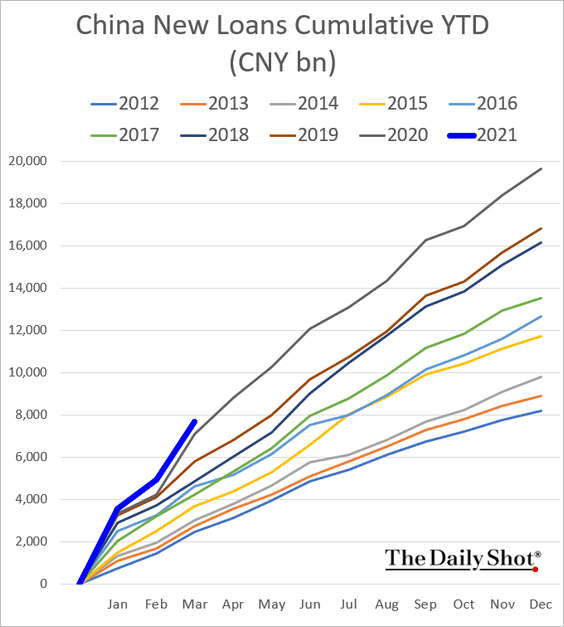
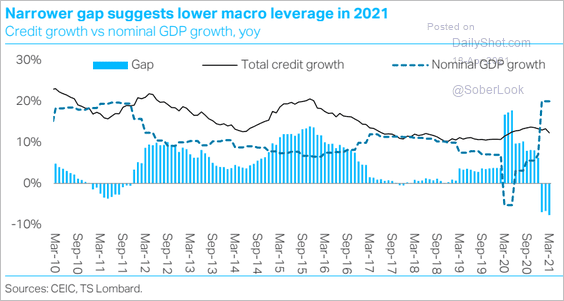
But aggregate credit is now below 2020 levels, as Bejing focuses on deleveraging.
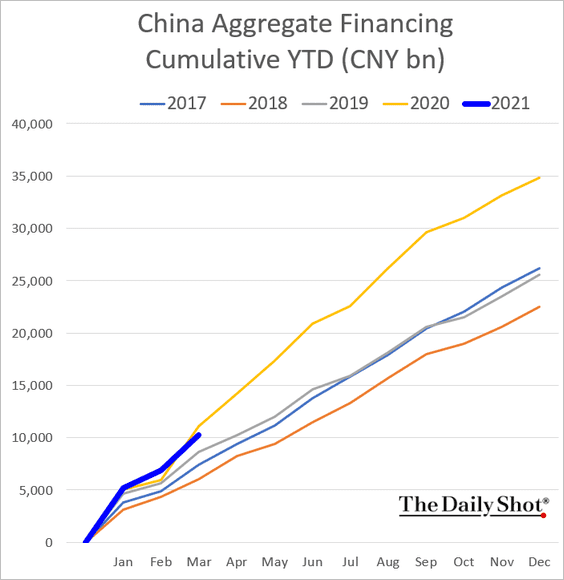
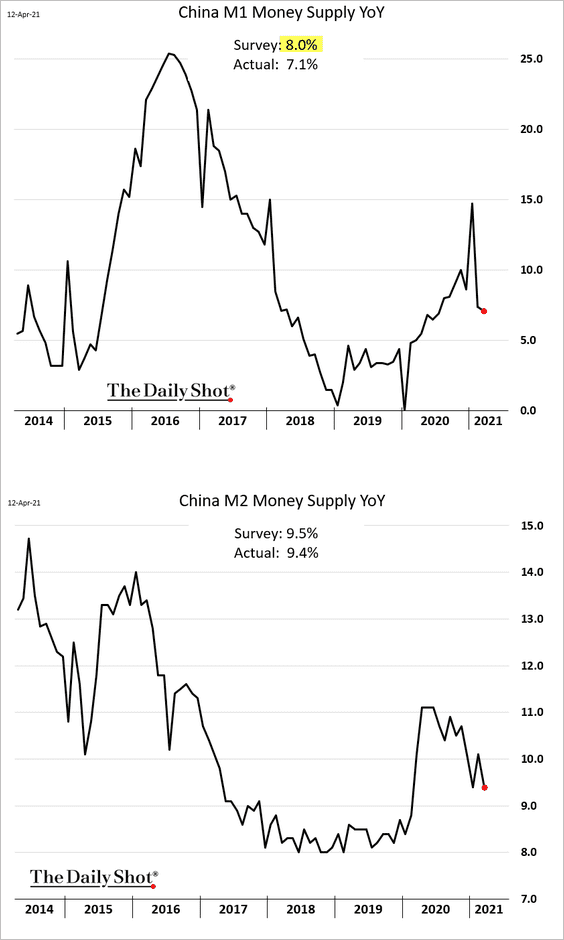
Money supply growth indicators were softer than expected.
The deleveraging trend is likely to continue this year.
 Source: TS Lombard
——————–
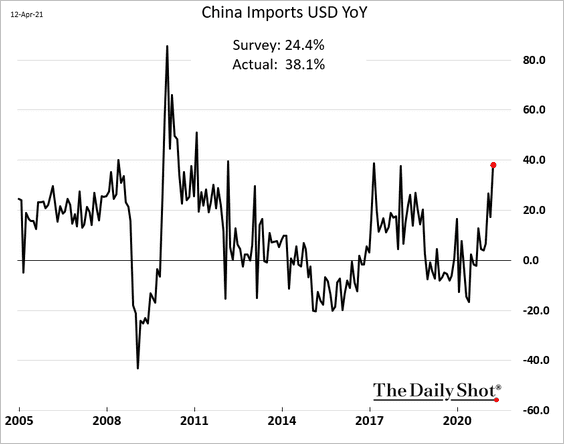
2. Exports were below consensus but still very strong.
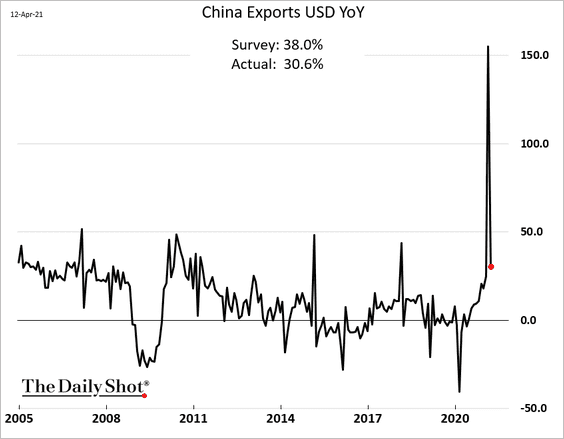
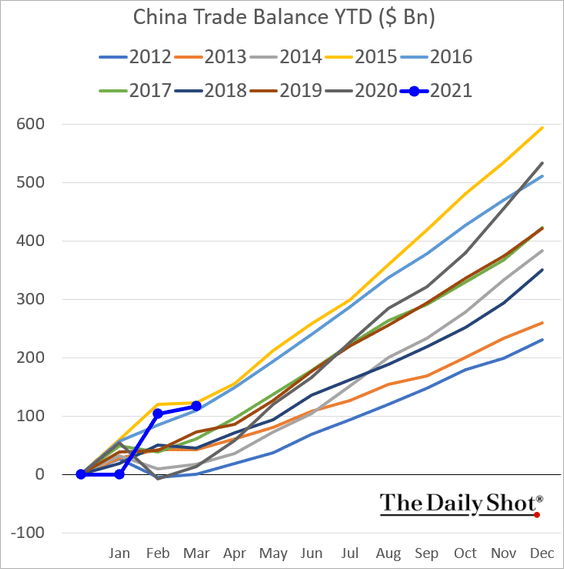
Imports surprised to the upside.
Here is the cumulative trade balance.
——————–
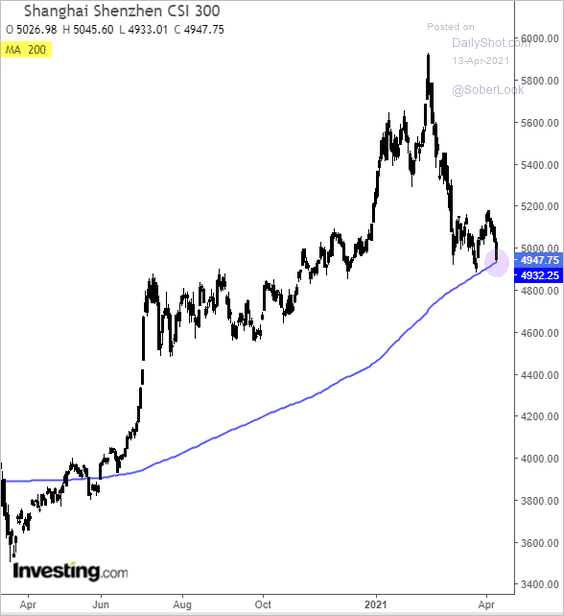
3. The benchmark stock market index is testing support again at the 200-day moving average.
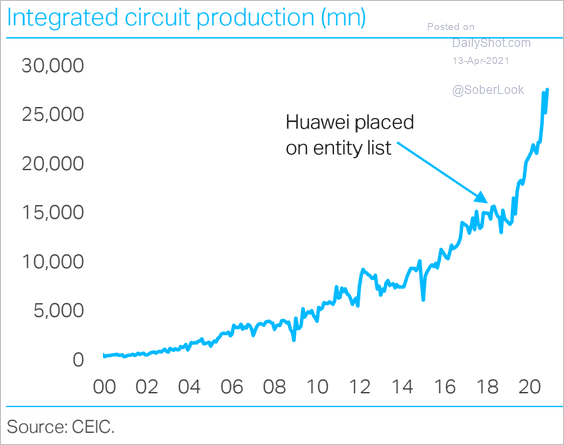
4. China has been ramping up its semiconductor manufacturing in recent years.
 Source: TS Lombard
Here is the nation’s projected chip capacity vs. the US.
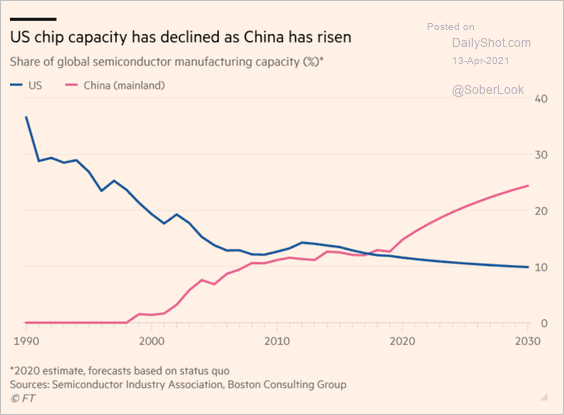 Source: @financialtimes Read full article
Back to Index
Emerging Markets
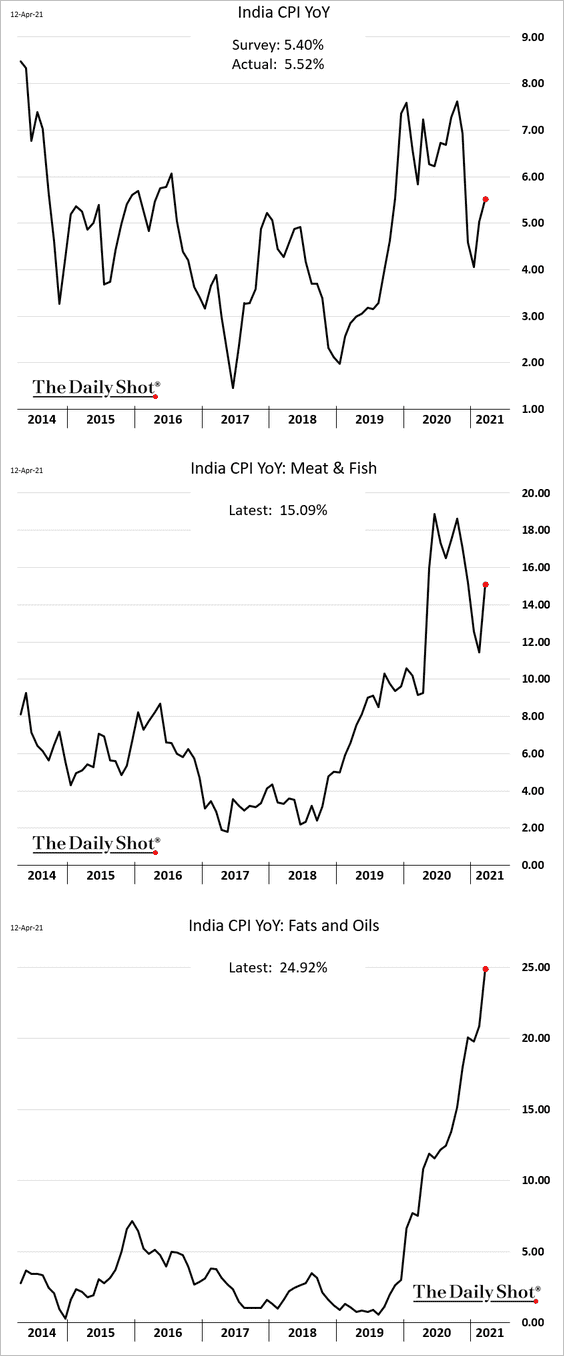
1. India’s CPI was a bit stronger than expected, driven by food prices.
The rupee has weakened sharply in recent days. USD/INR is testing resistance at 75.0.
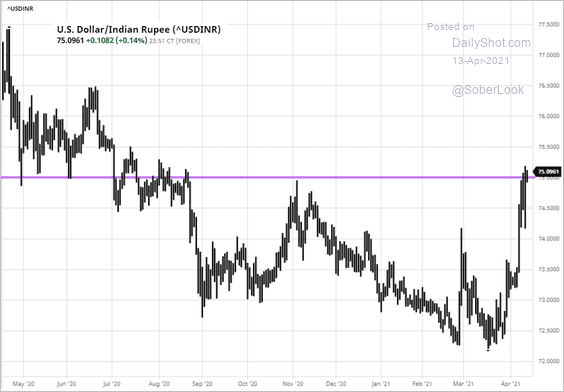 Source: barchart.com
——————–
2. What percentage of individuals in EM Asia borrowed from banks?
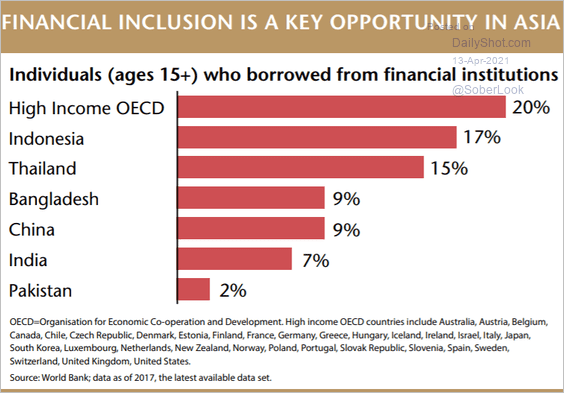 Source: Matthews Asia Read full article
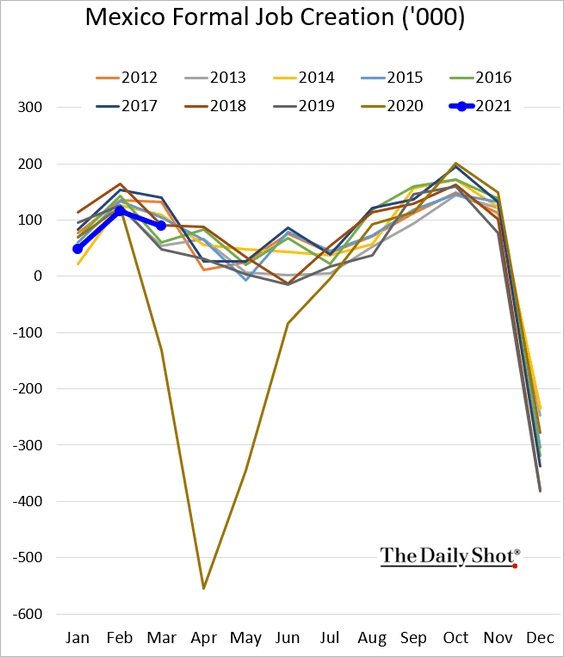
3. Mexico’s formal job creation is now inside the historical range.
4. A high percentage of the population in West African countries is unlikely to get vaccinated.
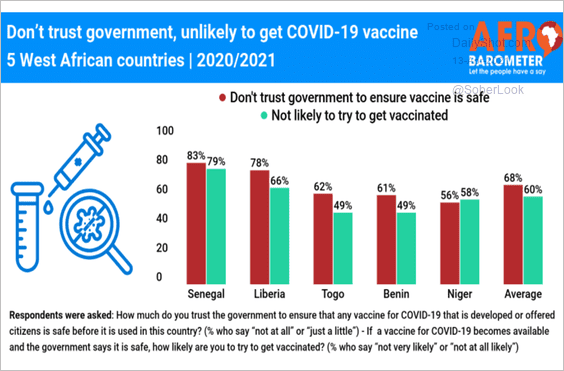 Source: Afrobarometer Read full article
Back to Index
Cryptocurrency
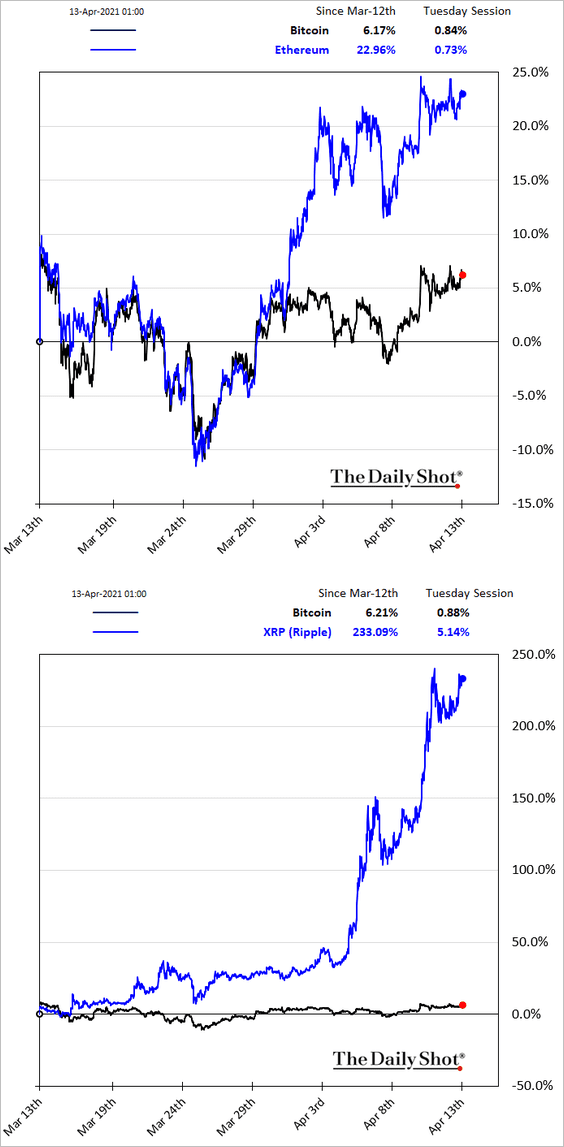
1. Major cryptocurrencies have been outperforming bitcoin.
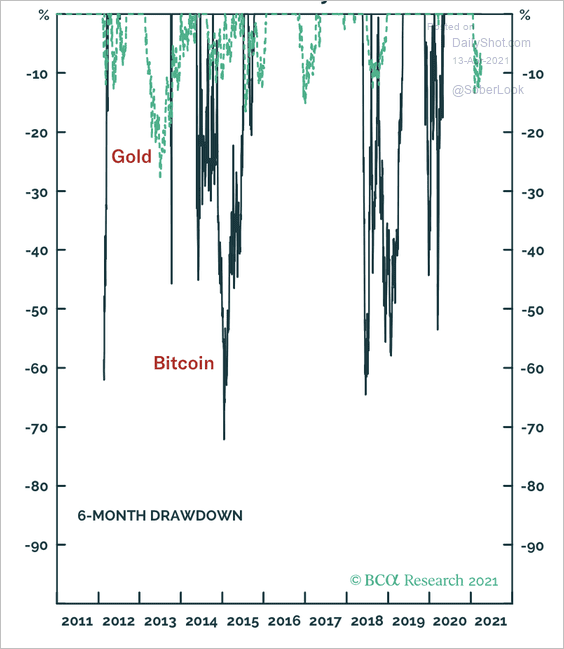
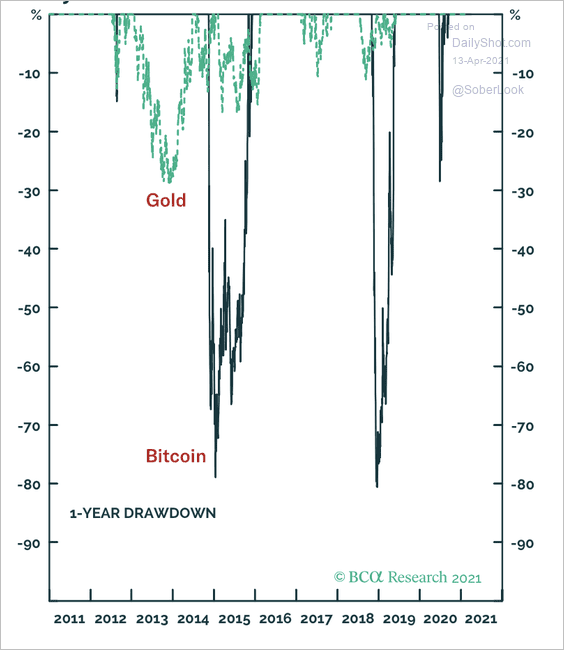
2. Bitcoin drawdowns over six and twelve months tend to be three times larger than gold’s, according to BCA Research (2 charts).
 Source: BCA Research
 Source: BCA Research
——————–
3. Tradable stock tokens are coming to Binance, the largest cryptocurrency exchange in the world. Users will be able to purchase as little as one-hundredth of a Tesla share with prices settled in Binance USD (BUSD).
 Source: Binance Read full article
Back to Index
Commodities
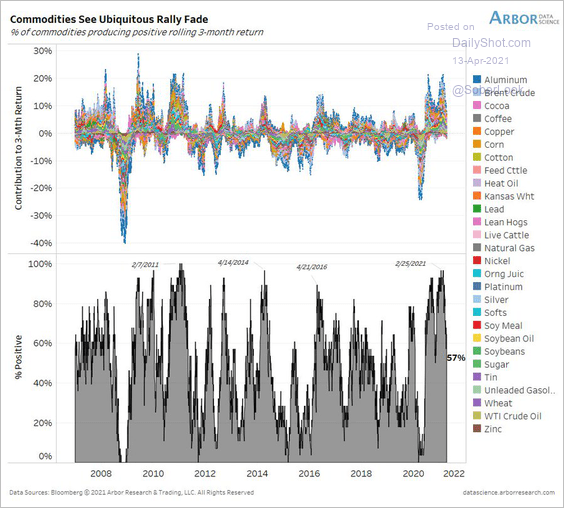
1. The rally in commodities is fading, with only 57% of the markets producing positive rolling three-month returns (down from 96% in late February).
 Source: @benbreitholtz
2. China’s moderating credit cycle is expected to be a drag on commodities.
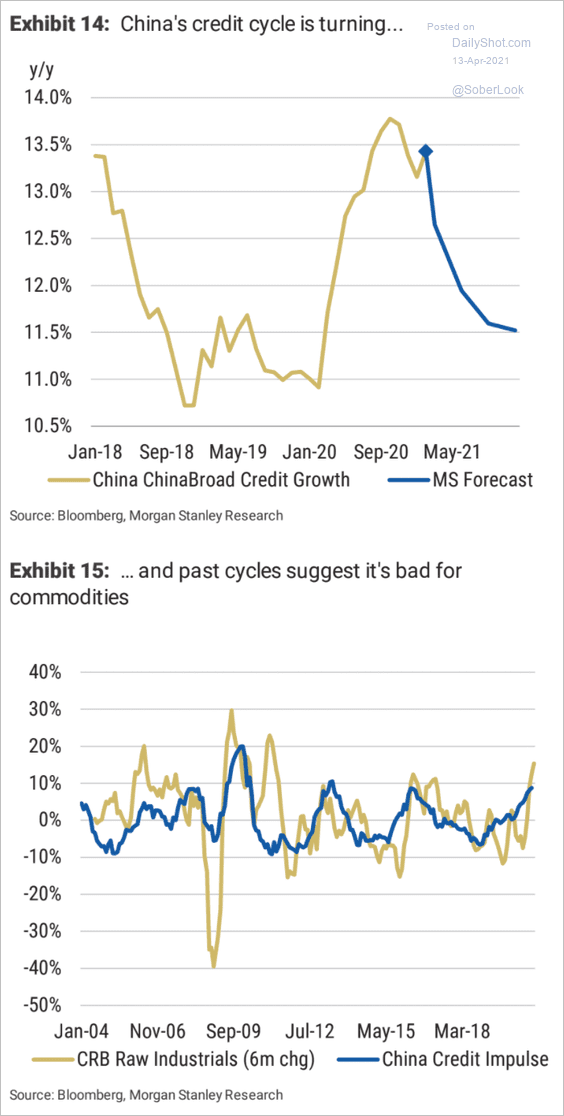 Source: Morgan Stanley Research
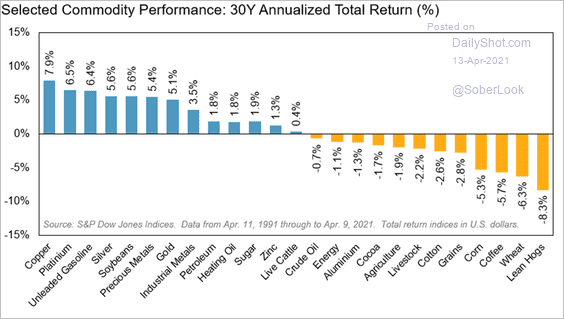
3. This chart shows the 30yr annualized total returns for select commodities.
 Source: S&P Global Market Intelligence
4. China continues to dominate the rare earths market.
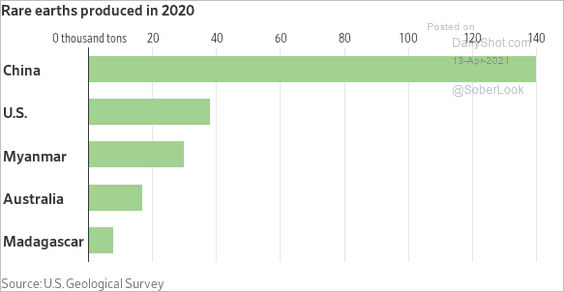 Source: @WSJ Read full article
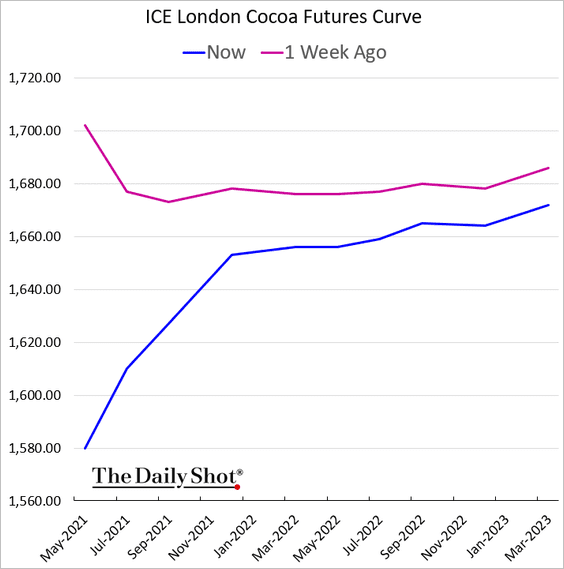
5. Cocoa futures rapidly shifted into contango amid concerns about global demand for chocolate.
Back to Index
Equities
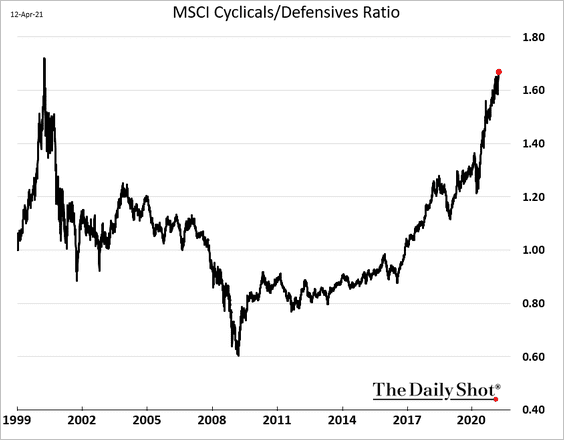
1. The price ratio of cyclical to defensive industries is approaching the dot-com peak.
2. The S&P 500 is testing resistance at the upper Bollinger Band.
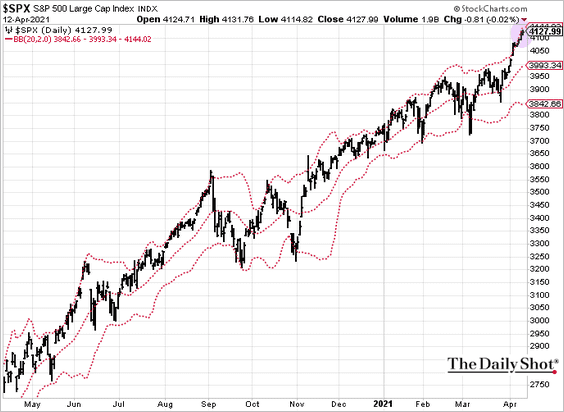 h/t Cormac Mullen
3. Bearish investors have been capitulating.
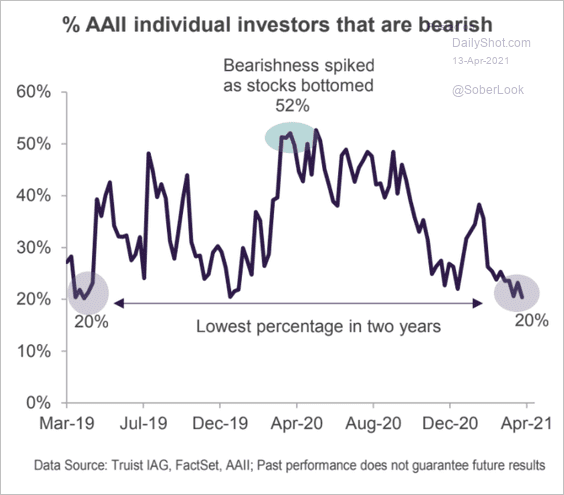 Source: Truist Advisory Services
4. The PPI rebound indicates stronger corporate earnings.
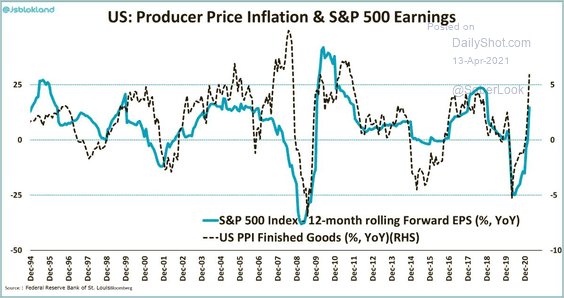 Source: @jsblokland
5. Correlations among S&P 500 stocks have fallen sharply.
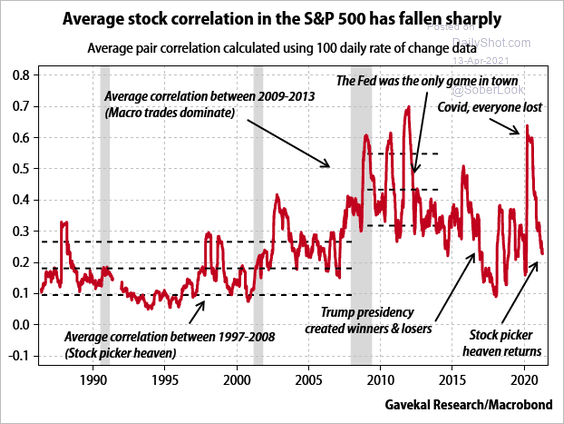 Source: Gavekal Research
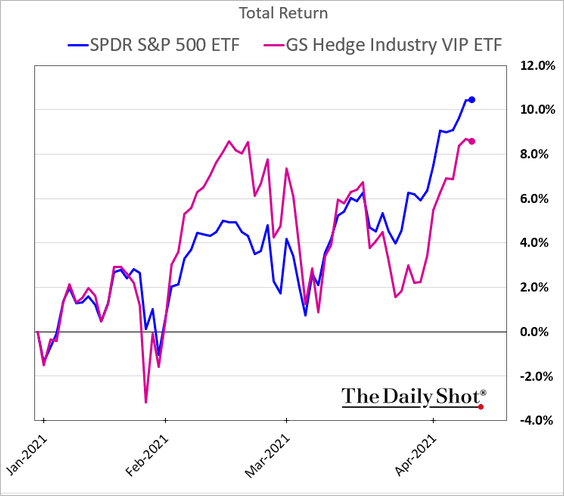
6. Hedge funds’ favorite stocks have been lagging the S&P 500 in recent weeks.
7. Short interest in S&P 500 stocks appears to have bottomed.
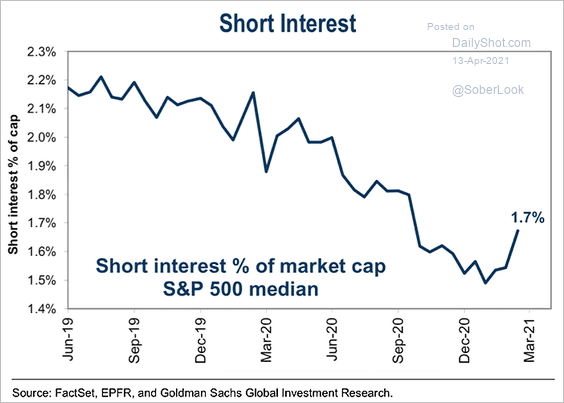 Source: @ISABELNET_SA, @GoldmanSachs
8. According to the Dow Theory, the outperformance of transportation shares is a bullish sign.
![]() h/t @ossingerj
h/t @ossingerj
9. Does the peak in the Aussie and Kiwi dollars point to a pause in the S&P 500 rally?
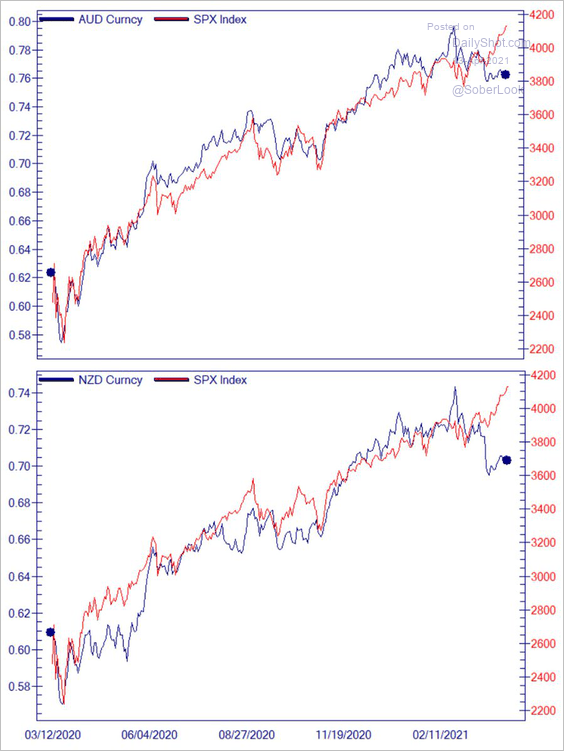 Source: @Not_Jim_Cramer
10. More put options are now sold than bought at the open.
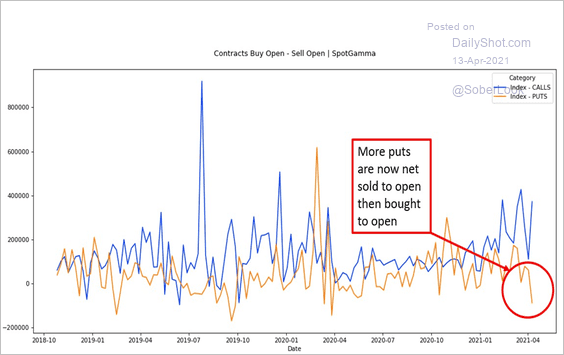 Source: SpotGamma Read full article
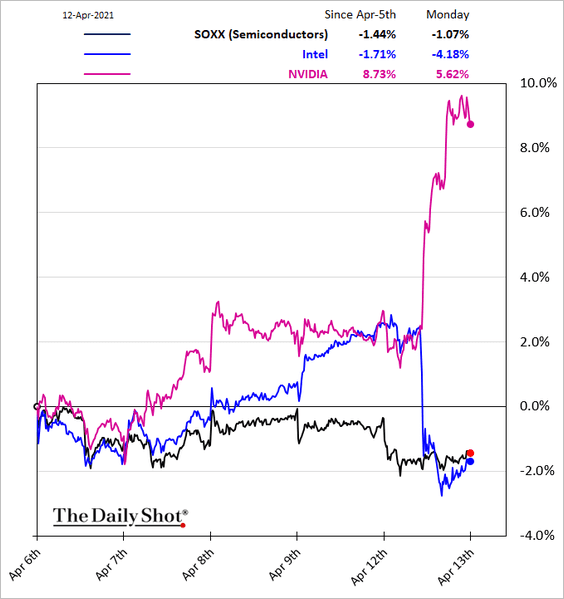
11. NVIDIA is moving into Intel’s territory.
 Source: CNBC Read full article
Back to Index
Credit
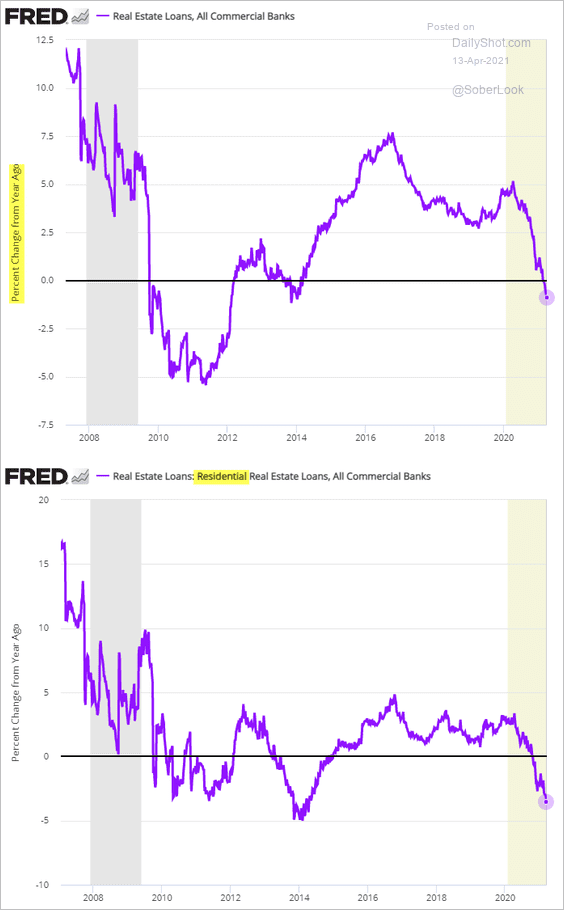
1. US banks are shrinking their real estate loan holdings.
2. Total loans at the largest US banks probably declined last quarter.
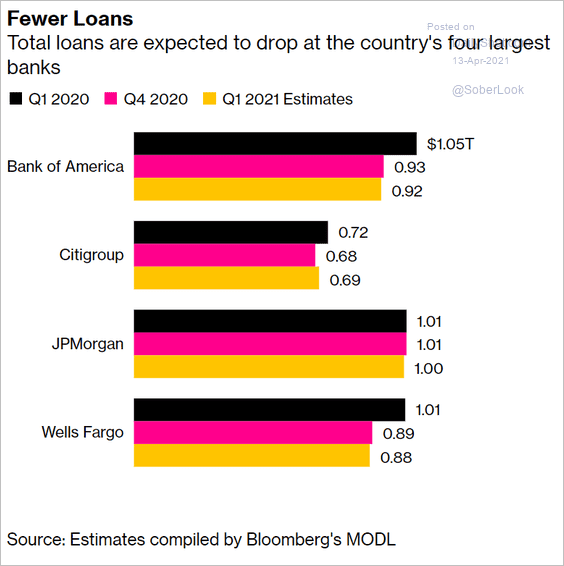 Source: Bloomberg Read full article
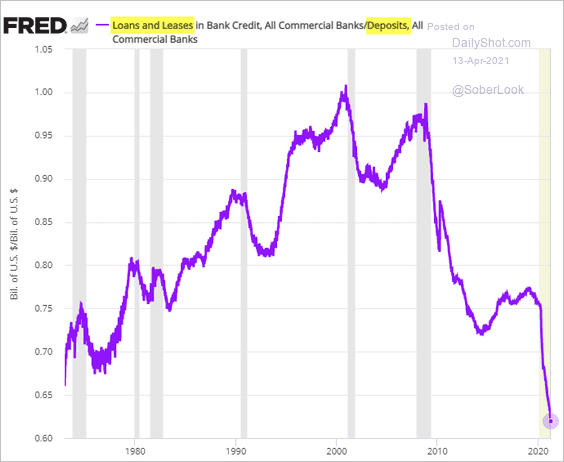
3. The US loan-to-deposit ratio hit a new low.
4. Bankruptcies tend to lag recessions by about 18 months.
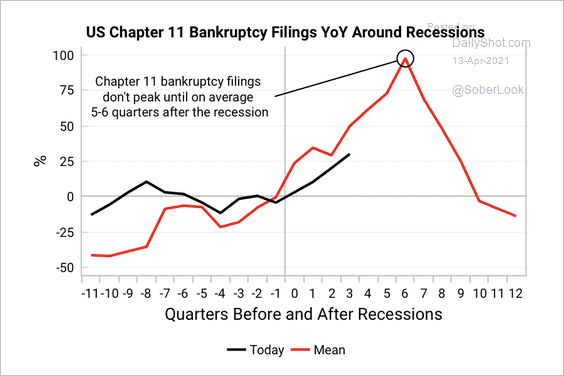 Source: Variant Perception
Back to Index
Rates
1. The market still expects the first Fed hike in Q4 of next year.
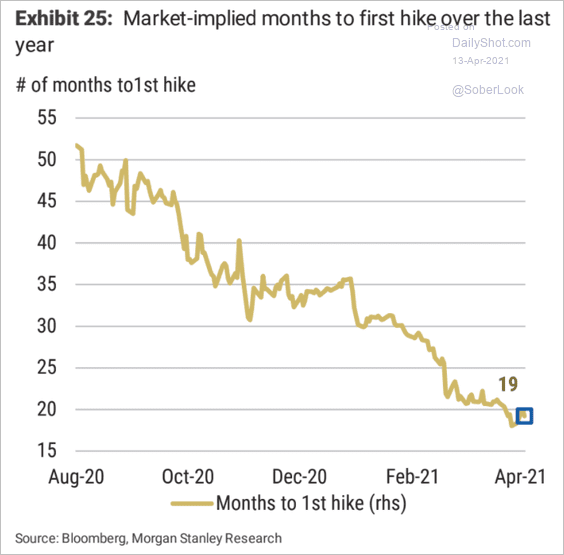 Source: Morgan Stanley Research
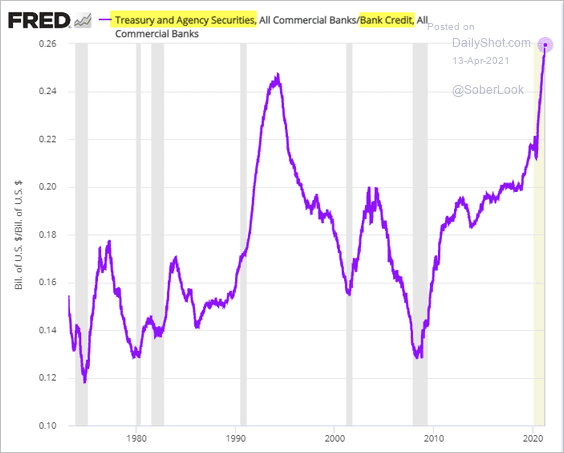
2. Banks’ Treasury holdings as a share of total bank credit hit a record high.
3. The copper-to-gold ratio points to higher Treasury yields.
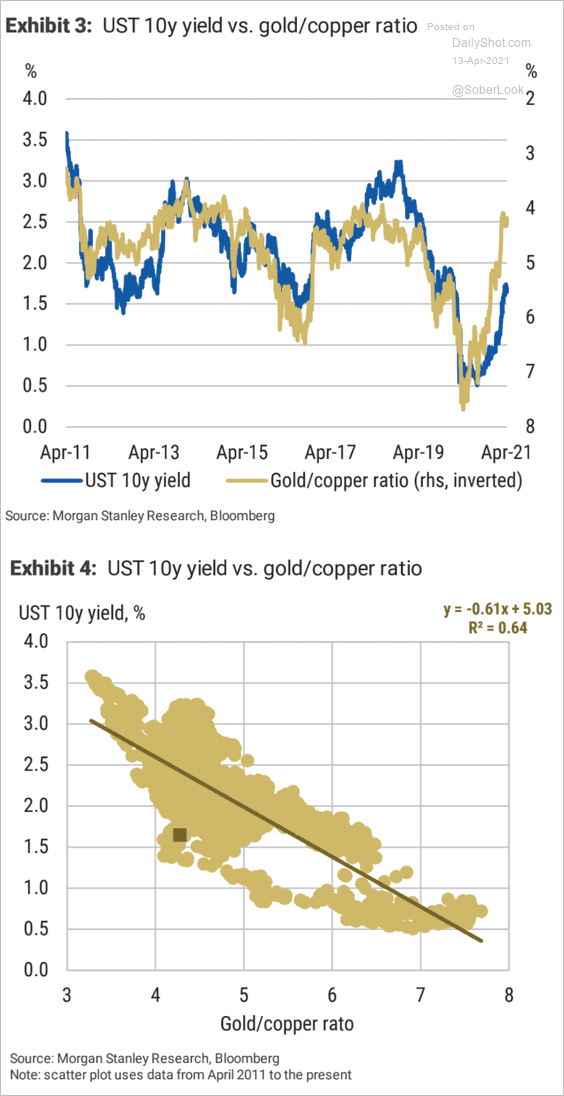 Source: Morgan Stanley Research
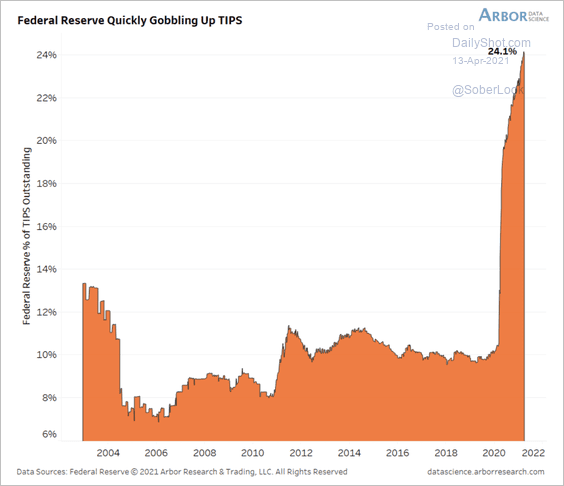
4. Next, we have some updates on the TIPS market.
• This chart shows TIPS as a share of the Fed’s Treasury securities holdings and the same ratio for the overall market.
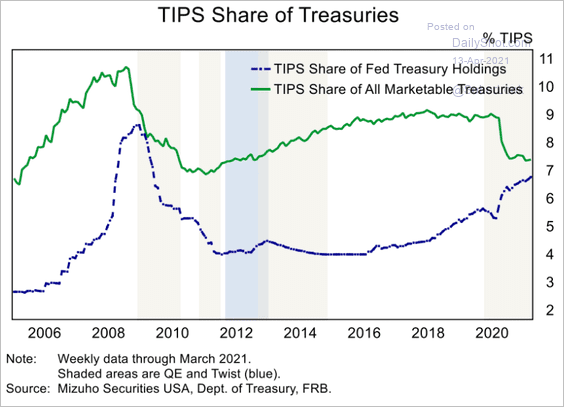 Source: Mizuho Securities USA
• The Fed’s holdings of TIPS jumped from about 10% before the pandemic to nearly 24% of total outstanding last week – a dominant force behind the drop in liquidity premiums and real yields, according to Arbor Data Science.
 Source: Arbor Research & Trading
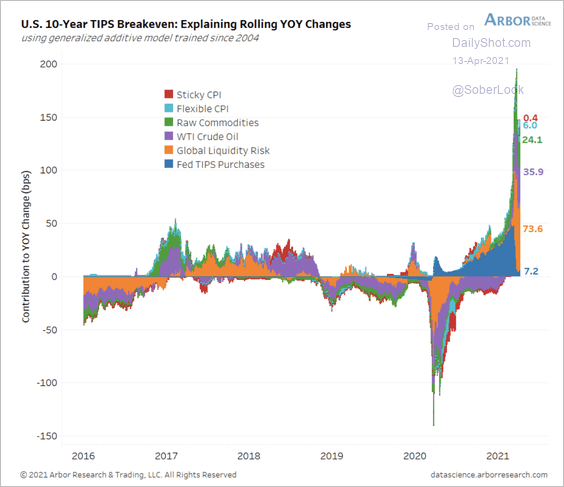
Here is the estimated impact of liquidity and Fed purchases on TIPS breakevens.
 Source: Arbor Research & Trading
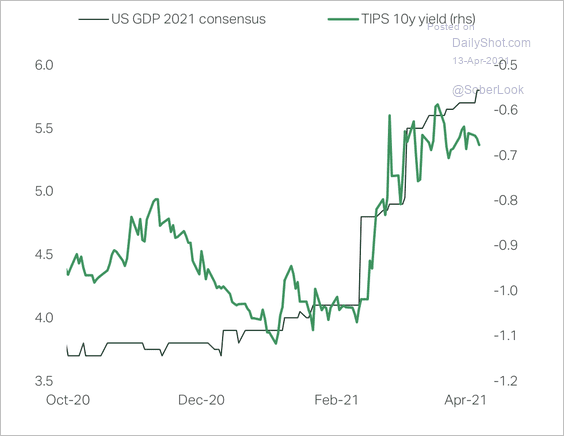
• The 10-year TIPS yield has risen along with upgraded growth forecasts.
 Source: TS Lombard
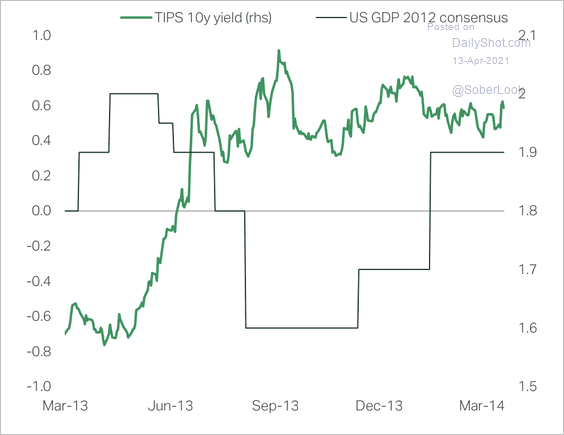
By the way, growth estimates were downgraded during the ‘taper tantrum.’
 Source: TS Lombard
——————–
5. Should we be concerned about a hardhat and a shovel in Jerome Powell’s home office?
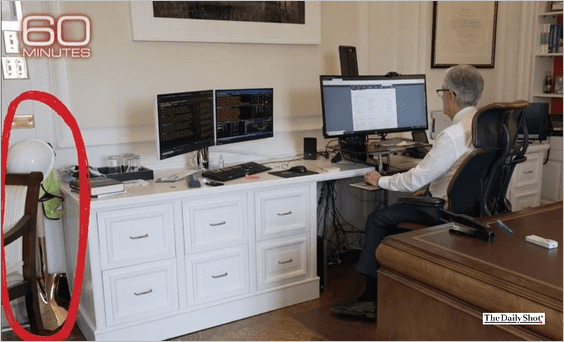 Source: 60 Minutes; @ParikPatelCFA
Back to Index
Global Developments
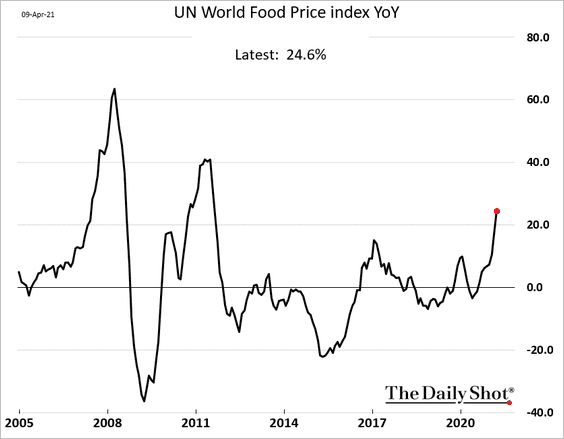
1. Global food prices are up nearly 25% over the past 12 months.
2. Central banks are starting to hike rates, especially in emerging markets due to concerns about rising inflation (2 charts).
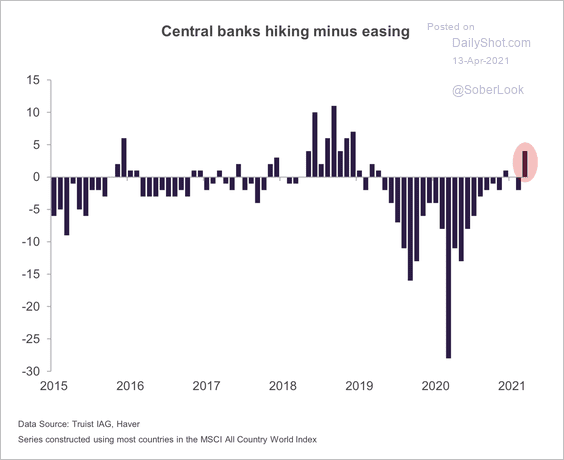 Source: Truist Advisory Services
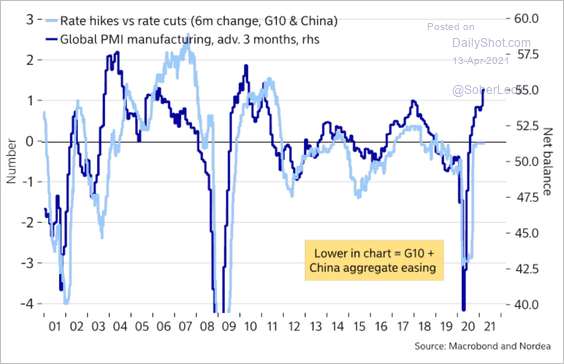 Source: @enlundm Read full article
——————–
3. As growth and inflation rebound, liquidity conditions should start to tighten at the margin, according to Variant Perception.
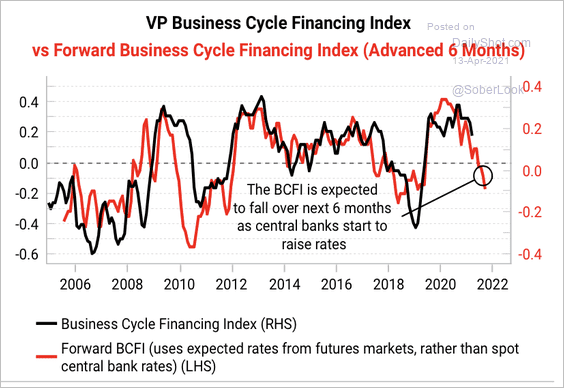 Source: Variant Perception
4. Japanese yen longs have flipped to short while Euro longs are unwinding. This has coincided with recent dollar strength.
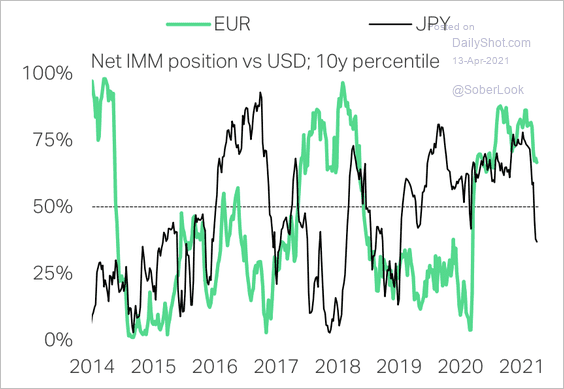 Source: TS Lombard
5. A wider US trade deficit leads to a dollar credit boom in the rest of the world, which is positive for ex-US growth, according to Gavekal Research.
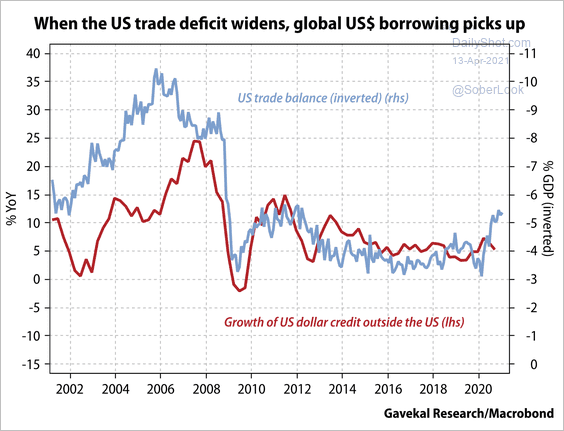 Source: Gavekal Research
——————–
Food for Thought
1. Fiber broadband subscriptions:
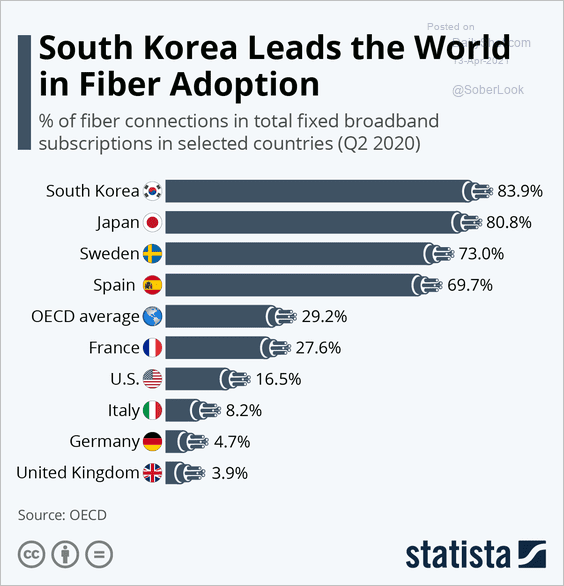 Source: Statista
2. Semiconductor demand:
 Source: @BW Read full article
3. NYC restaurant spending:
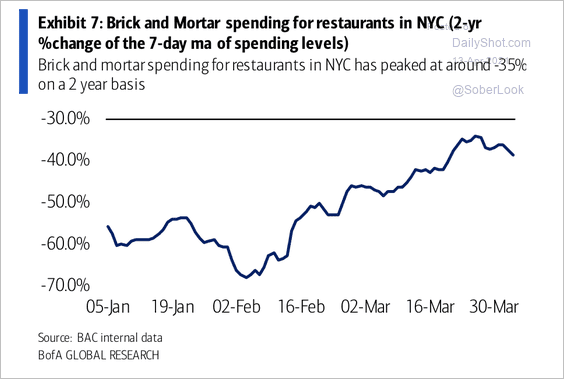 Source: BofA Global Research
4. Not working because of worries about getting the coronavirus:
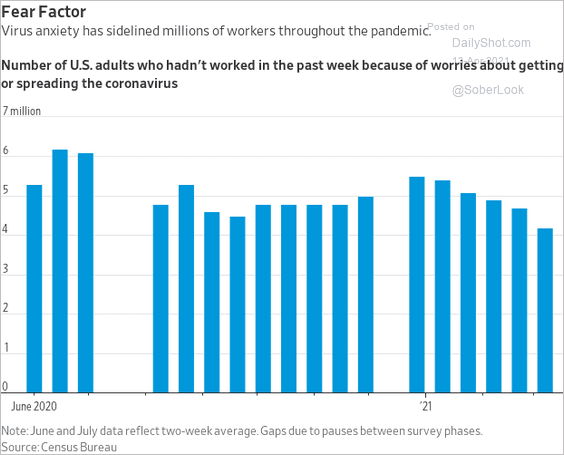 Source: @WSJ Read full article
5. US structurally deficient bridges:
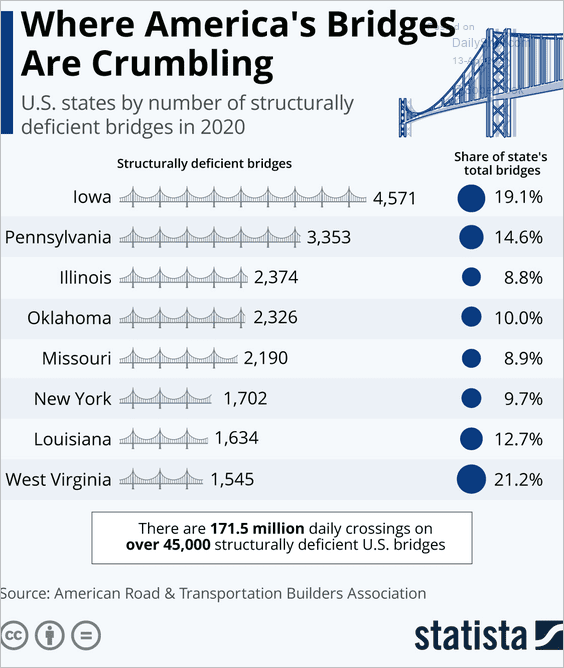 Source: Statista
6. Latino representation in the US Congress:
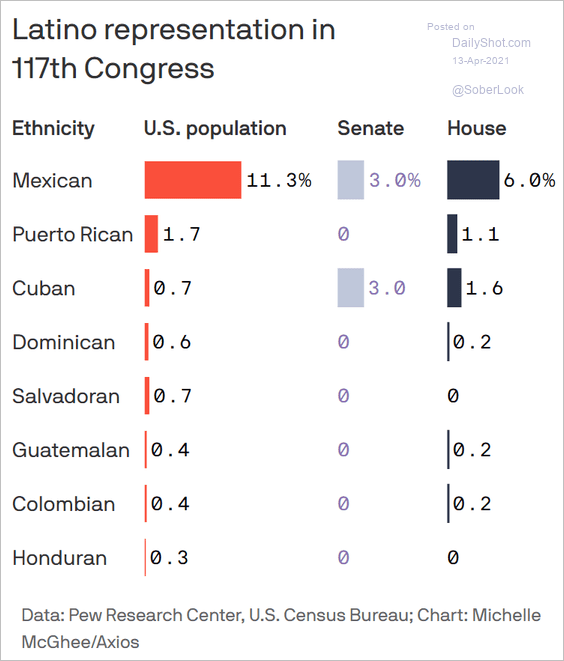 Source: @axios Read full article
7. Trust in news media:
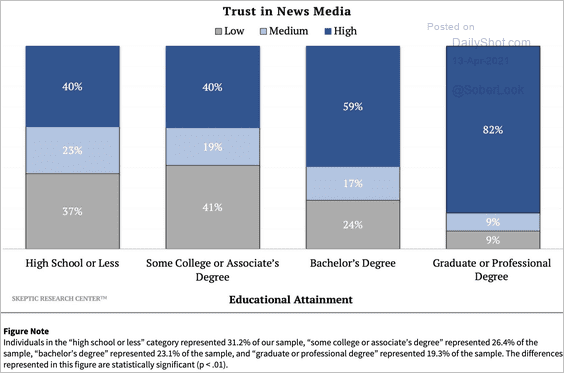 Source: @michaelshermer, @SkepResCenter Read full article
8. Vaccine development and approval:
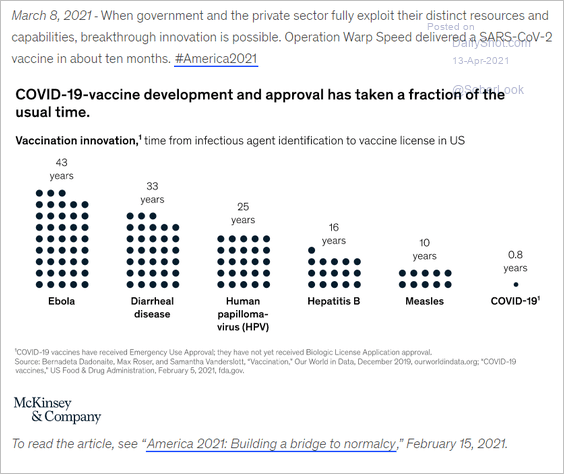 Source: McKinsey & Company Read full article
9. Leading causes of death in 2020:
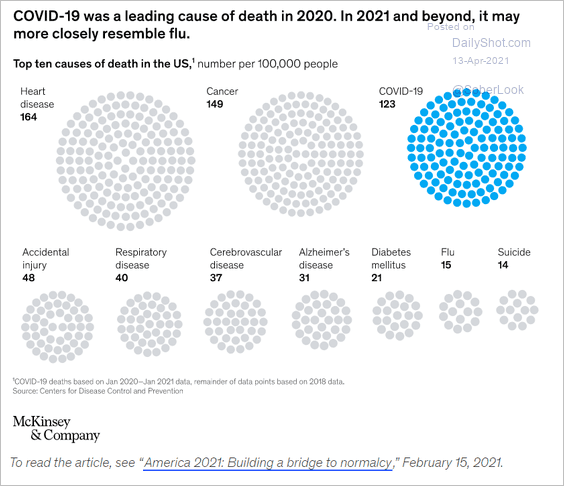 Source: McKinsey & Company Read full article
10. Shape of the world over time:
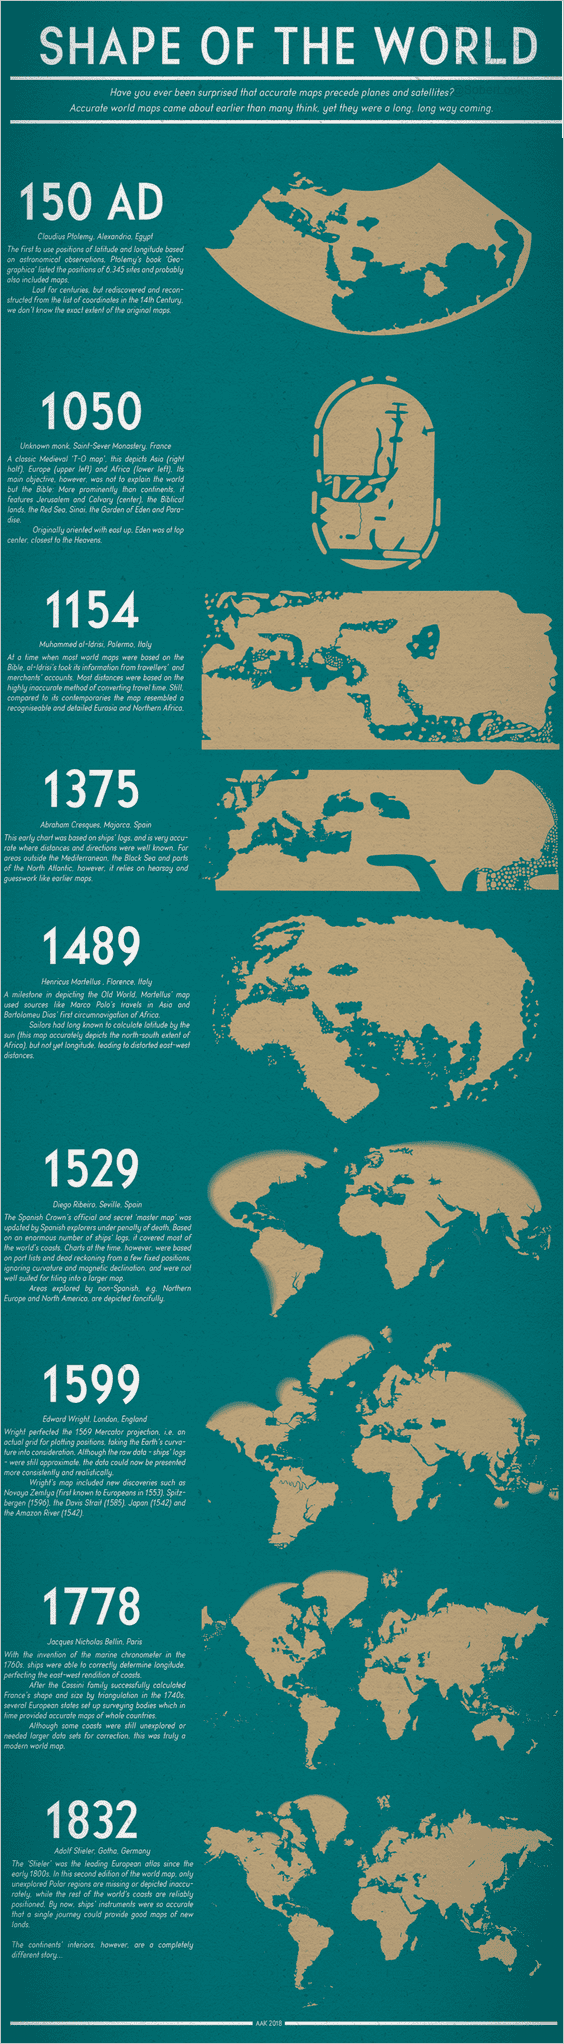 Source: Visual Capitalist Read full article
——————–
Back to Index