
The Daily Shot: 15-Apr-21
• The United States
• The United Kingdom
• The Eurozone
• Asia – Pacific
• China
• Emerging Markets
• Cryptocurrency
• Commodities
• Energy
• Equities
• Rates
• Global Developments
• Food for Thought
The United States
1. The Fed’s Beige Book report was more upbeat than the markets were expecting. The survey also showed an increase in inflation.
 Source: MarketWatch Read full article
Economic uncertainty and COVID concerns are easing (2 charts).
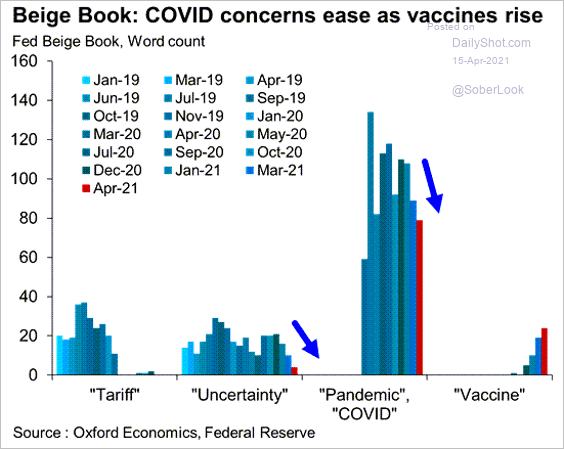 Source: @GregDaco, @federalreserve, @OxfordEconomics
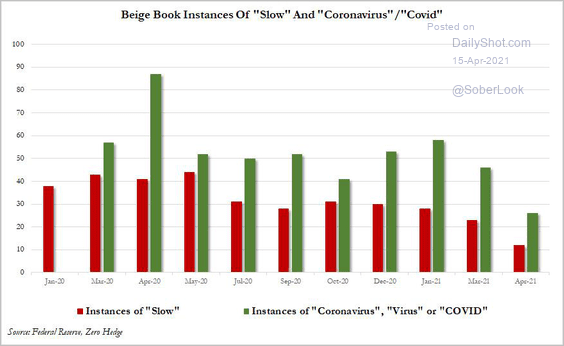 Source: @zerohedge
Beige Book activity indicators (based on the language used in the report) are up sharply (2 charts), pointing to an acceleration in growth.
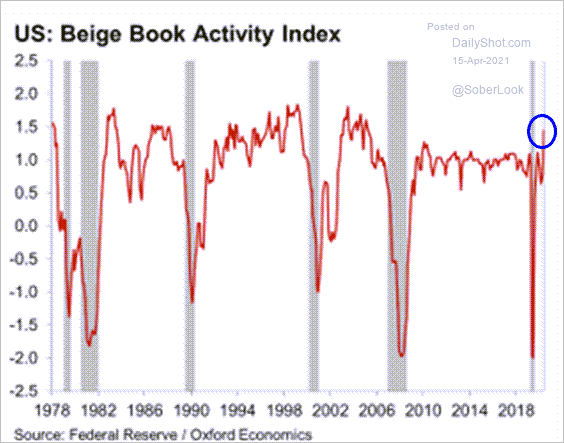 Source: @BostjancicKathy
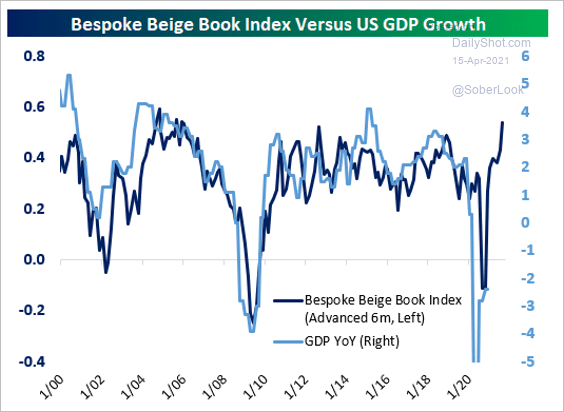 Source: Bespoke Investment Group; @pearkes
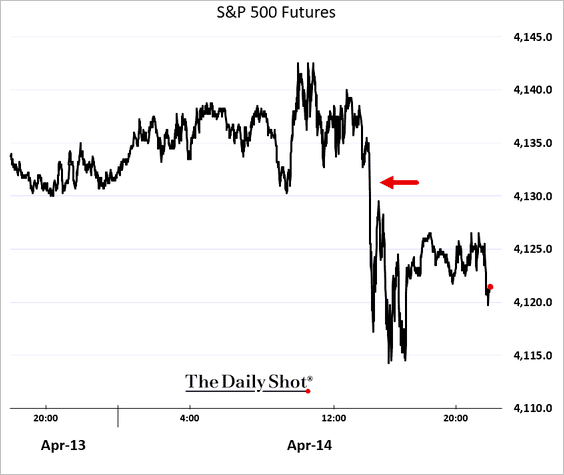
Stocks pulled back from the highs after the Beige Book report was released (due to inflation concerns).
——————–
2. Now, let’s take a look at some inflation trends.
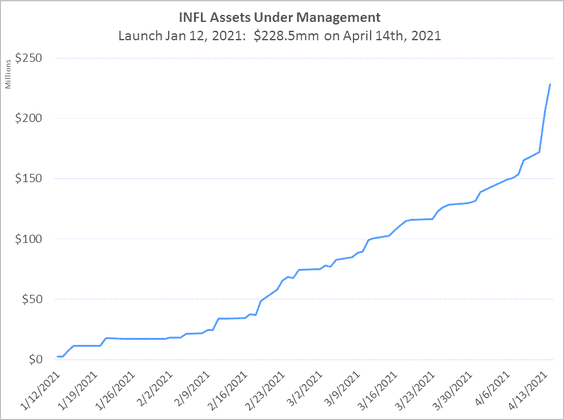
• A recently launched ETF that focuses on inflation-sensitive stocks continues to attract capital.
 Source: Horizon Kinetics
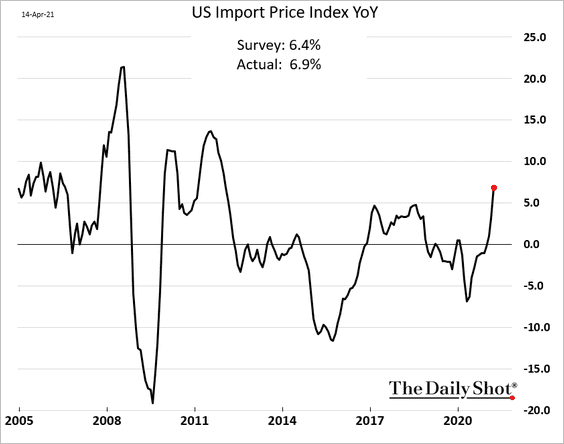
• Import price inflation surprised to the upside.
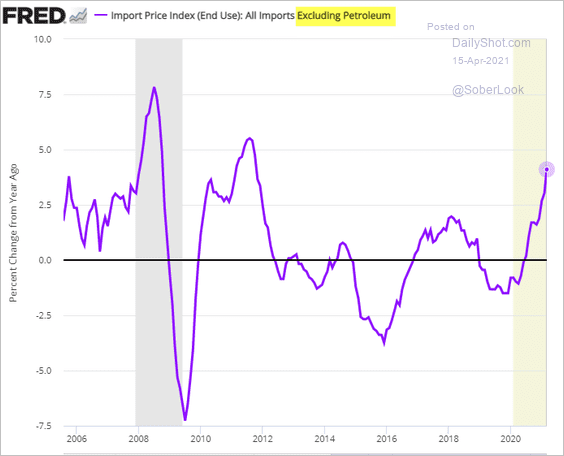
Below is the same index excluding petroleum imports.
• Here is a CPI forecast from Barclays.
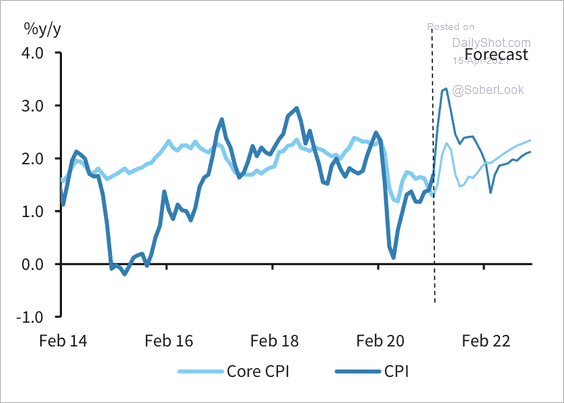 Source: Barclays Research
• Small businesses are gaining some pricing power.
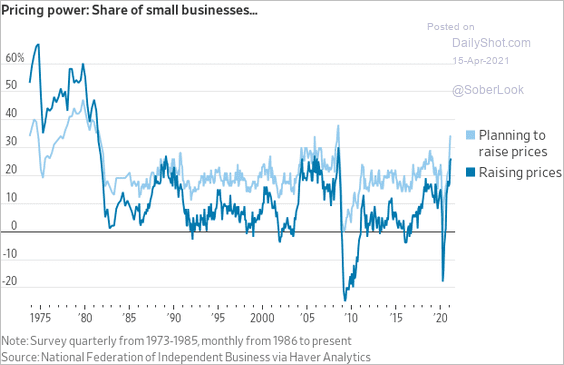 Source: @jeffsparshott
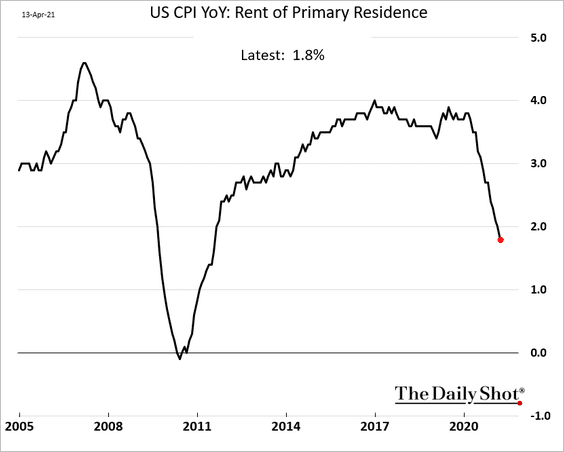
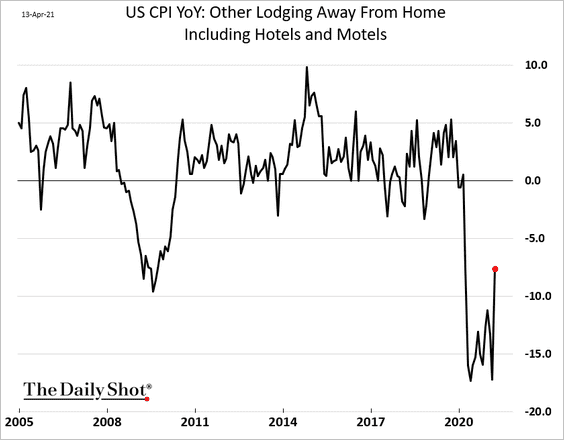
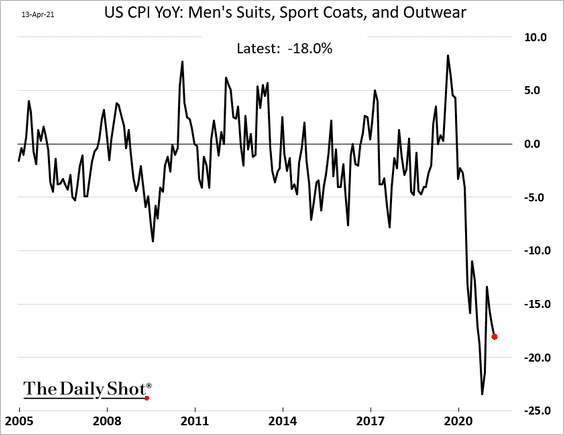
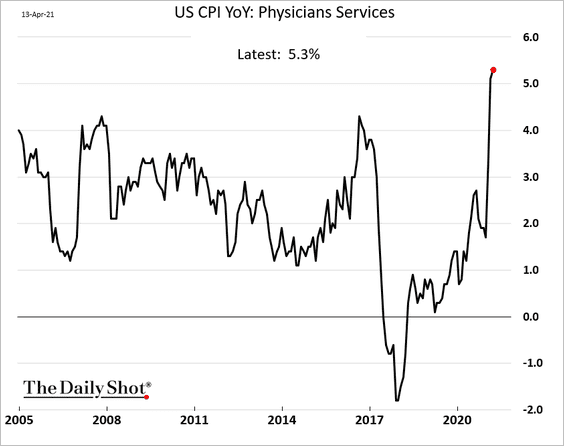
• Below are a few sector CPI trends.
– Going out vs. staying in:
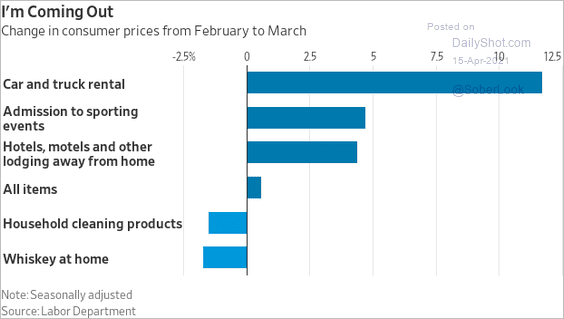 Source: @jeffsparshott
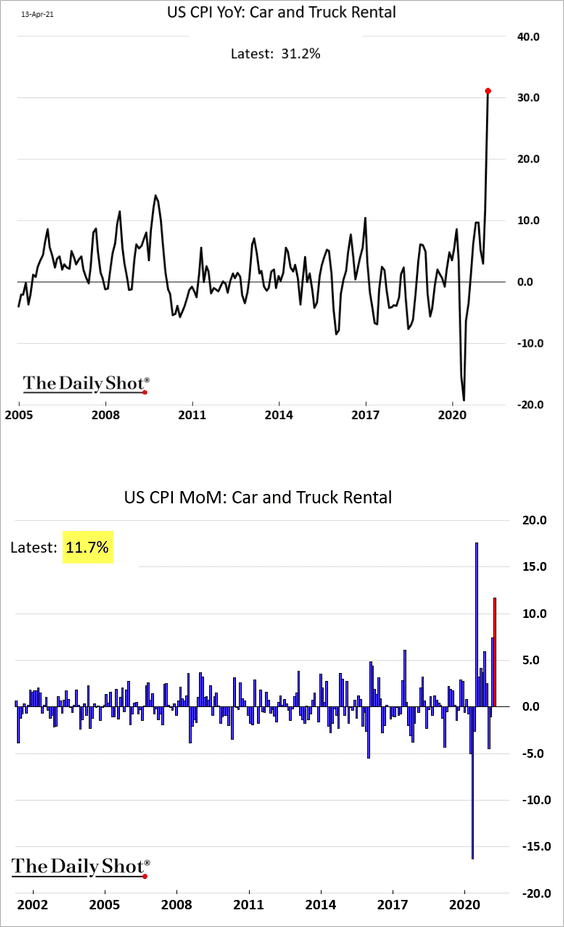
– Car rental CPI (year-over-year and month-over-month):
– Rent:
– Hotels:
– Men’s suits:
– Physicians’ services:
– Haircuts:
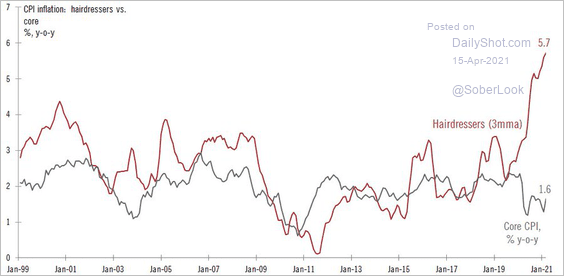 Source: @TCosterg
——————–
3. Next, we have some updates on the housing market.
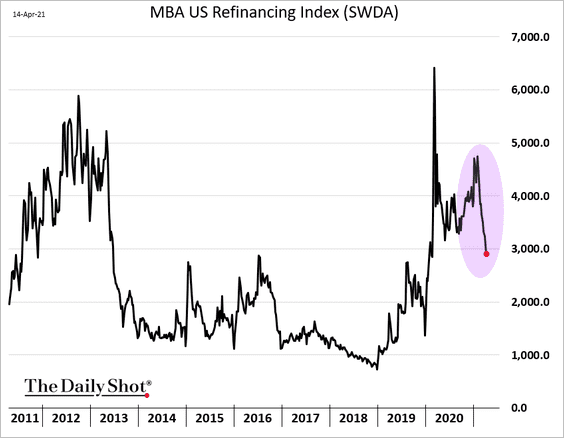
• Mortgage applications for house purchase moved lower last week (now below 2019 levels).
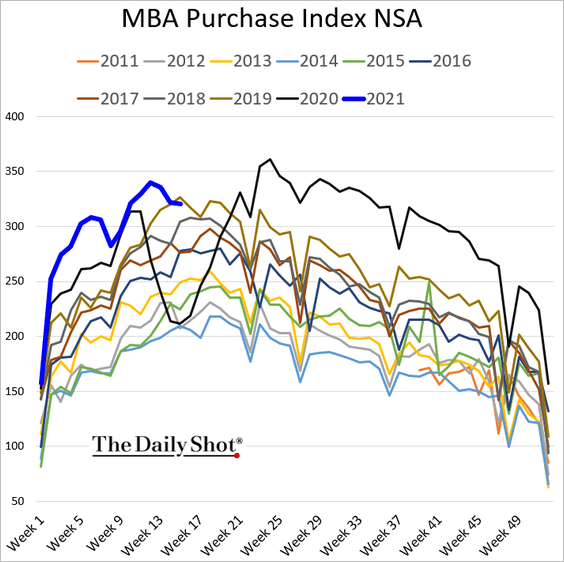
Refi activity continues to slow.
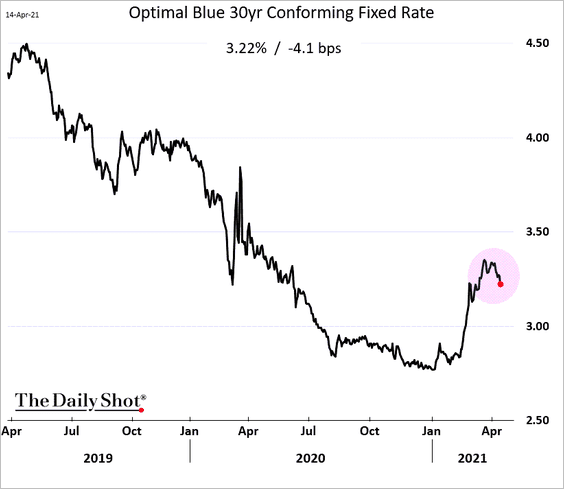
• However, mortgage rates are now drifting lower.
• Bidding wars have pushed home sale prices above list prices.
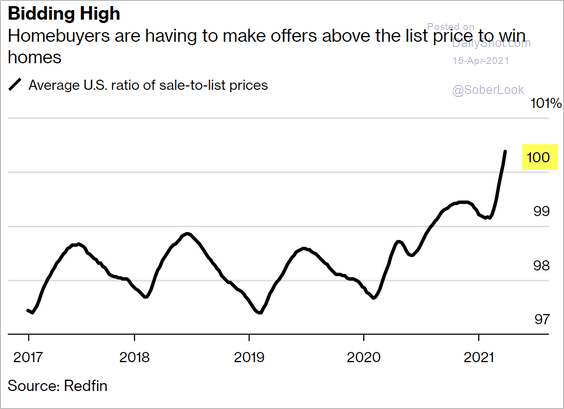 Source: Bloomberg Read full article
——————–
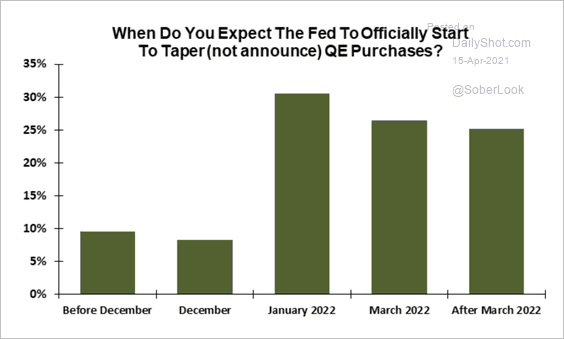
4. Investors expect the Fed to give a timeline of tapering QE purchases by September, aiming for a January start, according to a survey by Evercore ISI (2 charts).
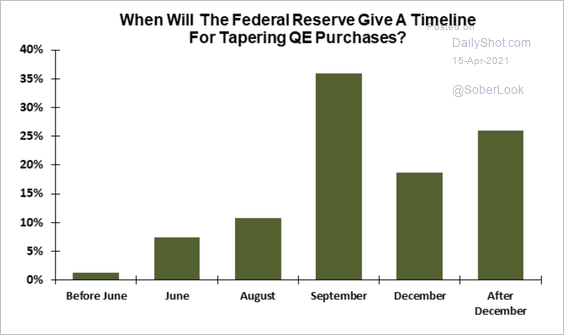 Source: Evercore ISI
 Source: Evercore ISI
Primary dealers expect a Fed taper by Q1 of next year and a rate hike in late 2023.
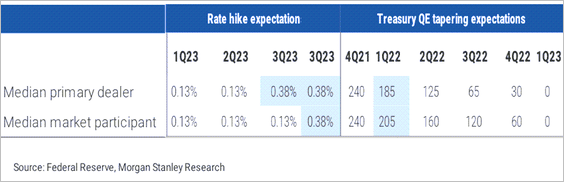 Source: Morgan Stanley Research
——————–
5. Business applications are surging (2 charts).
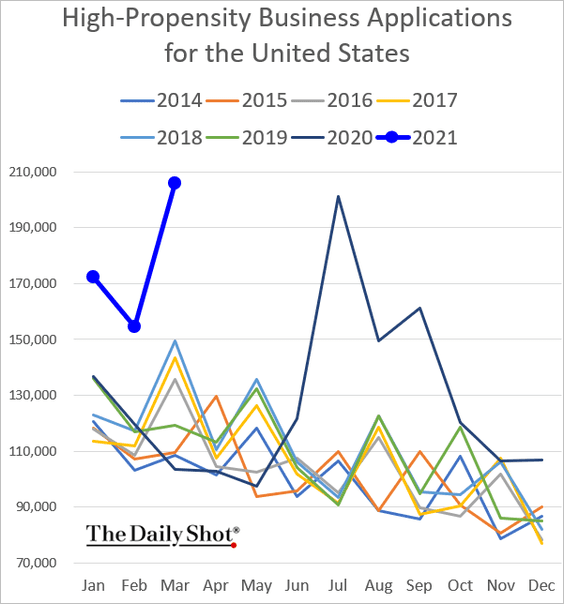
 Source: @bespokeinvest Read full article
——————–
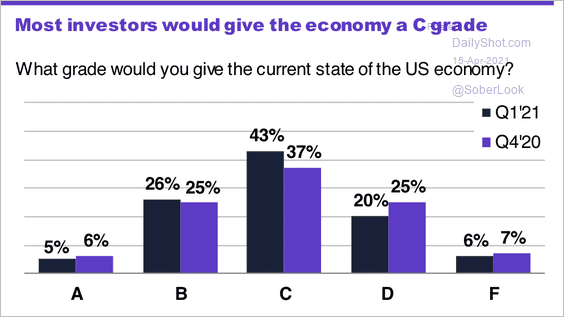
6. Retail traders are more upbeat on the economy, according to an E*Trade survey.
 Source: E*Trade Financial
7. Household net worth has risen along with government debt over the past decade.
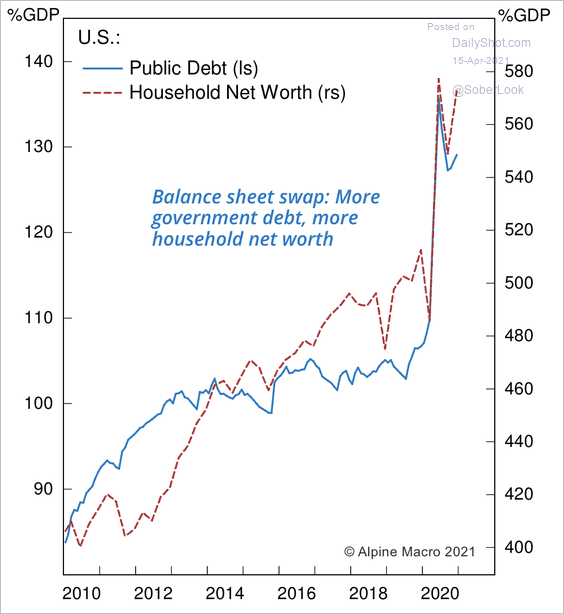 Source: Alpine Macro
Back to Index
The United Kingdom
1. Trade with the EU showed some improvement in February.
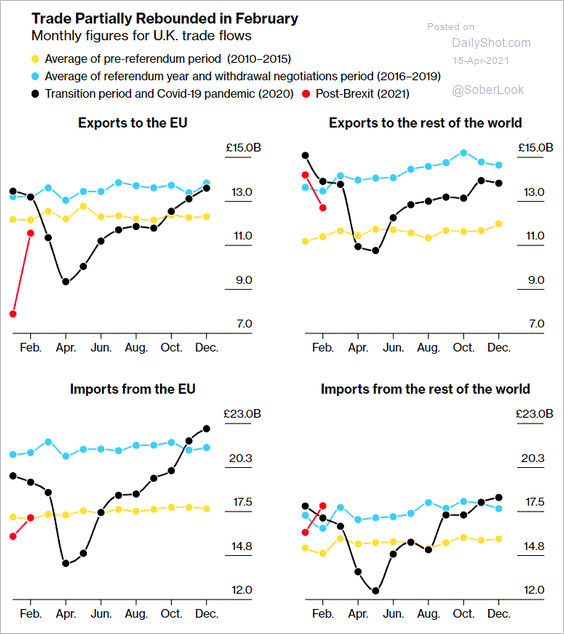 Source: Bloomberg Read full article
2. The vaccination differential with Germany points to a lower EUR/GBP.
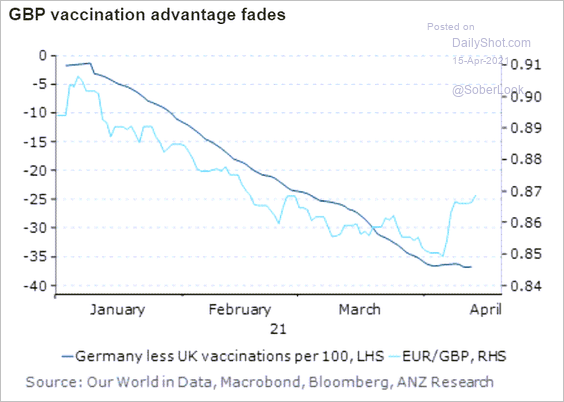 Source: ANZ Research
3. What are the benefits of remote work?
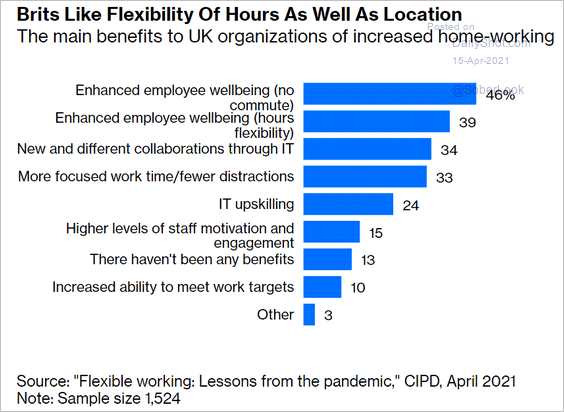 Source: Chris Hughes, Bloomberg Read full article
4. This chart shows UK park visits by age.
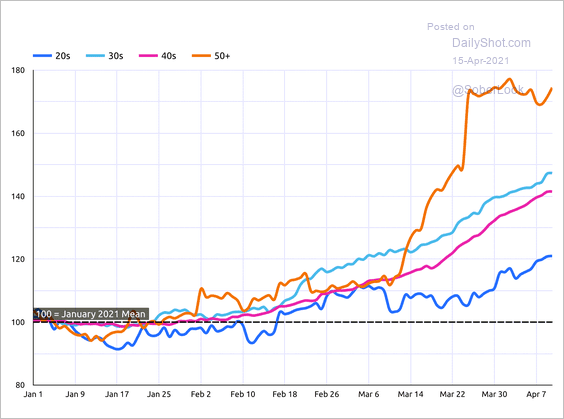 Source: Huq Read full article
Back to Index
The Eurozone
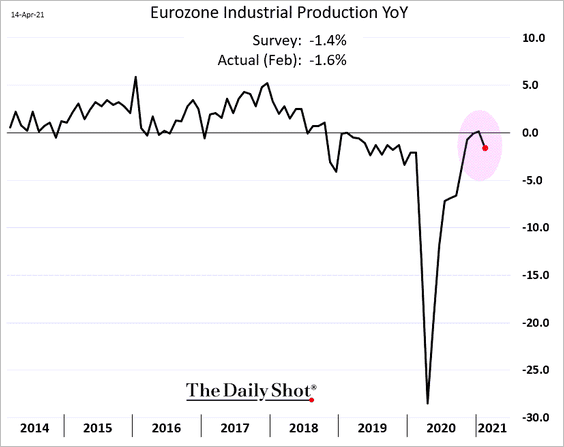
1. Industrial production eased in February.
2. More gains for producer price inflation ahead?
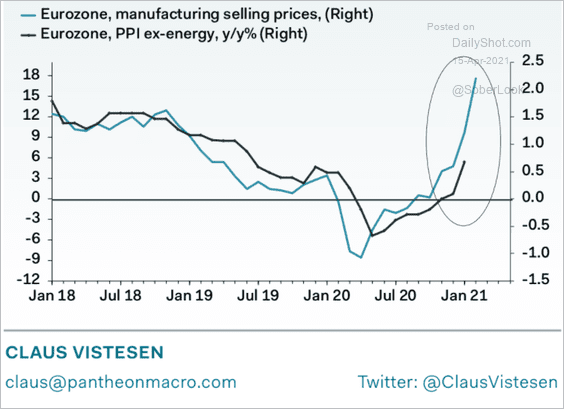 Source: Pantheon Macroeconomics
3. Is previously misallocated capital burdening the euro area?
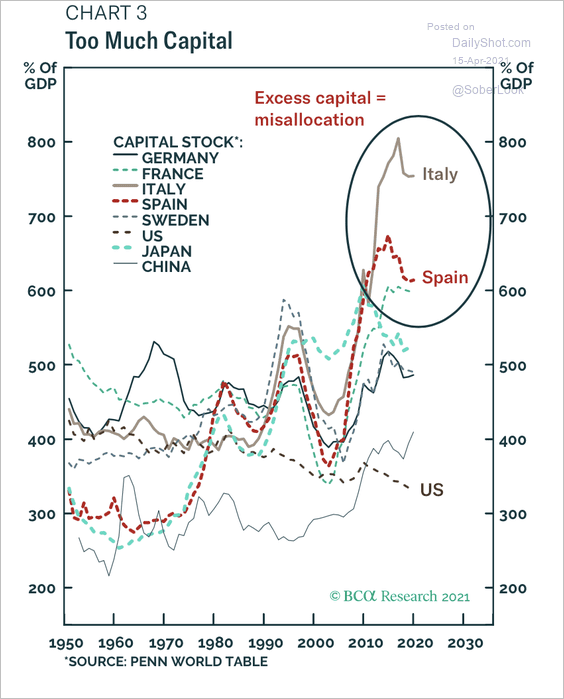 Source: BCA Research
4. This chart shows Italian and German unit labor costs (a measure of competitiveness).
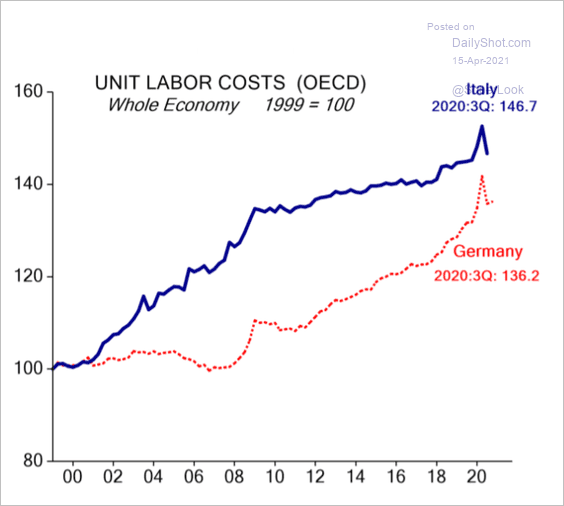 Source: Evercore ISI
Back to Index
Asia – Pacific
1. The Bank of Japan has increased its purchases of domestic equities as foreigners retreated over the past few years.
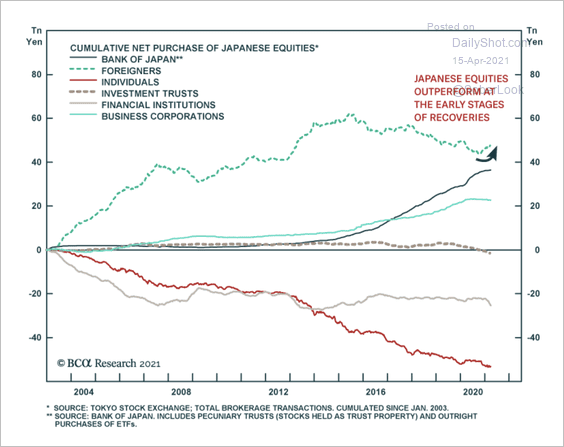 Source: BCA Research
2. Asia’s central banks are not concerned about inflation.
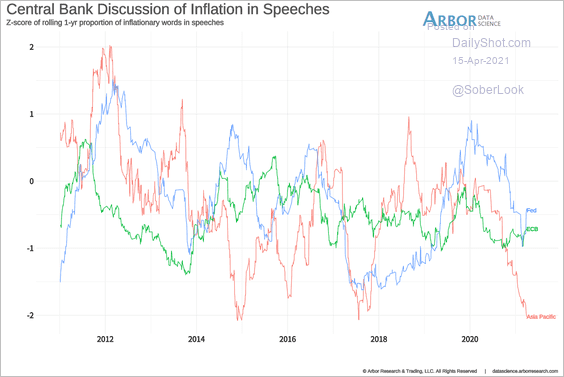 Source: Arbor Research & Trading
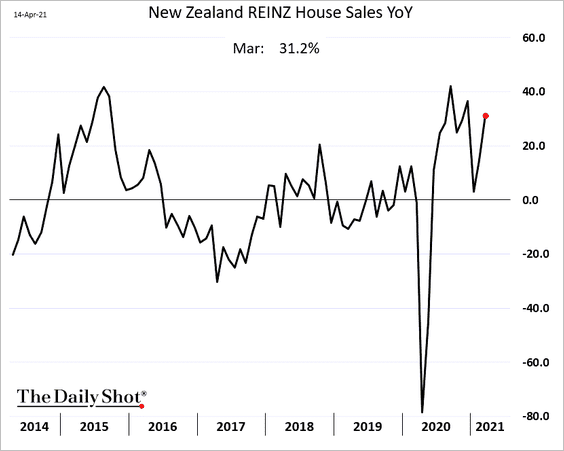
3. New Zealand’s home sales surged again last month.
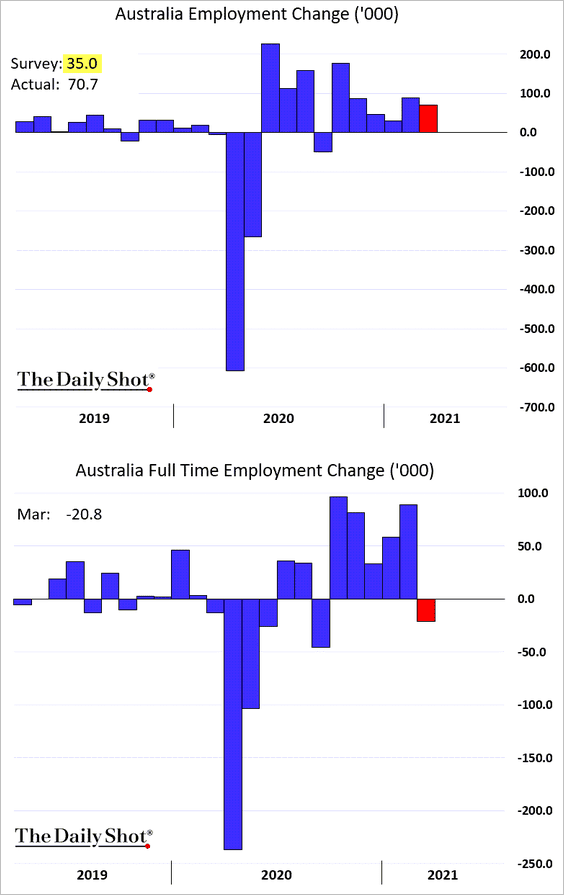
4. Next, we have some updates on Australia.
• The employment report topped economists’ forecasts, although job gains were driven by part-time positions.
– The unemployment rate continues to fall.
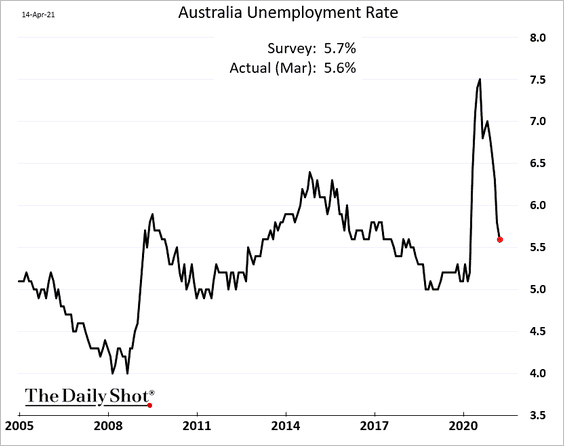
Here is a comparison with previous downturns.
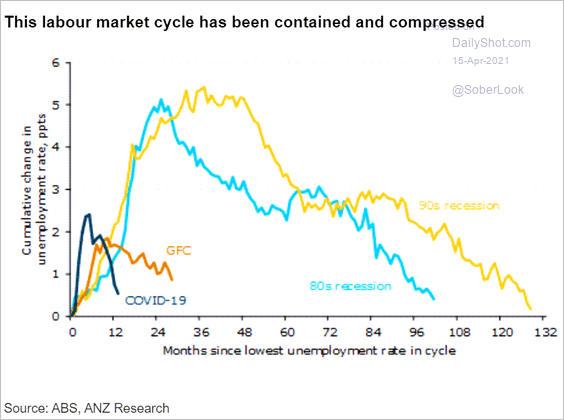 Source: ANZ Research
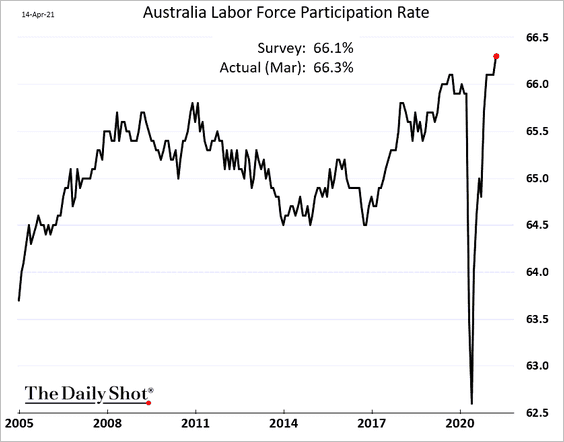
– The labor force participation rate hit a record high.
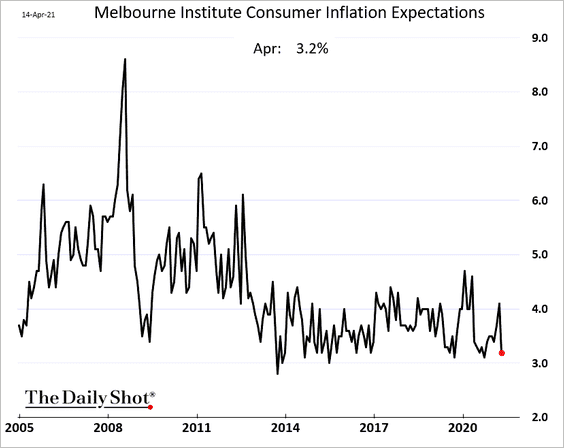
• Consumer inflation expectations are back near the lows.
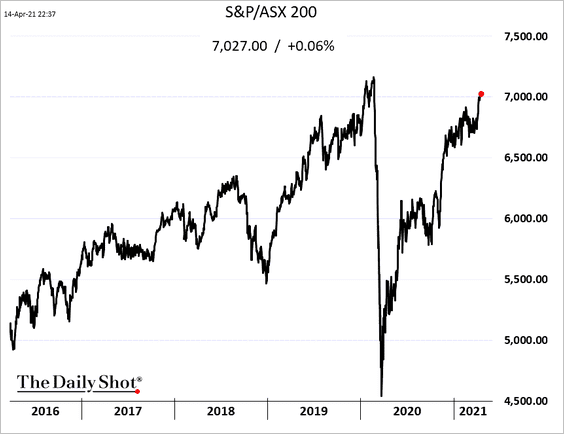
• The stock market is almost back to the pre-COVID peak.
 h/t @ThuyOng
Back to Index
China
1. Housing market metrics have been robust.
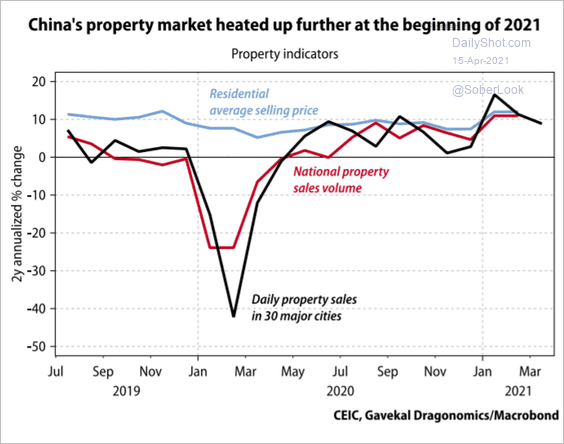 Source: Gavekal Research
2. Time to shrink the world’s largest money market fund?
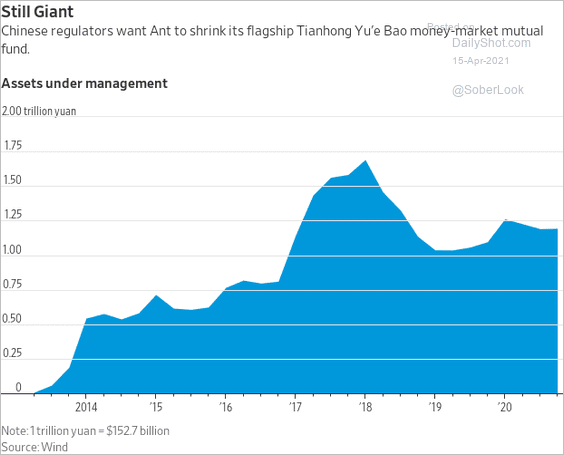 Source: @WSJ Read full article
3. Who controls China’s mobile payments market?
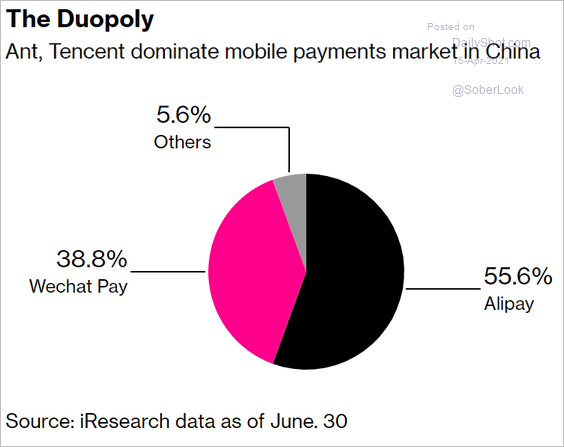 Source: Bloomberg Read full article
Back to Index
Emerging Markets
1. India’s pandemic situation is out of control.
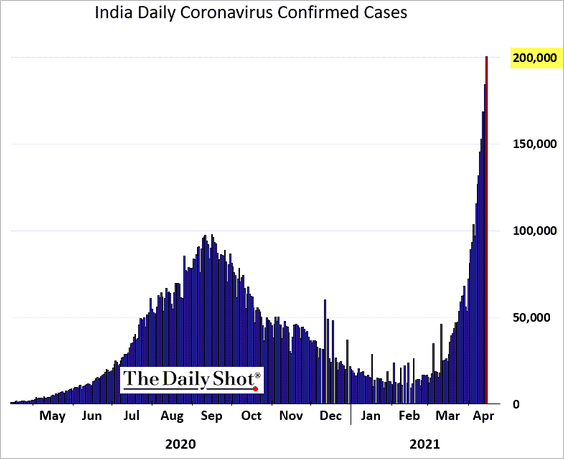
This chart shows India’s vaccination trend.
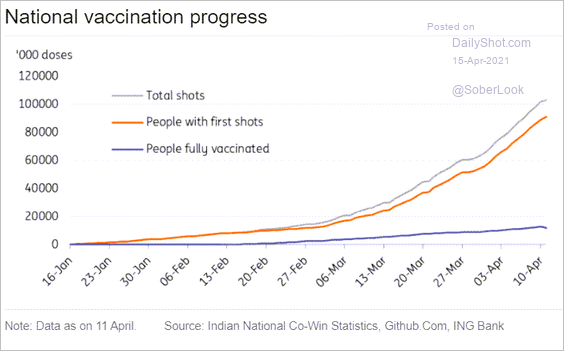 Source: ING
——————–
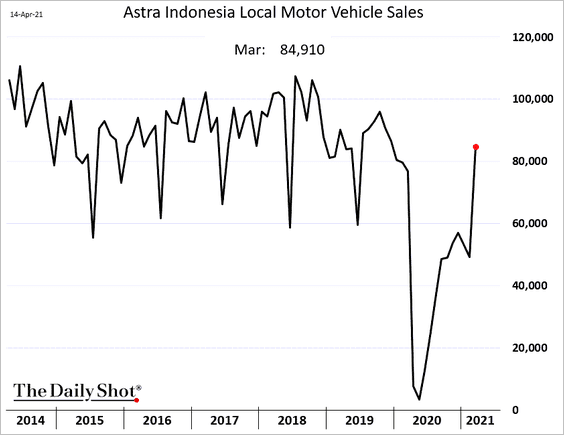
2. Indonesia’s vehicle sales are back at pre-crisis levels.
3. COVID cases in Turkey are accelerating.
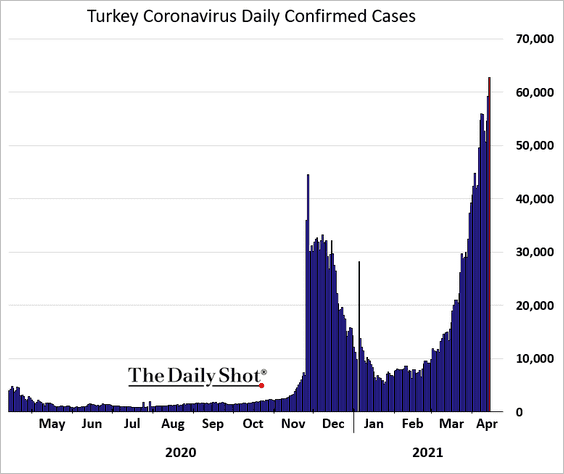
Investors have been pulling capital out of the country since the central bank chief’s removal.
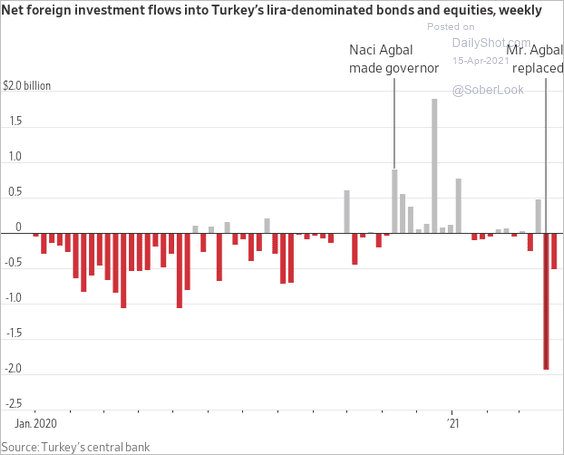 Source: @WSJ Read full article
——————–
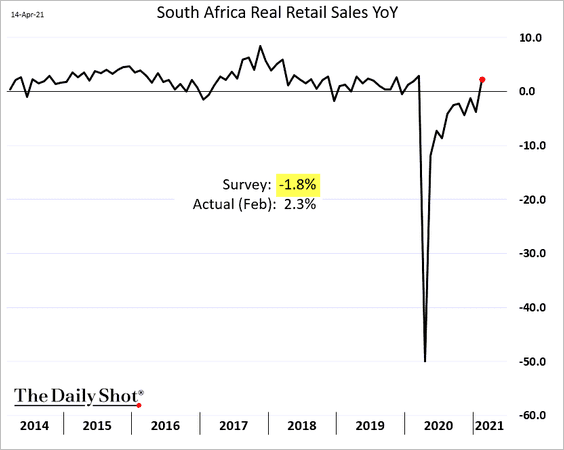
4. South Africa’s retail sales jumped in February.
5. Here are some updates on Russia.
• Capital outflows continue to weigh on the Russian ruble.
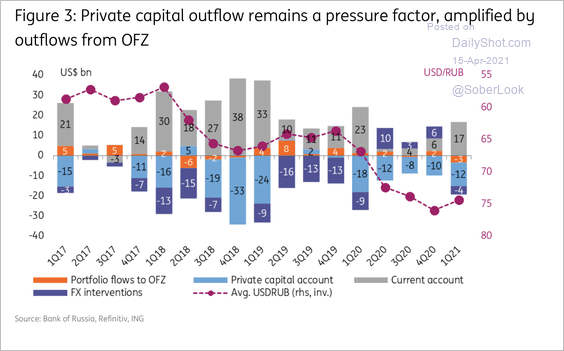 Source: ING
• The current ruble weakness, mainly due to non-oil factors, has led to decoupling from oil prices (2 charts).
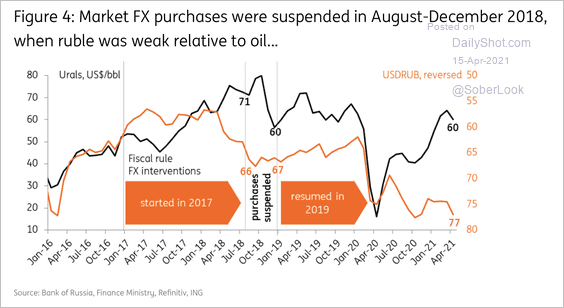 Source: ING
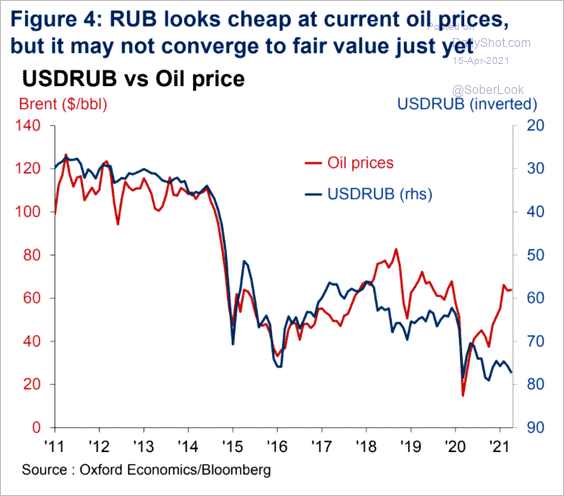 Source: Oxford Economics
• The ruble’s underperformance versus peers is the most extreme since 2018.
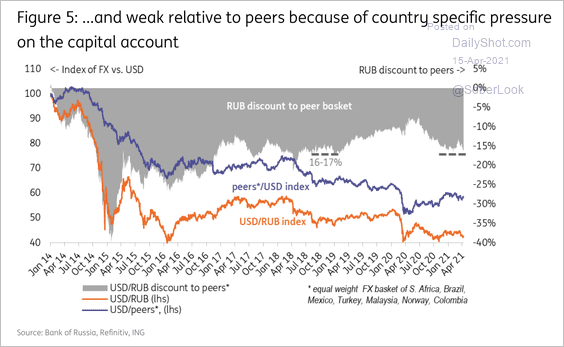 Source: ING
——————–
6. Russia, India, and Nigeria have some of the highest levels of non-performing loans relative to EM peers.
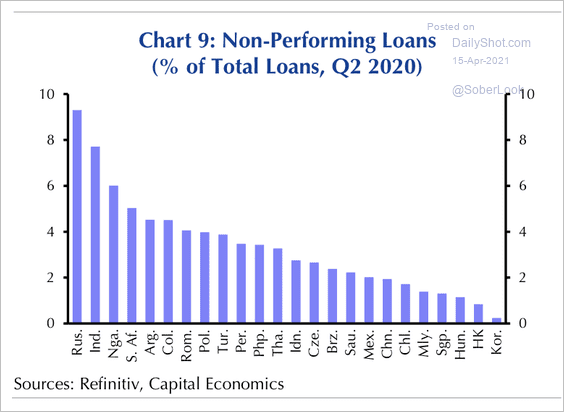 Source: Capital Economics
7. This chart illustrates the vaccination progress across EM economies.
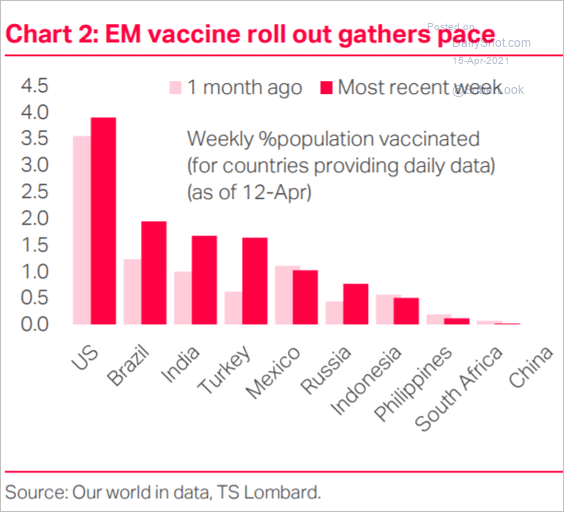 Source: TS Lombard
Back to Index
Cryptocurrency
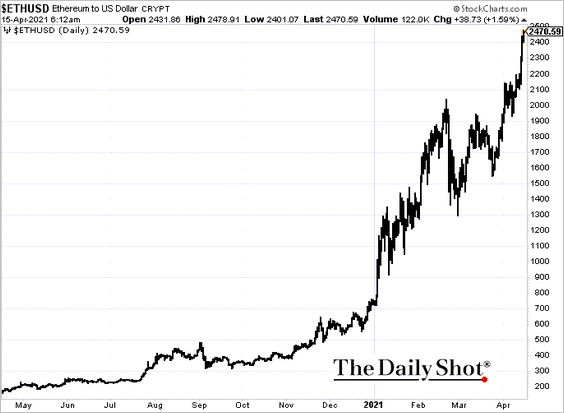
1. Cryptocurrencies continue to rally, with many hitting record highs.
• Ethereum:
• Dogecoin:
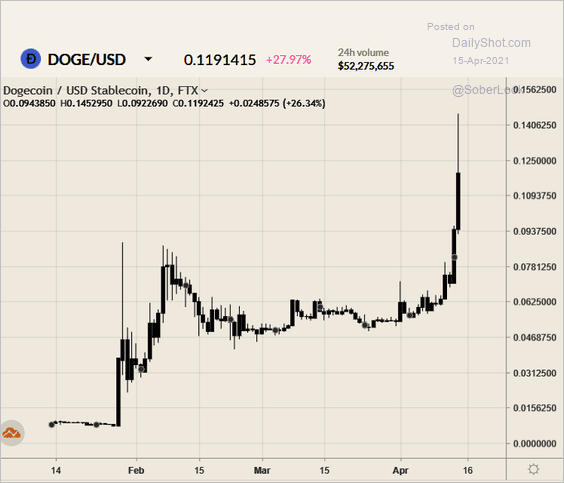 Source: FTX
 Source: @WSJ Read full article
——————–
2. Coinbase popped at the open but declined over the next two hours. Some investors were hoping to see a higher valuation.
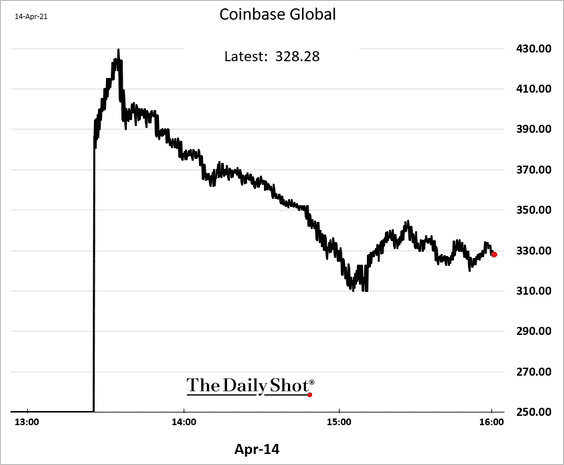
 Source: Reuters Read full article
——————–
3. The “kimchi premium” is back.
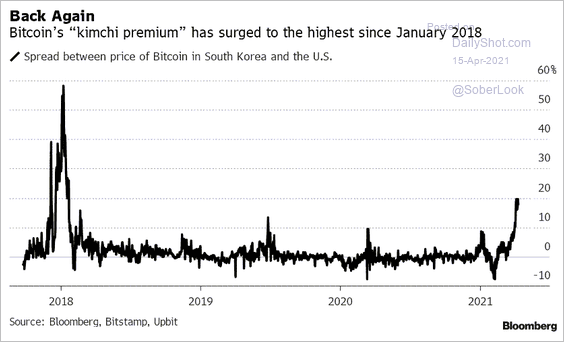 Source: Kyungji Cho, @TheTerminal, Bloomberg Finance L.P. Read full article
4. How long did it take to reach a $1 trillion valuation?
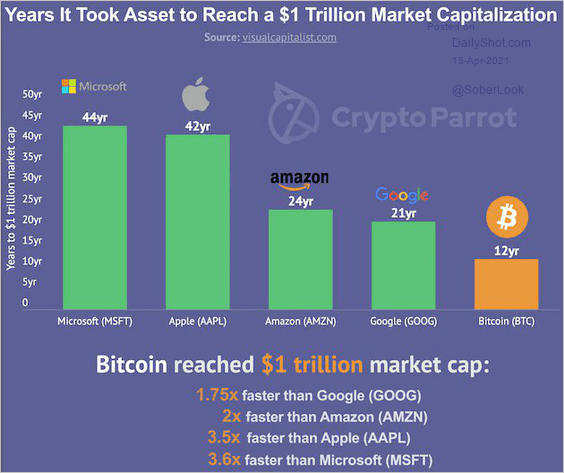 Source: @Schuldensuehner, Markets Insider Read full article
5. Is bitcoin a bubble?
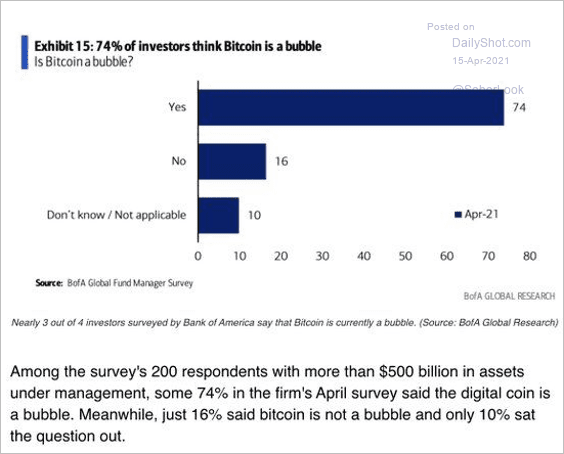 Source: BofA Global Research; Gustavo Fuhr
Back to Index
Commodities
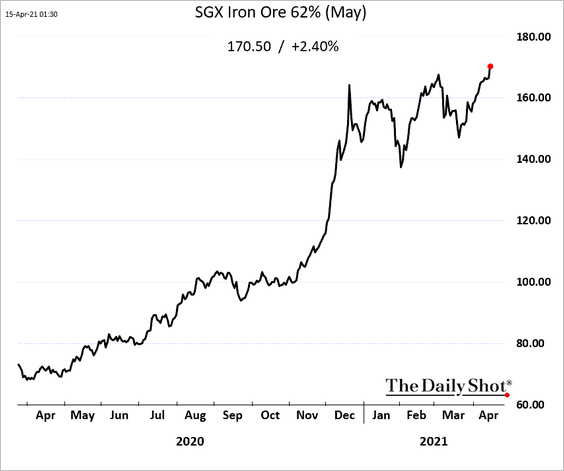
1. Iron ore futures are moving higher.
2. Copper prices have given up some of their gains versus oil this year.
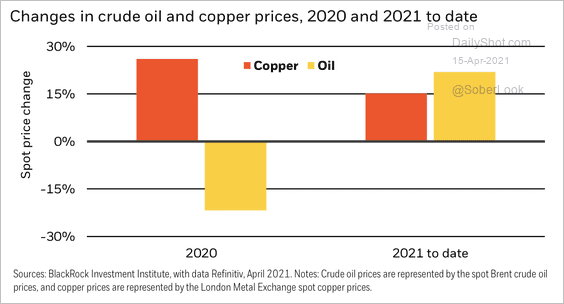 Source: BlackRock
Goldman now expects sharp price gains for copper in the years ahead, …
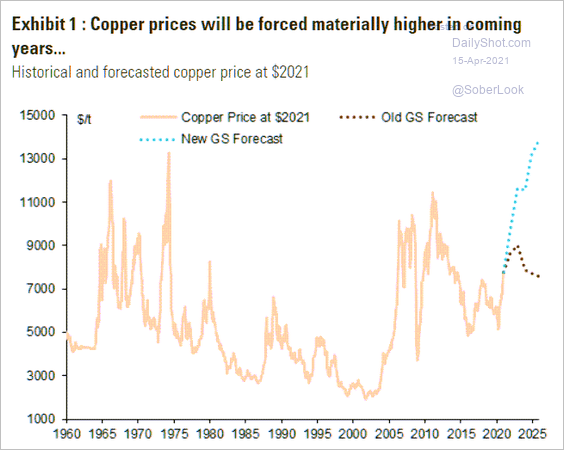 Source: Goldman Sachs; @themarketear
… as supplies shrink.
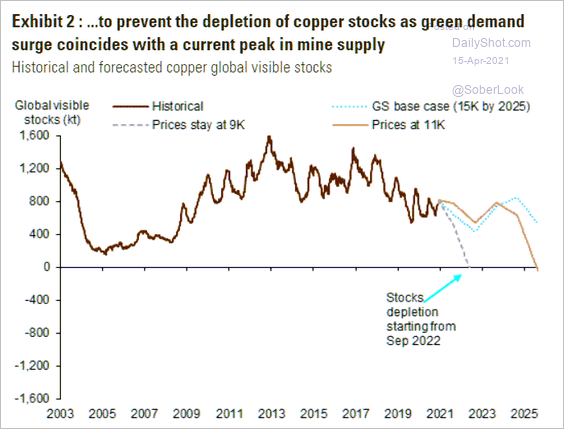 Source: Goldman Sachs; @themarketear
Back to Index
Energy
1. Crude oil futures jumped on Wednesday, …
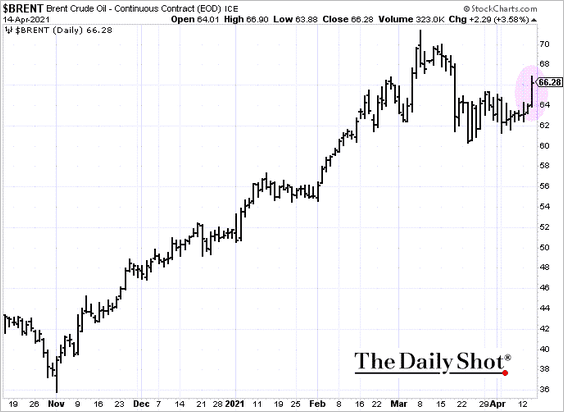
… as US inventories declined more than expected.
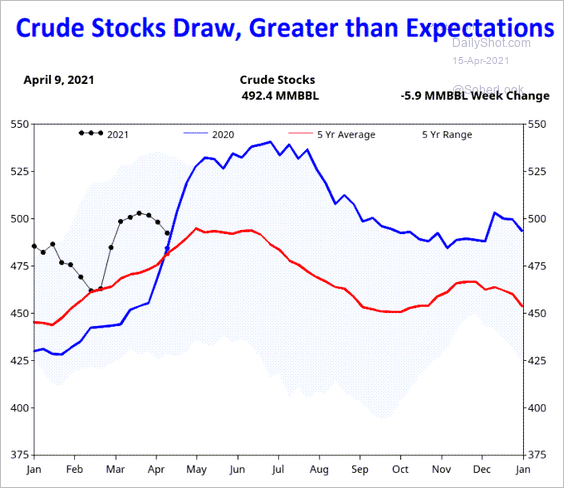 Source: Fundamental Analytics
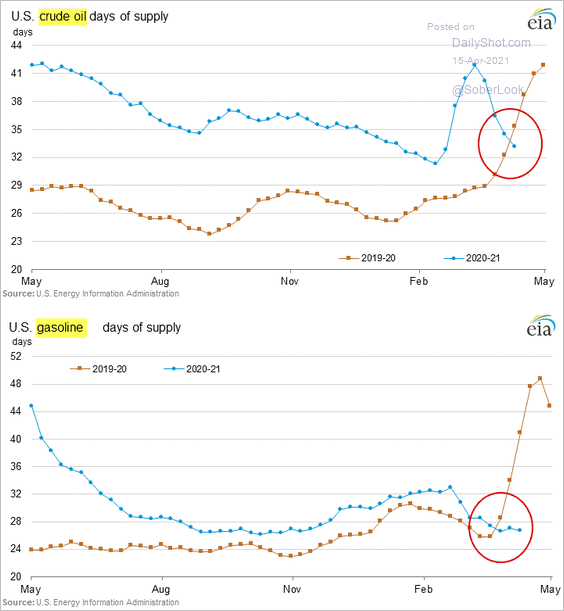
Here are the crude oil and gasoline inventories measured in days of supply.
——————–
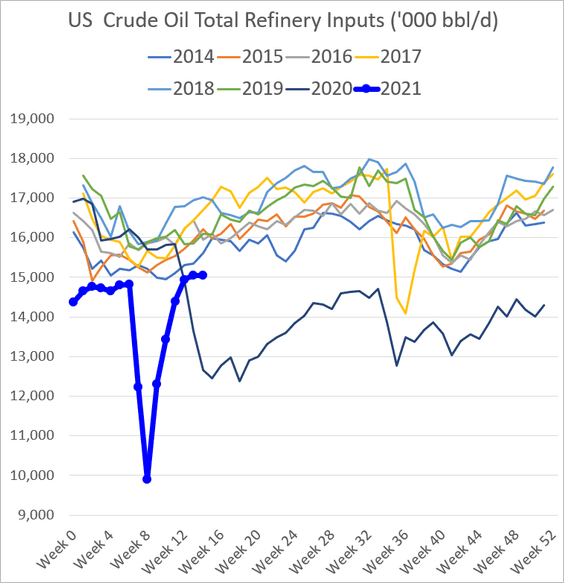
2. Refinery runs have leveled off.
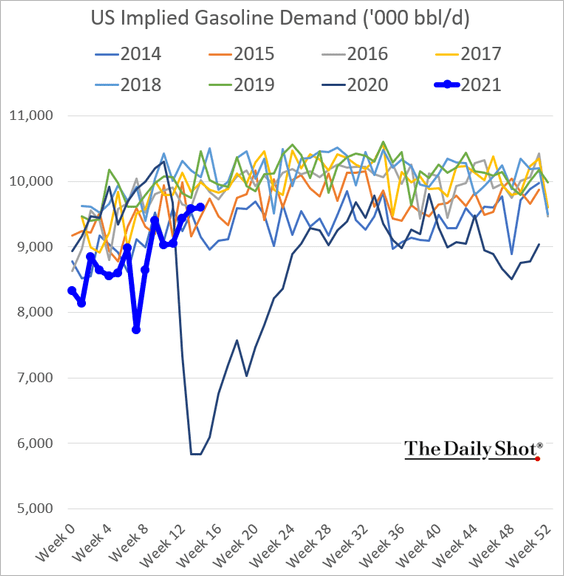
US gasoline demand is trending higher.
——————–
3. The SPDR Oil & Gas Exploration & Production ETF is at long-term resistance.
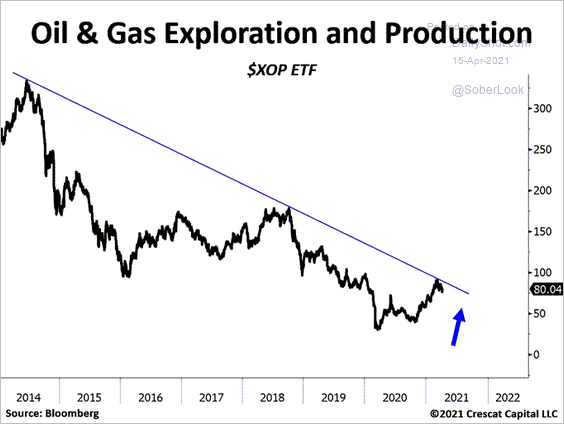 Source: @TaviCosta
4. This chart shows US electricity production by fuel source.
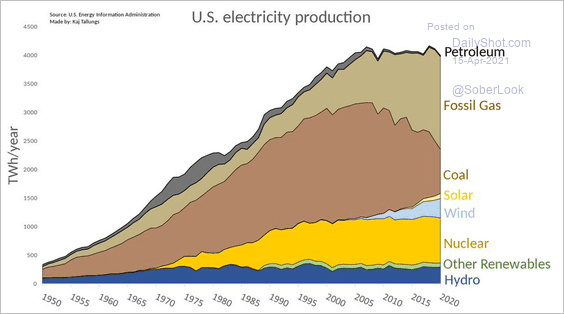 Source: @TheBigDataStats Read full article
Back to Index
Equities
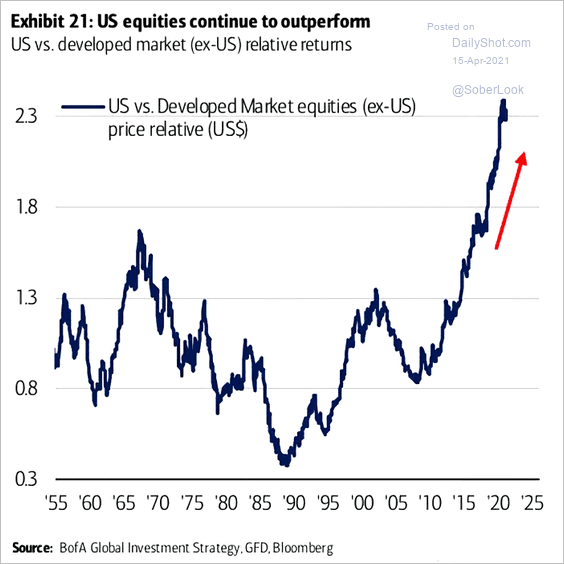
1. US stocks continue to outperform peers in other advanced economies.
 Source: @ISABELNET_SA, @BofAML
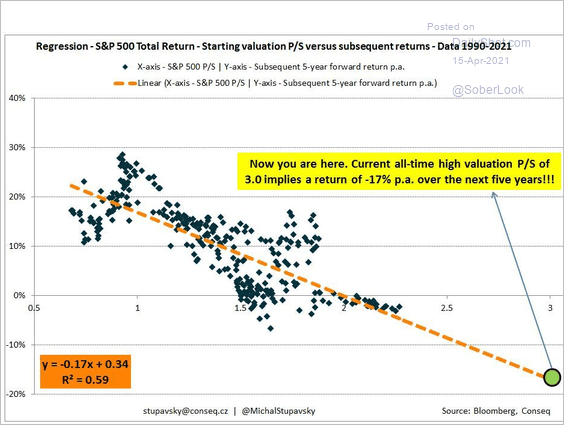
2. What does the S&P 500 price-to-sales ratio tell us about returns over the next five years?
 Source: Michal Stupavsky
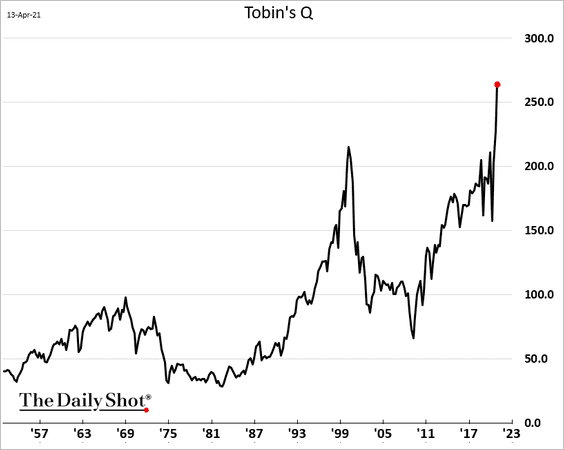
3. Tobin’s Q tells us that it’s much cheaper to build businesses internally than to buy them.
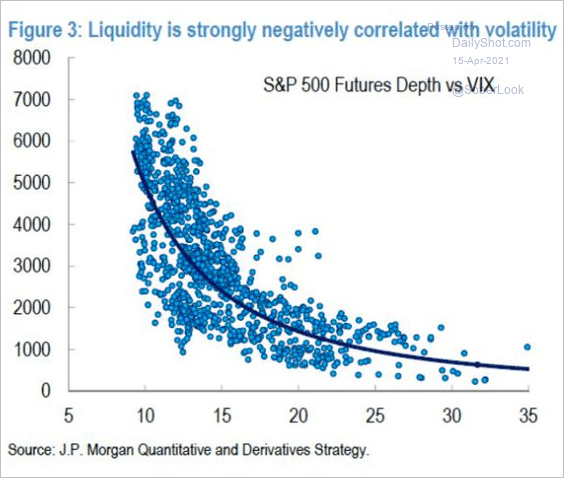
4. Liquidity is negatively correlated with volatility.
 Source: JP Morgan; Ahmad Azeem
5. Fund managers remain extremely overweight equities.
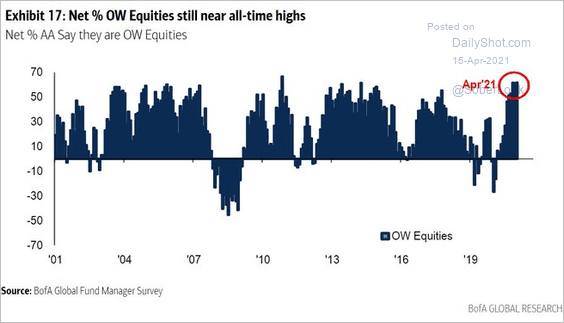 Source: BofA Global Research
6. The healthcare sector is at support relative to the S&P 500.
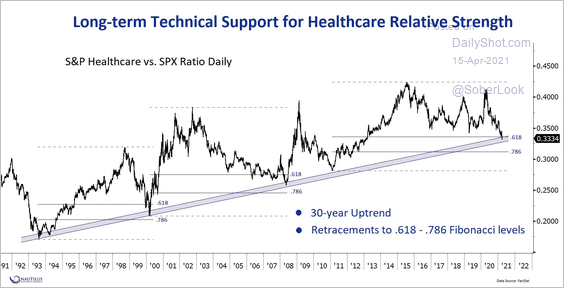 Source: Nautilus Investment Research; Tilo Marotz
Back to Index
Rates
1. Here is a look at 10-year Treasury yield moves across time zones.
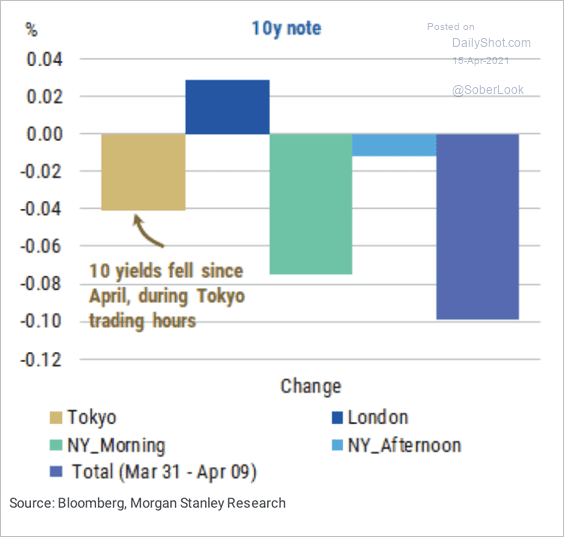 Source: Morgan Stanley Research
2. The breakeven curve remains inverted (the market expects inflation to moderate over the long run).
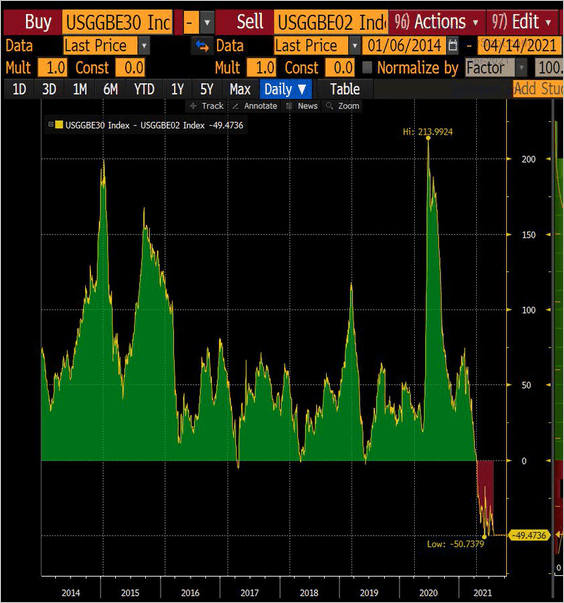 Source: @lisaabramowicz1
3. LIBOR replacement benchmarks in the US and Japan are not getting much traction.
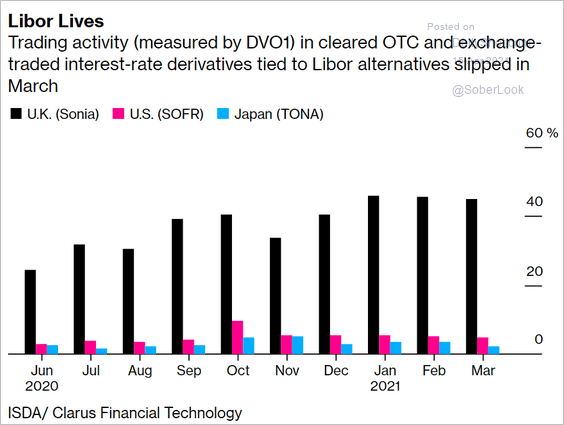 Source: @markets Read full article
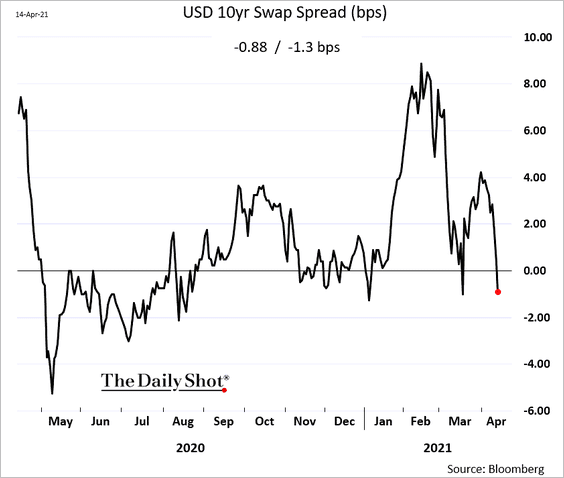
4. The 10yr USD swap spread is negative again (as US mortgage rates move lower).
Back to Index
Global Developments
1. The UK COVID testing data suggest that post-vaccine antibodies may be waning.
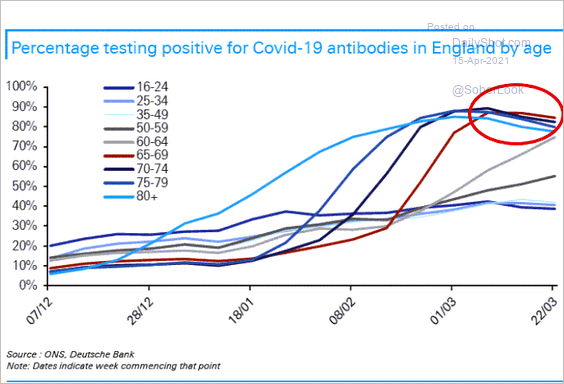 Source: Deutsche Bank Research
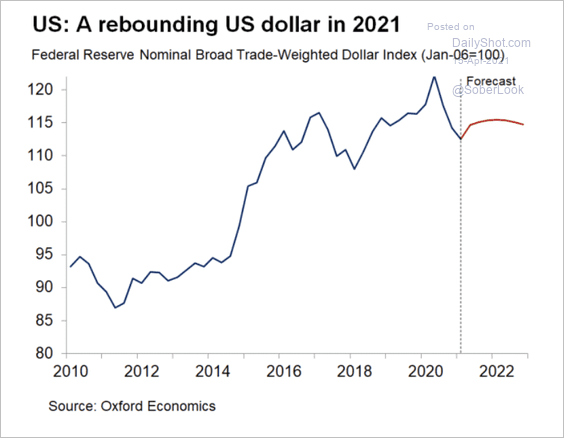
2. Oxford Economics expects a stronger dollar this year, in line with rising yields (2 charts).
 Source: Oxford Economics
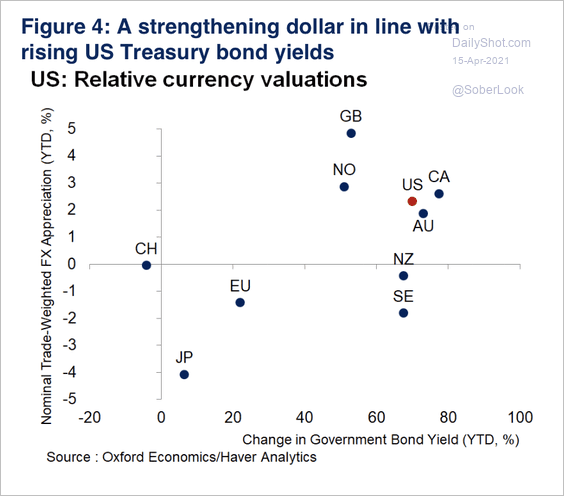 Source: Oxford Economics
However, the rise in US external funding needs could weigh on the dollar.
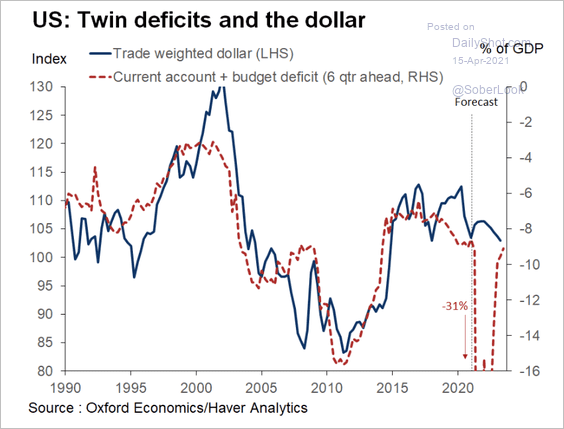 Source: Oxford Economics
——————–
3. The FX market is still dominated by USD.
![]() Source: Morgan Stanley Research
Source: Morgan Stanley Research
4. The dollar’s share of the world’s currency reserves is drifting lower.
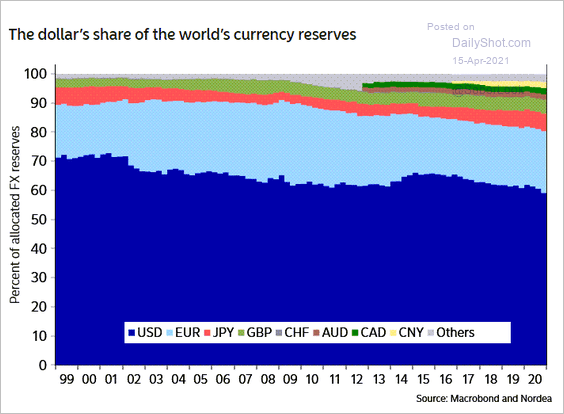 Source: Nordea Markets
5. How will the following assets perform over the next 12 months?
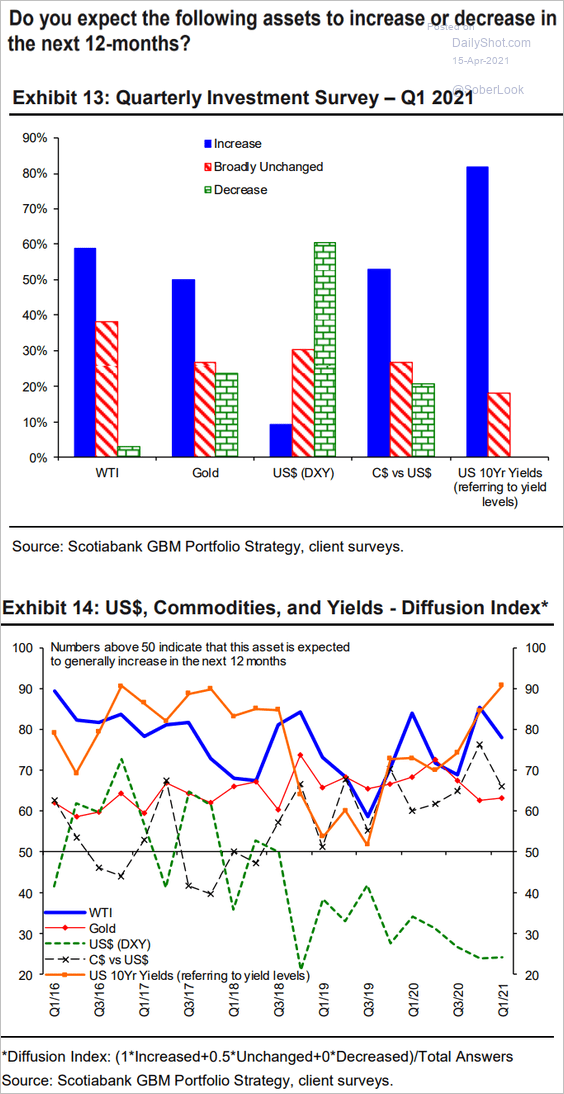 Source: Hugo Ste-Marie, Portfolio & Quantitative Strategy Global Equity Research, Scotia Capital
——————–
Food for Thought
1. US child tax credit proposal:
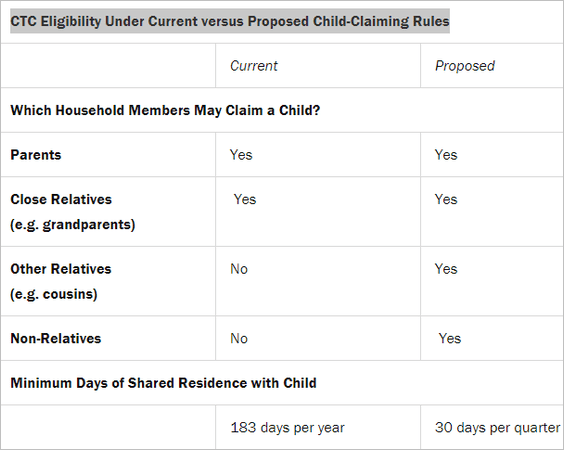 Source: Brookings Read full article
2. Homicides vs. inequality globally:
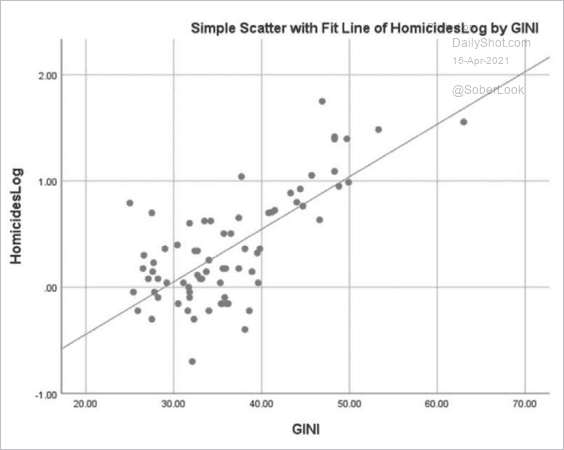 Source: Christopher J. Ferguson and Sven Smith, Stetson University Read full article
3. US climate-related costs:
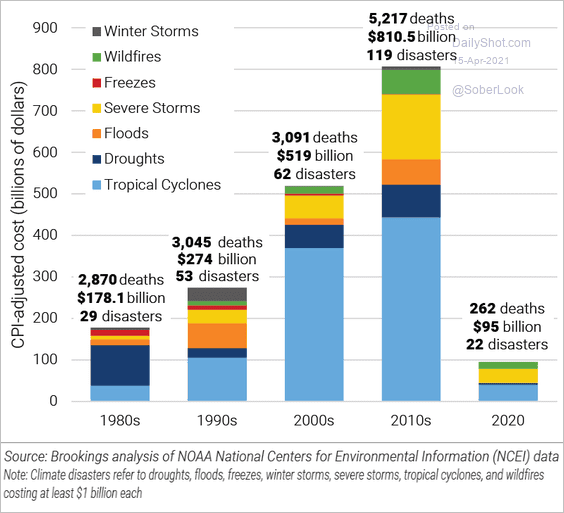 Source: Brookings Read full article
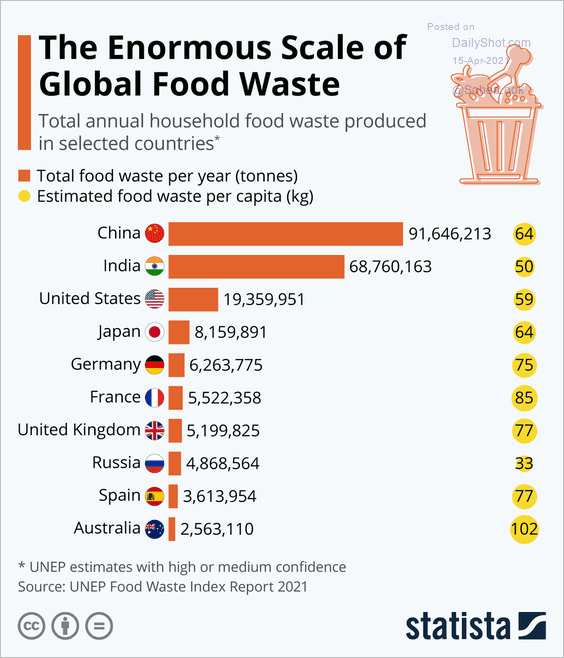
4. Food waste (2 charts):
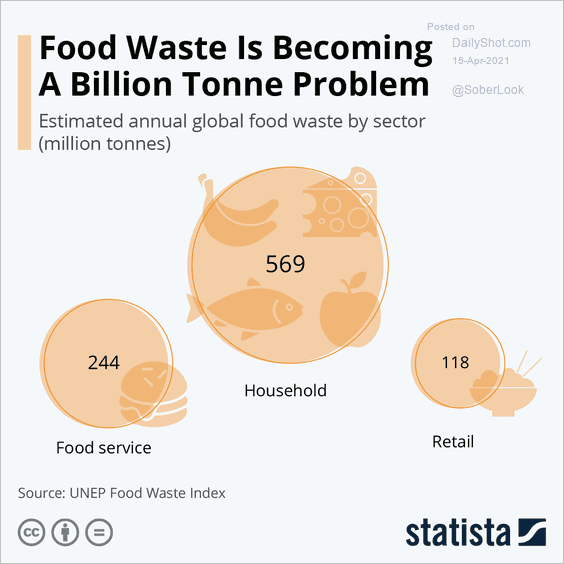 Source: Statista
 Source: Statista
——————–
5. US IT spending:
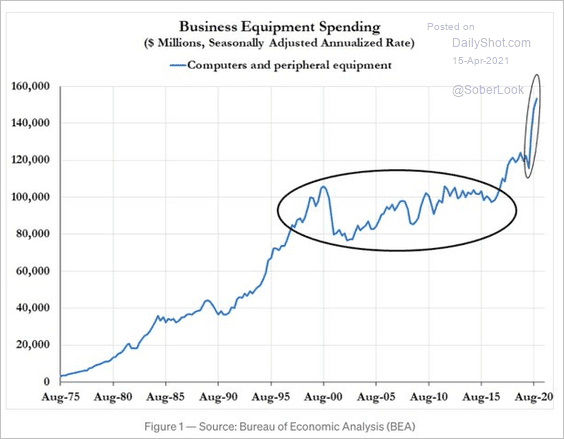 Source: @adam_tooze Read full article
6. Technology’s impact on business:
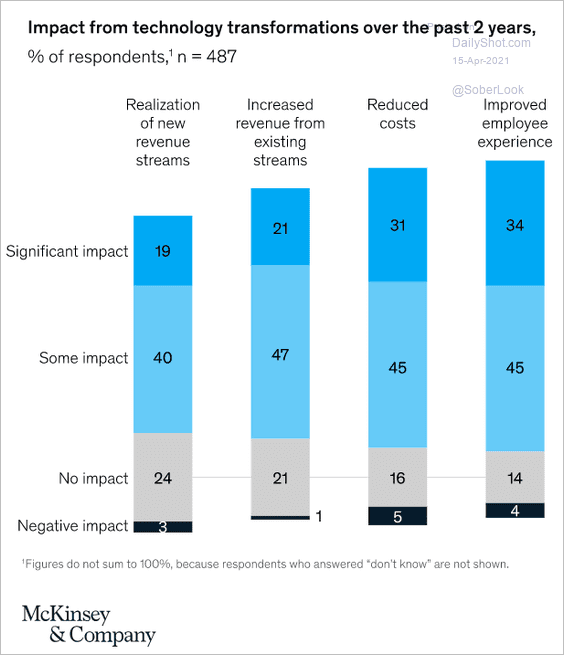 Source: McKinsey Insights Read full article
7. COVID in perspective:
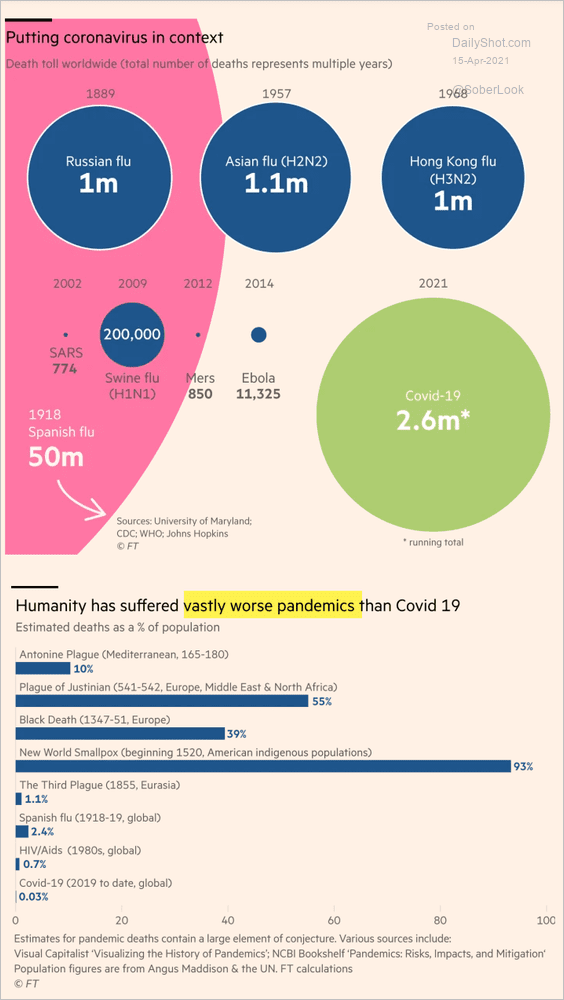 Source: @financialtimes Read full article
8. Manhattan rentals days on the market:
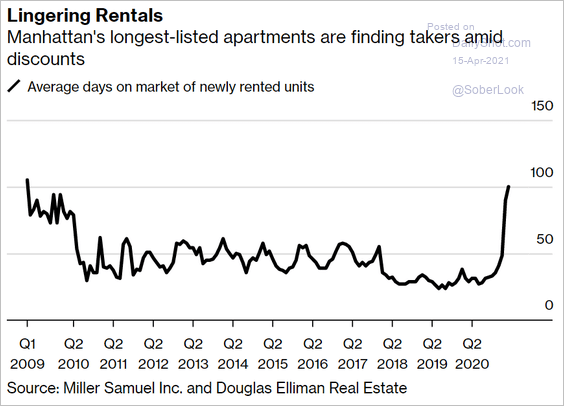 Source: Bloomberg Read full article
9. Most oddly named towns:
 Source: Estately
——————–
Back to Index