
The Daily Shot: 16-Apr-21
• Rates
• Commodities
• Equities
• Credit
• Emerging Markets
• China
• Japan
• Europe
• The United States
• Food for Thought
Rates
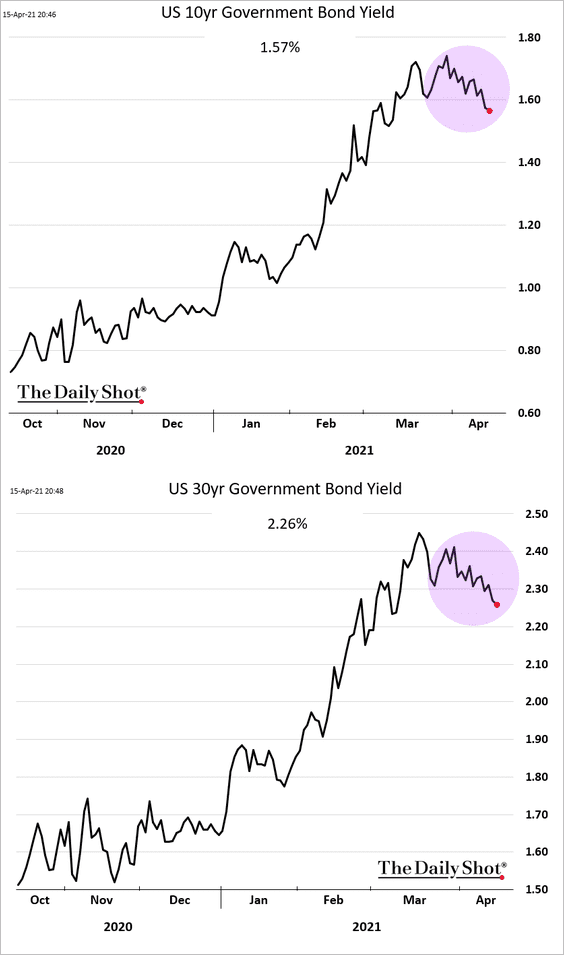
1. The unexpected Treasury rally this week set the tone for global markets.
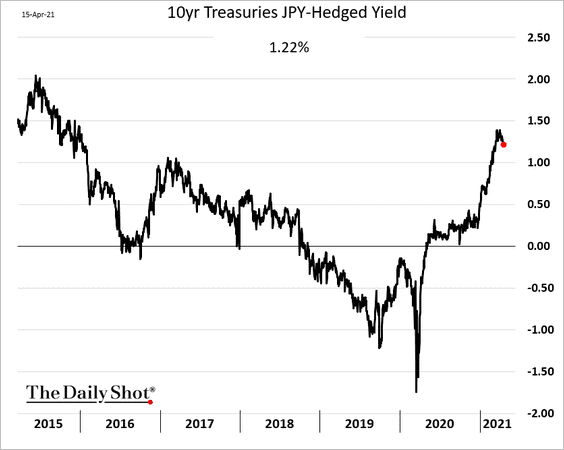
Japanese and other international fixed-income investors, who were net sellers earlier this year, are back in the Treasury market. US debt hedged into yen remains relatively attractive.
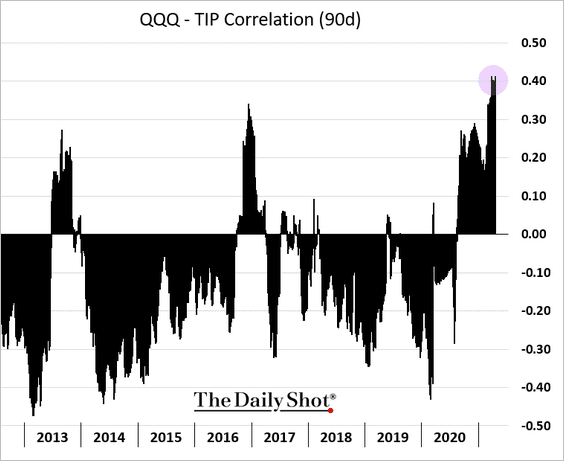
Declining US real yields (TIPS) also have a significant impact on risk assets, …
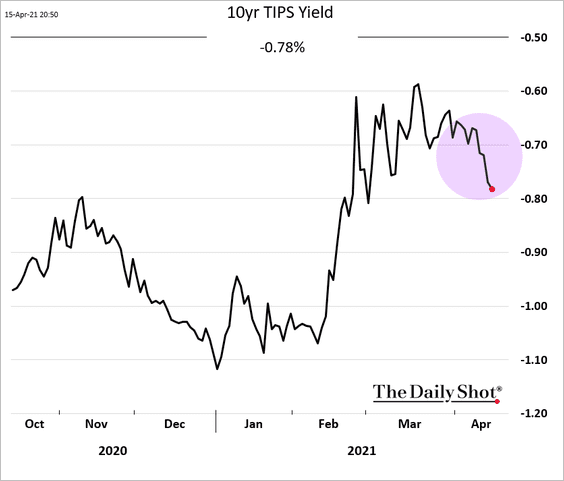
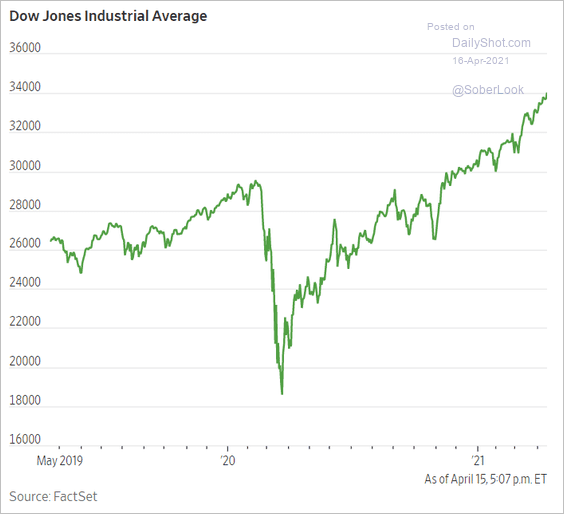
… sending US equity indices to record highs.
 Source: @WSJ Read full article
Here is the correlation between the Nasdaq 100 and TIPS prices.
——————–
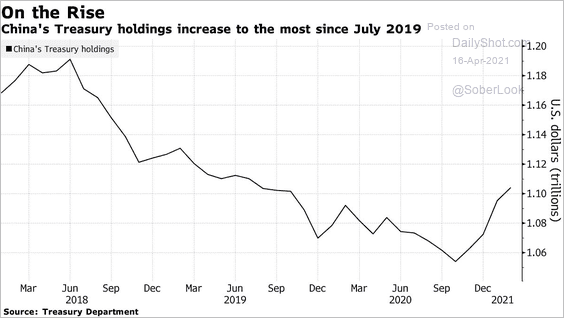
2. China’s holdings of Treasury securities continue to rebound (driven in part by strong US imports).
 Source: Bloomberg Read full article
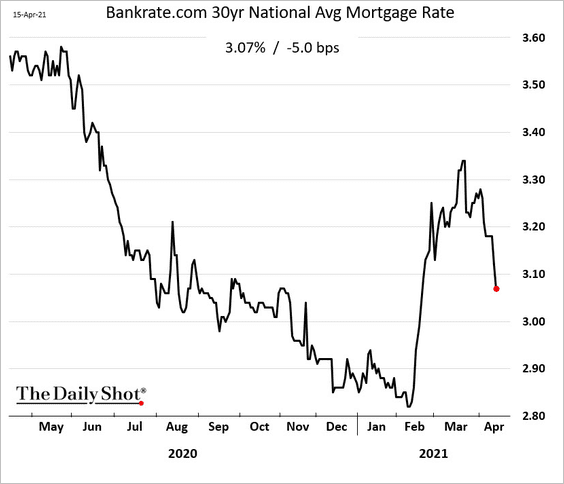
3. US mortgage rates declined sharply this week (with Treasury yields).
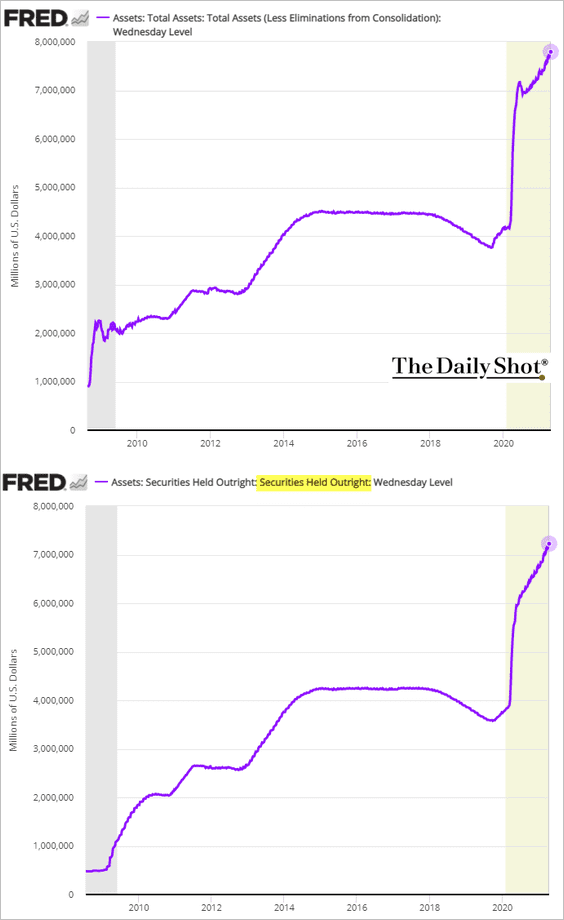
4. The Fed’s balance sheet is approaching $8 trillion. The central bank now owns over $7 trillion of Treasury and Agency MBS debt (2nd chart).
5. The 10-year Treasury note futures contract has been deeply oversold.
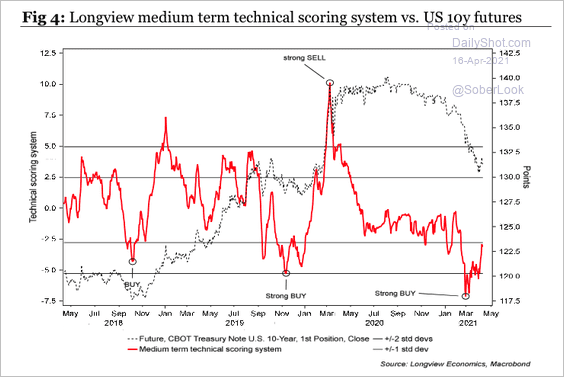 Source: Longview Economics
Traders have been buying up Treasury futures and shorting cash bonds. They prefer using the 10yr “ultra-long” CBOT futures because they pose less cheapest-to-deliver risk. Here are the net positions of leveraged funds.
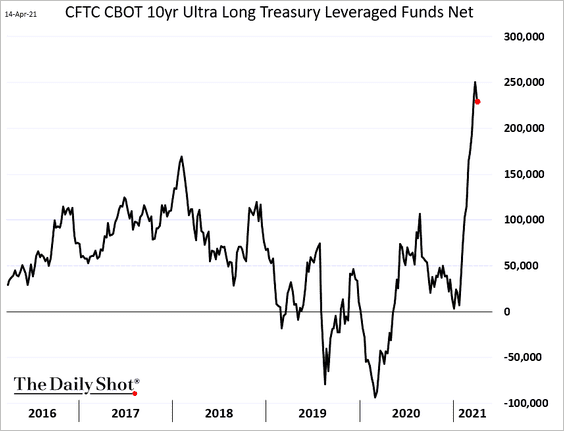 h/t @StephenSpratt
The Treasury rally this week caused an unwind in some of these futures-cash spread trades.
Back to Index
Commodities
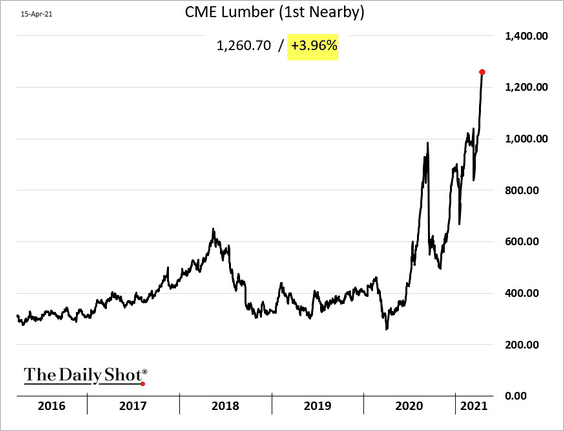
1. Lower US mortgage rates (above) sent lumber futures to new highs.
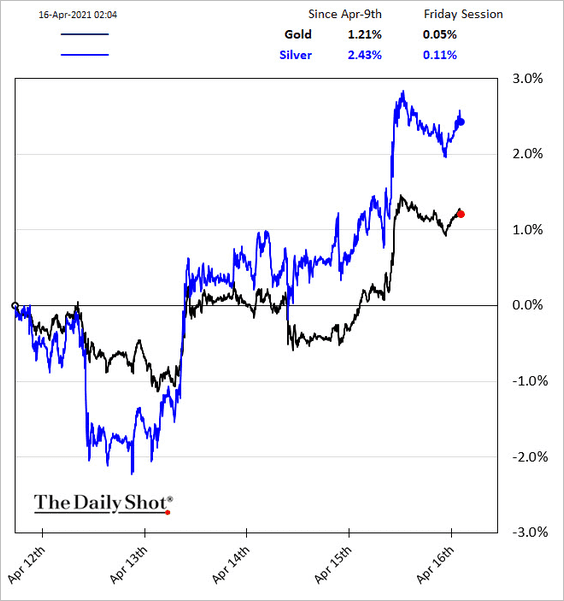
2. Precious metals are also benefitting from falling Treasury yields.
Back to Index
Equities
1. Despite strong Q1 results (due to trading) …
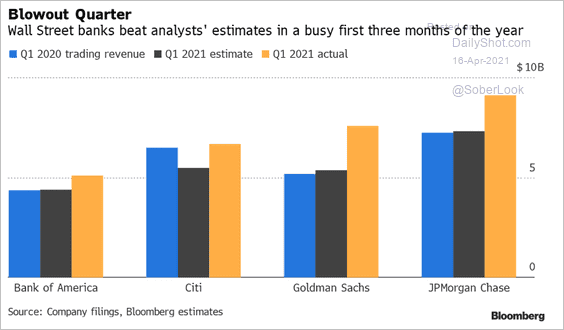 Source: @Tobin_Tweets
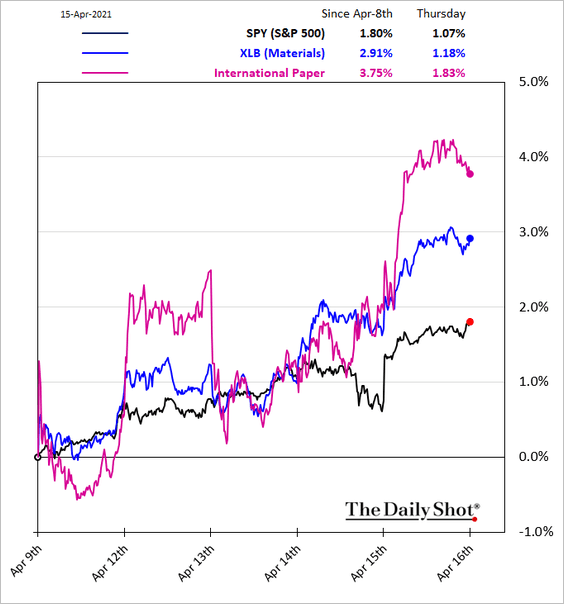
… bank shares underperformed as yields declined (see the rates section).
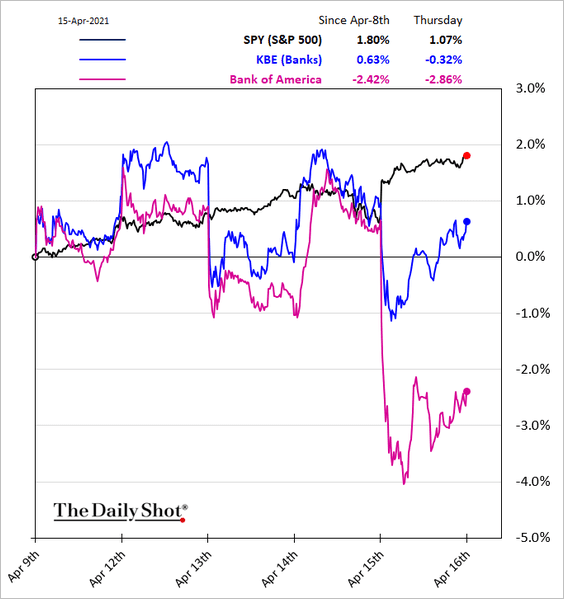
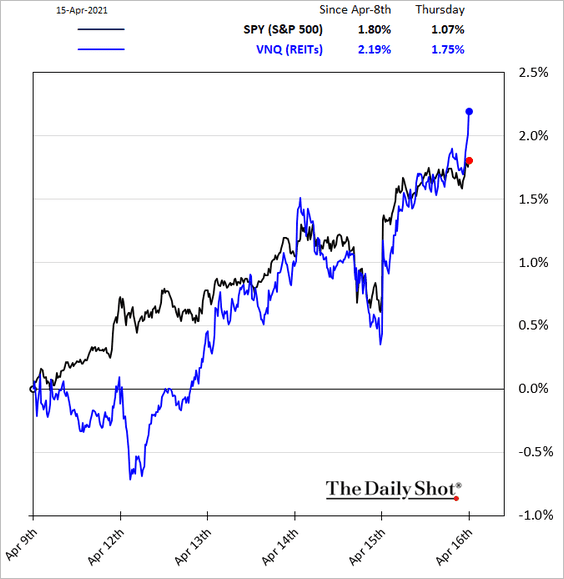
On the other hand, utilities and property operators (REITs) benefitted from lower rates.
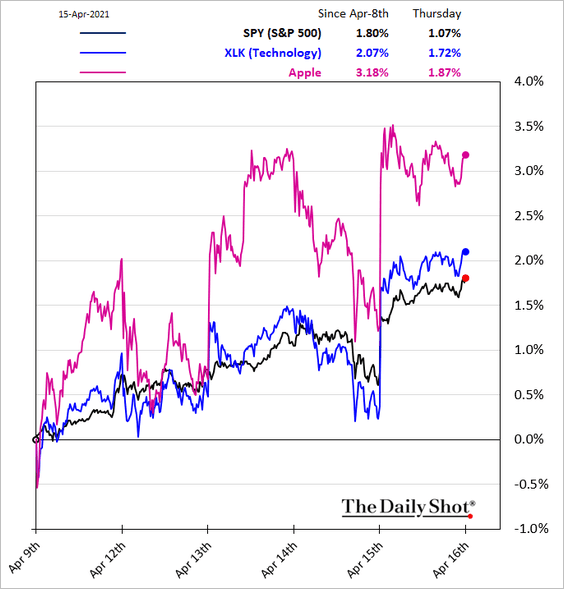
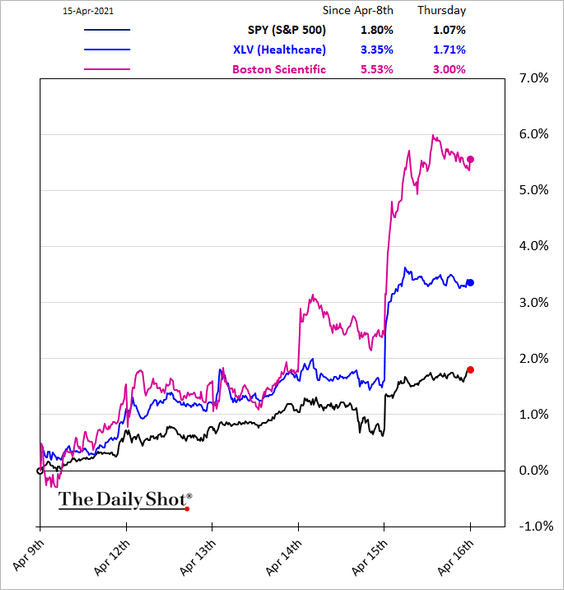
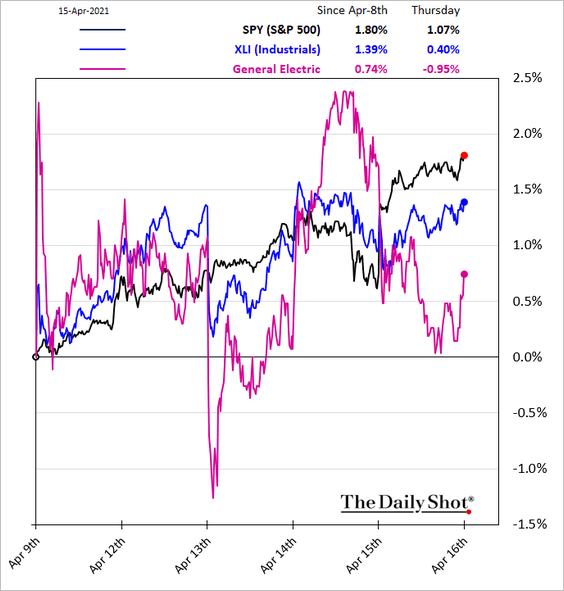
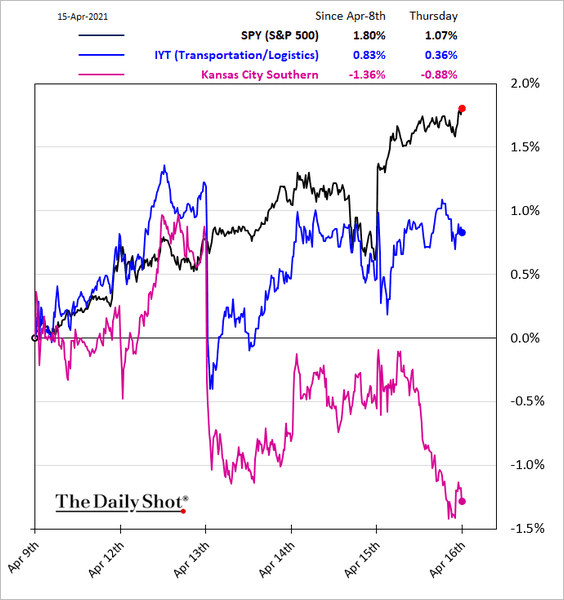
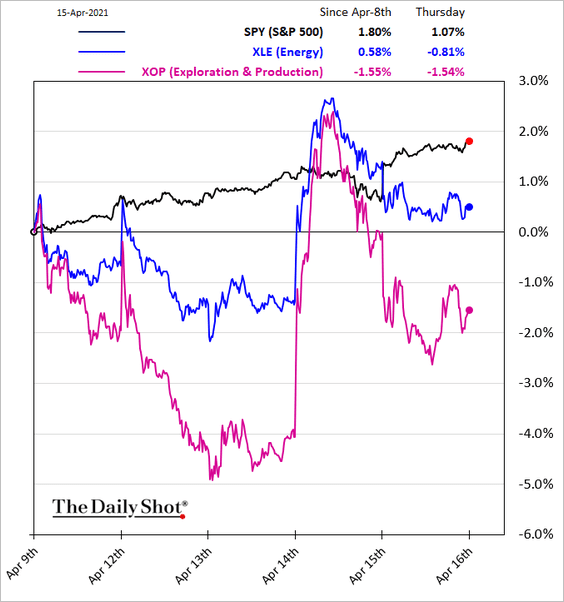
2. Here are a few other sector trends.
• Tech:
• Healthcare:
• Industrials:
• Transportation:
• Energy:
• Materials:
• This chart shows global fund managers’ sector positioning (based on a BofA survey).
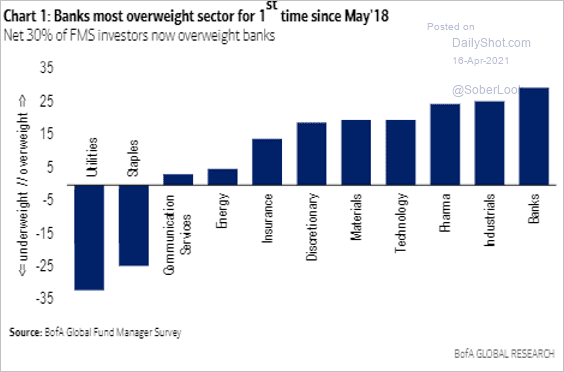 Source: BofA Global Research; @lisaabramowicz1
• Which sectors are vulnerable to an increase in the corporate tax rate?
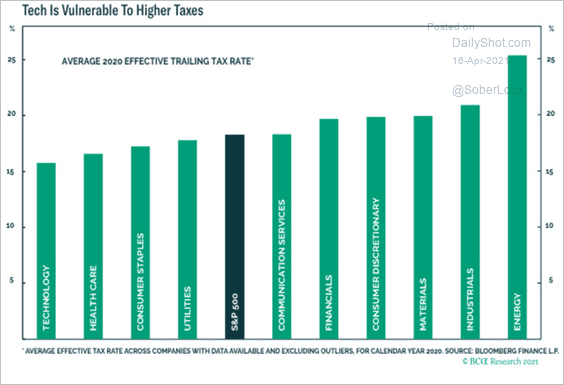 Source: BCA Research
• Which sectors should outperform in the next 12 months?
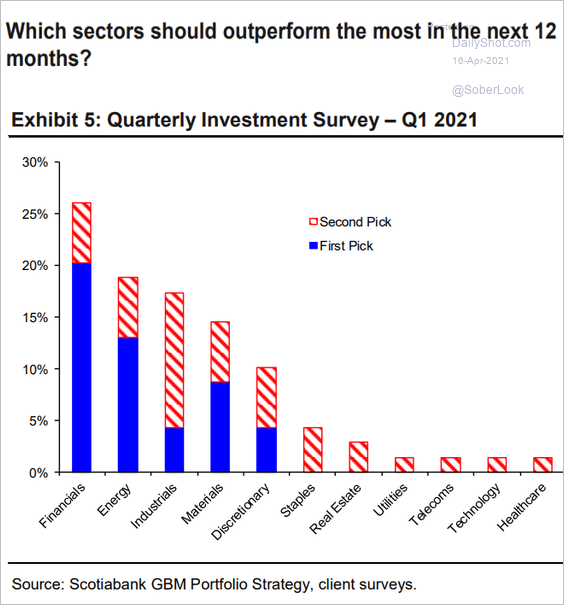 Source: Hugo Ste-Marie, Portfolio & Quantitative Strategy Global Equity Research, Scotia Capital
——————–
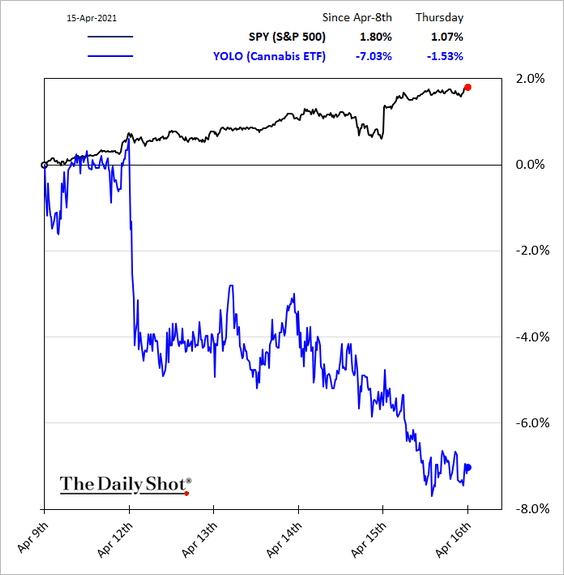
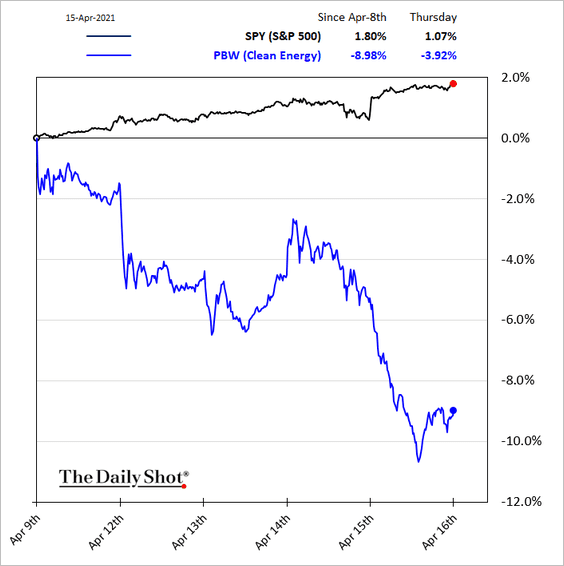
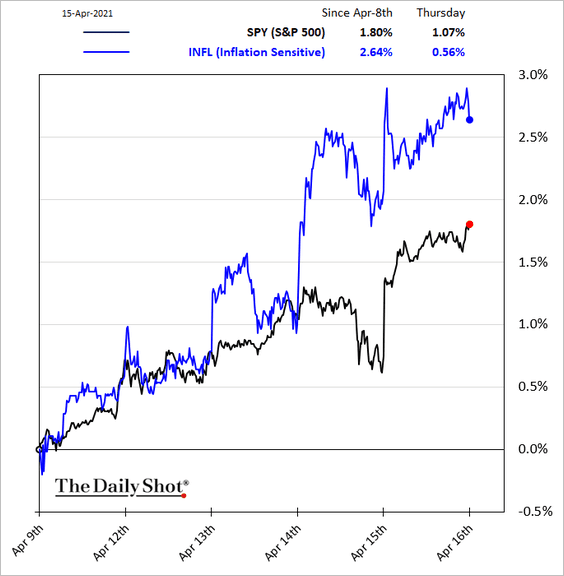
3. Next, we have the relative performance of some thematic portfolios.
• Cannabis:
• Clean energy:
• Inflation-sensitive shares:
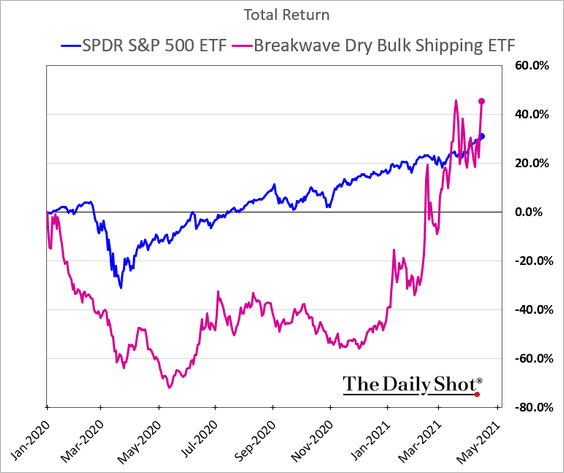
• Shipping stocks experienced a massive rally this year.
——————–
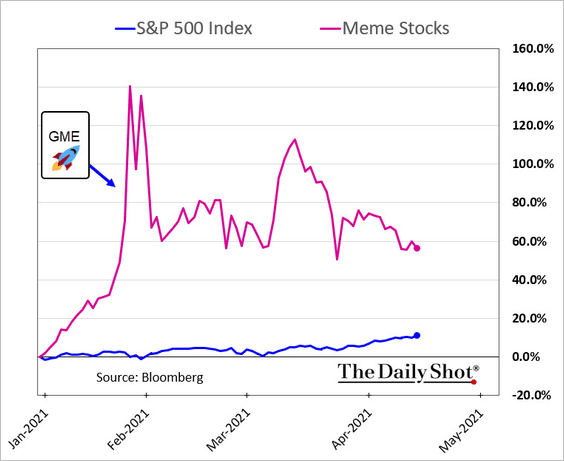
4. Stocks preferred by retail investors have been lagging in recent weeks.
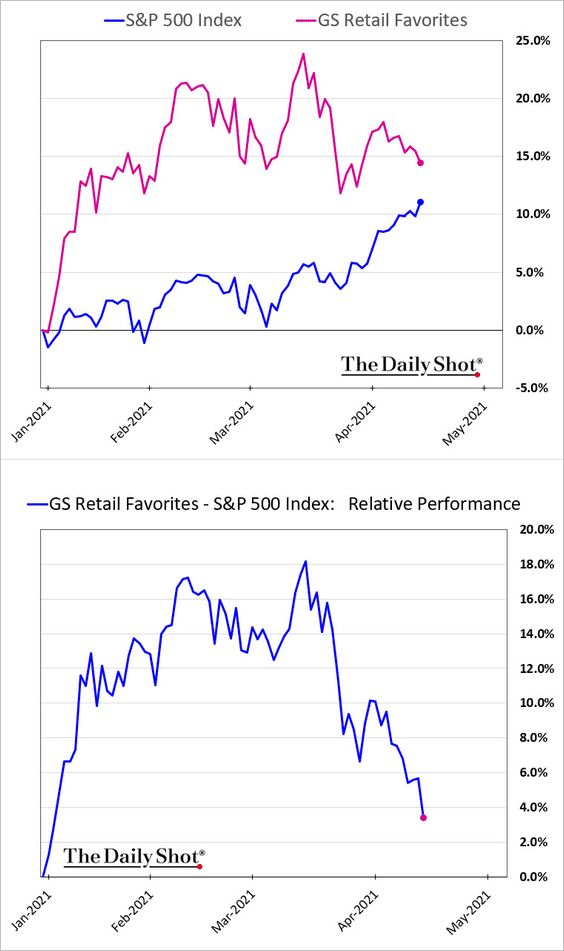
Even Reddit-hyped stocks have been trading sideways.
But according to JP Morgan, retail investors are back in the options market.
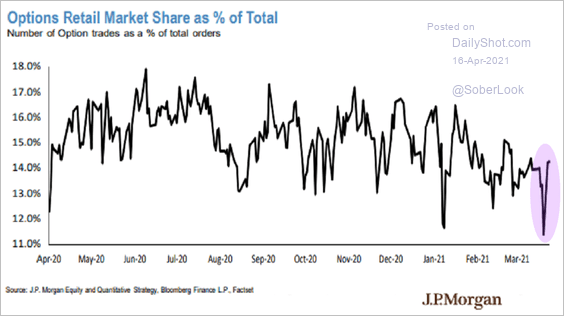 Source: JP Morgan; Bloomberg Read full article
——————–
5. The following chart shows the ratio of the S&P 500 forward P/E and VIX – a useful measure of market sentiment.
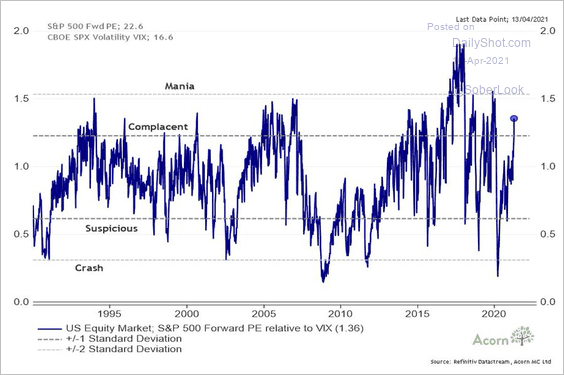 Source: @RichardDias_CFA
Bullish sentiment is at an extreme, according to an investor survey by Scotiabank.
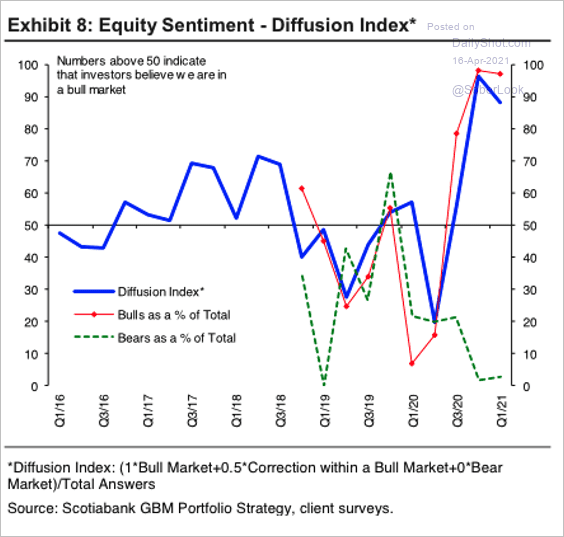 Source: Hugo Ste-Marie, Portfolio & Quantitative Strategy Global Equity Research, Scotia Capital
——————–
6. The S&P 500 normalized P/E ratio keeps climbing.
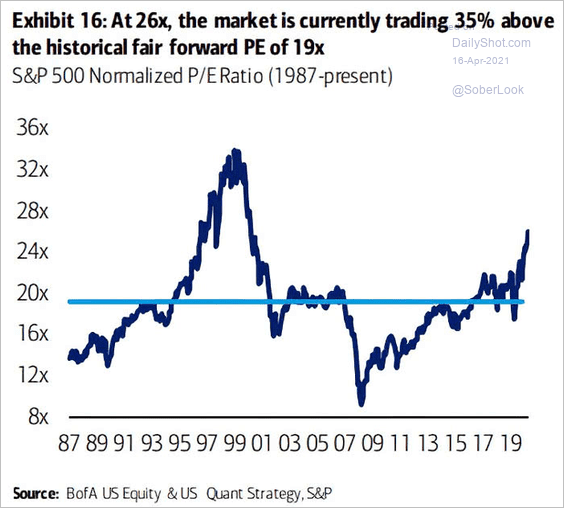 Source: @ISABELNET_SA, @BofAML
7. The weighting of highly leveraged companies in the Russell 2000 index is at record highs.
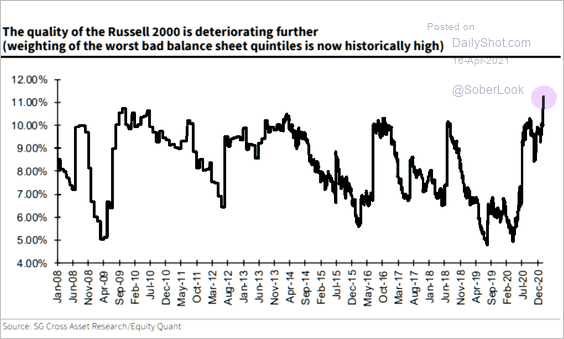 Source: Societe Generale’s Cross Asset Research; @themarketear
8. The average first-day return for IPOs is not yet as high as the dot-com peak.
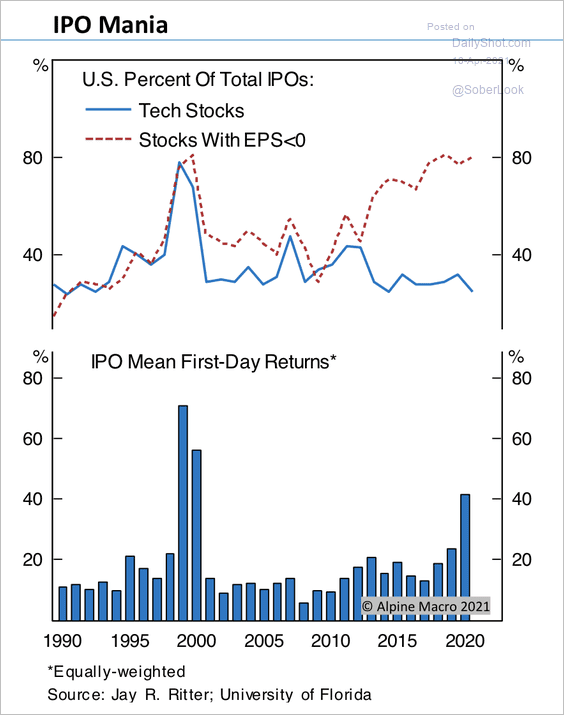 Source: Alpine Macro
Back to Index
Credit
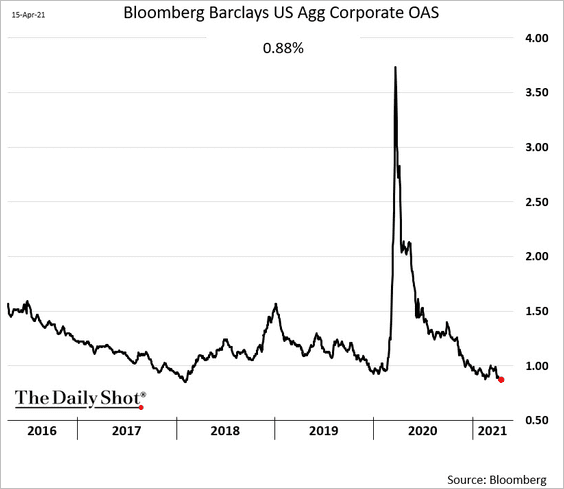
1. Investment-grade corporate spreads are at multi-year lows.
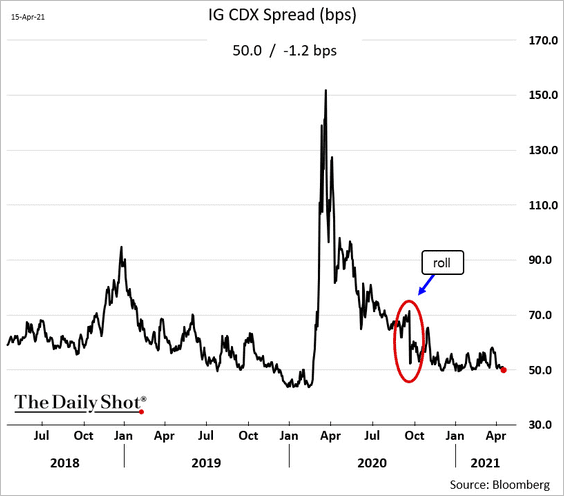
The on-the-run IG CDX spread is now at 50bps (“index” of credit default swaps).
——————–
2. Leveraged loan issuance has been strong this year.
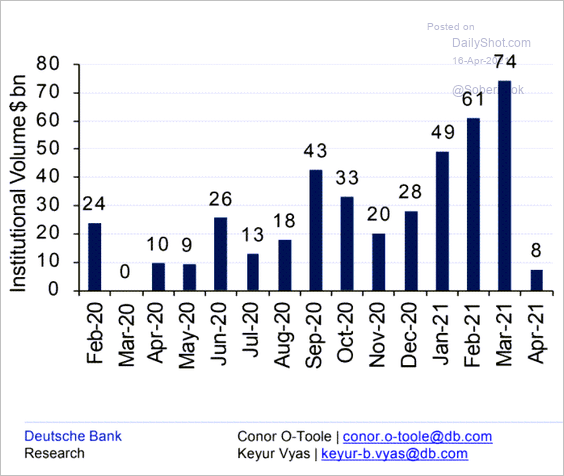 Source: Deutsche Bank Research
There is plenty of demand from CLOs.
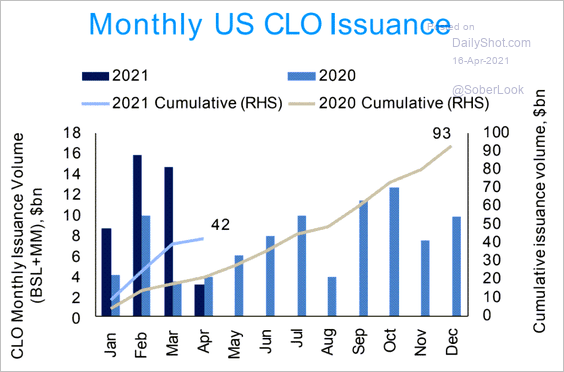 Source: Deutsche Bank Research
Back to Index
Emerging Markets
1. EM bonds got a lift from lower Treasury yields.
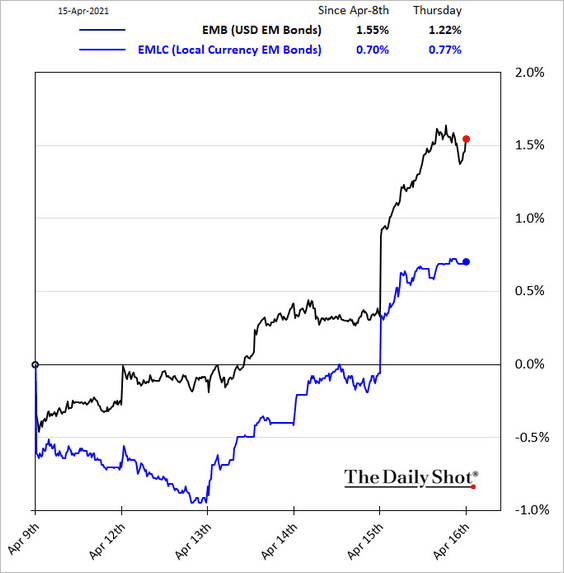
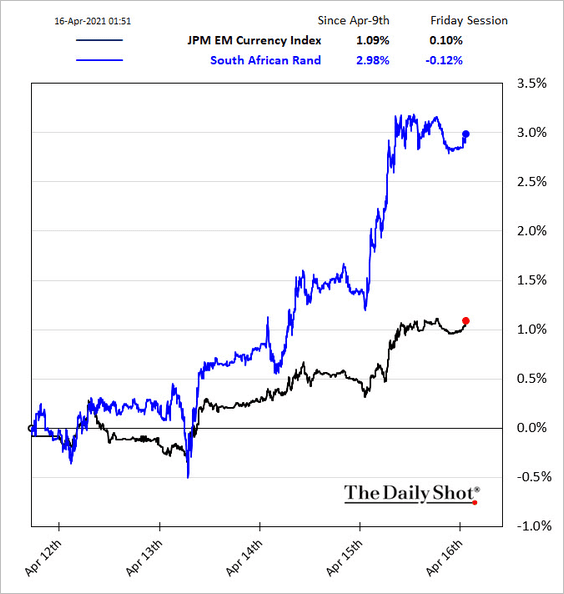
And so did EM currencies.
——————–
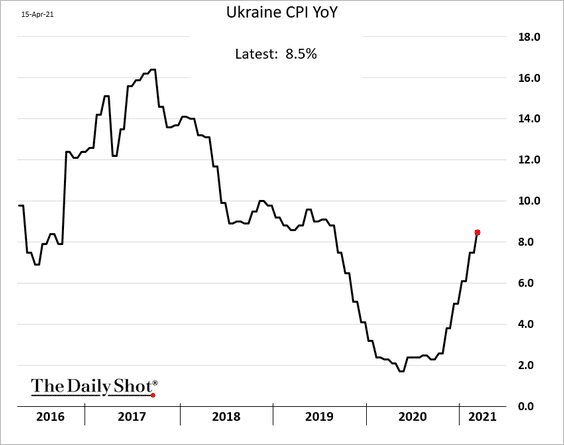
2. Ukraine hiked rates by 100bps (the market expected 50bps) amid concerns about capital outflows due to the Russian threat.
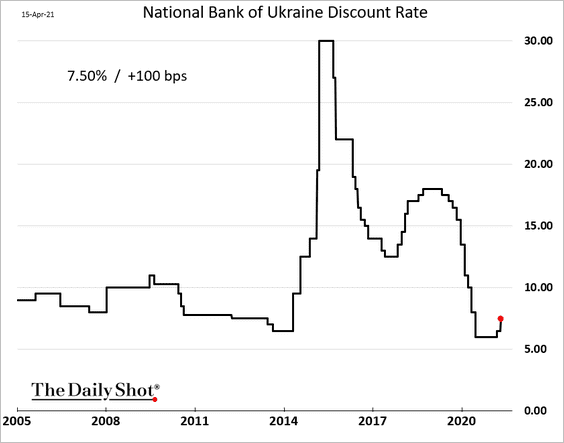
Inflation has been rising quickly.
——————–
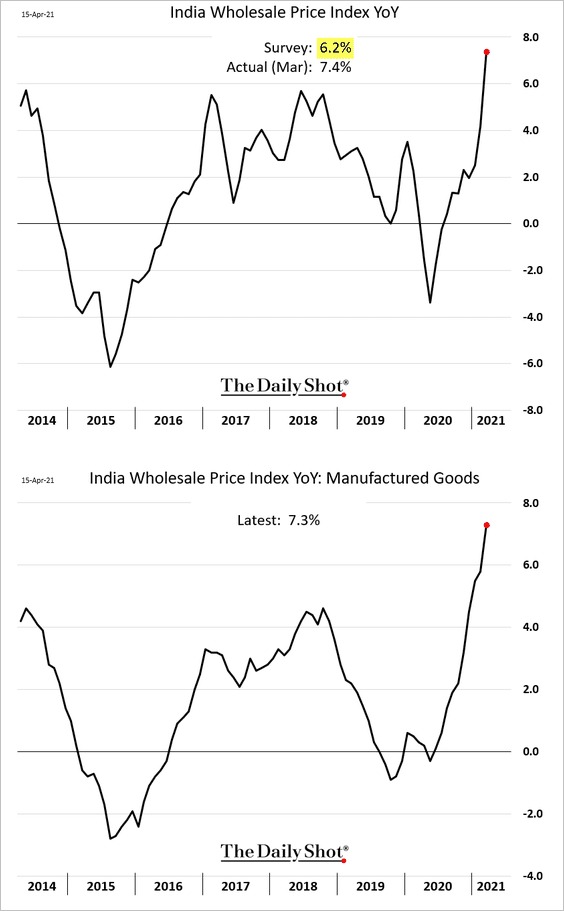
3. India’s wholesale prices rose more than expected.
4. The Chilean peso rally has stalled as USD/CLP hit support at 700.
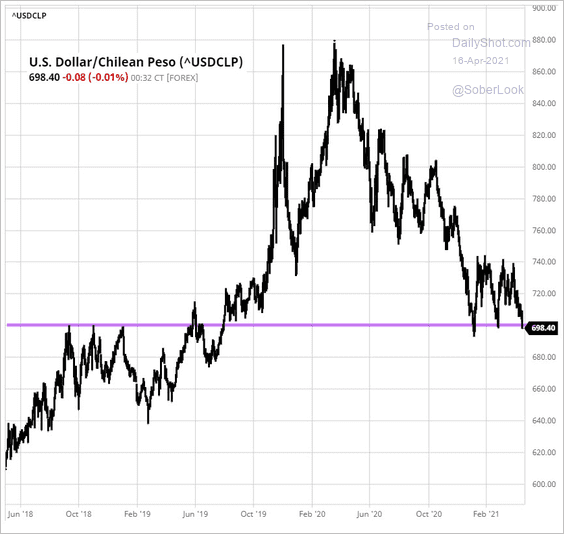 Source: barchart.com
Chile’s central bank will begin hiking rates next year.
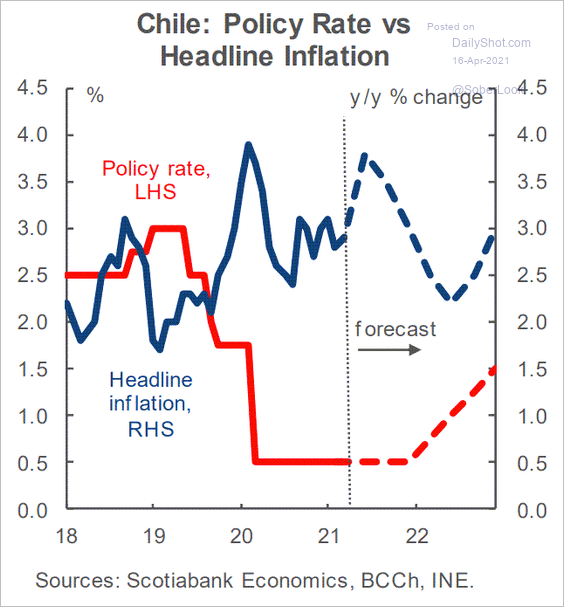 Source: Scotiabank Economics
Back to Index
China
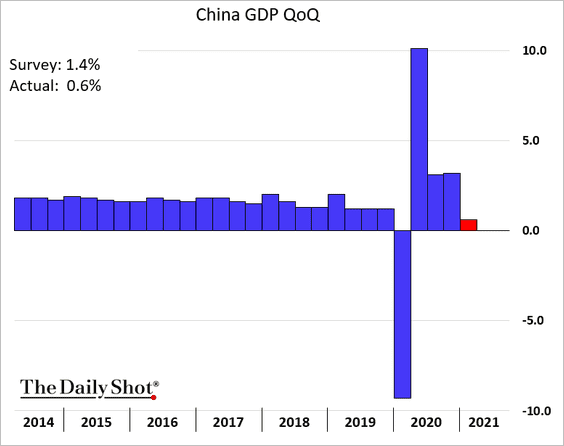
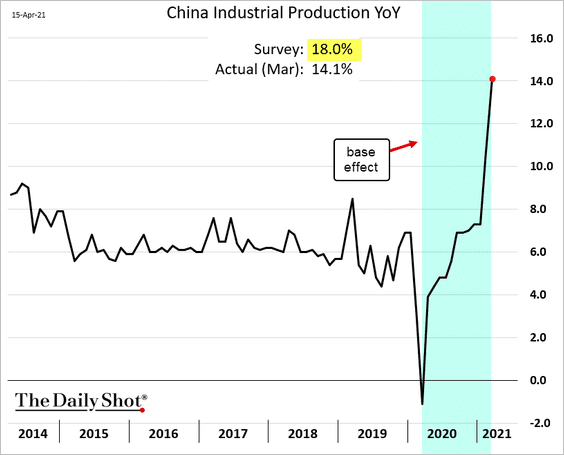
1. The Q1 GDP report was a bit disappointing.
2. The March industrial production figure was weaker than expected (the big spike is due to base effects).
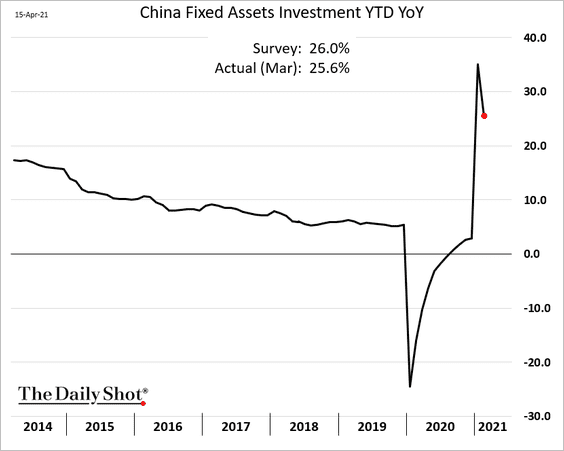
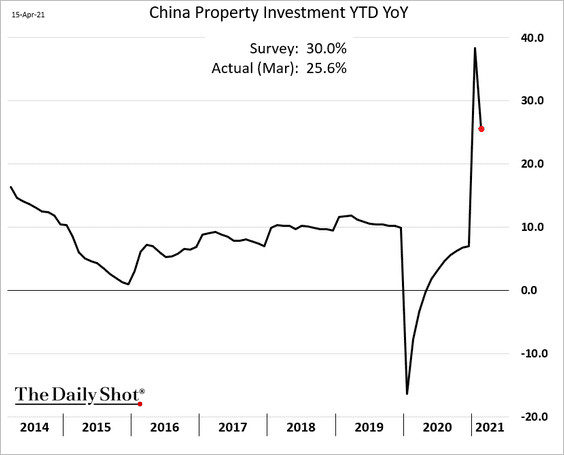
Fixed-asset investment was roughly in line with expectations.
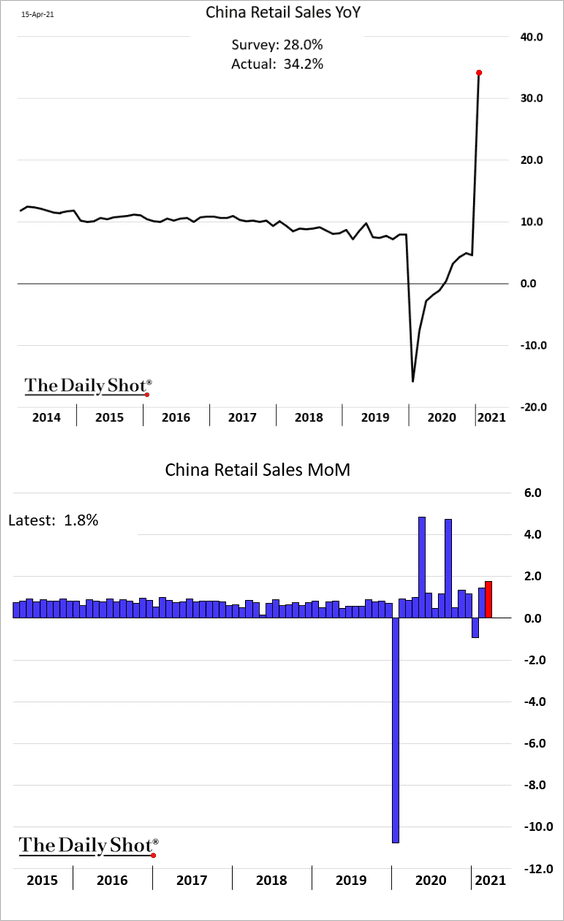
Retail sales topped forecasts.
——————–
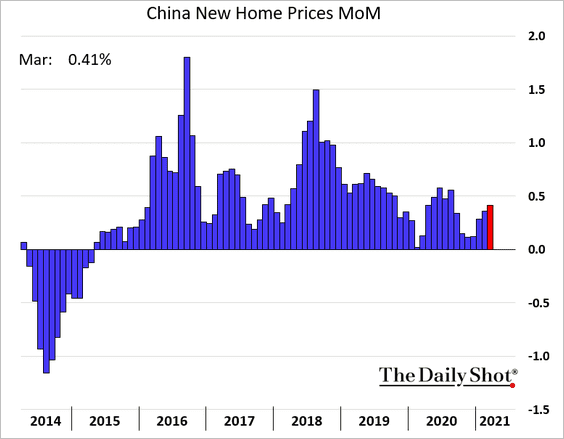
3. Home price appreciation remains robust.
4. The Huarong situation is spooking bond investors.
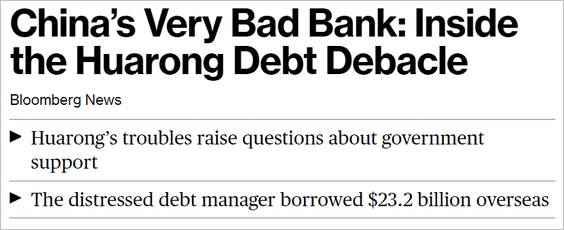 Source: Bloomberg Read full article
 Source: @WSJ Read full article
Here is the credit default swap spread.
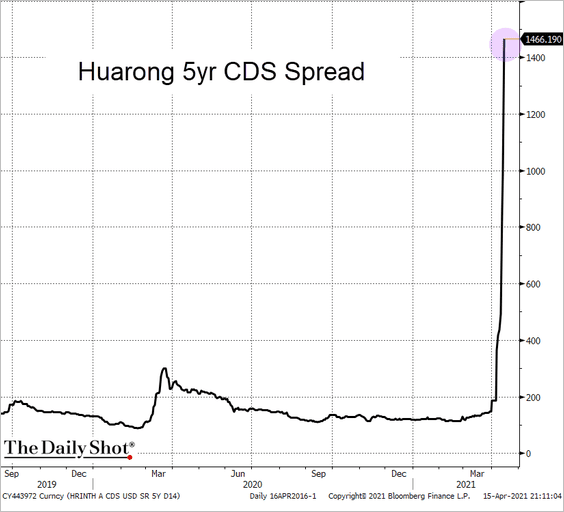 Source: @TheTerminal, Bloomberg Finance L.P.
Investment-grade bond yields are climbing.
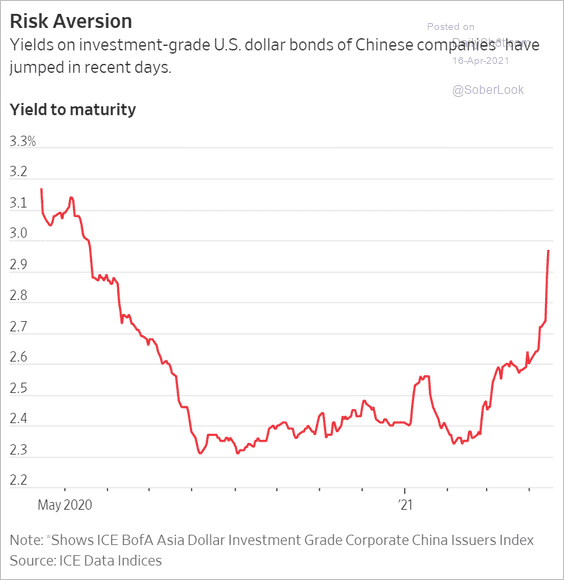 Source: @WSJ Read full article
——————–
5. China’s credit impulse has declined substantially.
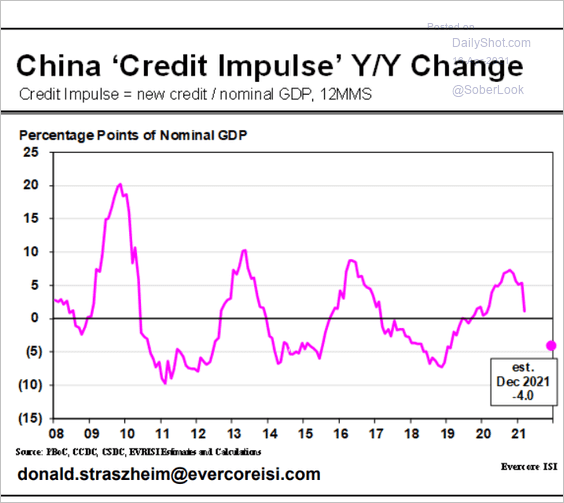 Source: Evercore ISI
Back to Index
Japan
1. Yield differentials suggest a lower USD/JPY.
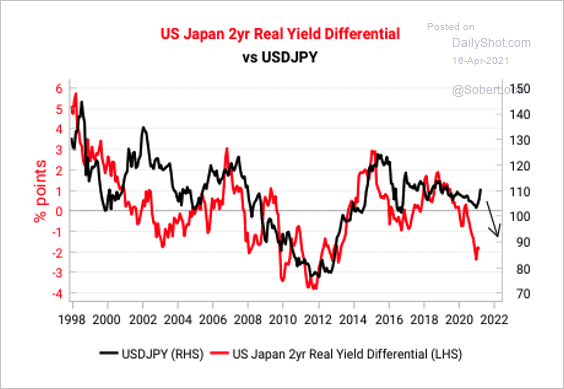 Source: Variant Perception
The rise in Japanese exports could lead to stronger foreign demand for the yen.
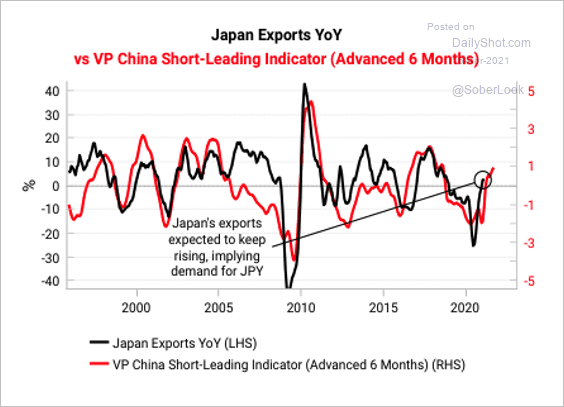 Source: Variant Perception
——————–
2. Growth in Japan’s broad money supply has been approaching 10%.
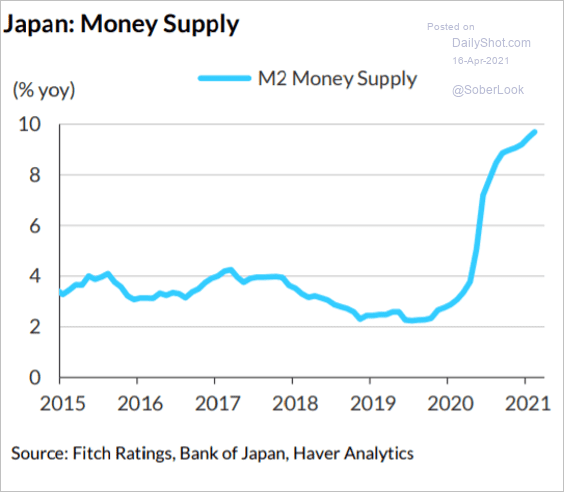 Source: Fitch Ratings
3. This chart shows Americans’ views of Japan over time.
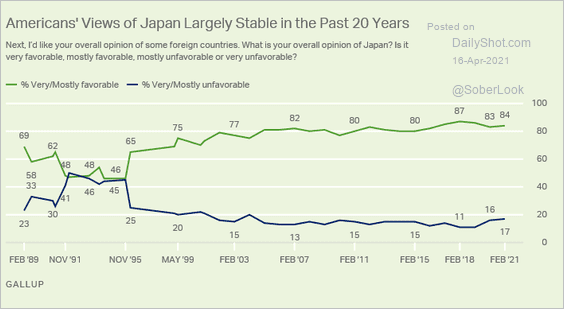 Source: Gallup Read full article
Back to Index
Europe
1. Italian government debt has grown rapidly since the start of the pandemic.
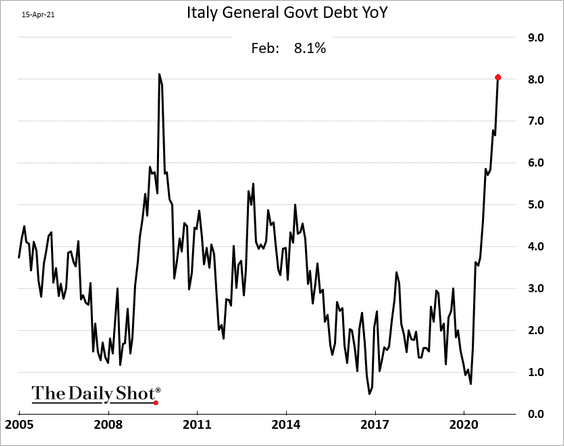
And more increases are coming before we hit a peak.
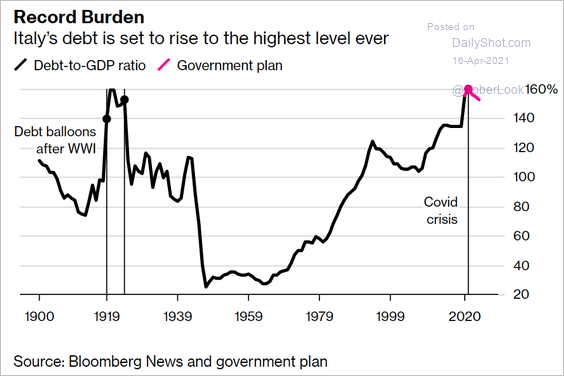 Source: Bloomberg Read full article
——————–
2. Germany’s vaccination program is accelerating.
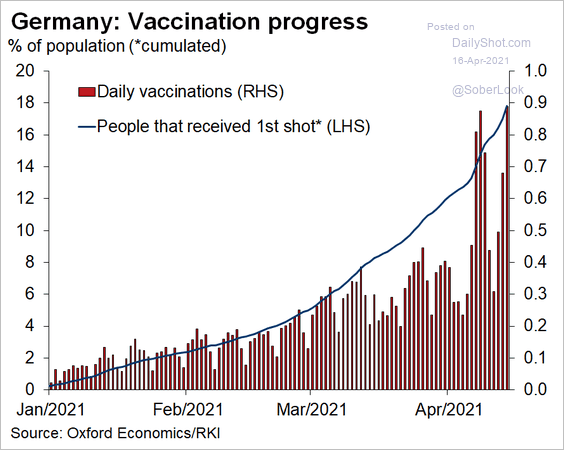 Source: @OliverRakau
3. Coming from a low base, Europe’s economic surprise index is higher than the US, Japan, and China.
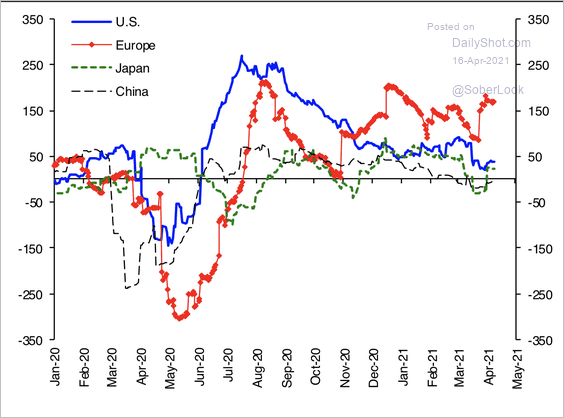 Source: Scotiabank Economics
Back to Index
The United States
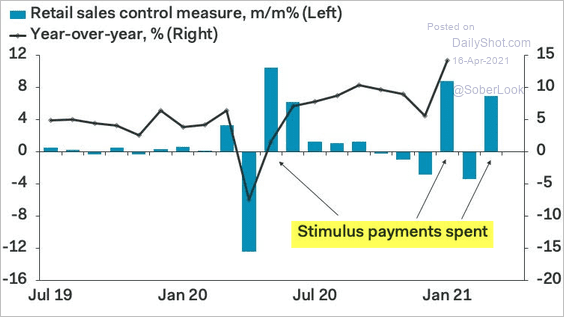
1. The nation’s economic growth is accelerating. Retail sales rose nearly 10% in March.
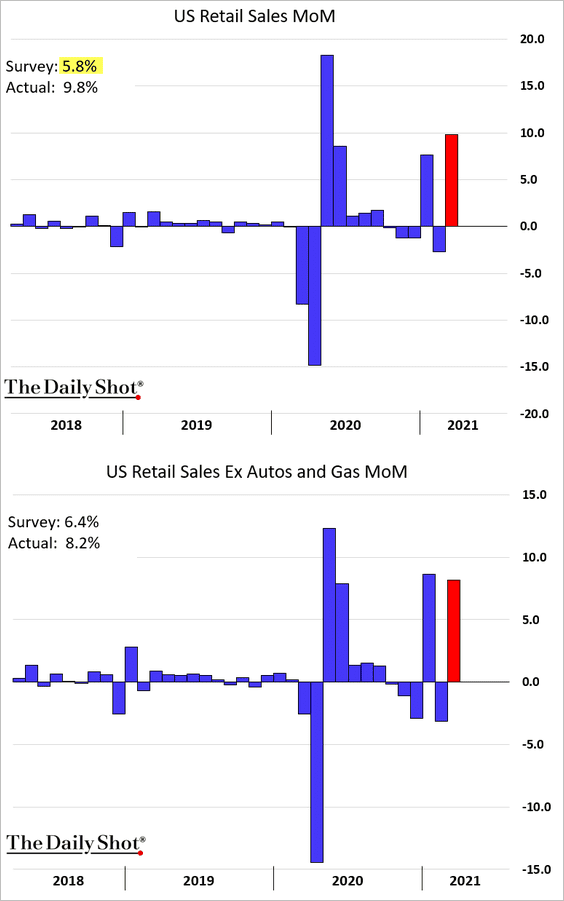
• Americans were spending their stimulus checks.
 Source: Pantheon Macroeconomics
• Building materials were very popular.
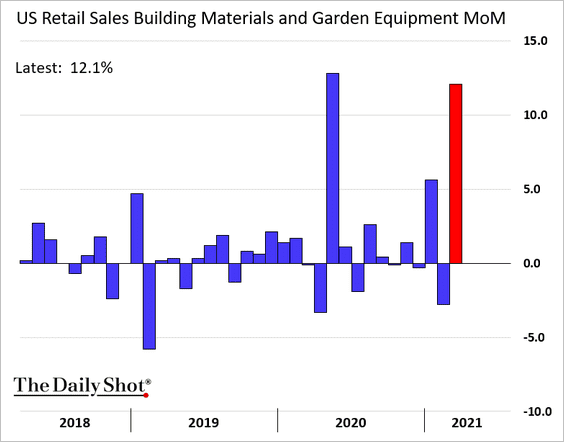
• Here is the breakdown by sector.
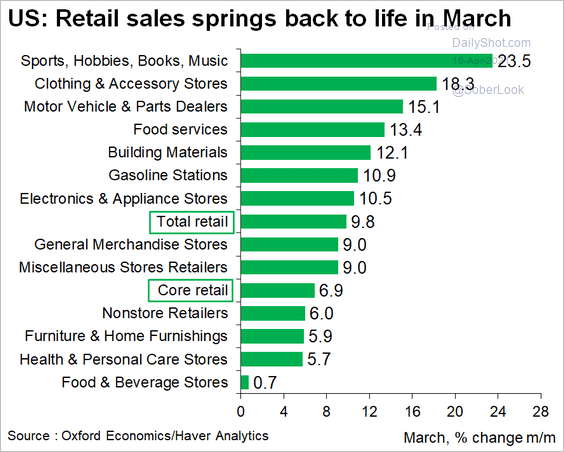 Source: @GregDaco, @OxfordEconomics
• This chart provides a comparison with the post-2008 recovery.
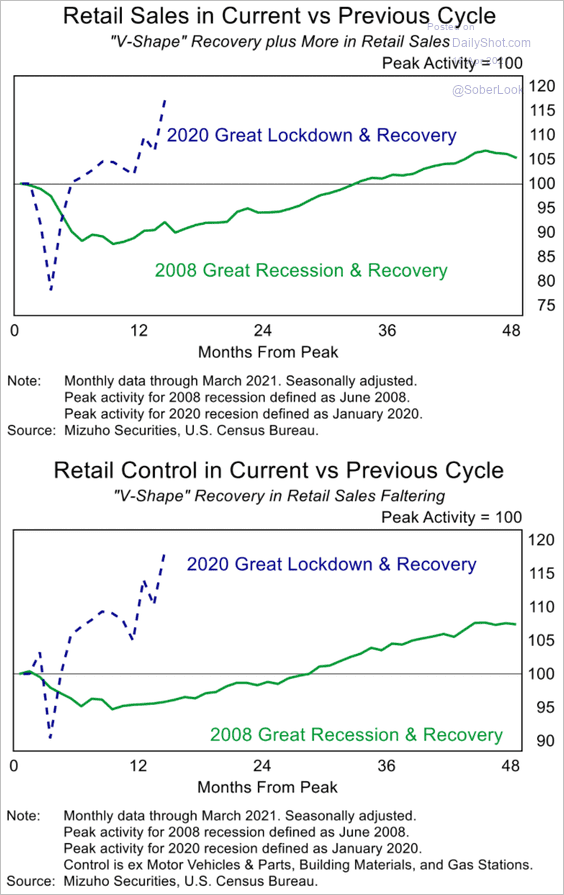 Source: Mizuho Securities USA
• The spike in retail sales means a much stronger overall consumer spending.
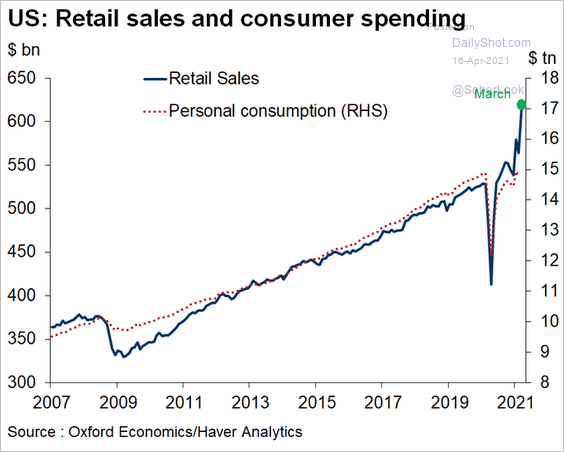 Source: @GregDaco
According to Oxford Economics, we are looking at a 9% (annualized) growth in Q1 – driven by this spike in consumption.
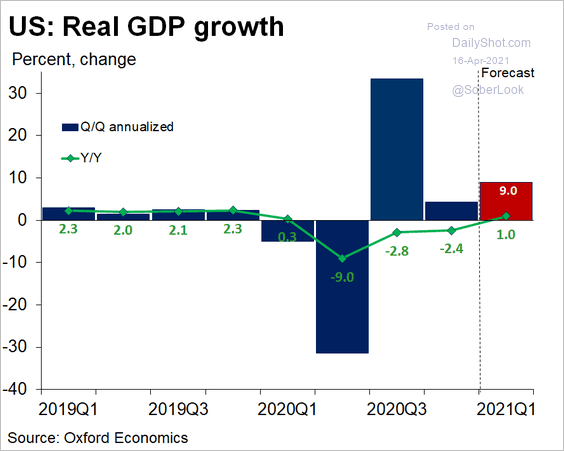 Source: @GregDaco, @OxfordEconomics
——————–
2. The industrial production report was a bit disappointing as the economy came out of the February deep freeze.
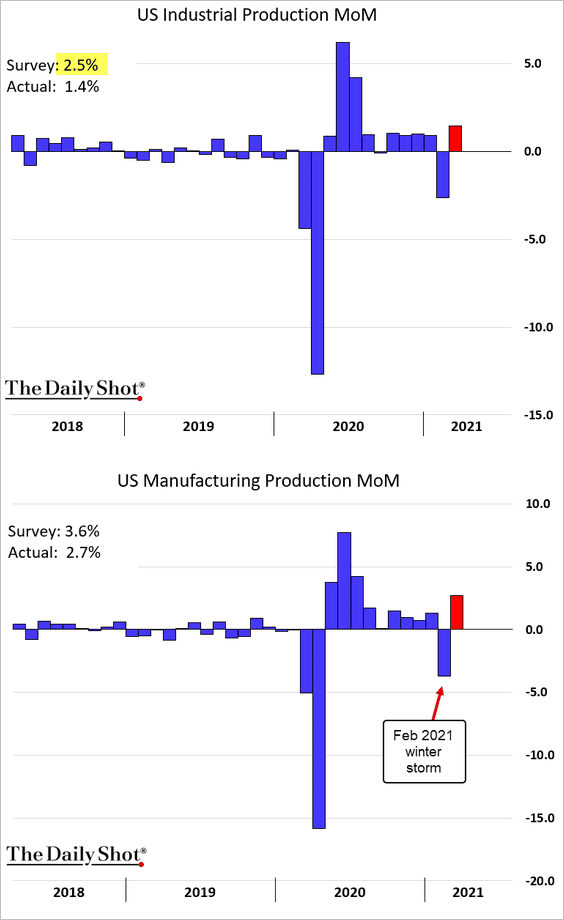
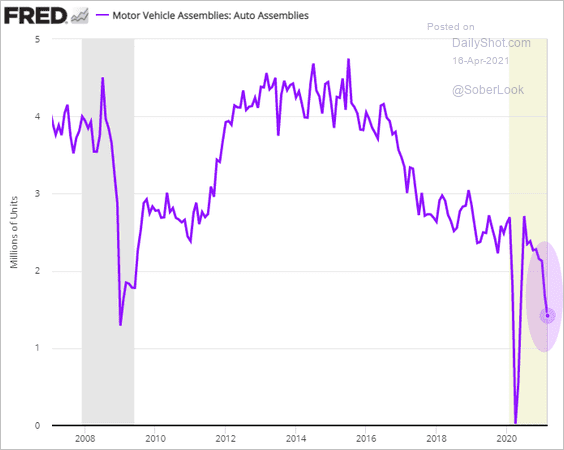
Some of the weakness was due to supply-chain problems. Chip shortages put downward pressure on auto production.
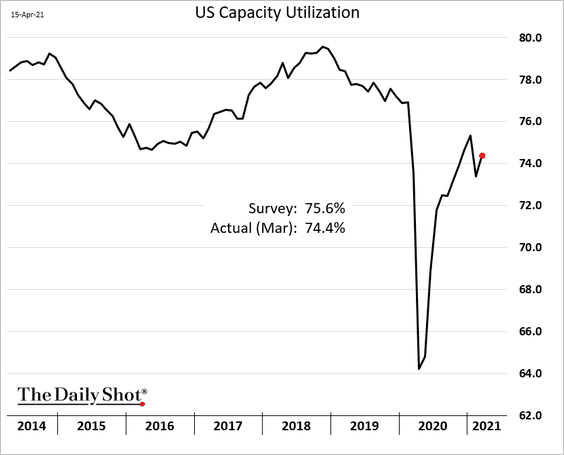
Capacity utilization moved higher.
There are more gains ahead for the nation’s manufacturing output. Here is a comparison with the ISM index.
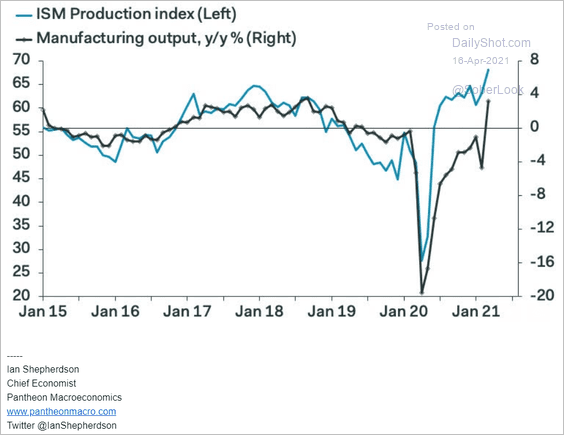 Source: Pantheon Macroeconomics
Furthermore, the regional reports from the NY Fed and the Philly Fed point to exceptionally strong growth in factory activity this month. More on this on Monday.
——————–
3. Jobless claims are trending lower as the labor market recovers.
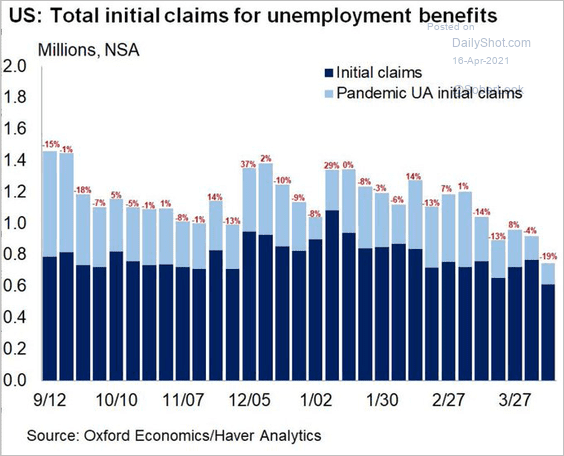 Source: @GregDaco
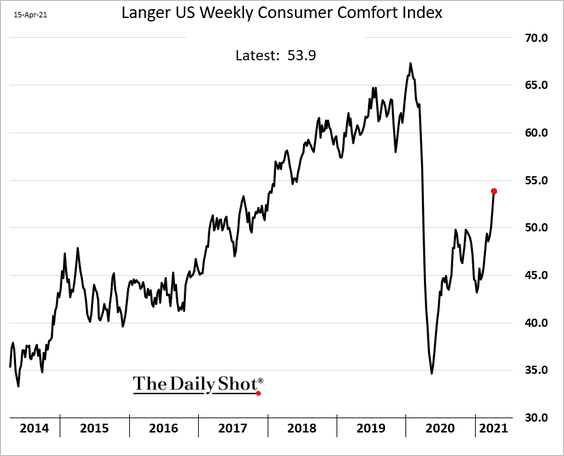
4. Below are some high-frequency indicators.
• Consumer sentiment:
• Air travel:
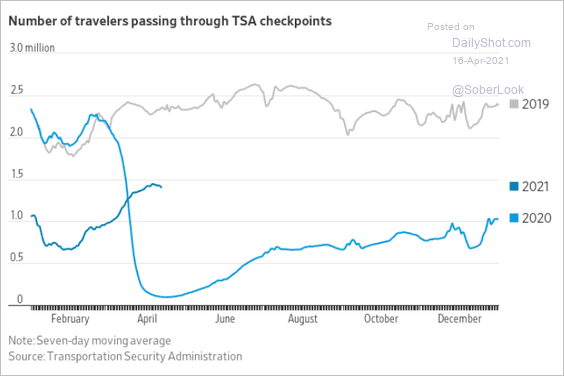 Source: @WSJ Read full article
• Comfort in entertainment activities:
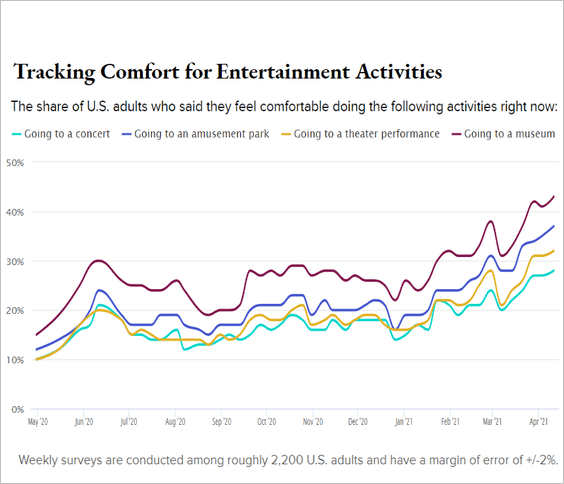 Source: Morning Consult
• The Oxford Economics Recovery Tracker:
![]() Source: Oxford Economics
Source: Oxford Economics
——————–
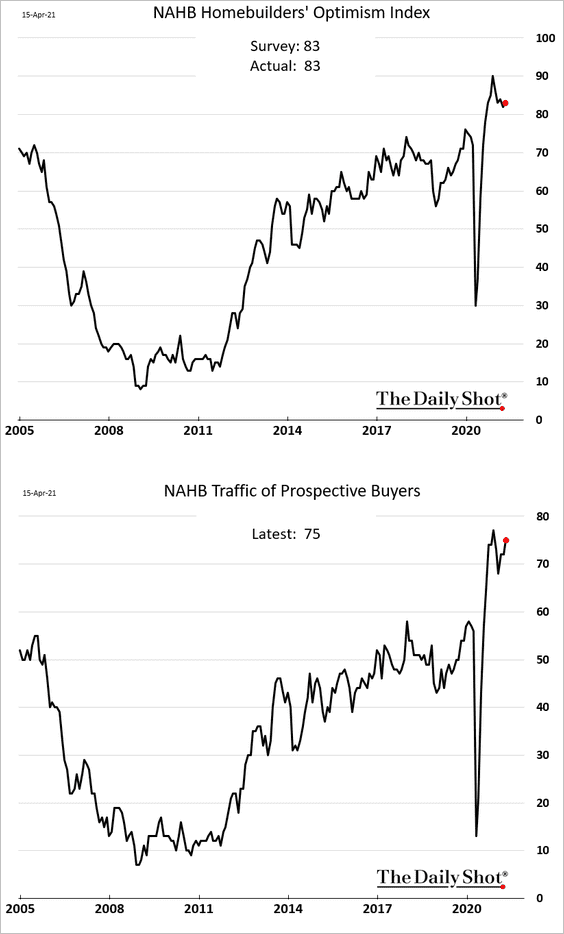
5. Homebuilder optimism edged higher this month amid strong demand.
——————–
Food for Thought
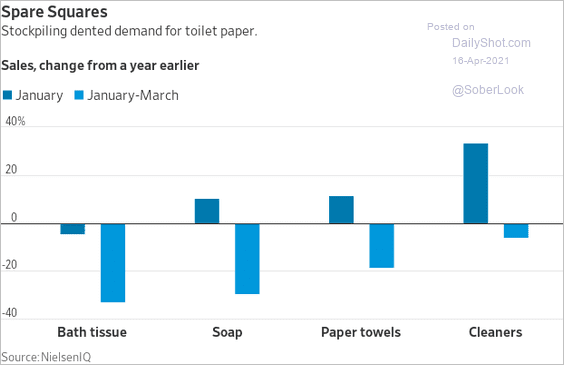
1. US households dipping into their toilet paper stockpile:
 Source: @WSJ Read full article
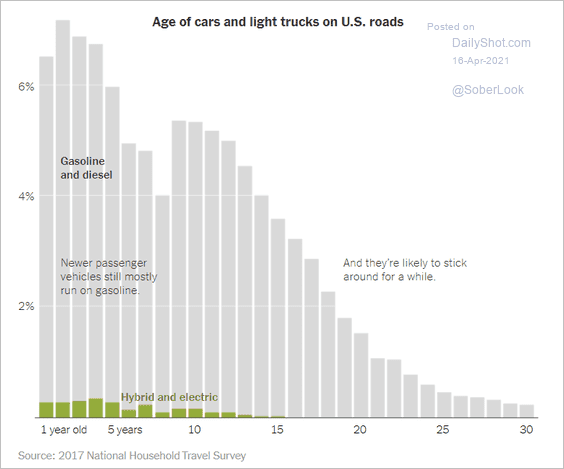
2. Age of cars and trucks in the US:
 Source: The New York Times Read full article
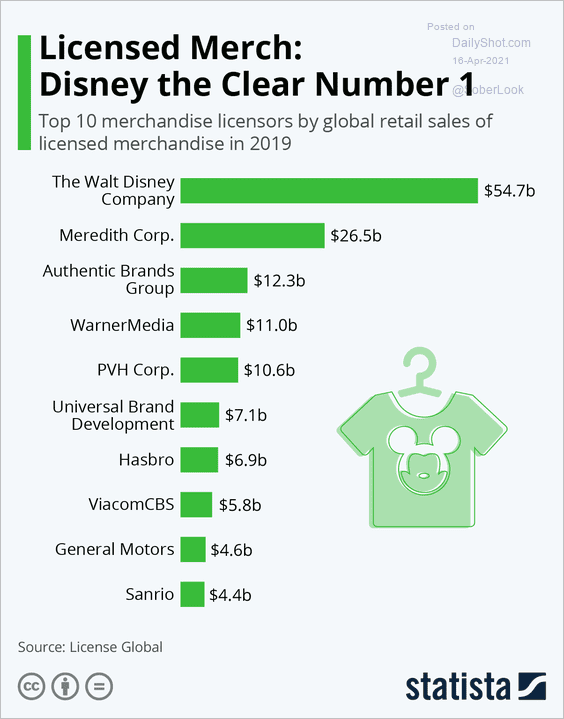
3. Retail sales of licensed merchandise:
 Source: Statista
4. Mortgage originations by credit score:
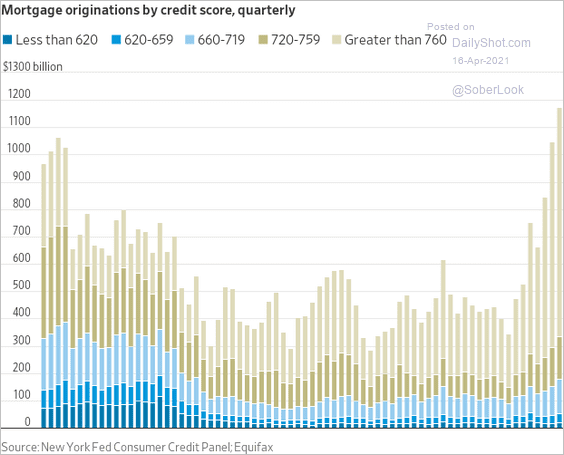 Source: @WSJ Read full article
5. The online dating market:
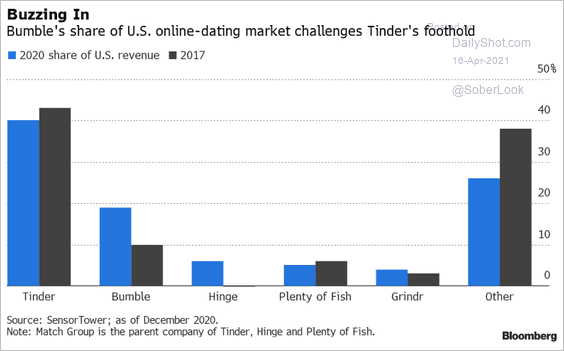 Source: @markets Read full article
6. The deficit impact of stimulus bills:
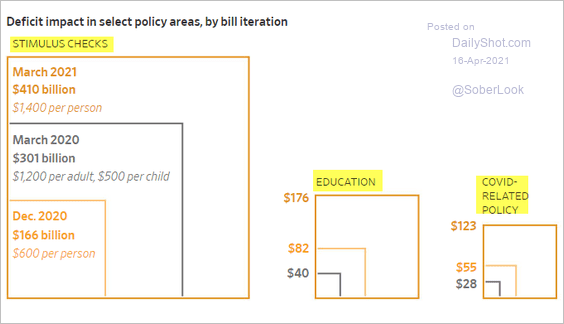 Source: @WSJ Read full article
7. Child share of the US population:
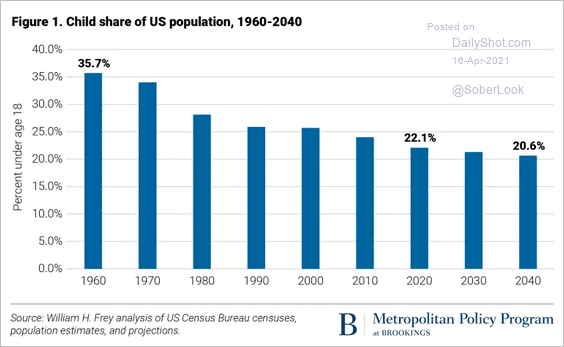 Source: Brookings Read full article
8. Student debt demographics:
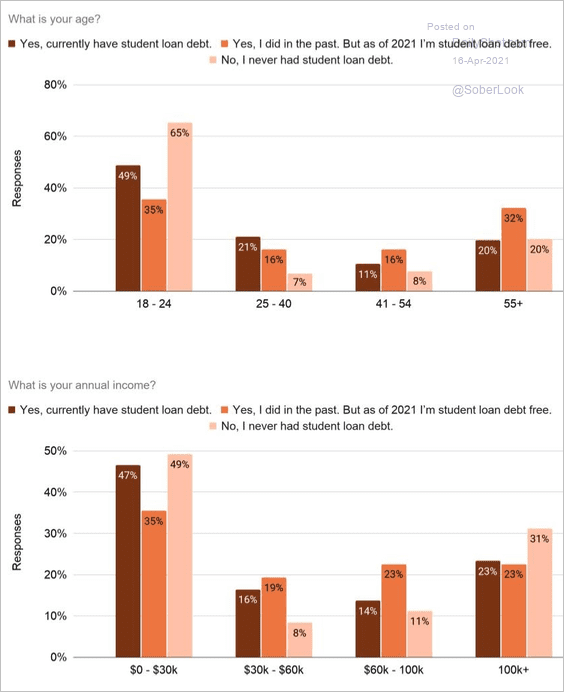 Source: Invisibly Read full article
9. LG’s exit from the smartphone market:
 Source: Statista
10. The Simpsons viewership per episode:
 Source: @chartrdaily
——————–
Have a great weekend!
Back to Index