
The Daily Shot: 12-May-21
• The United States
• The United Kingdom
• The Eurozone
• Europe
• Asia – Pacific
• China
• Emerging Markets
• Cryptocurrency
• Commodities
• Equities
• Credit
• Global Developments
• Food for Thought
The United States
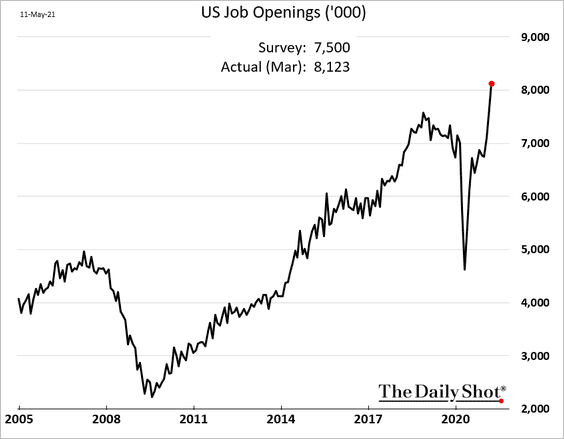
1. The job openings report provided further confirmation of the tightening labor market. Vacancies blew past market expectations.
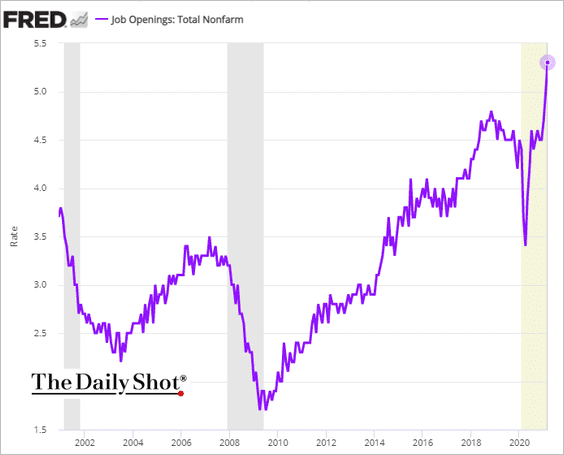
And the job openings rate hit another record high.
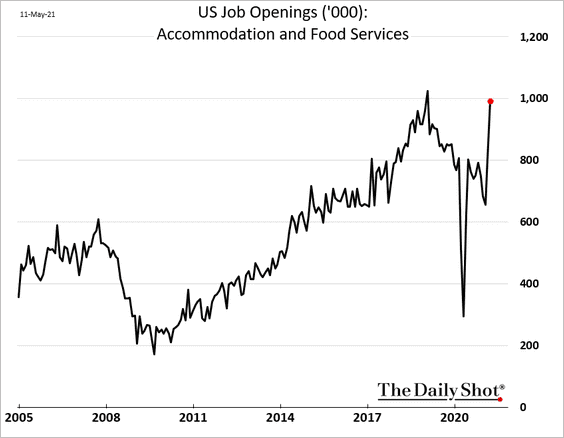
• Vacancies at hotels and restaurants surged.
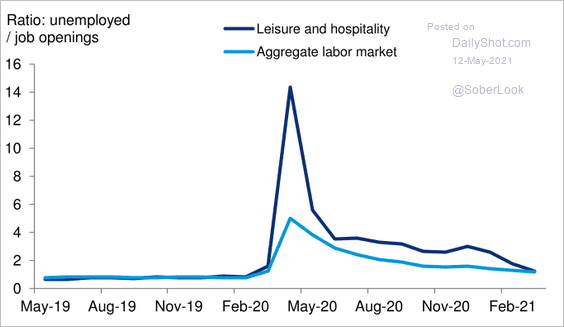
The Leisure & Hospitality unemployment-to-openings ratio is now in line with the overall jobs market.
 Source: Deutsche Bank Research
Many restaurants are struggling to get workers and will be forced to boost pay.
 Source: CNN Business Read full article
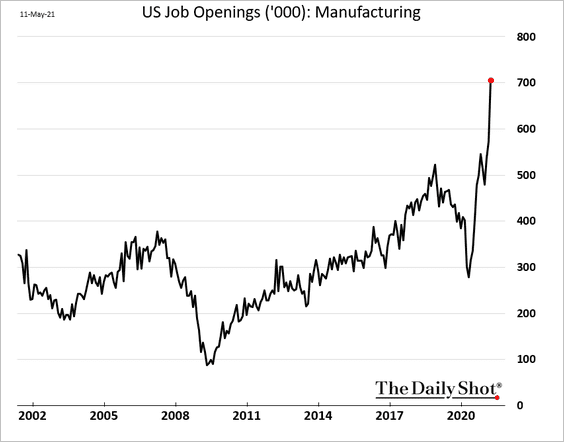
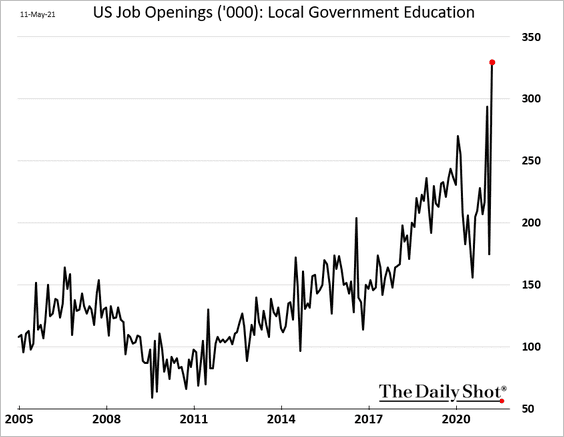
• Demand for factory workers and teachers is surging.
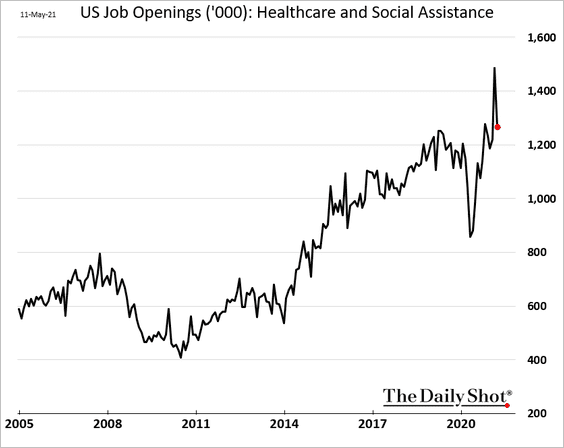
But openings in healthcare are off the highs.
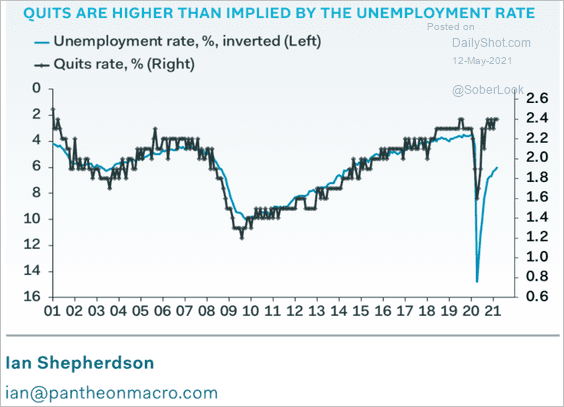
• Layoffs hit the lowest level in recent history, while voluntary resignations (quits) have been trending higher.
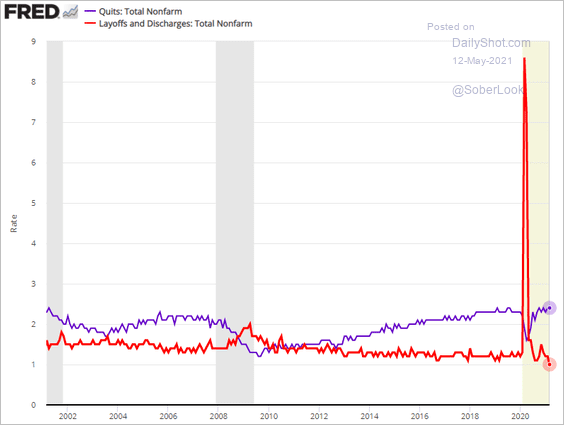
The gap between the unemployment rate and quits rate remains wide.
 Source: Pantheon Macroeconomics
• Related to the above, the Beveridge curve has turned up, suggesting that many unemployed workers are not ready to return.
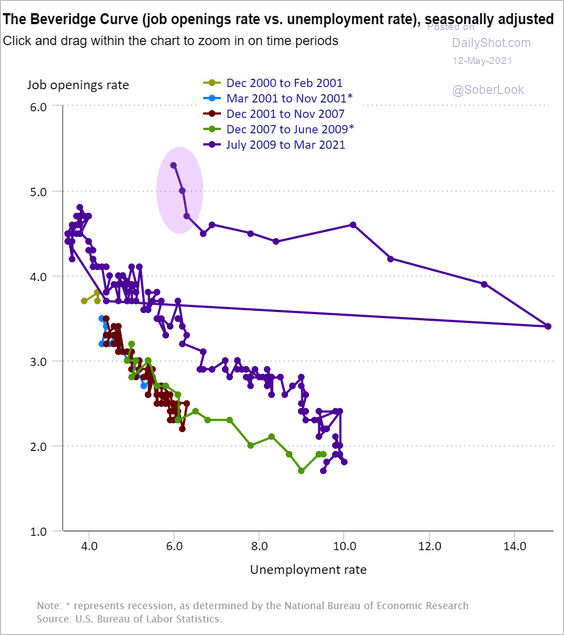 Source: Bureau of Labor Statistics
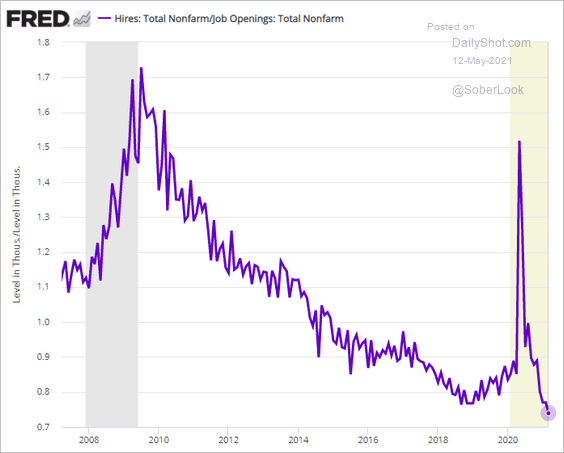
Here is the hires-to-openings ratio.
• Small firms increasingly view the extra unemployment benefits as the reason for hiring shortages.
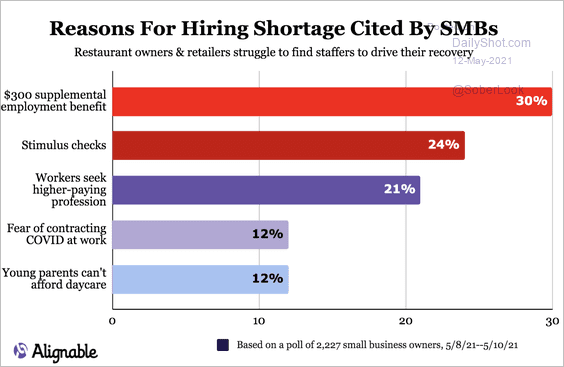 Source: Alignable
And some state governments are cutting these benefits to encourage workers to return.
 Source: @WSJ Read full article
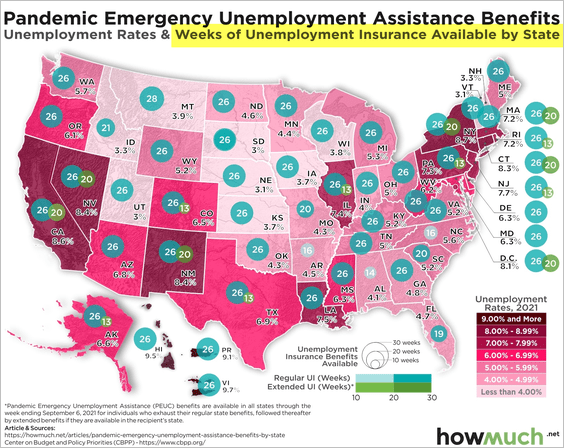 Source: @howmuch_net Read full article
• Job ads on Indeed are rising across sectors.
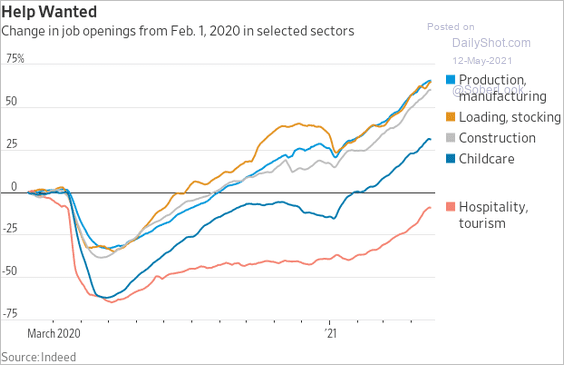 Source: @WSJ Read full article
——————–
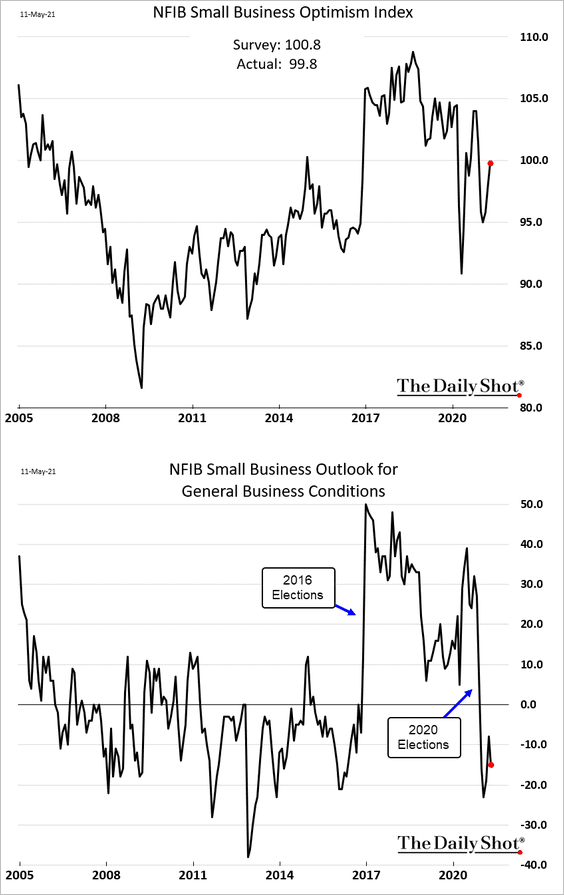
2. The NFIB small business optimism index improved less than expected last month.
• The NFIB report also confirmed supply constraints in the labor market. The share of small firms unable to fill job openings hit another record high.
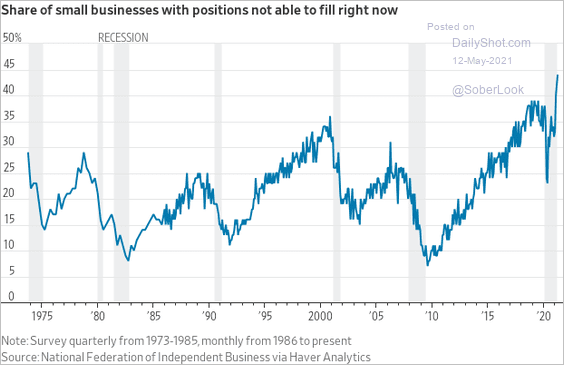 Source: @WSJ Read full article
And as we saw with the job openings report (above), there is a disconnect with the unemployment rate.
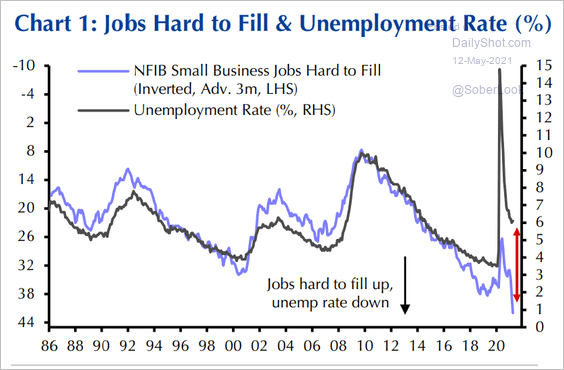 Source: Capital Economics
Note that the NFIB “jobs hard to fill” index is highly correlated with the job openings rate (#1 above).
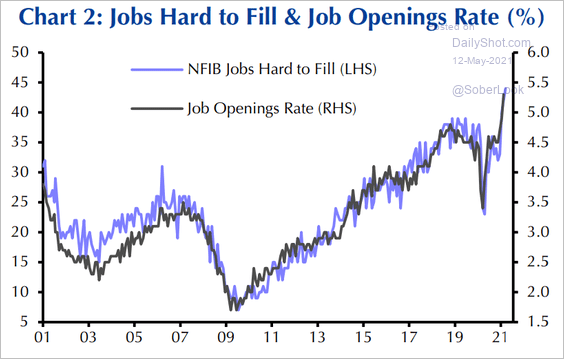 Source: Capital Economics
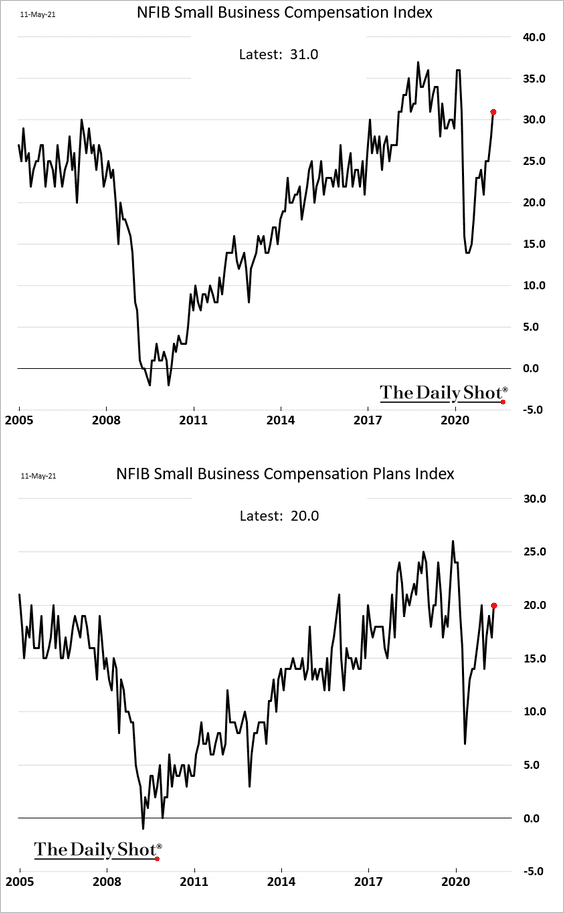
• Compensation indicators are climbing, but small firms may need to do more to attract workers.
• Price indictors are soaring, …
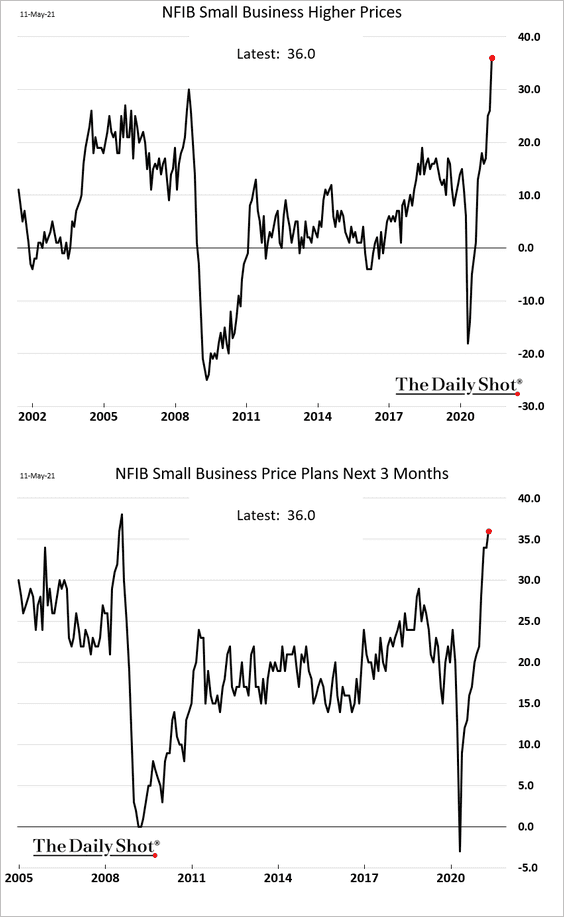
… as inventories run low.
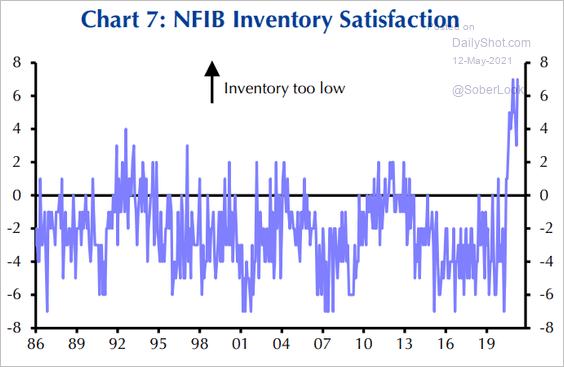 Source: Capital Economics
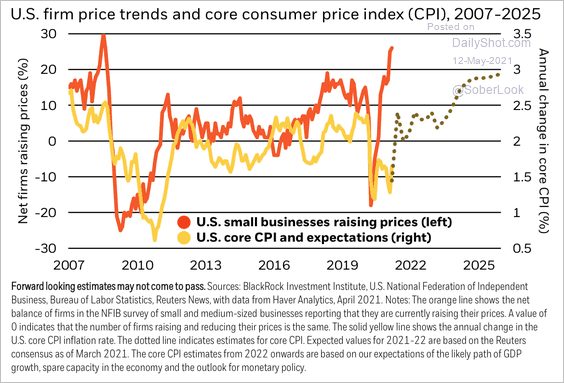
Small business pricing power points to higher consumer inflation ahead.
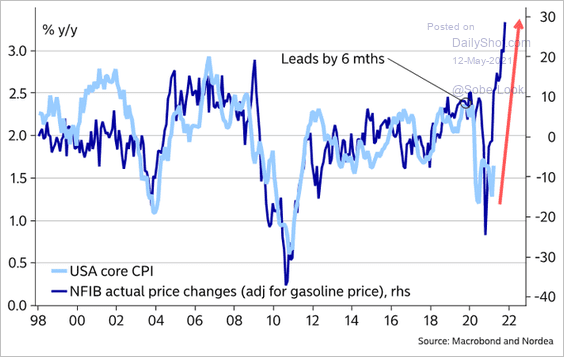 Source: @MikaelSarwe
• A survey from Alignable indicates rising concerns about the cost of supplies.
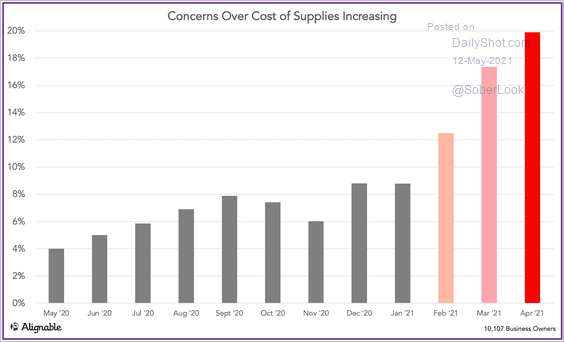 Source: Alignable
——————–
3. According to the latest survey from the NY Fed, consumers increasingly expect higher inflation ahead.
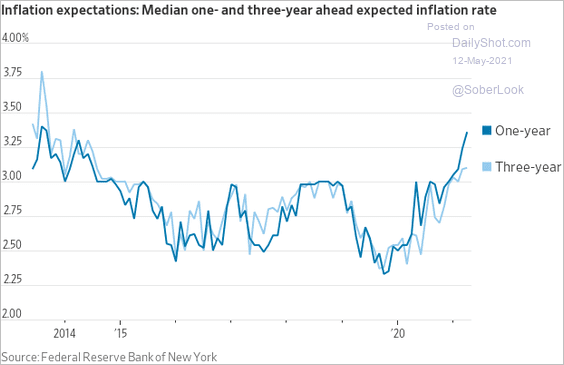 Source: @jeffsparshott
Here is a forecast for the headline CPI from Oxford Economics.
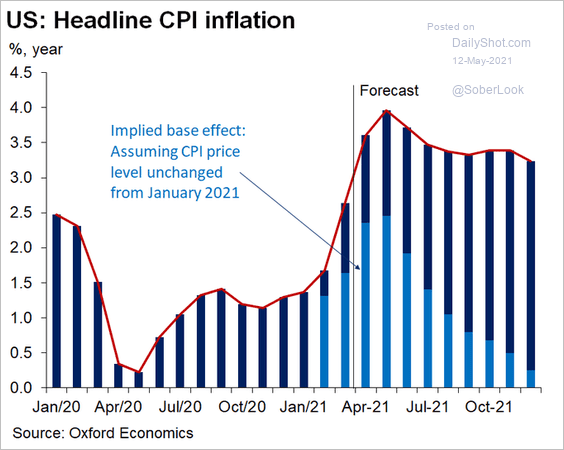 Source: @GregDaco
BlackRock expects inflation to overshoot the Fed’s 2% target during the next few years.
 Source: BlackRock
——————–
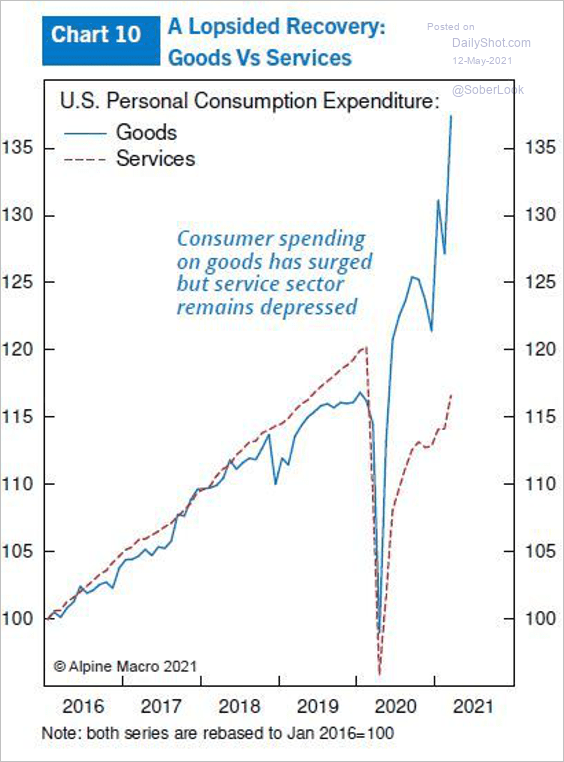
4. The recovery has been driven by goods demand rather than services. Some analysts have suggested that portions of the fiscal stimulus programs encourage massive imports rather than domestic spending.
 Source: Chen Zhao
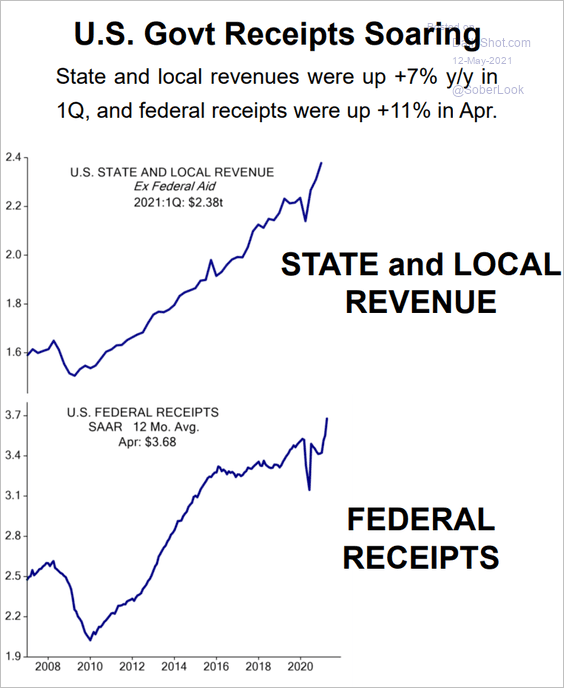
5. Government tax revenues are soaring.
 Source: Evercore ISI
Back to Index
The United Kingdom
1. The composite PMI points to sharp increases in GDP growth.
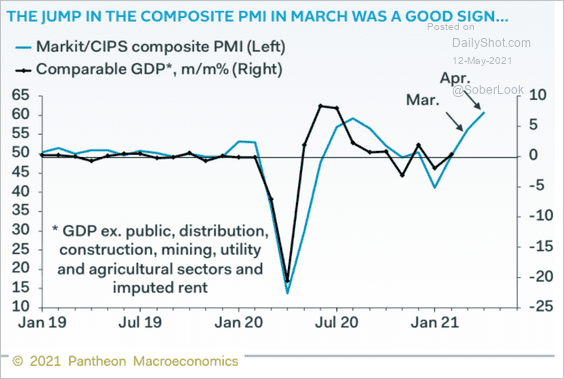 Source: Pantheon Macroeconomics
2. UK workers are gradually returning to the office.
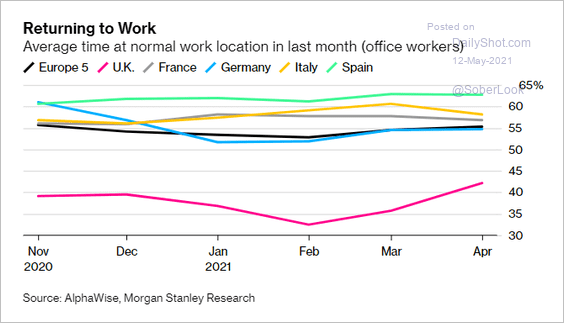 Source: Bloomberg Read full article
3. This chart compares the 2019 general election results with an estimate based on the 2021 local elections.
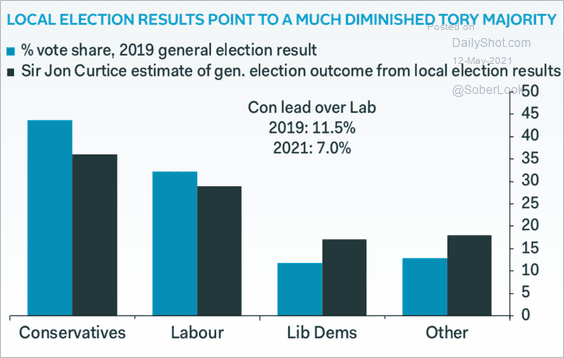 Source: Pantheon Macroeconomics
4. GBP/USD has been sensitive to yield moves.
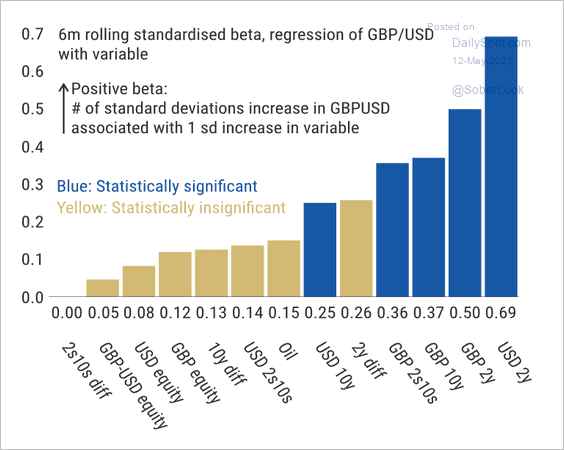 Source: Morgan Stanley Research
Back to Index
The Eurozone
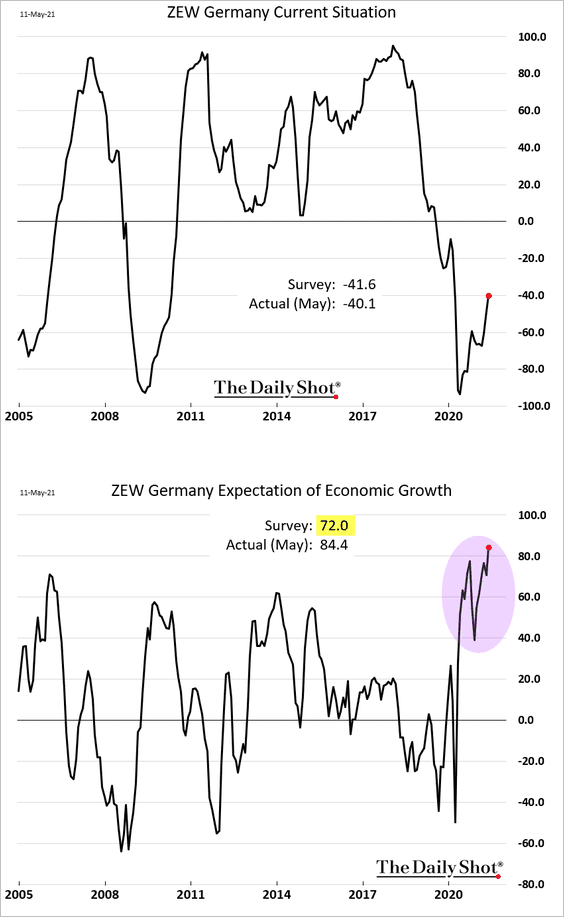
1. Let’s begin with Germany.
• The ZEW expectations index hit a new high, rising well ahead of forecasts. Germany’s growth is expected to surge.
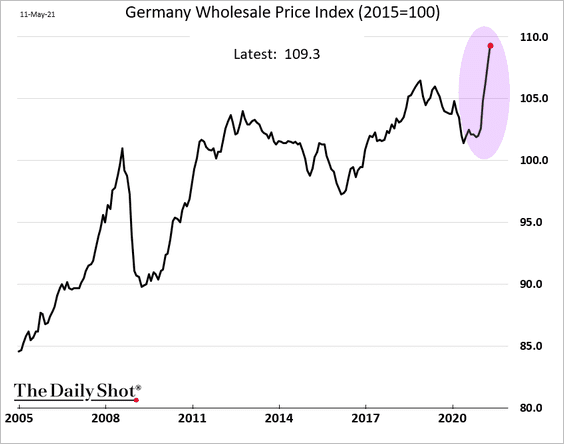
• Wholesale prices are rising rapidly.
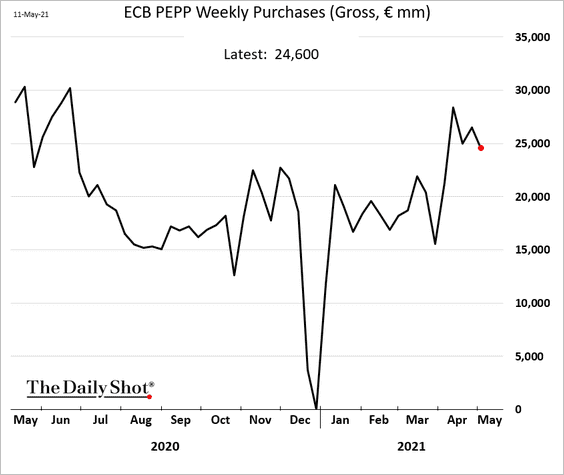
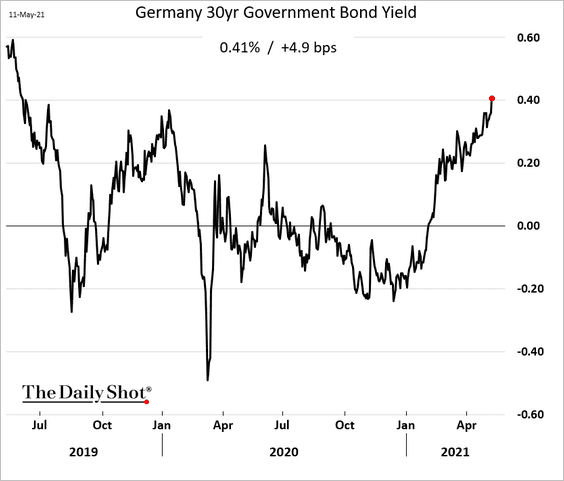
• The market is not convinced that the ECB is serious about containing bond yields.
The 30yr Bund yield hit the highest level since 2019.
——————–
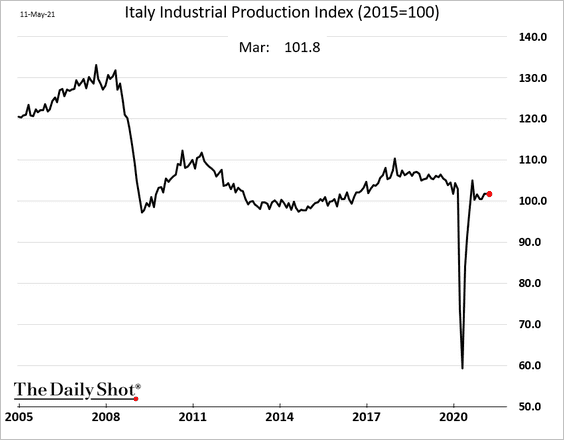
2. Italy’s industrial production held steady in March.
3. Next, we have some data on the ECB’s TLTRO uptake.
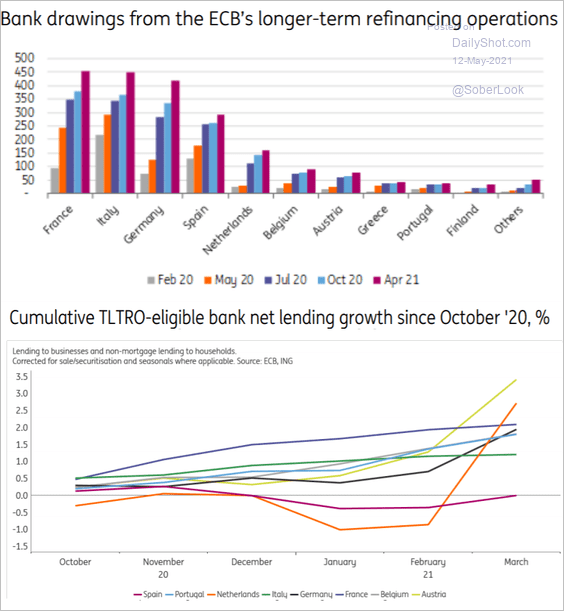 Source: ING
4. And finally, here are some projections for the Recovery and Resilience Facility.
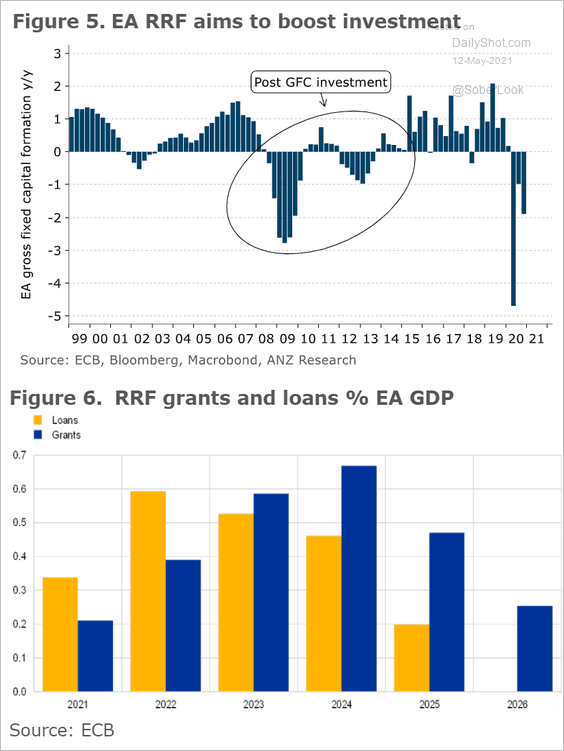 Source: ANZ Research
Back to Index
Europe
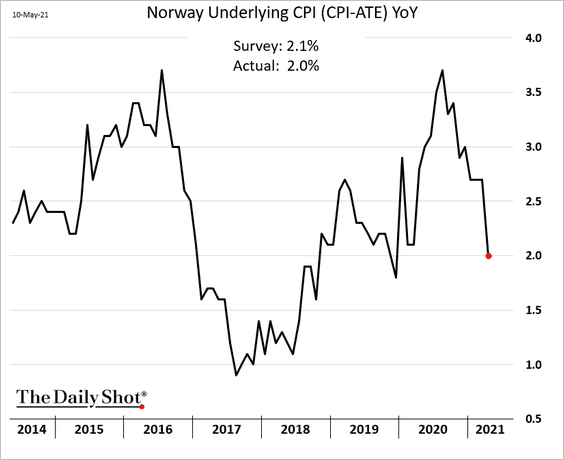
1. Norway’s CPI continues to moderate.
2. This chart shows the EU’s trade with Switzerland.
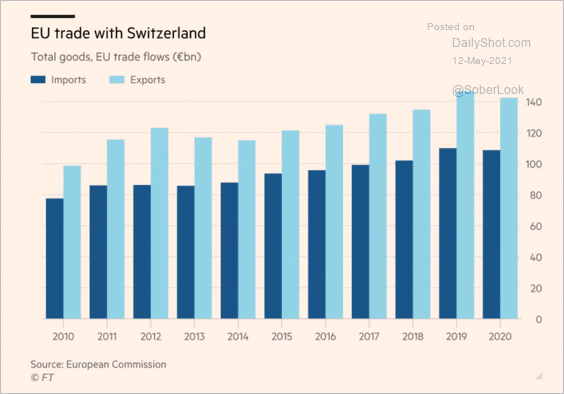 Source: @adam_tooze, @financialtimes Read full article
3. Most EU banks are well-capitalized.
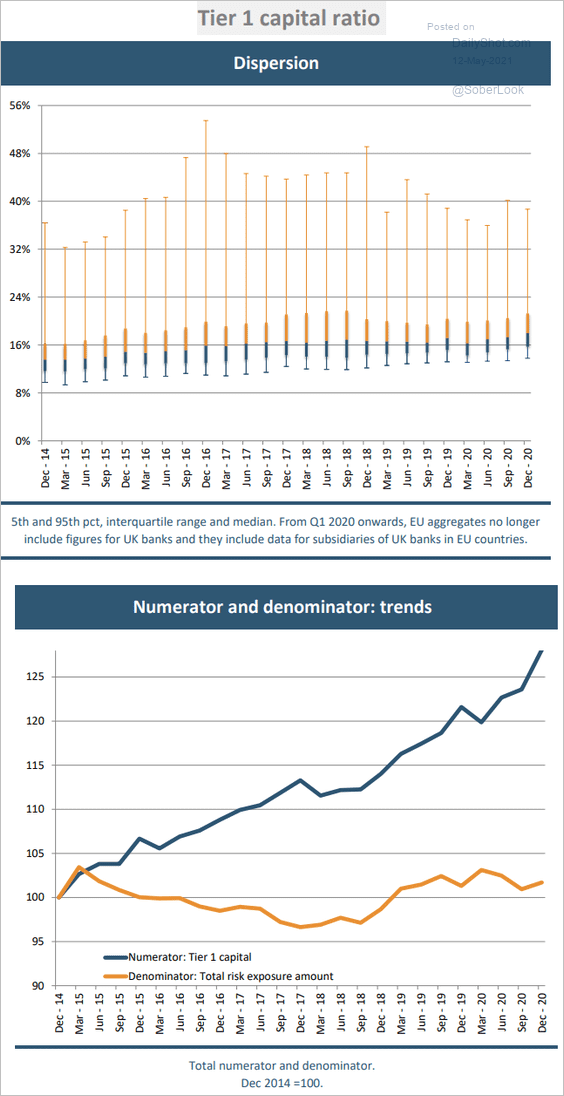 Source: EBA
4. How difficult was it to cope with the lockdowns?
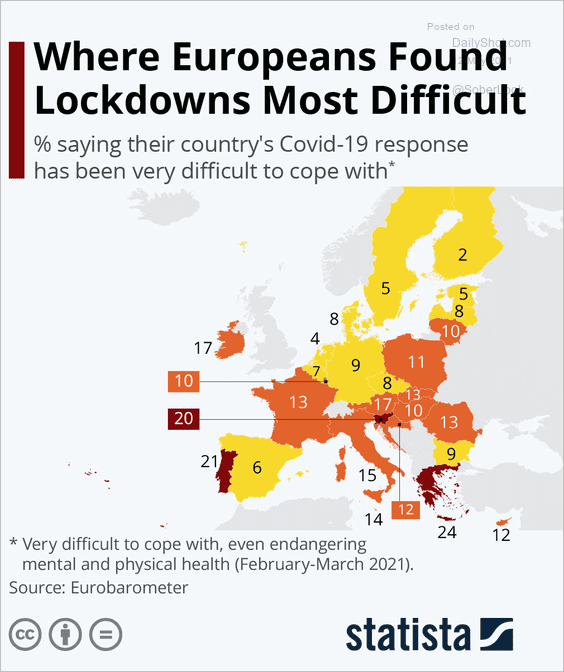 Source: Statista
Back to Index
Asia – Pacific
1. Japan’s corporate sales have been much stronger than expected.
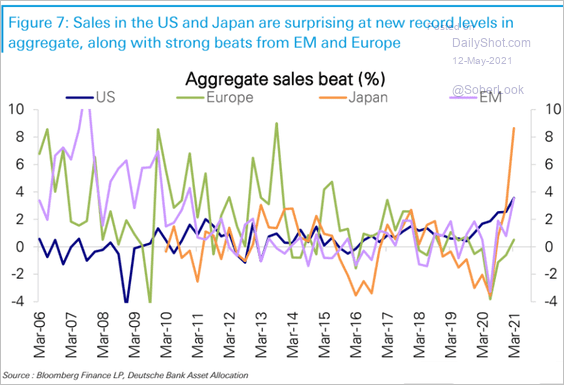 Source: Deutsche Bank Research
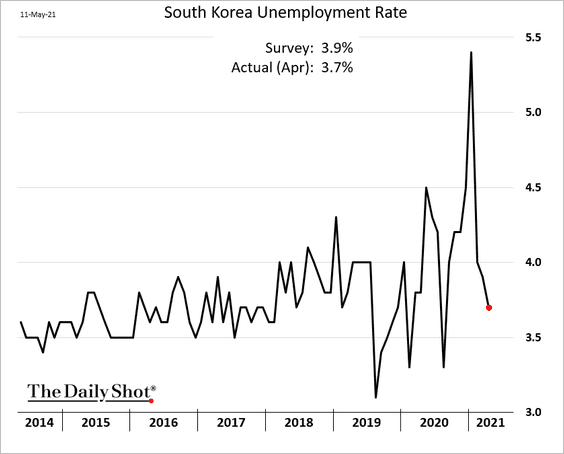
2. South Korea’s unemployment rate declined further last month.
3. Taiwan relies heavily on semiconductor sales.
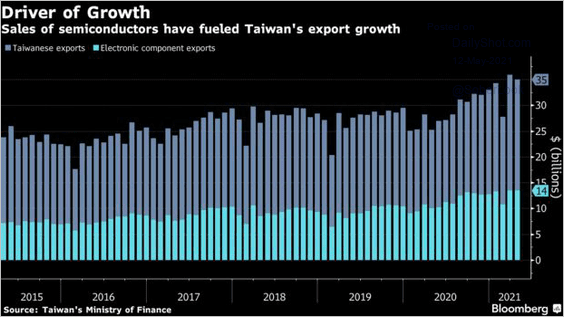 Source: @markets Read full article
Taiwan’s stock market rally is fading.
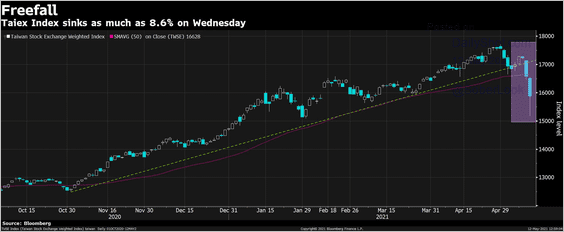 Source: @tracyalloway Read full article
——————–
4. Asia’s share of global semiconductor exports is now above 80%.
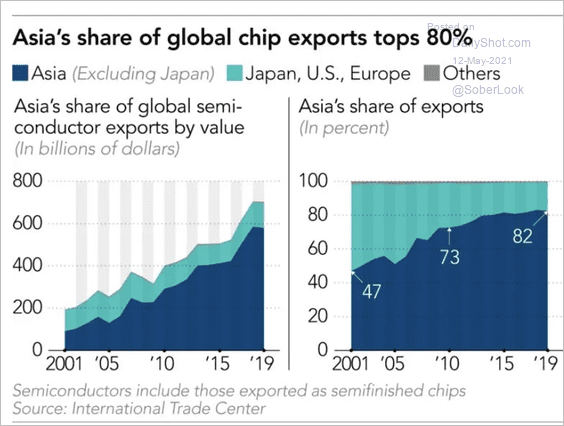 Source: Nikkei Asia Read full article
5. Will Australia lose its AAA rating as the fiscal situation deteriorates? CBA assigns a substantial probability to this outcome.
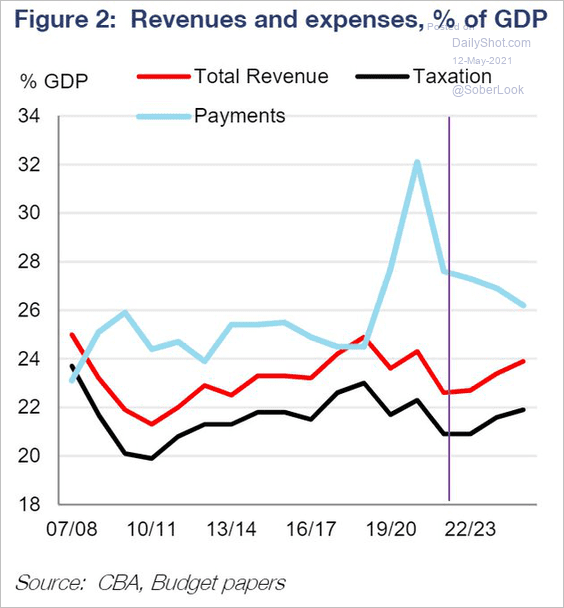 Source: CBA, @Scutty
Separately, Australian exports have been heavily dependent on iron ore.
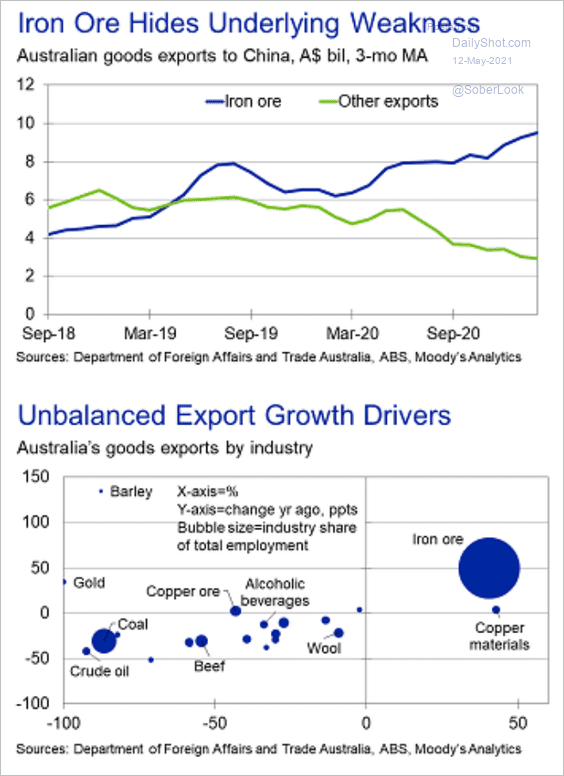 Source: Moody’s Analytics
Back to Index
China
1. Here is an overview of China’s economic recovery.
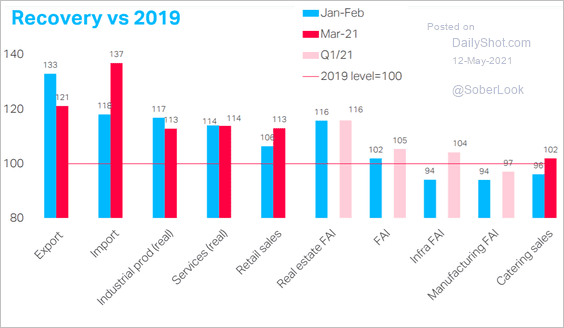 Source: TS Lombard
2. Foreigners have been buying Chinese bonds again.
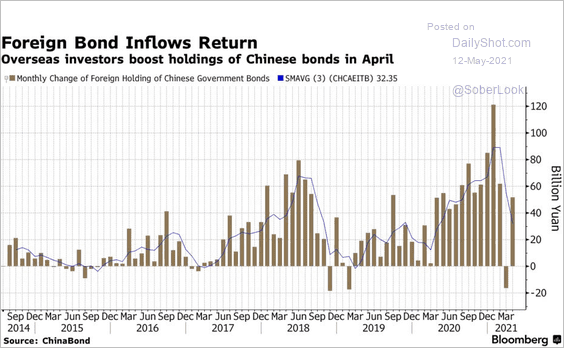 Source: Bloomberg Read full article
3. Tourism is improving.
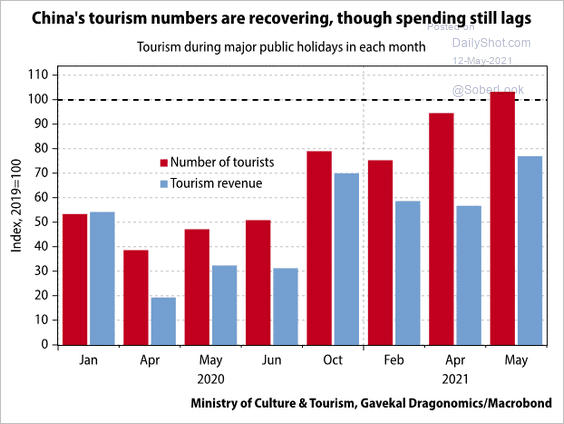 Source: @Gavekal
4. What are the biggest sources of China’s carbon emissions?
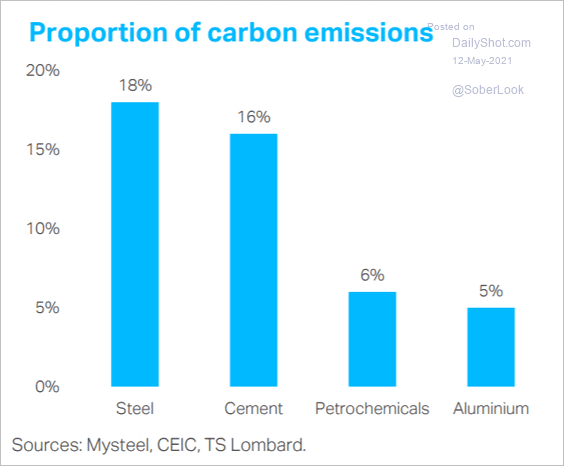 Source: TS Lombard
Back to Index
Emerging Markets
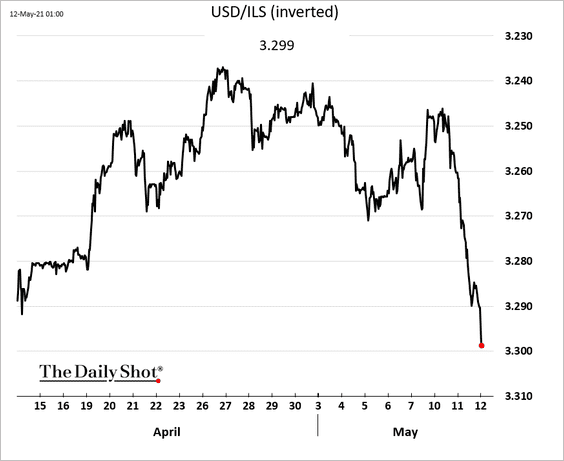
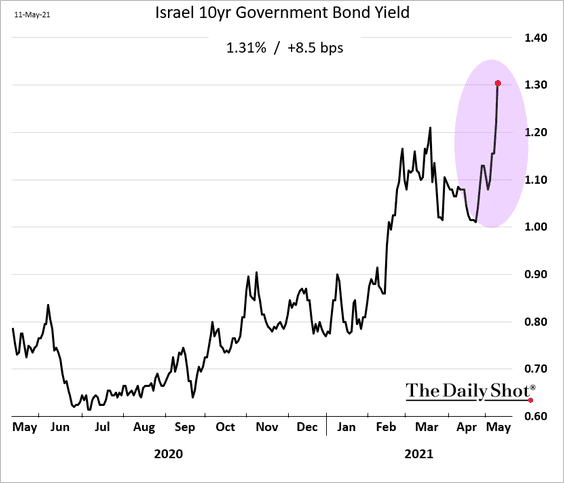
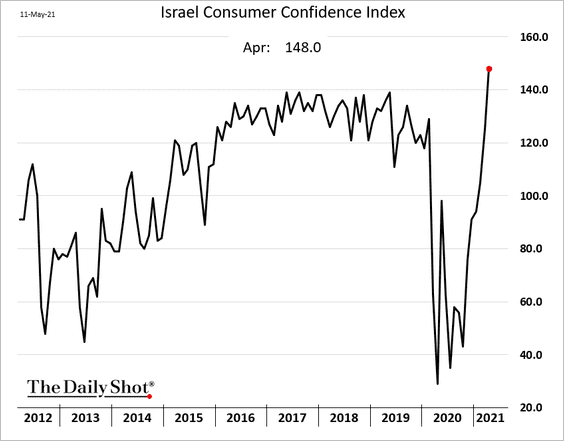
1. Israel’s markets are under some pressure due to the escalation of hostilities.
• The Israeli shekel:
• Bond yields:
Separately, consumer confidence hit a new high in April.
——————–
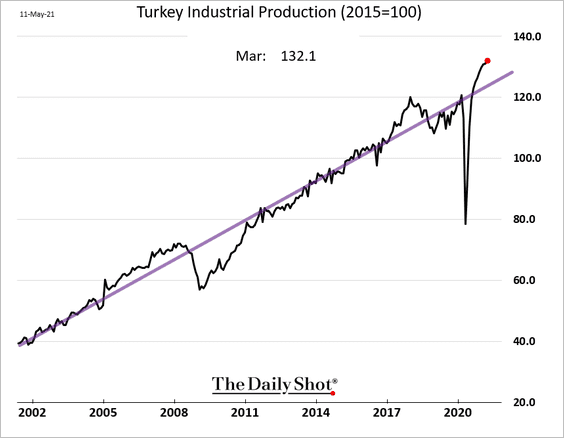
2. Turkey’s industrial production is running well above trend.
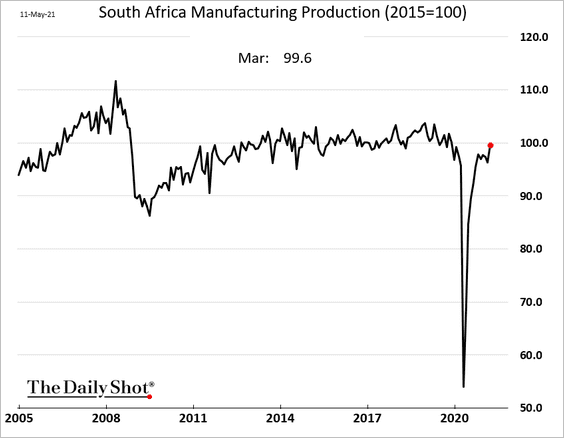
3. South Africa’s manufacturing output rose sharply in March and is now at pre-COVID levels.
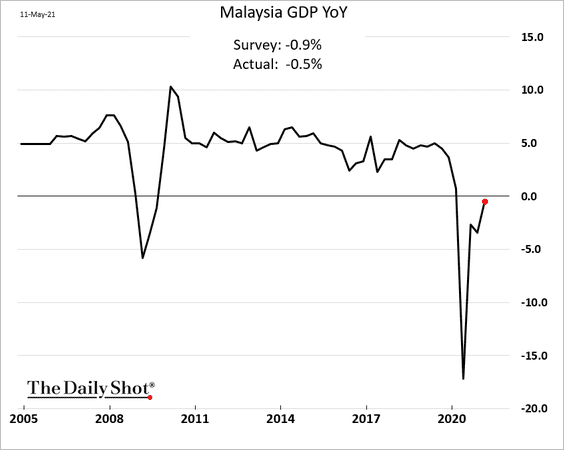
4. Malaysia’s Q1 GDP growth exceeded expectations.
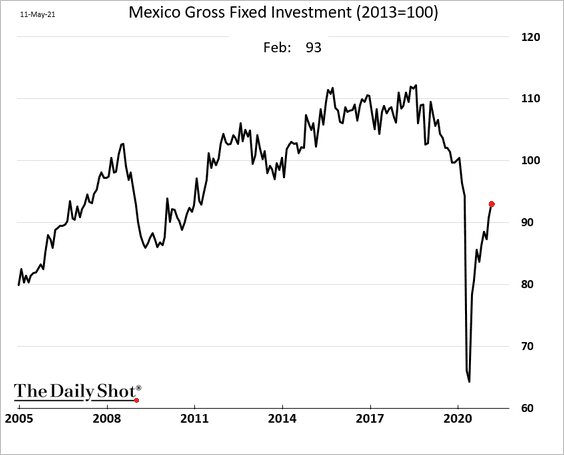
5. Mexico’s fixed investment continued to recover in February.
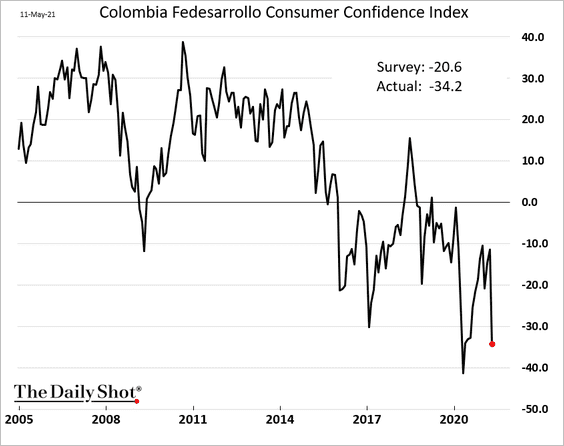
6. Colombia’s consumer sentiment deteriorated again.
7. Similar to the US, EM inflation volatility has eased over the past few years.
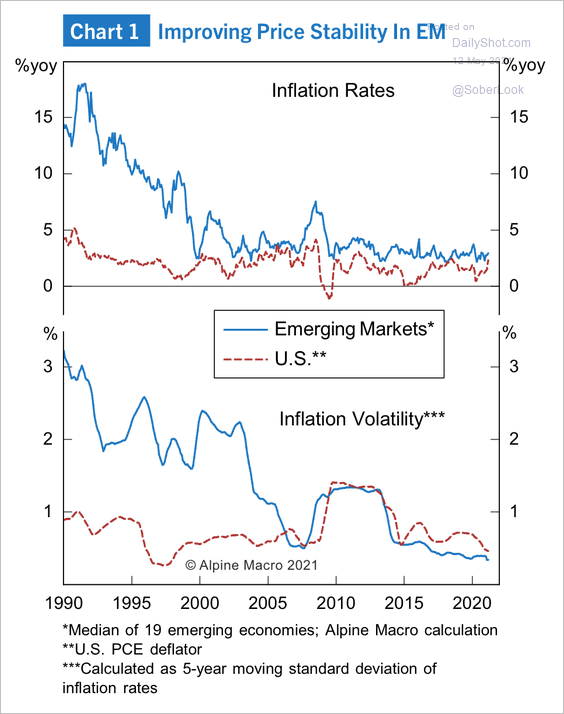 Source: Alpine Macro
However, there is a wide dispersion of headline inflation and core CPI among some EM countries.
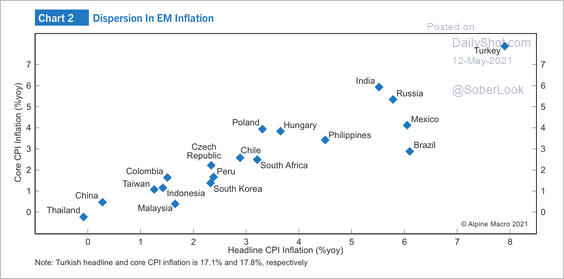 Source: Alpine Macro
——————–
8. The proportion of EM companies beating earnings and sales estimates has been surging.
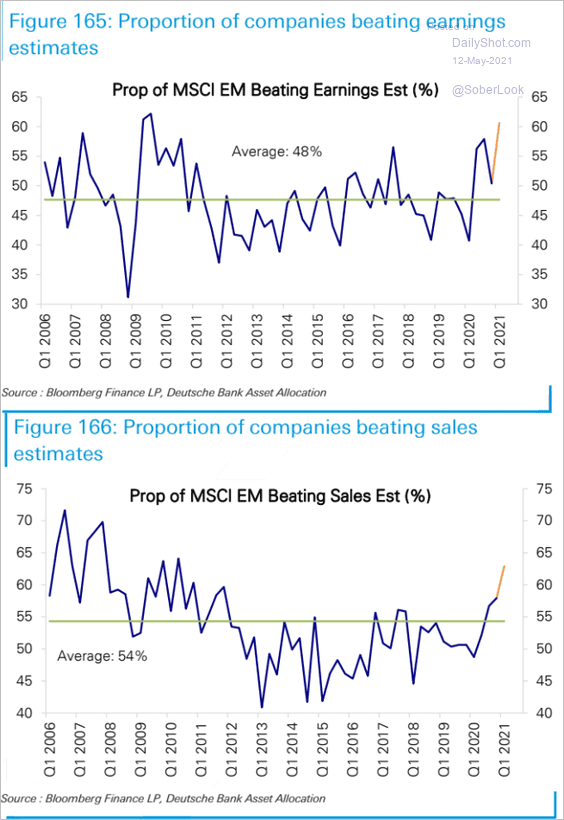 Source: Deutsche Bank Research
Back to Index
Cryptocurrency
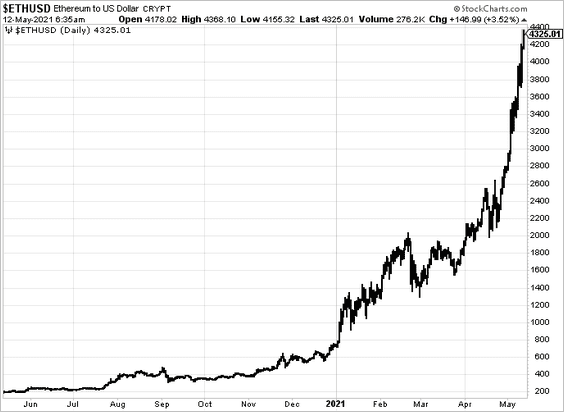
1. Ethereum continues to soar.
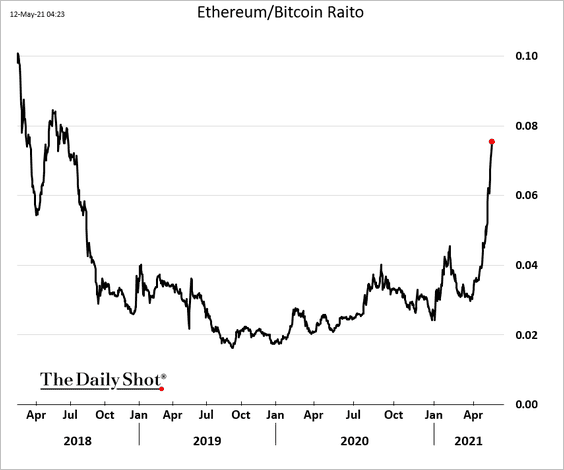
Here is the Ethereum/Bitcoin ratio.
——————–
2. Dfinity’s token surges on debut.
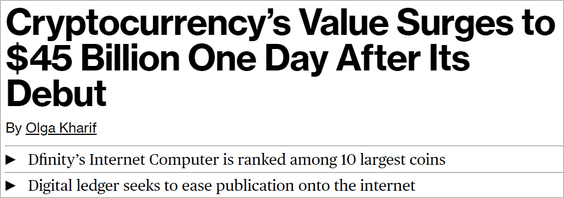 Source: Bloomberg Read full article
3. Bitcoin fund flows have been soft.
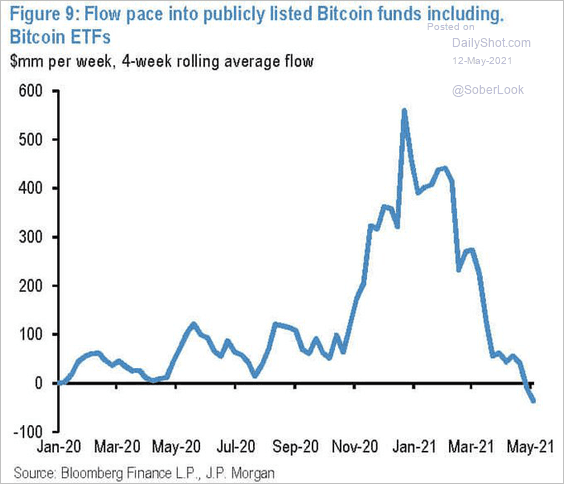 Source: @ISABELNET_SA, @jpmorgan
Back to Index
Commodities
1. Iron ore continues to surge.
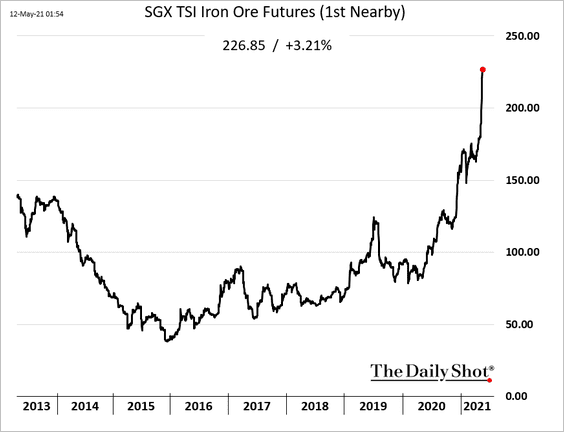
China’s commodity exchanges have been trying to cool iron ore and steel prices but haven’t succeeded.
 Source: South China Morning Post Read full article
Fitch expects iron ore prices to drift lower over the long term.
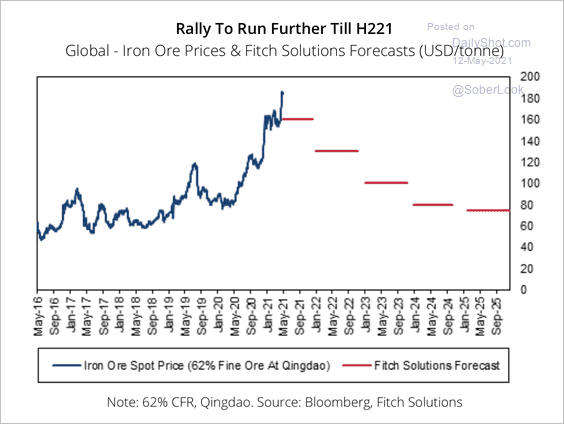 Source: Fitch Solutions Macro Research
Global iron ore production growth is expected to accelerate in the coming years.
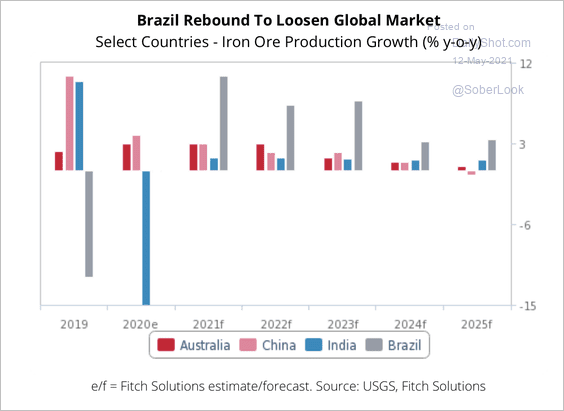 Source: Fitch Solutions Macro Research
——————–
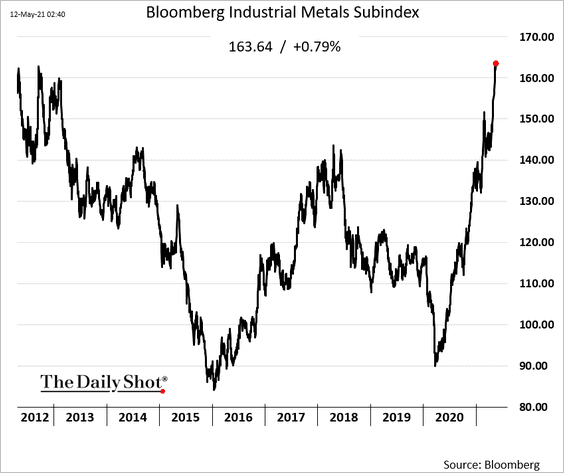
2. Here is Bloomberg’s industrial metals index.
This chart shows the relationship between China’s housing demand and industrial commodities.
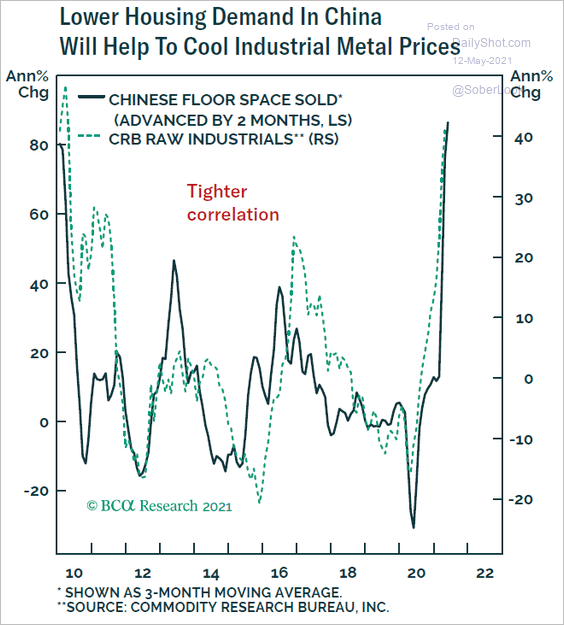 Source: BCA Research
——————–
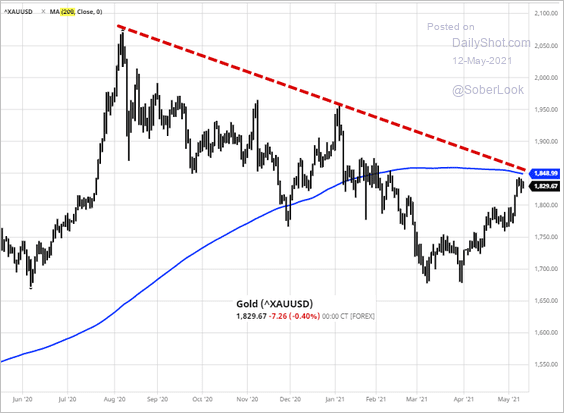
3. Gold is at resistance.
 Source: barchart.com
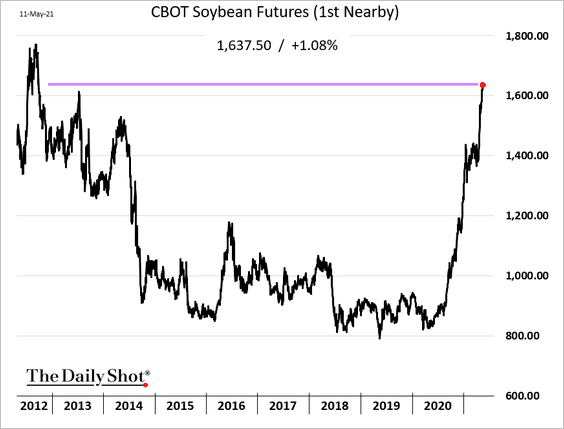
4. Soybean oil prices cleared the 2008 peak amid surging demand from restaurants around the world.
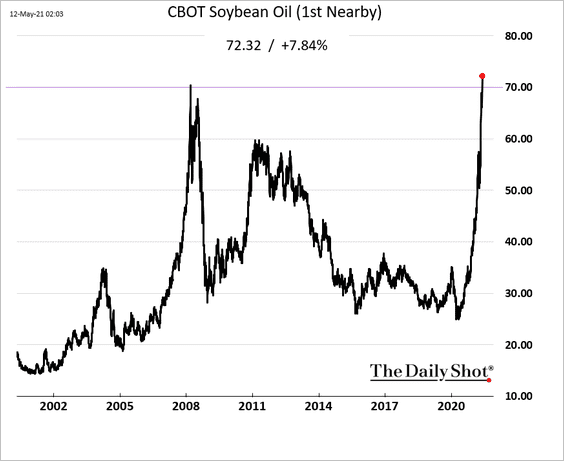
Soybean futures hit the highest level since 2012.
——————–
5. Sugar futures are surging, …
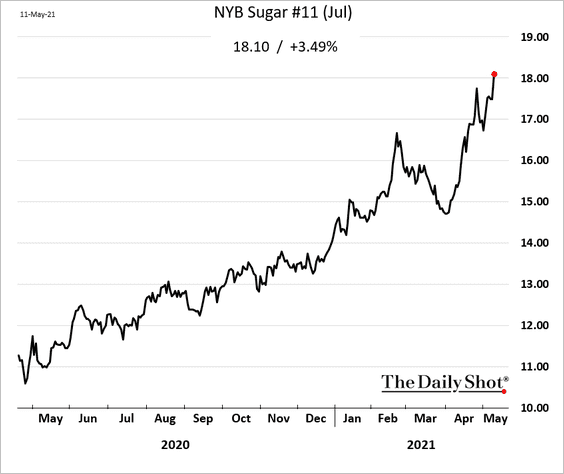
… boosted by the ethanol rally in Brazil.
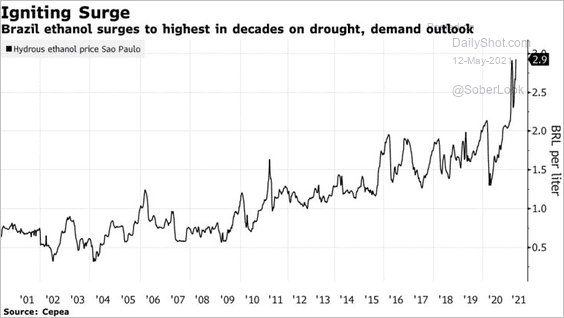 Source: @markets Read full article
——————–
6. Commodity positioning looks increasingly stretched.
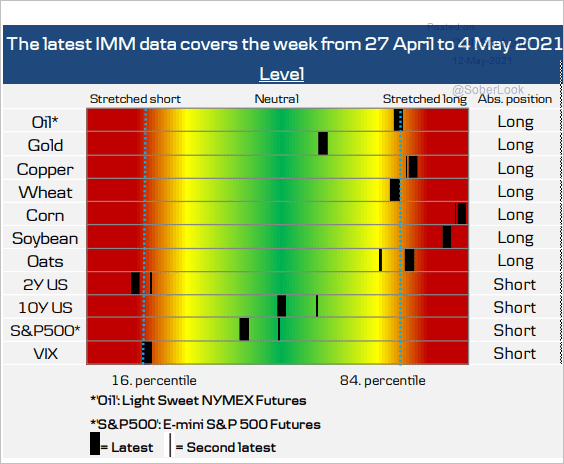 Source: Danske Bank
Back to Index
Equities
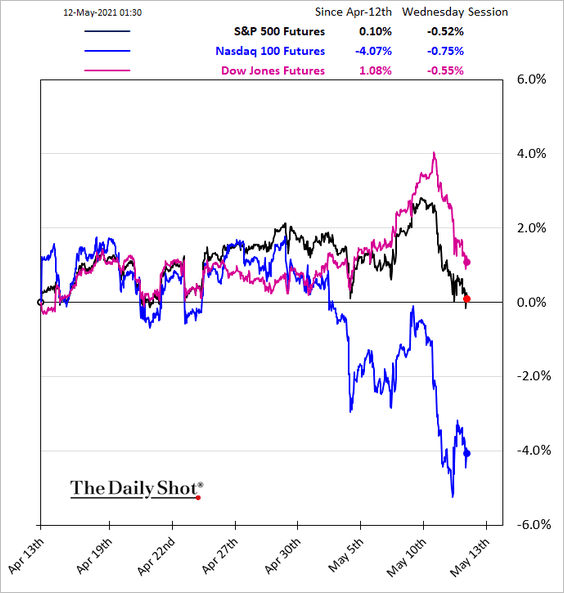
1. The S&P 500 futures are now flat on a month-over-month basis.
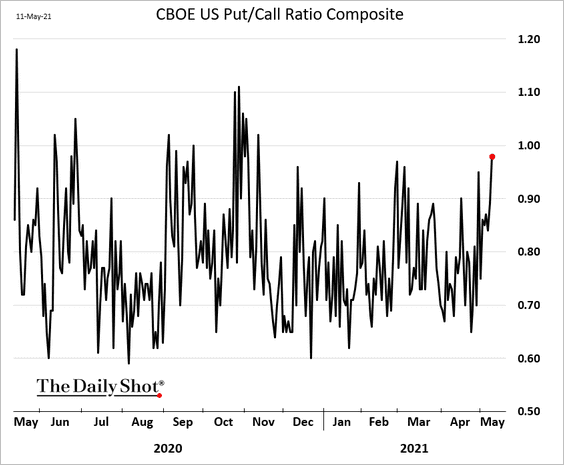
The put-call ratio points to a bit more caution in the market.
——————–
2. In the late 1990s, it took several rate hikes to pop the Nasdaq bubble. There were several corrections on the way to the peak.
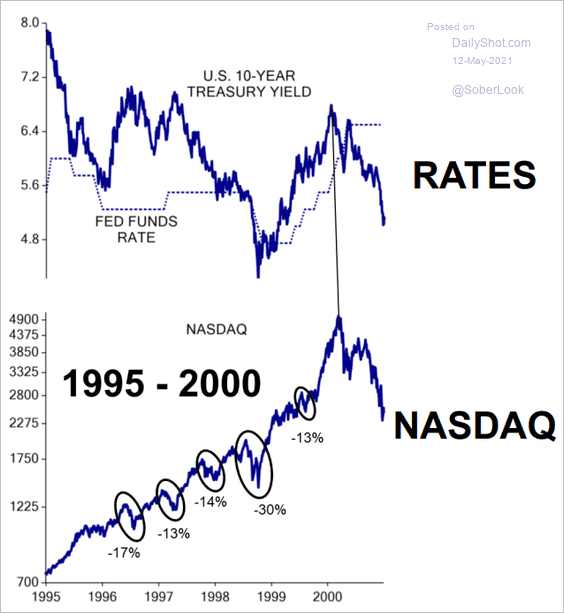 Source: Evercore ISI
3. Here is the history of equal-weight vs. cap-weighted S&P 500 performance differential.
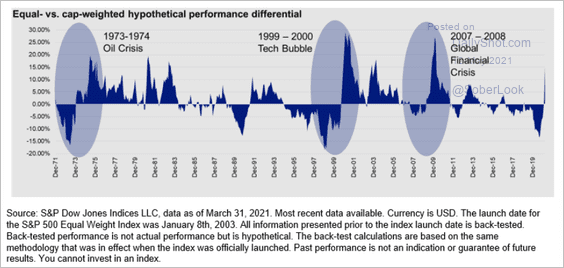 Source: S&P Global Market Intelligence
4. Small caps tend to outperform large caps after significant drawdowns.
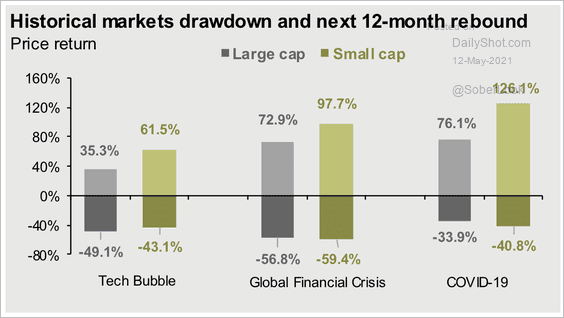 Source: JPMorgan Asset Management
5. The financial sector has broken above the 2007 peak while valuations have contracted relative to the broader market.
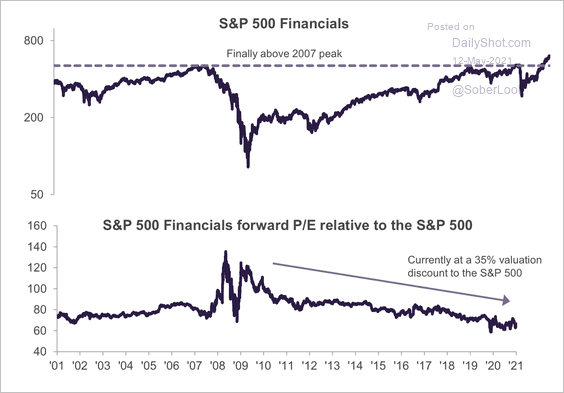 Source: Truist Advisory Services
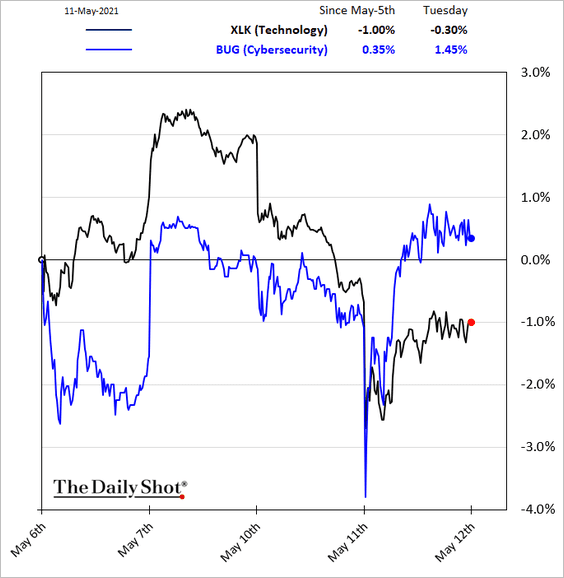
6. The Colonial Pipeline situation sent cybersecurity shares higher.
7. The market hasn’t been too kind to companies beating earnings expectations in the US and Japan.
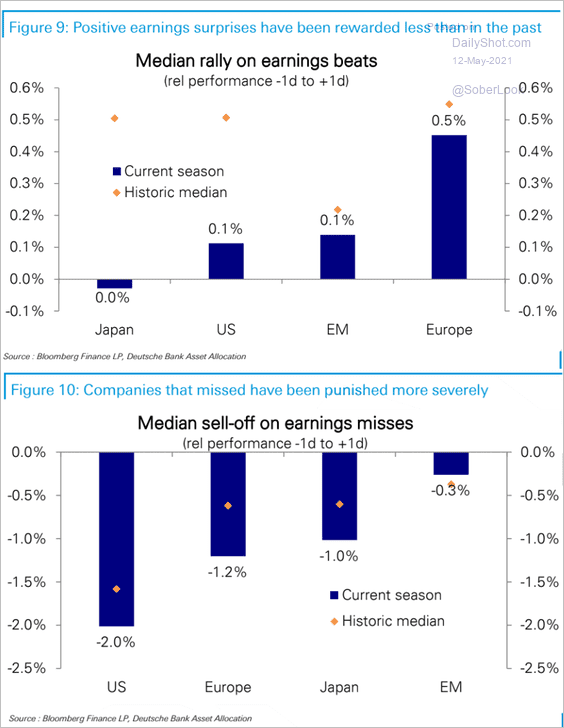 Source: Deutsche Bank Research
8. Q1 earnings will be a tough act to follow.
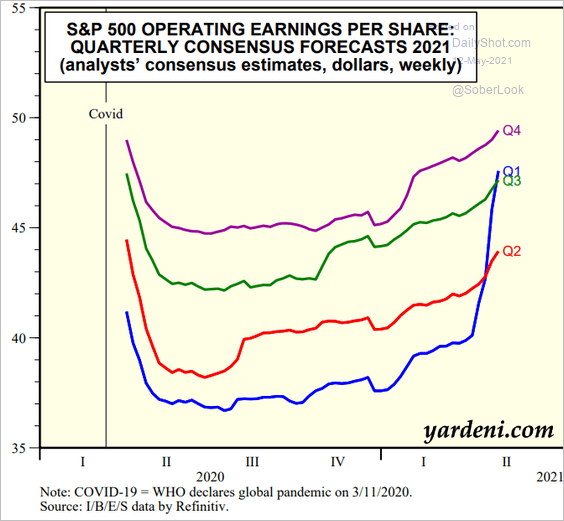 Source: Yardeni Research
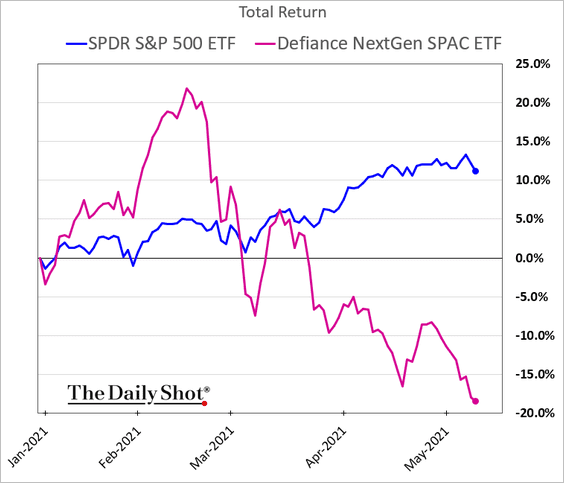
9. The SPAC market continues to struggle.
• Year-to-date performance:
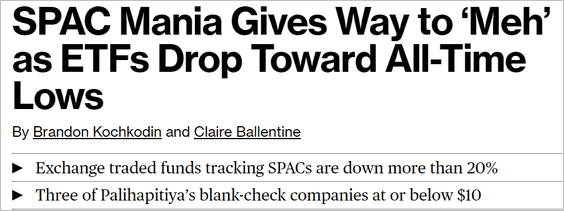 Source: Bloomberg Read full article
• New issues:
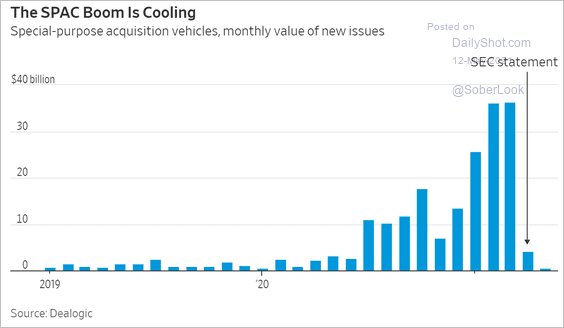 Source: @WSJ Read full article
——————–
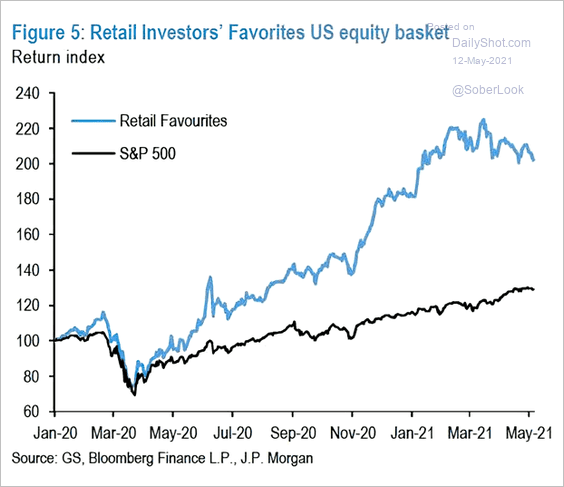
10. Retail favorites have been struggling lately but are still massively ahead of the S&P 500 since last year’s lows.
 Source: @ISABELNET_SA, @jpmorgan
Back to Index
Credit
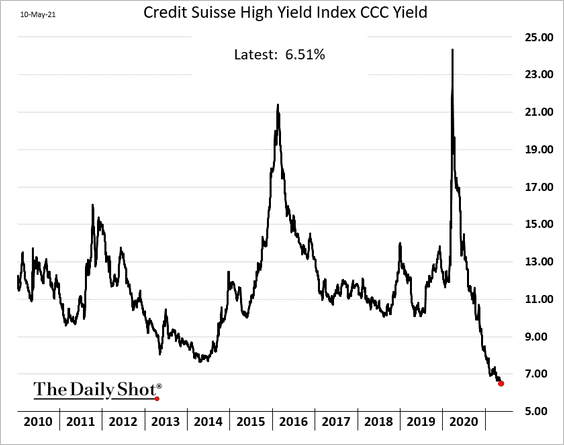
1. CCC-rated bond yields hit a new low.
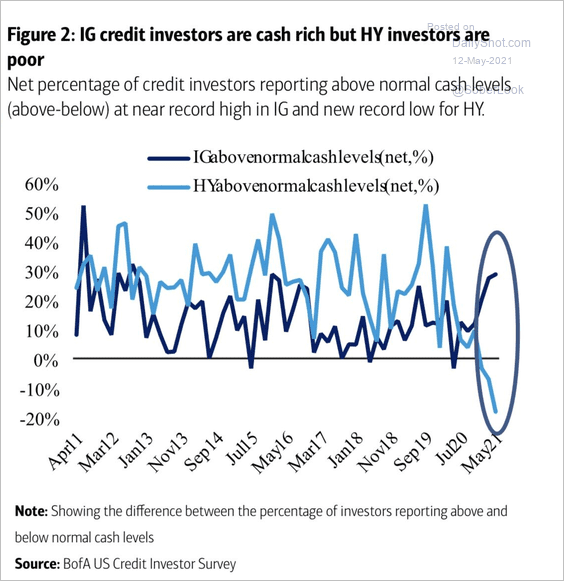
2. Investment-grade and high-yield borrowers’ cash positions have diverged.
 Source: BofA Global Research; h/t James W.
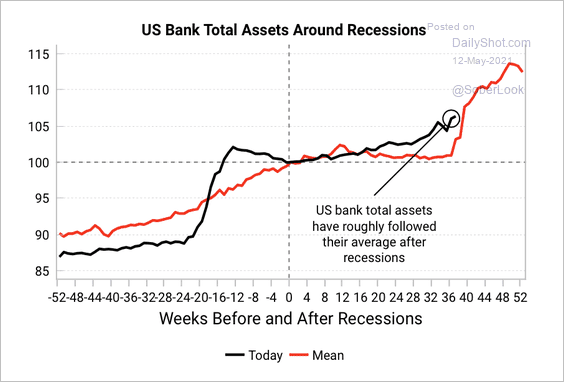
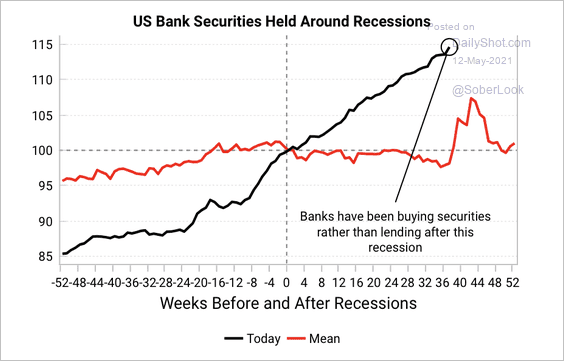
3. US banks have grown total assets through purchases of securities during the current recovery.
 Source: Variant Perception
 Source: Variant Perception
——————–
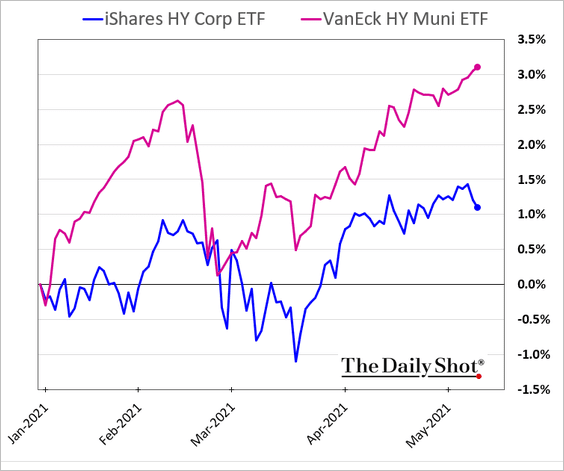
4. High-yield munis have outperformed high-yield corporates this year.
Back to Index
Global Developments
1. Container rates out of Shanghai are surging.
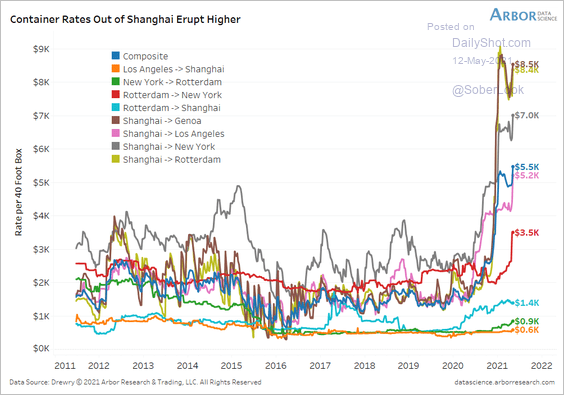 Source: Arbor Research & Trading
2. Next, we have some updates on auto production.
• Slower output:
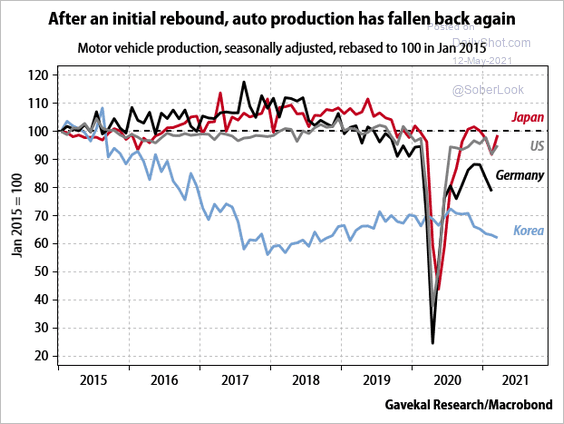 Source: Gavekal Research
• A forecast from Oxford Economics:
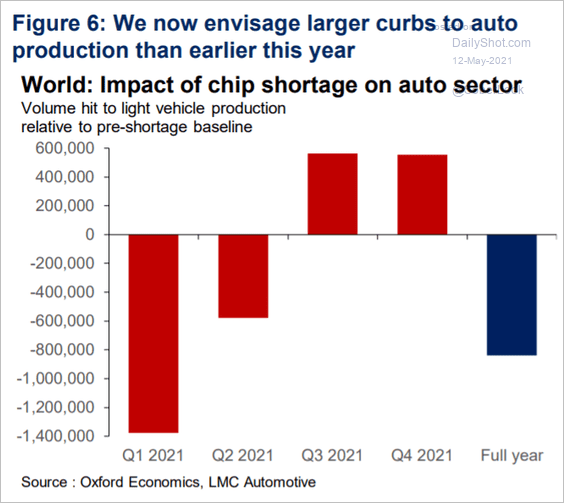 Source: Oxford Economics
• Sales vs. production:
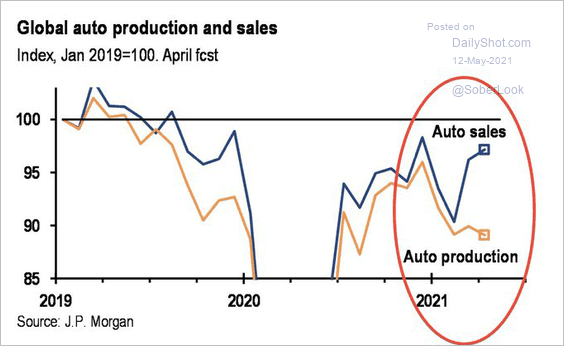 Source: JP Morgan; @carlquintanilla
——————–
3. Implied volatility is trending lower across major asset classes, although rates implied volatility remains elevated.
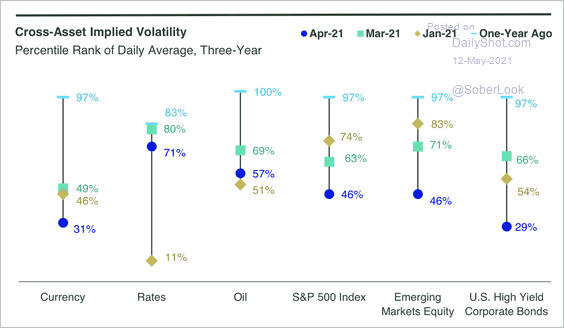 Source: SPDR Americas Research, @mattbartolini
——————–
Food for Thought
1. The role of governments in basic research:
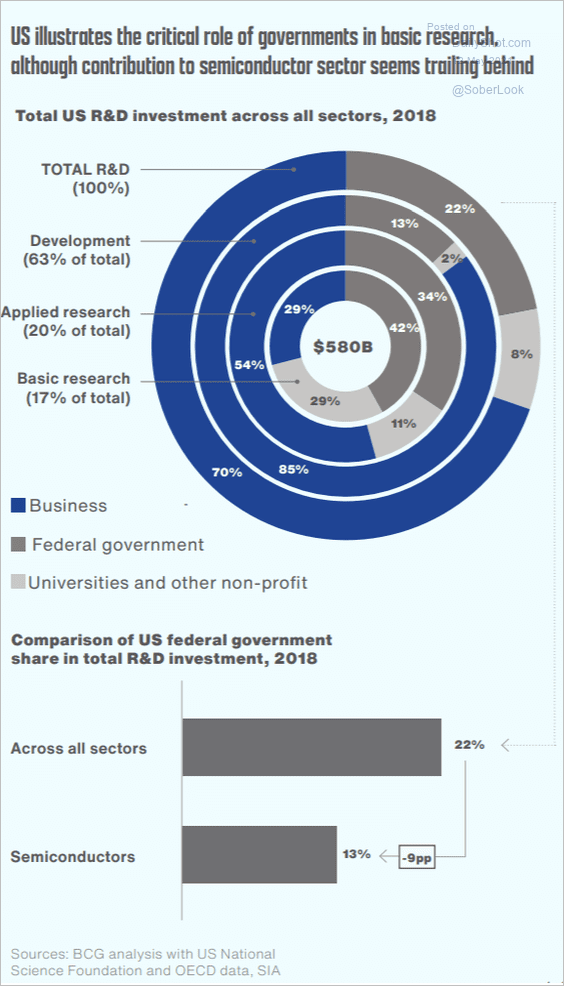 Source: BCG, SIA Read full article
2. Ransomware costs:
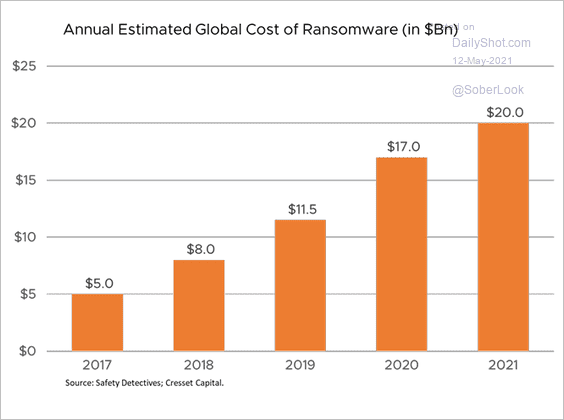 Source: Jack Ablin, Cresset Wealth Advisors
3. Content removed by Facebook:
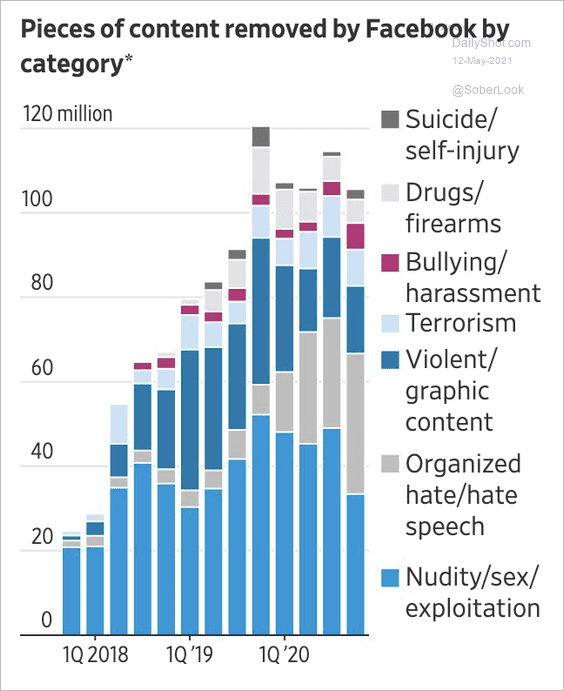 Source: The Washington Post Read full article
4. Shared personal data:
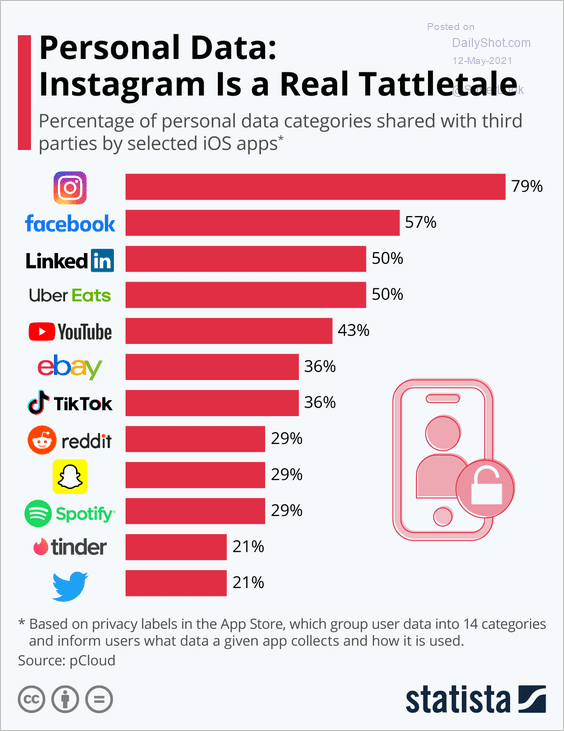 Source: Statista
5. Recorded music revenues:
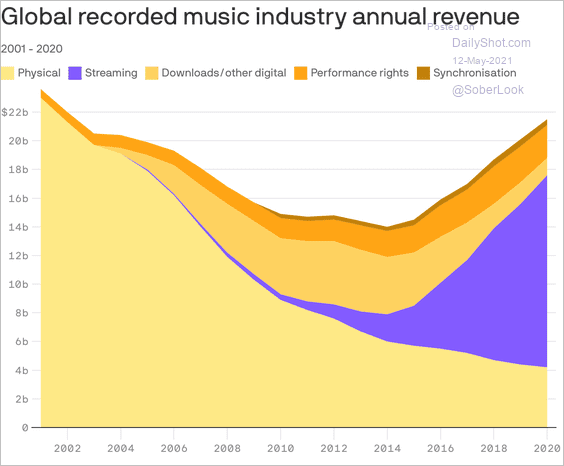 Source: @axios Read full article
6. Importance of religion in the US:
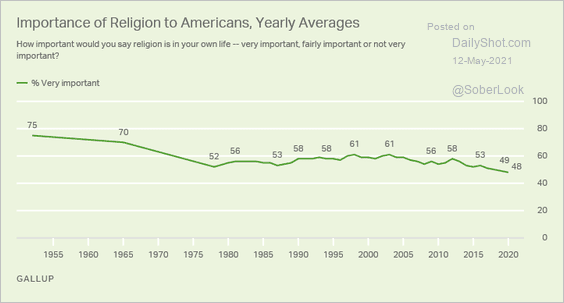 Source: Gallup Read full article
7. Views on voting policy changes (3 charts):
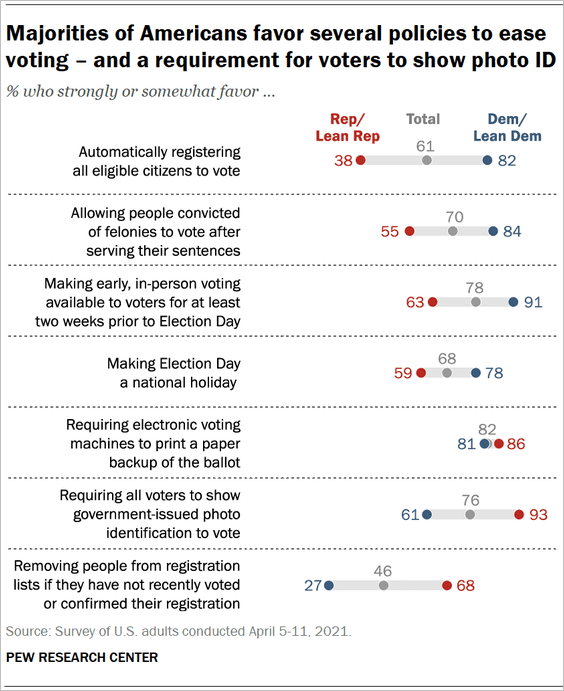 Source: Pew Research Center Read full article
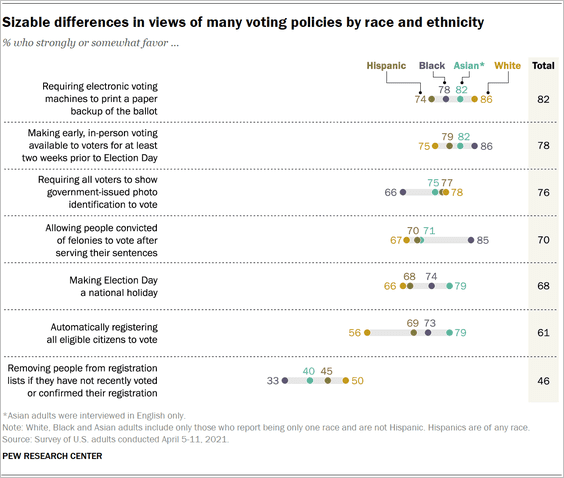 Source: Pew Research Center Read full article
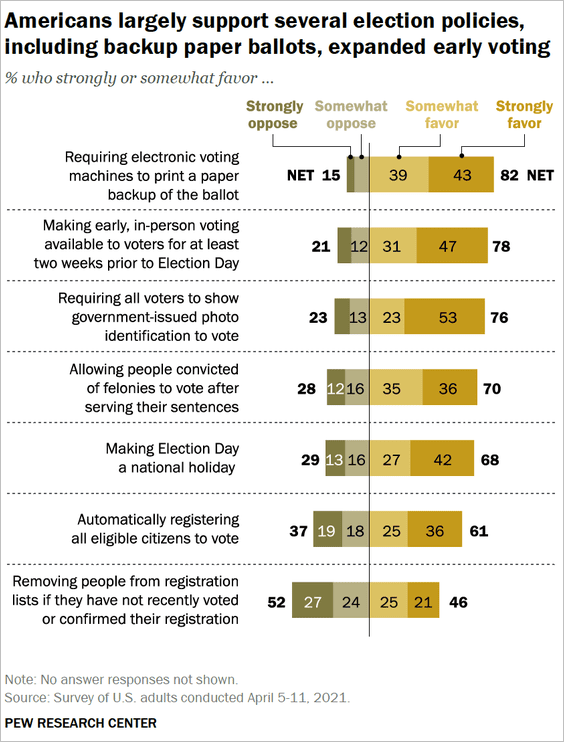 Source: Pew Research Center Read full article
——————–
8. Paying people to get vaccinated:
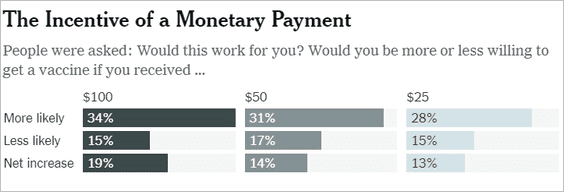 Source: The New York Times Read full article
9. Harry Potter characters with the most screen time:
 Source: @chartrdaily
——————–
Back to Index