
The Daily Shot: 21-Jun-21
• Rates
• Equities
• Commodities
• Cryptocurrency
• Emerging Markets
• China
• Asia – Pacific
• The Eurozone
• The United Kingdom
• The United States
• Global Developments
• Food for Thought
Rates
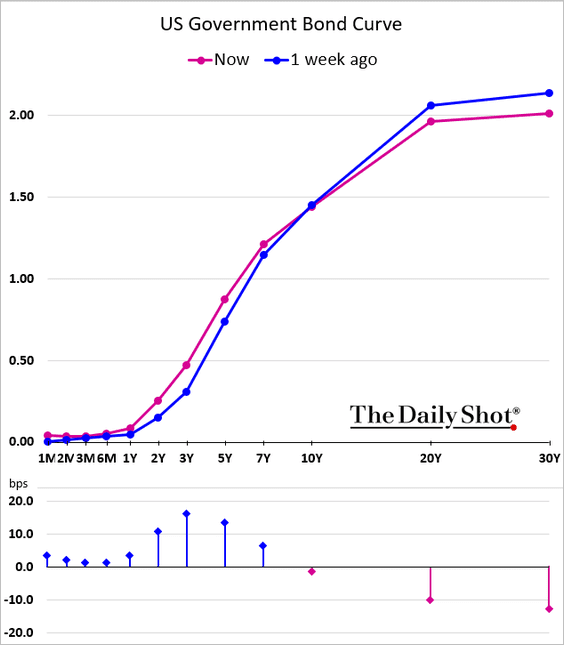
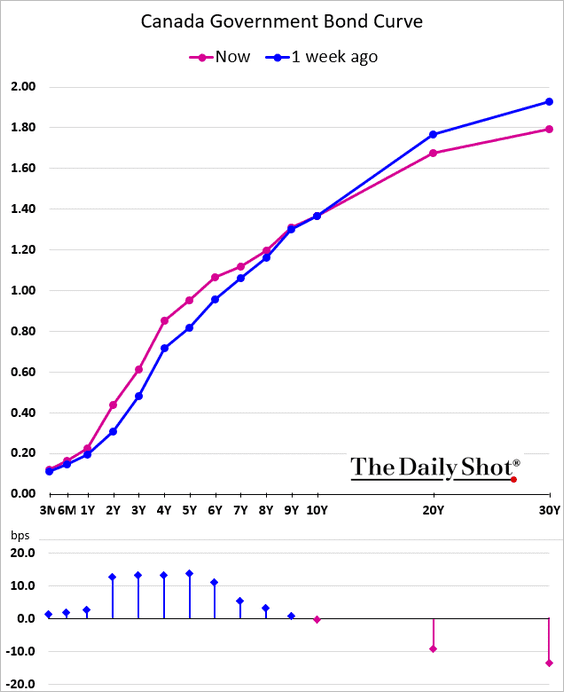
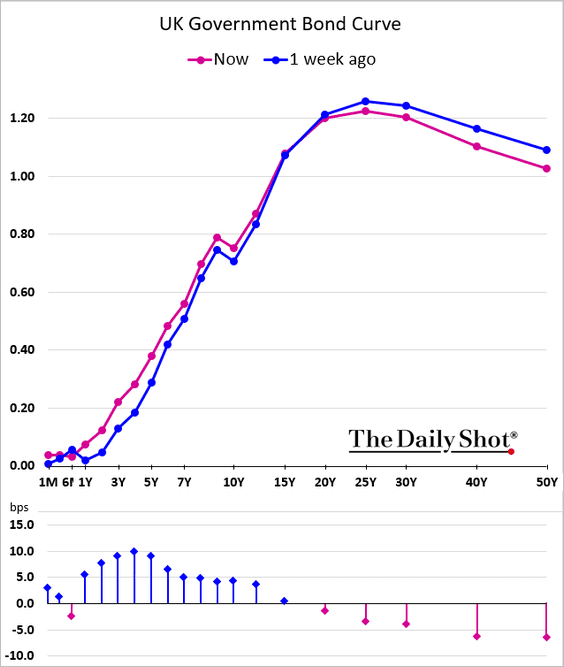
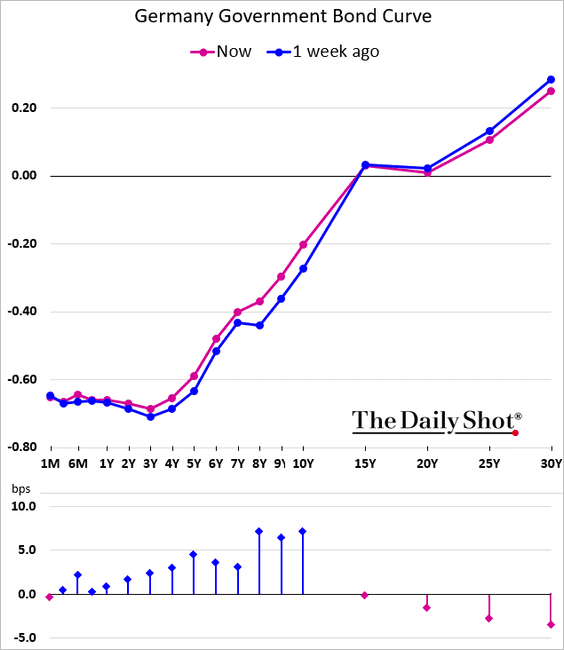
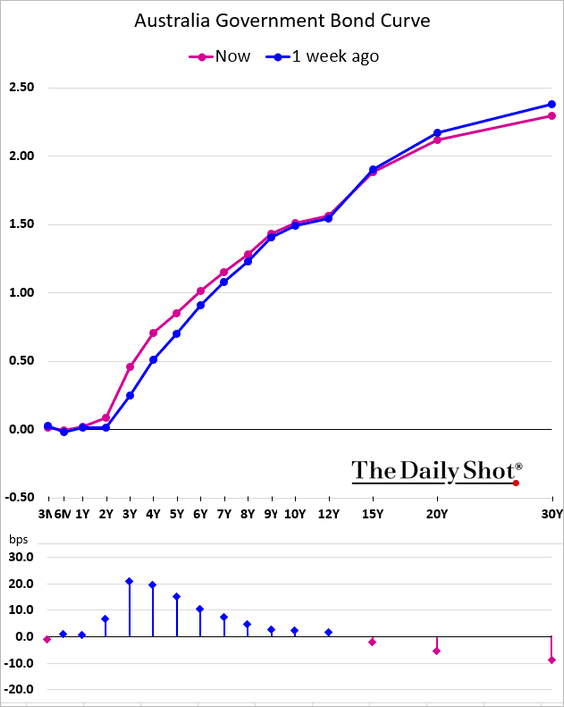
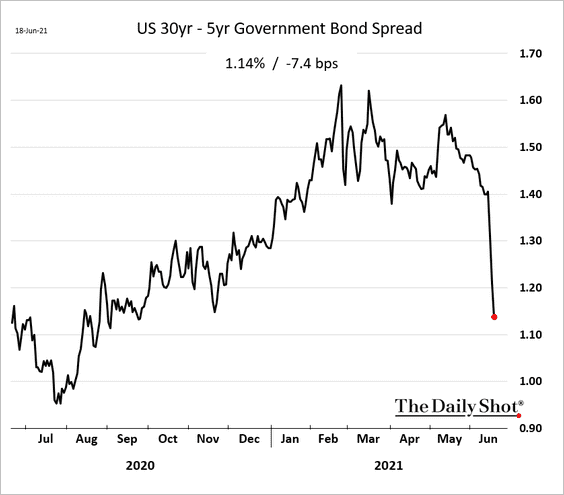
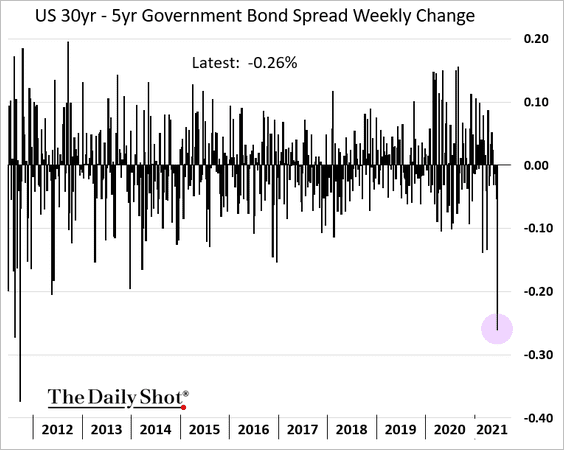
1. Yield curves continue to flatten globally since the Fed’s hawkish surprise last week.
• The US:
• Canada:
• The UK:
• Germany:
• Australia:
Last week’s tightening in the 30yr – 5yr Treasury spread was the fastest in years.
——————–
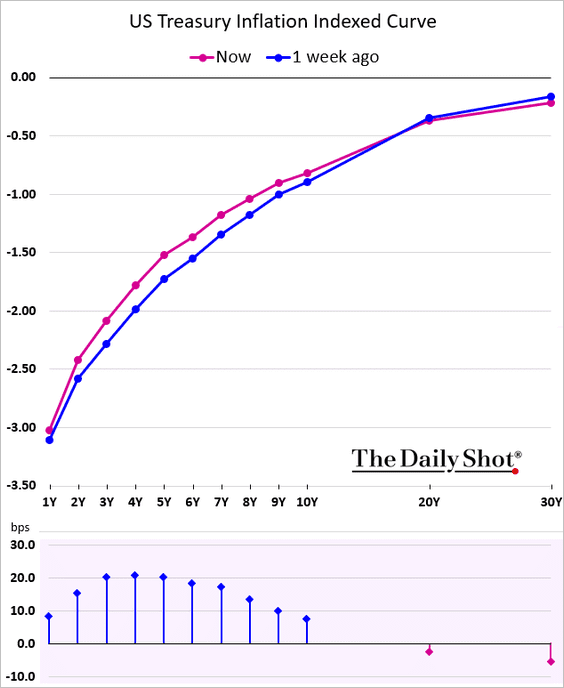
2. The inflation-linked Treasury curve (real rates) flattened as well.
3. On Friday, the Fed’s Bullard added to the central bank’s hawkish shift.
 Source: @WSJ Read full article
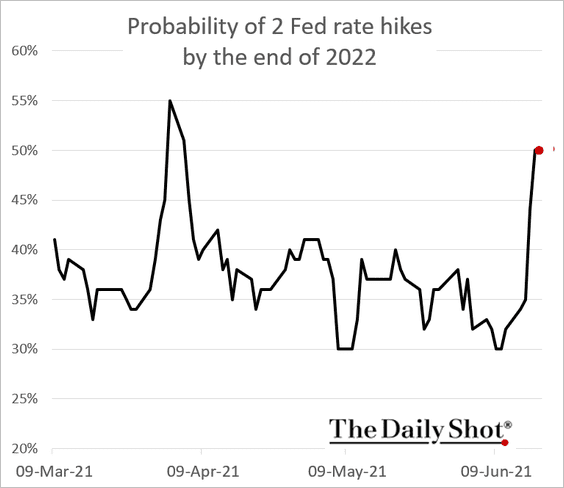
• The futures market now sees roughly even odds of two rate hikes next year.
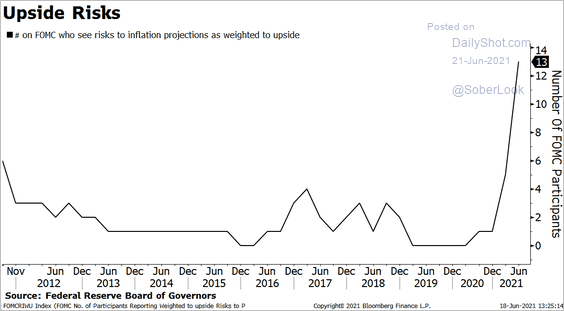
• More FOMC members see inflation risk being to the upside.
 Source: @boes_, @BloombergTV
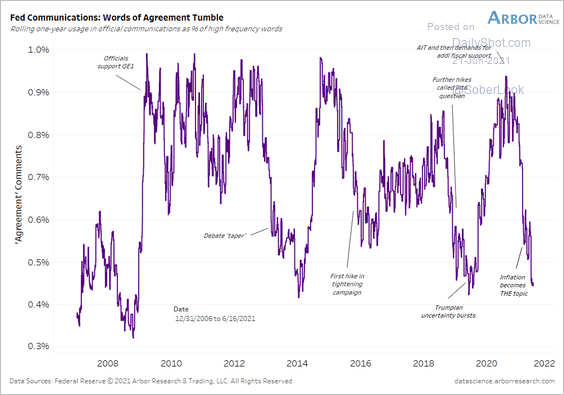
• However, there is now much less agreement among Fed officials.
 Source: Arbor Research & Trading
——————–
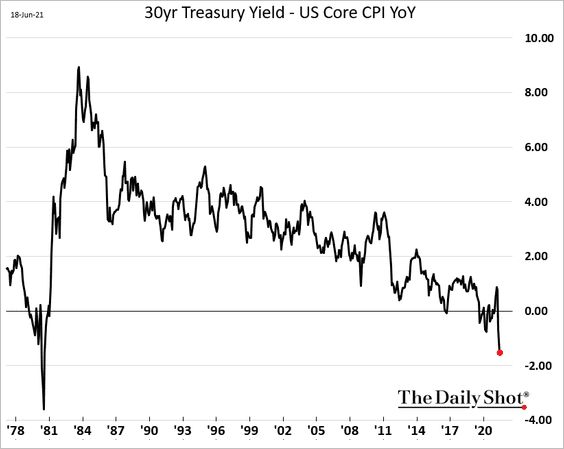
4. Below is the 30yr yield less the core CPI.
And here is the historical relationship between the CPI and Treasury yields during different periods.
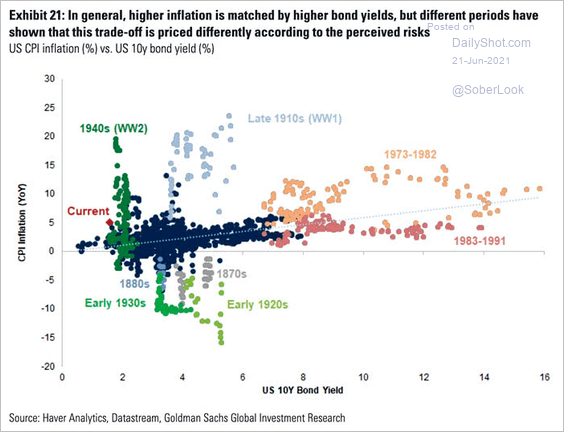 Source: @ISABELNET_SA, @GoldmanSachs
——————–
5. The 30-year Treasury yield is back at 2%.
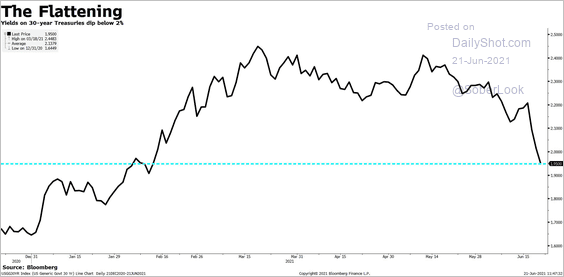 Source: @tracyalloway, @StephenSpratt Read full article
But many analysts caution that this rally in longer-dated debt could be temporary. The US Treasury has been pulling cash out of its account at the Fed, which allowed it to issue less debt. But that liquidity supply will be depleted later this year.
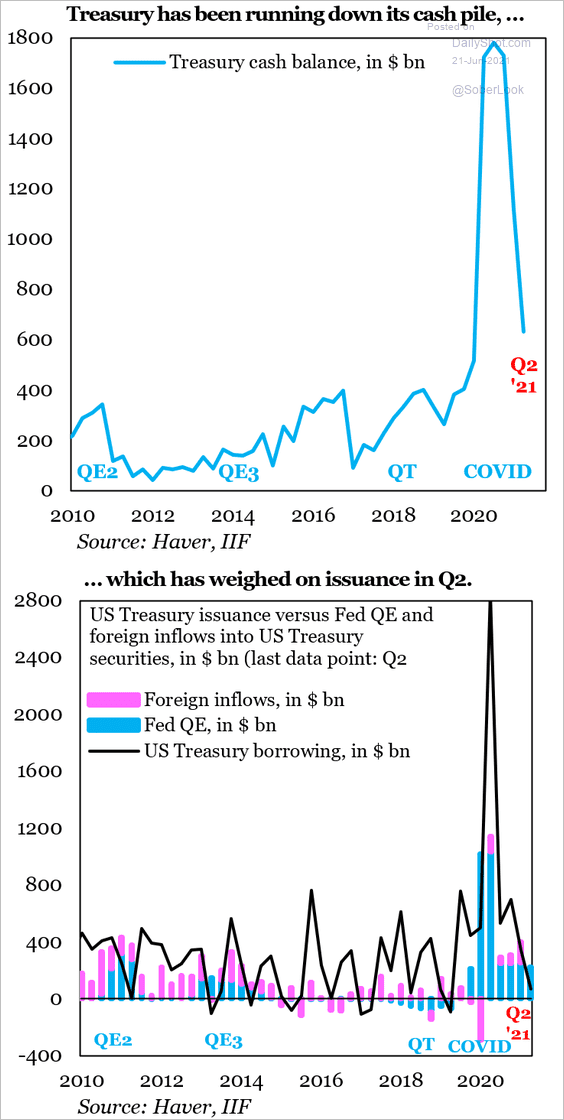 Source: @IIF Read full article
——————–
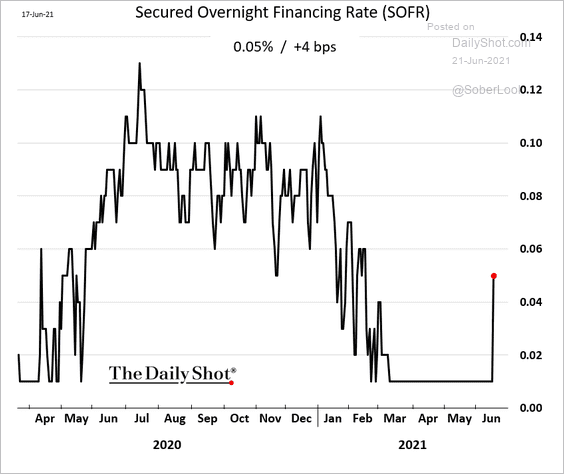
6. The Fed’s rate “tweak” (#3 here) gave SOFR a bit of a boost. Without this adjustment, there was a risk of SOFR going to zero or even below – an uncomfortable outcome for an index meant to replace LIBOR.
Back to Index
Equities
1. The tech mega-caps’ divergence from the rest of the market continues.
The FANG+ index is still near record highs.
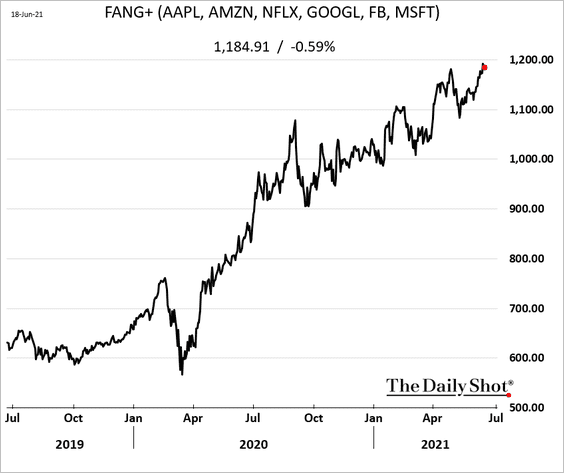
Here is the tech sector’s relative performance over the past month.
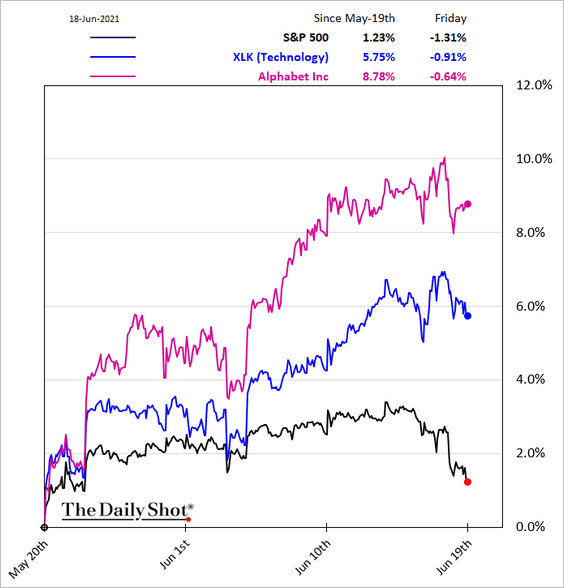
But FANG+ gains have been uneven this year.
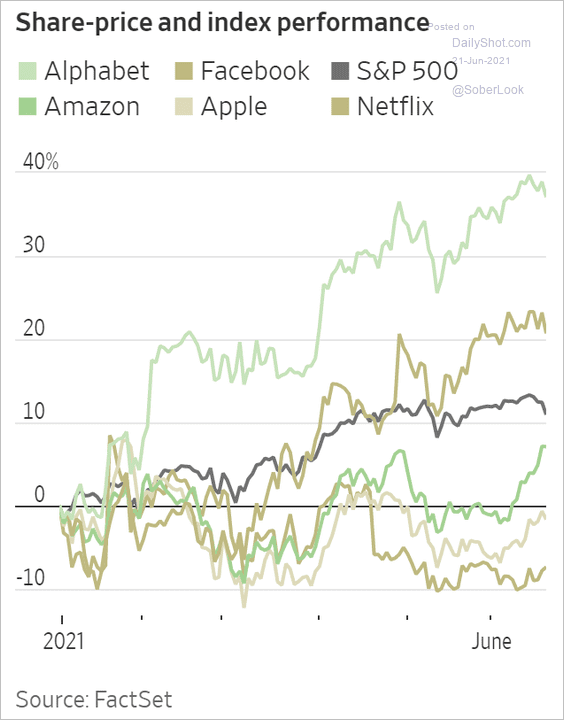 Source: @WSJ Read full article
——————–
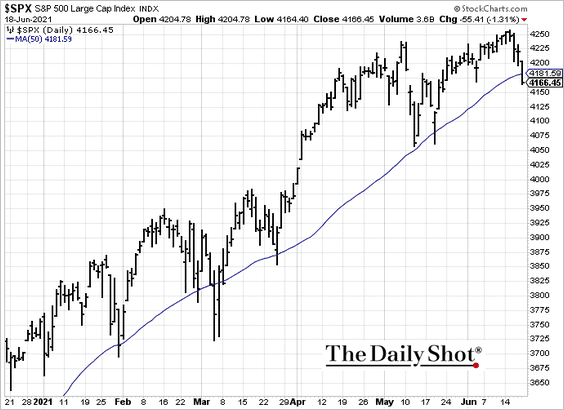
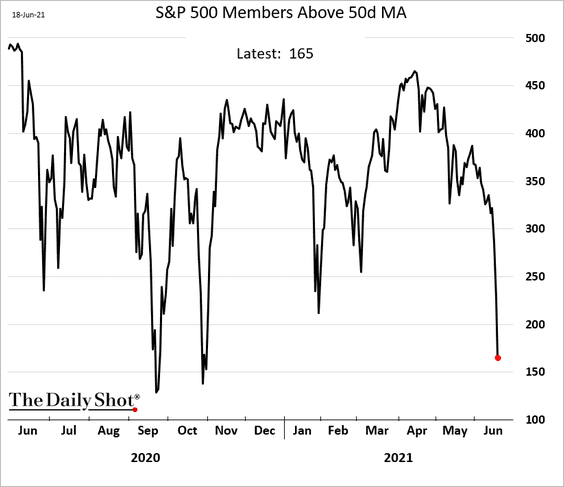
2. The S&P 500 dipped below its 50-day moving average.
The percentage of S&P 500 members above their 50-day moving average tumbled last week.
Here is the percentage of S&P 500 stocks at 1-month lows, with the S&P 500 within 1% of its 52-week high.
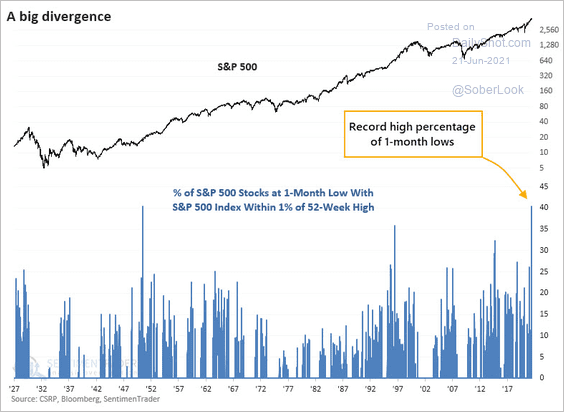 Source: @sentimentrader
——————–
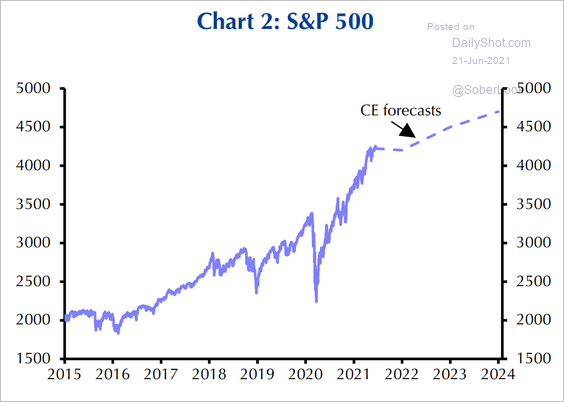
3. Capital Economics expects the S&P 500 rally to pause, resuming in 2022.
 Source: Capital Economics
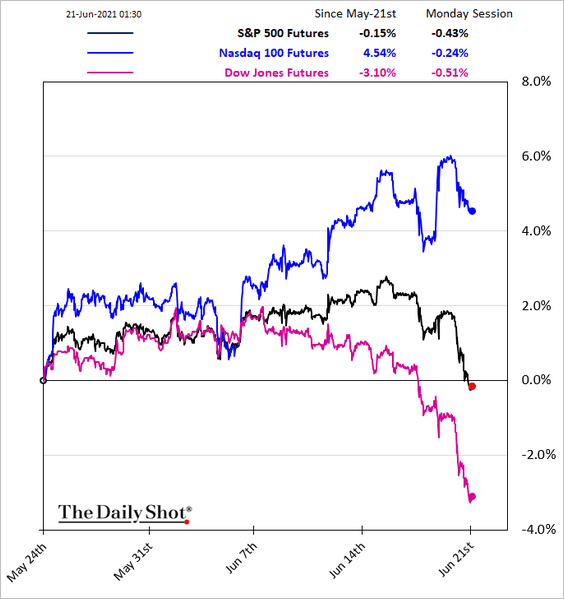
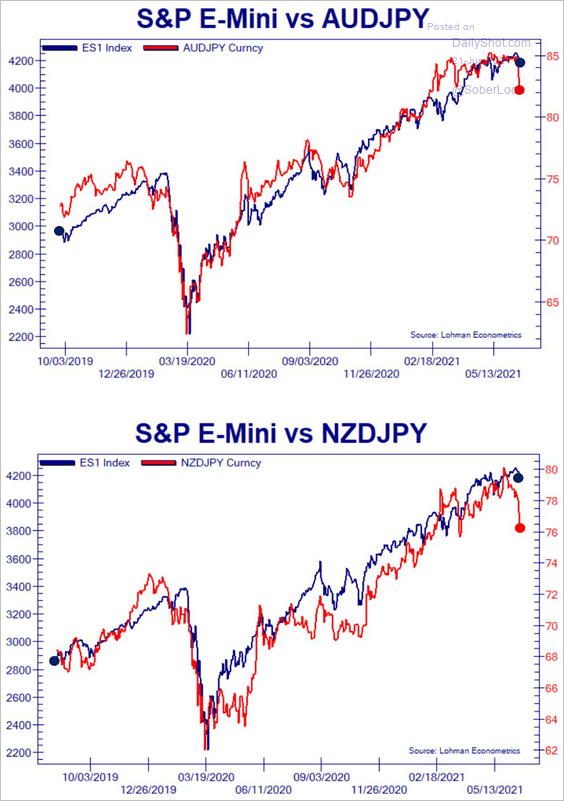
4. The S&P 500 futures have lagged the declines in AUD/JPY and NZD/JPY.
 Source: @Not_Jim_Cramer
These currency pairs are a proxy for global risk appetite and tend to be correlated to equity markets.
 Source: Capital Economics
——————–
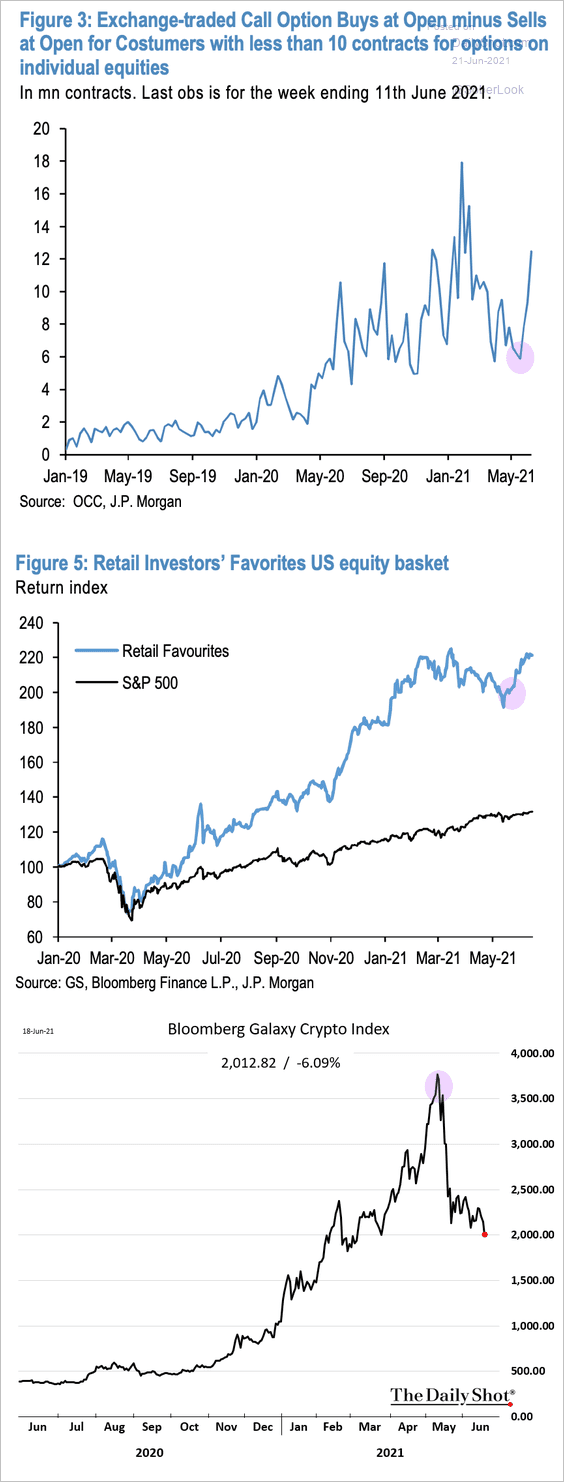
5. Retail investors re-engaged in equities around mid-May when crypto markets came under pressure.
 Source: JP Morgan; @SamRo
Overall, they have been very active this year.
 Source: @WSJ Read full article
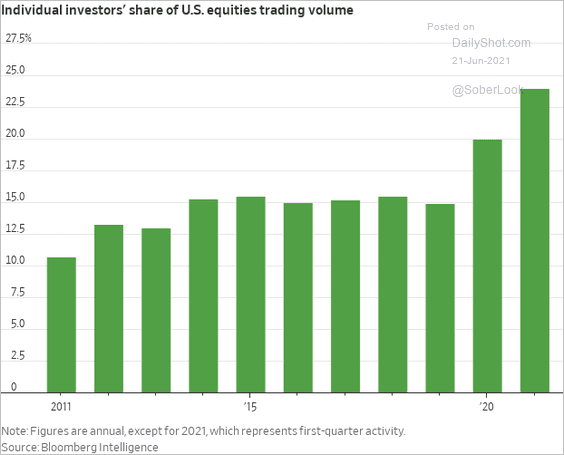
When it comes to the stock market, US households are all-in.
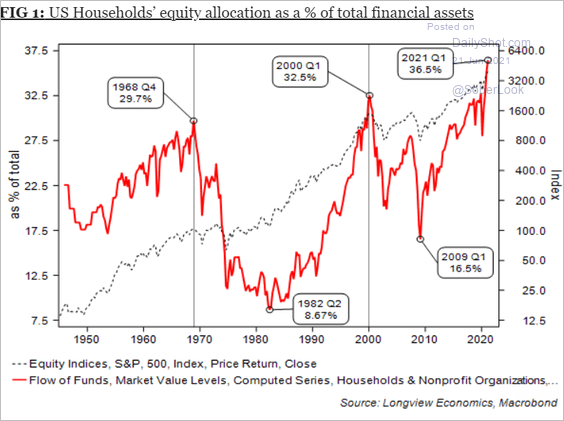 Source: Longview Economics
——————–
6. Fund managers (chart below) and active investment managers (2nd chart) are running substantial equity exposure.
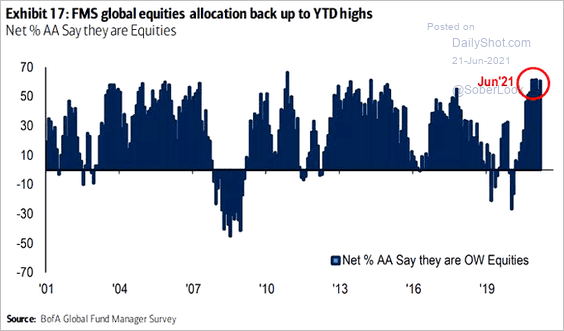 Source: @ISABELNET_SA, @BofAML
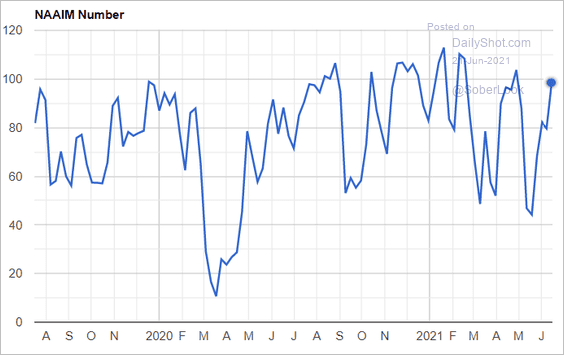 Source: NAAIM
——————–
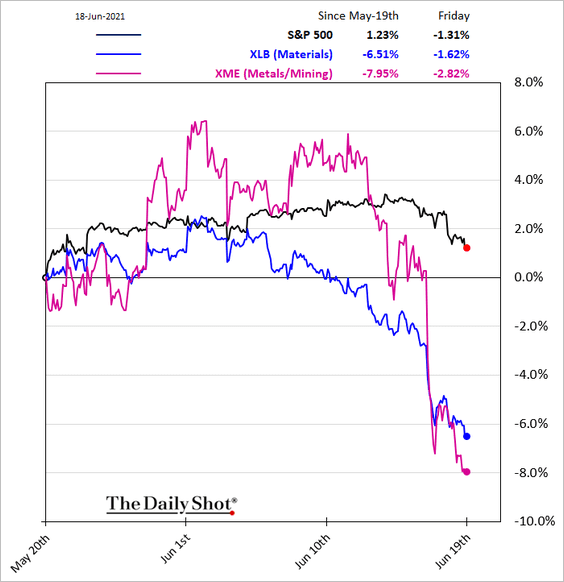
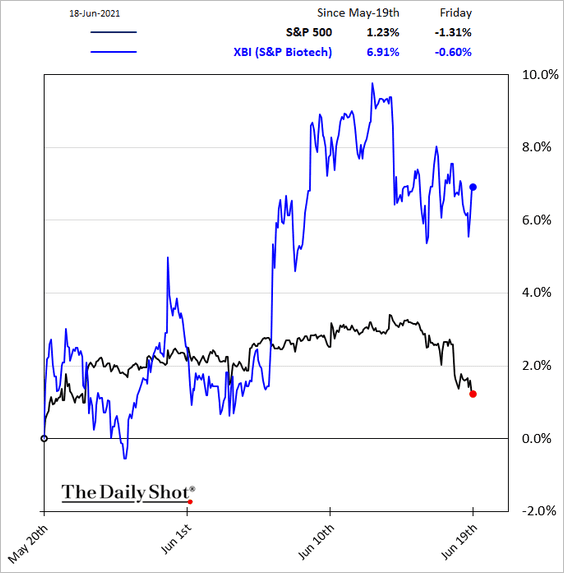
7. Next, we have some sector trends over the past month.
• Industrials and transportation:
![]()
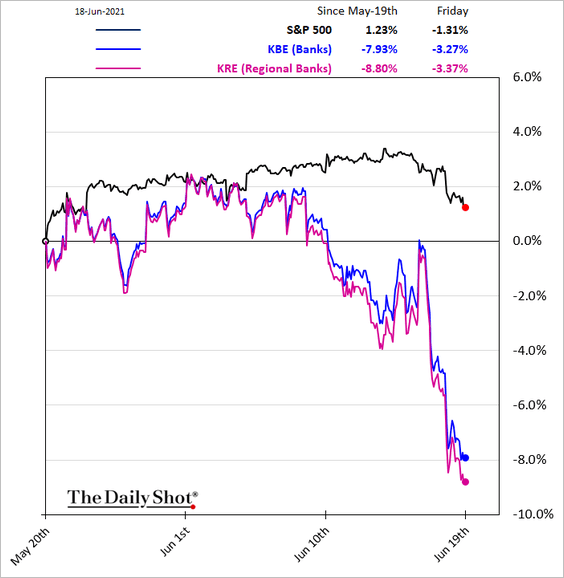
• Banks:
• Metals/Mining and Materials:
• Biotech:
——————–
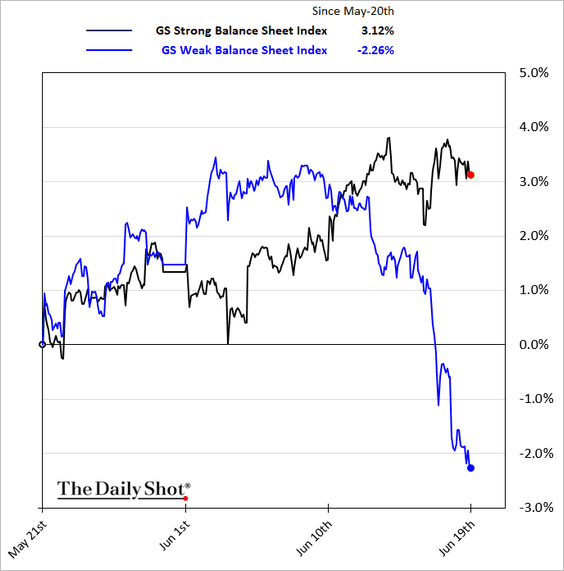
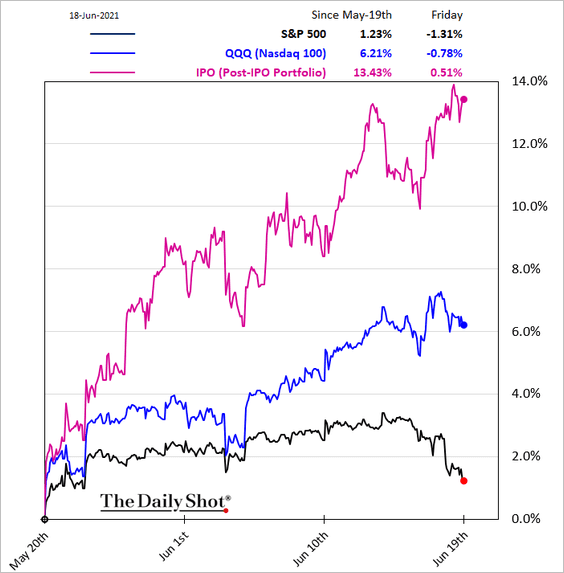
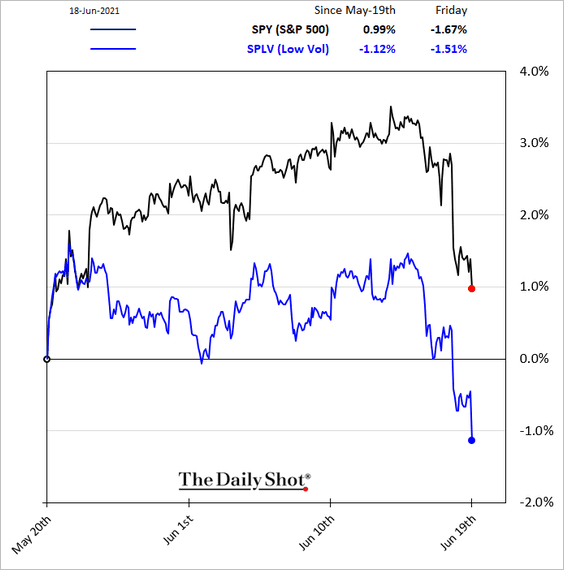
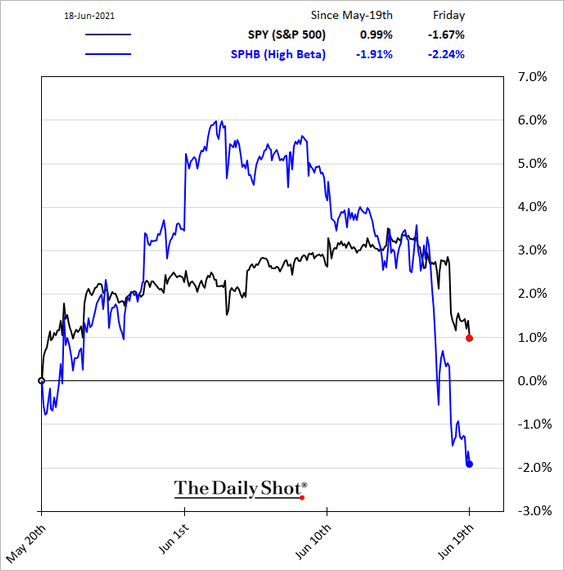
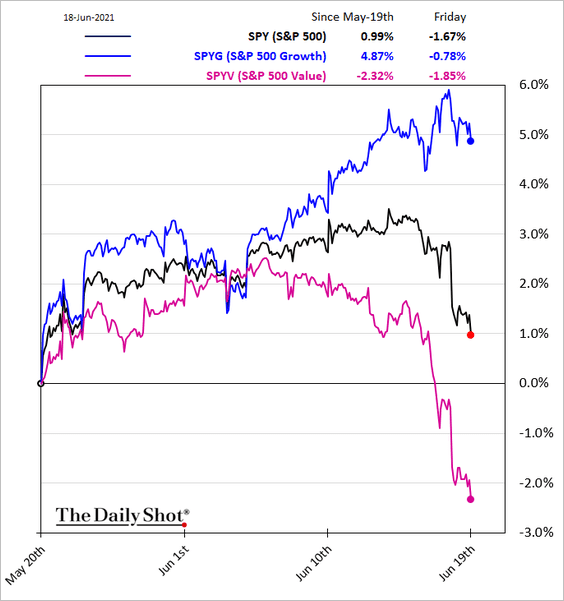
8. Finally, let’s take a look at some factor/style trends over the past month.
• Weak vs. strong balance sheets:
• Post-IPO stocks (boosted by falling longer-term Treasury yields):
• Low-vol:
• High-beta:
• Growth vs. value (2 charts):
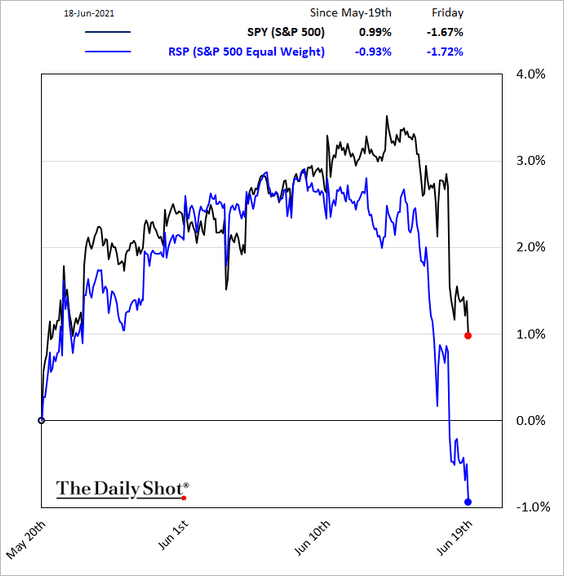
• Equal-weight S&P 500:
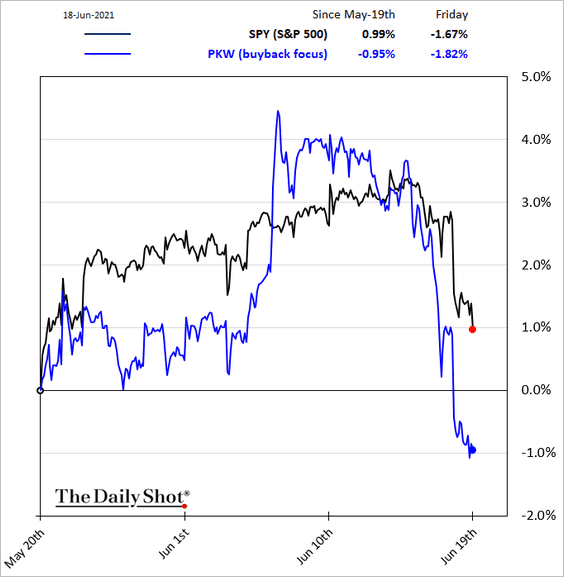
• Companies known for share buybacks:
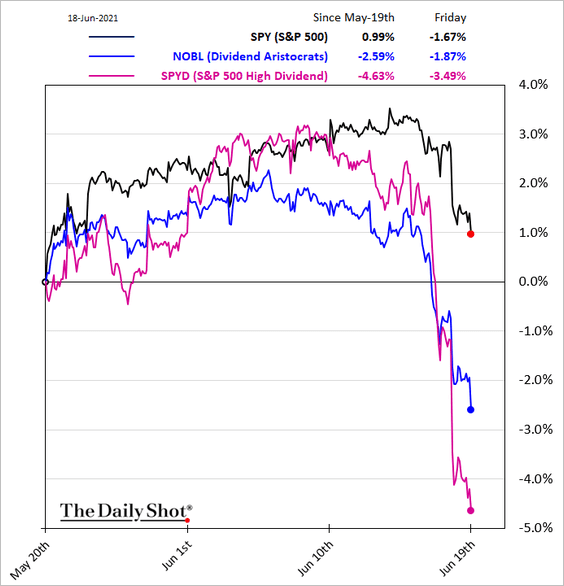
• High-dividend stocks:
Back to Index
Commodities
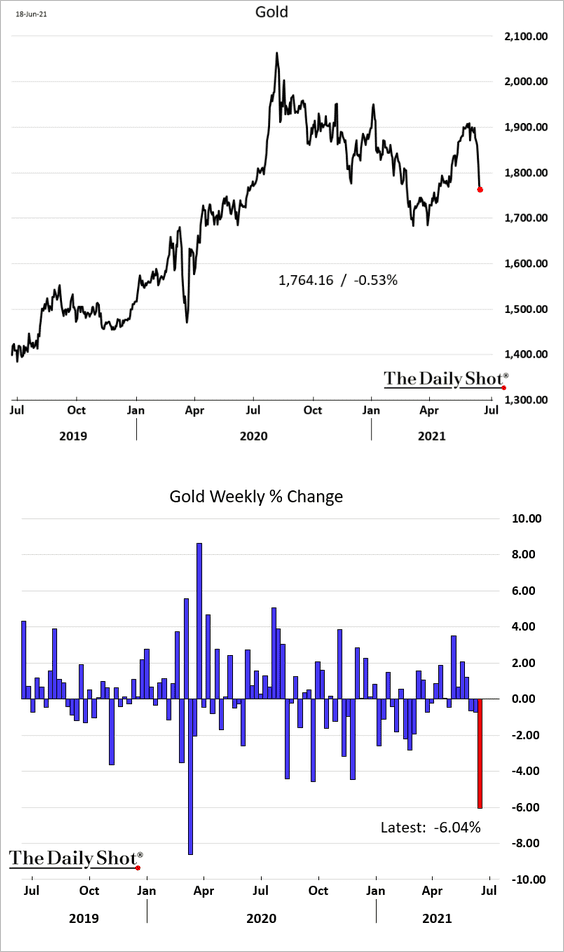
1. It was a tough week for gold, as the dollar rallied.
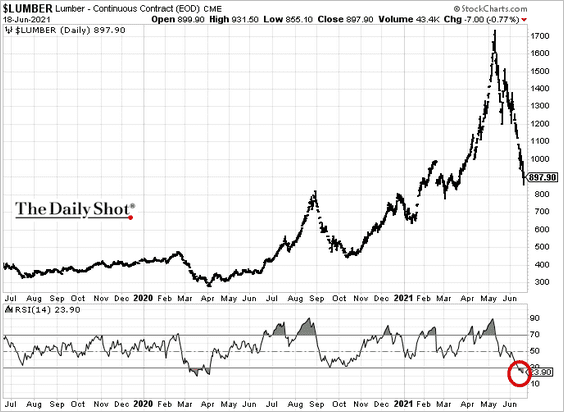
2. US limber futures are in oversold territory.
3. Fitch Solutions has made upward revisions to its steel and nickel price forecasts, while cocoa was revised down due to a slow demand recovery from the pandemic.
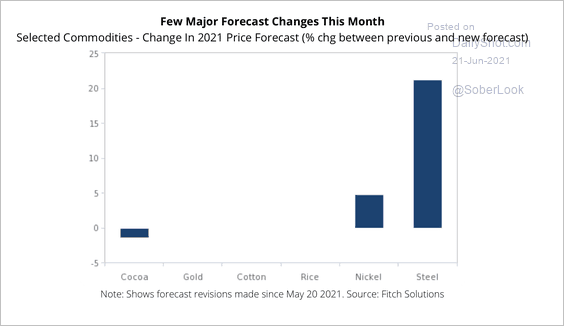 Source: Fitch Solutions Macro Research
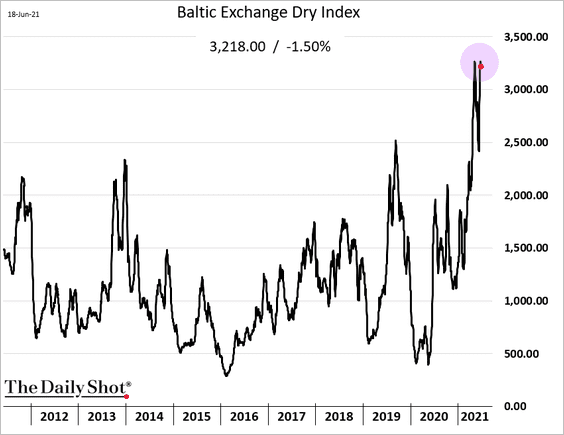
4. Dry bulk shipping costs remain near multi-year highs.
Back to Index
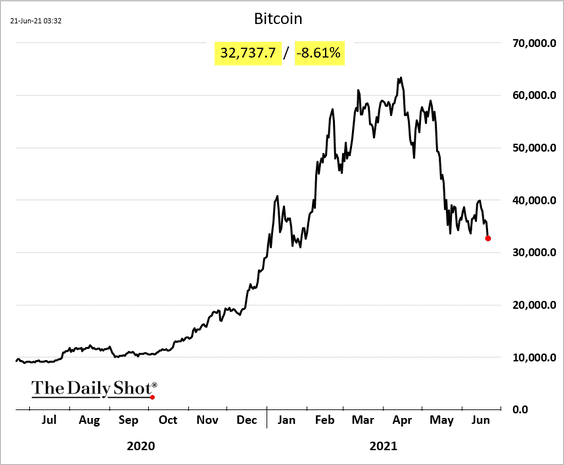
Cryptocurrency
1. Beijing continues to pressure the nation’s bitcoin miners, who boosted domestic coal prices this year.
 Source: @markets Read full article
The total hash rate continues to fall.
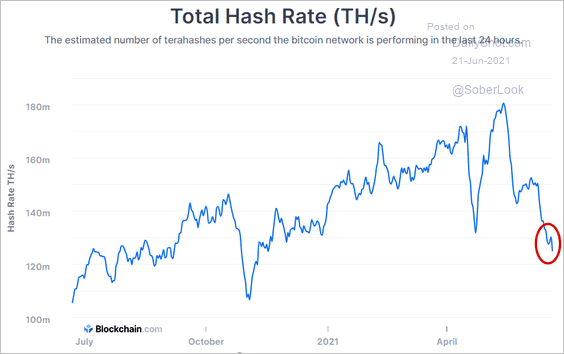 Source: Blockchain.com
Bitcoin is trading below $33k.
——————–
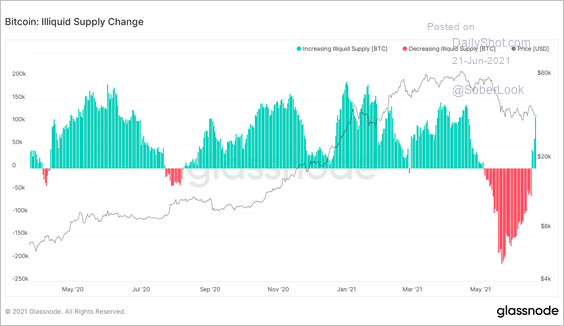
2. Bitcoin illiquid supply has been rising (tokens not available for trading).
 Source: Glassnode; @WClementeIII
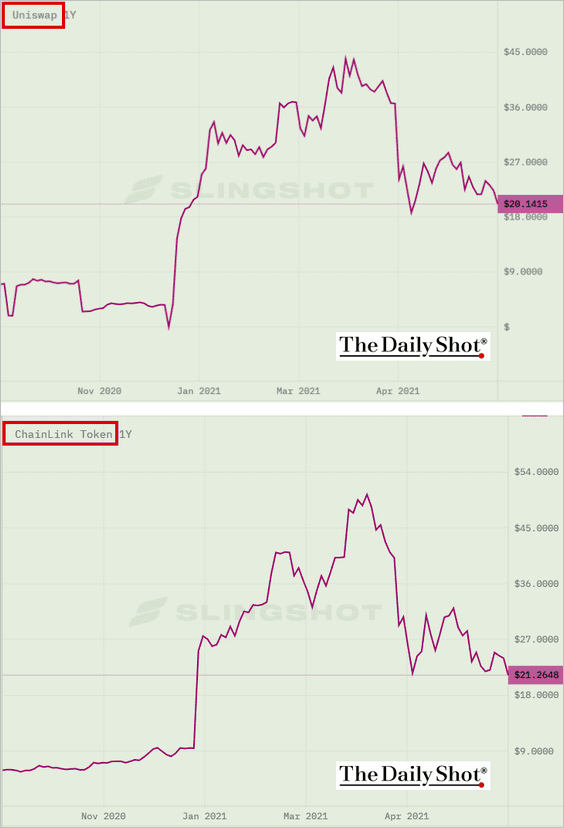
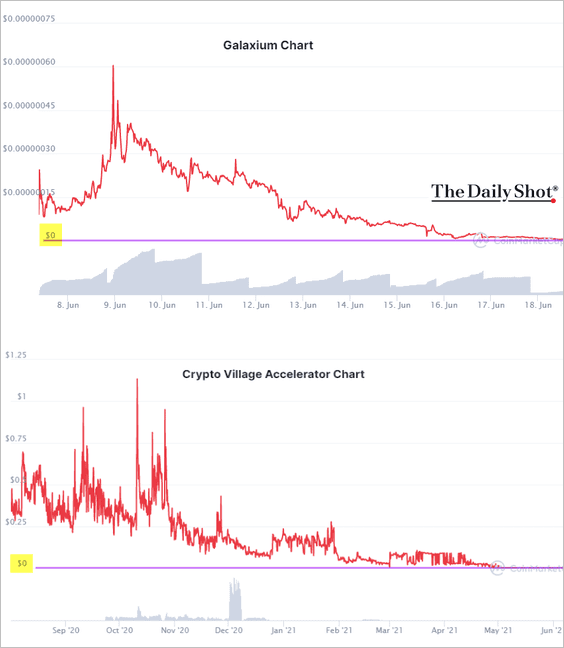
3. DeFi tokens came under pressure in recent days.
 Source: @markets Read full article
 Source: CoinMarketCap Read full article
 Source: CoinDesk Read full article
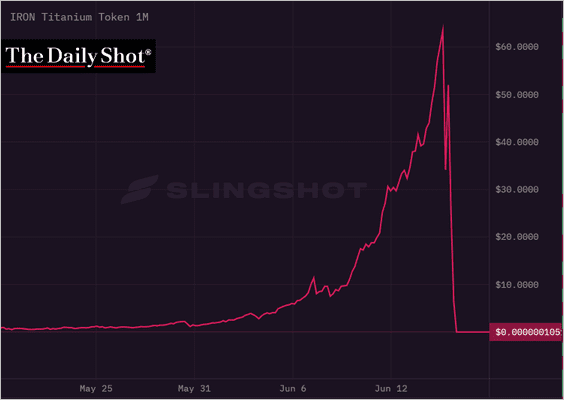 Source: slingshot.finance
——————–
4. Many fund managers still see bitcoin as a bubble.
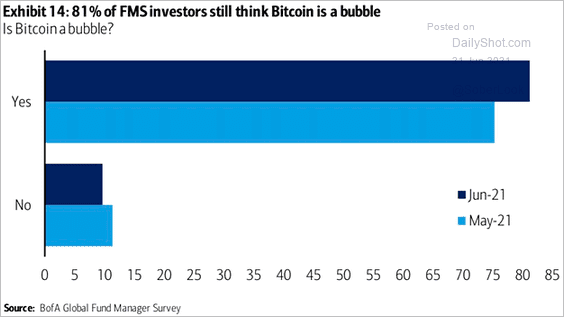 Source: @ISABELNET_SA, @BofAML
Back to Index
Emerging Markets
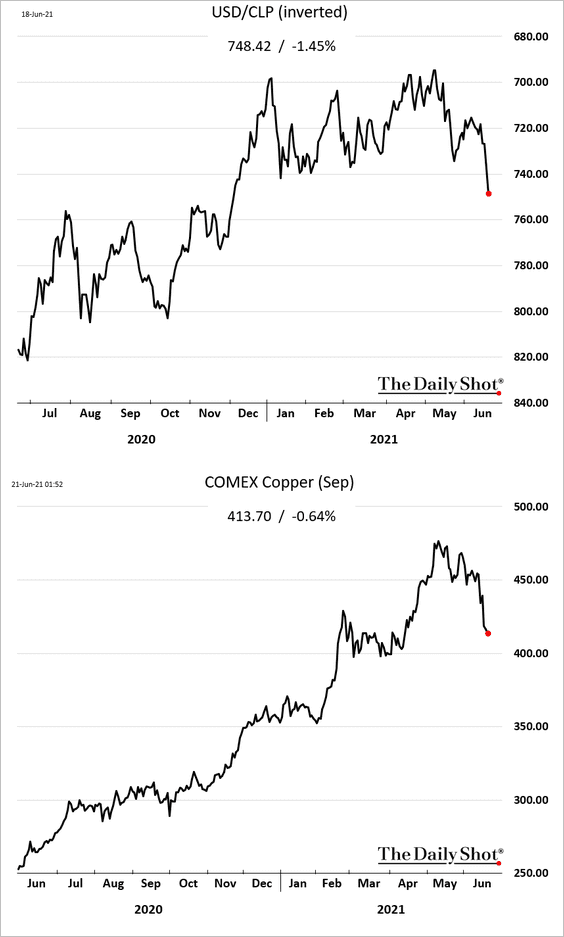
1. The Chilean peso continues to retreat as copper weakens.
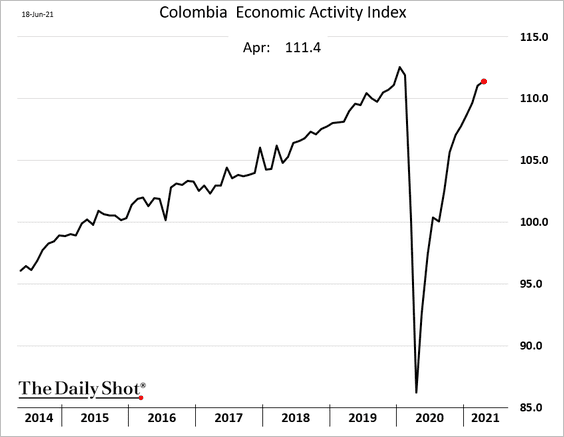
2. Colombia’s economy had almost fully recovered in April.
3. Argentina’s F/X reserves are rebounding, boosted by soybean sales (at high prices).
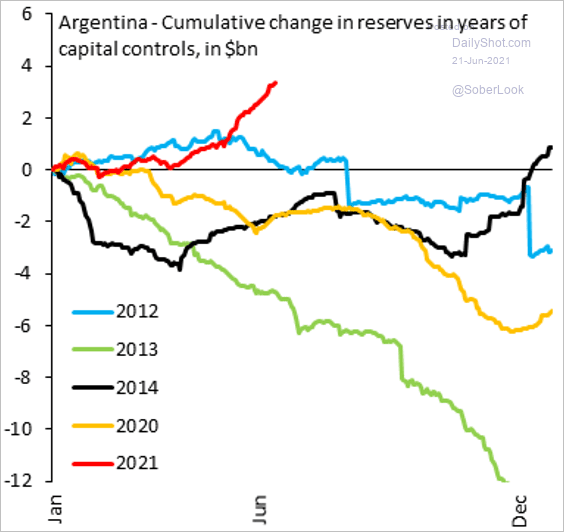 Source: @SergiLanauIIF
4. When it comes to new COVID cases, South America stands out.
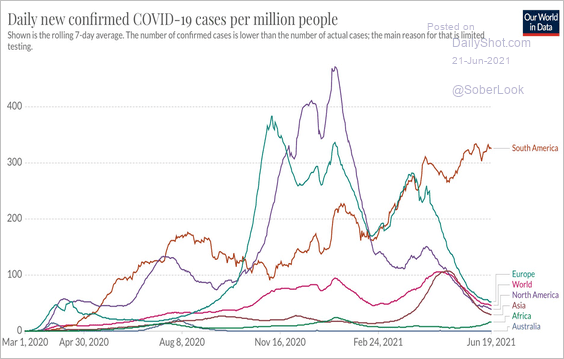 Source: @EricTopol, @OurWorldInData
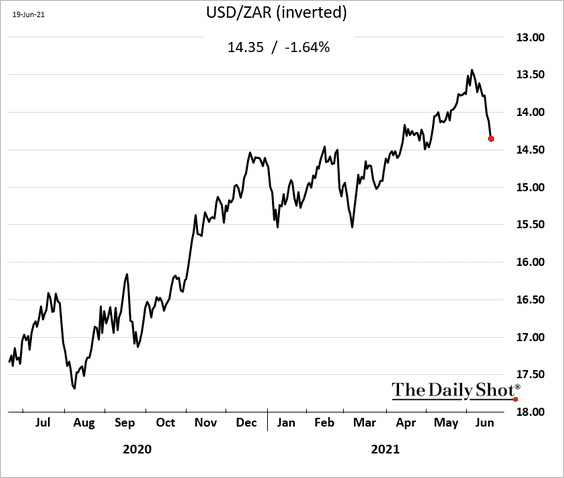
5. The South African rand keeps moving lower.
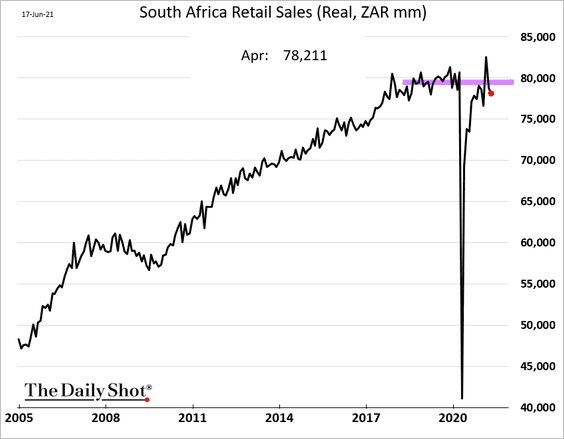
South Africa’s retail sales were back below pre-COVID levels in April.
——————–
6. How do the recent currency moves compare to the 2013 taper tantrum?
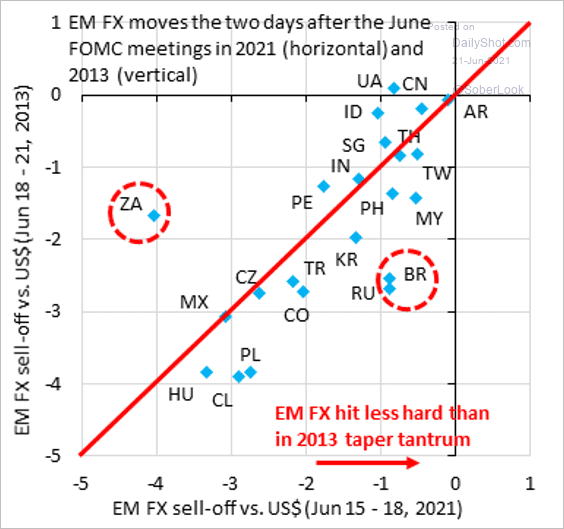 Source: @RobinBrooksIIF
Back to Index
China
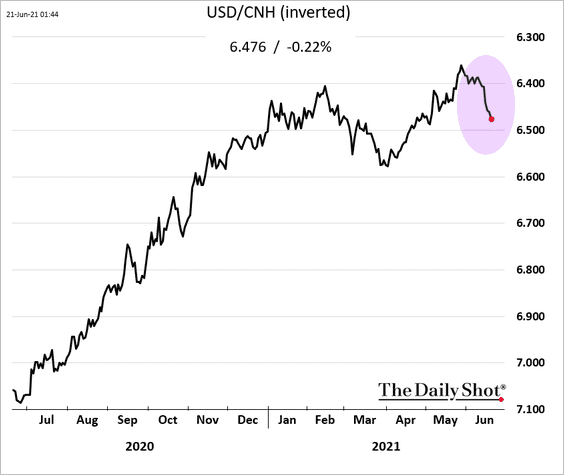
1. The renminbi has been weakening (vs. USD) since the Fed’s hawkish shift last week.
2. The spread between the cost of borrowing and expected return on investment has widened substantially.
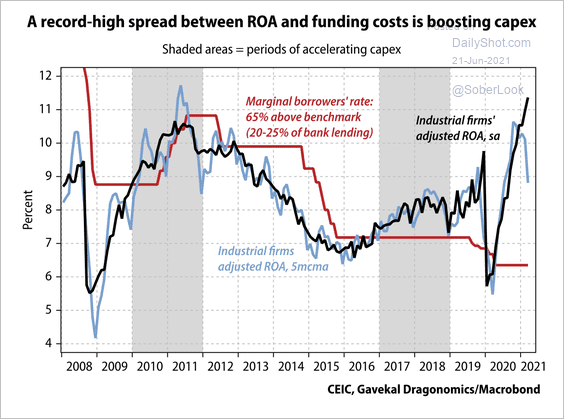 Source: Gavekal Research
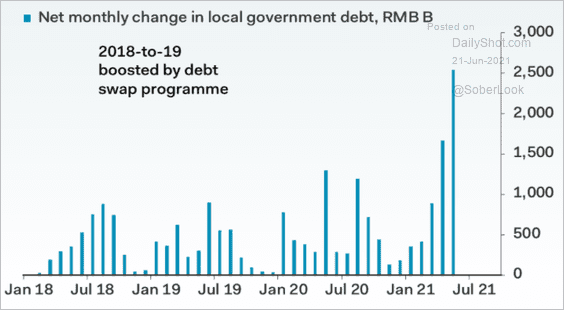
3. Local government debt growth has been robust.
 Source: Pantheon Macroeconomics
4. Imports have accelerated over the past year.
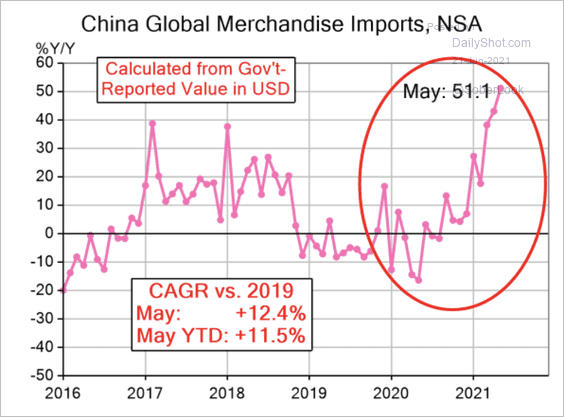 Source: Evercore ISI
Back to Index
Asia – Pacific
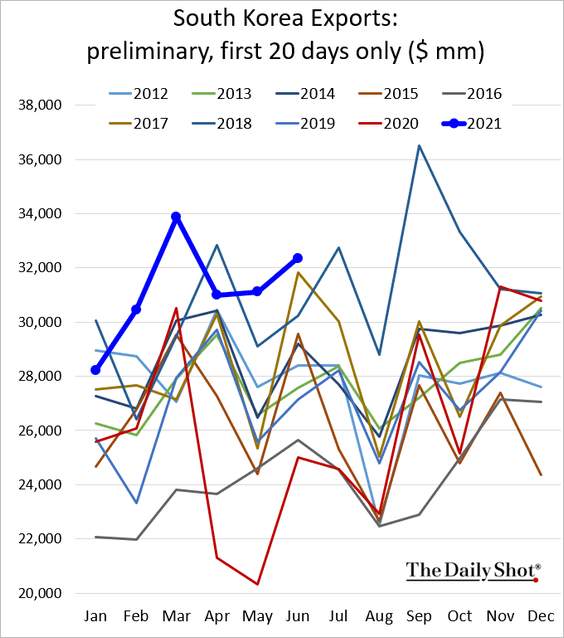
1. South Korean exports remain strong.
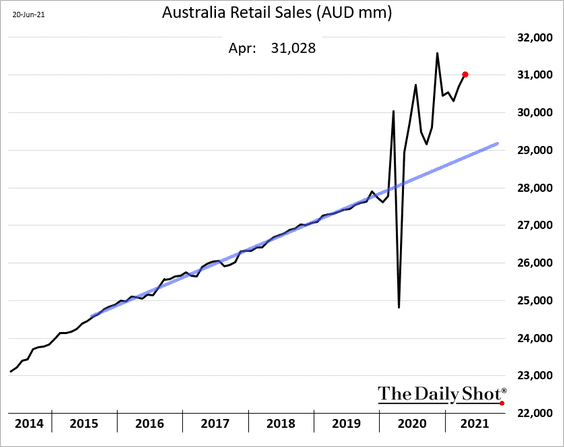
2. Australian retail sales are well above the pre-COVID trend.
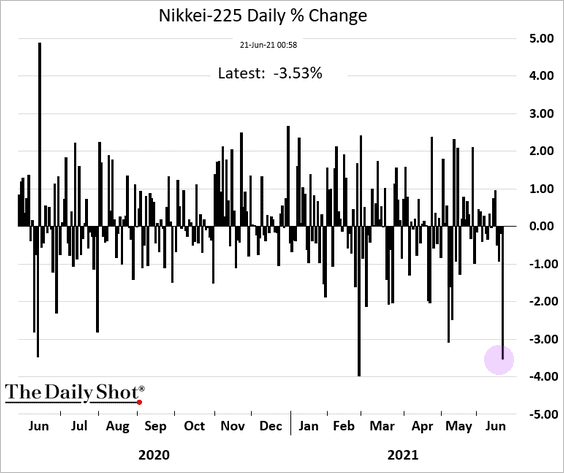
4. The Nikkei-225 took a hit today.
5. The BoJ’s QE has been slowing (stealth tightening).
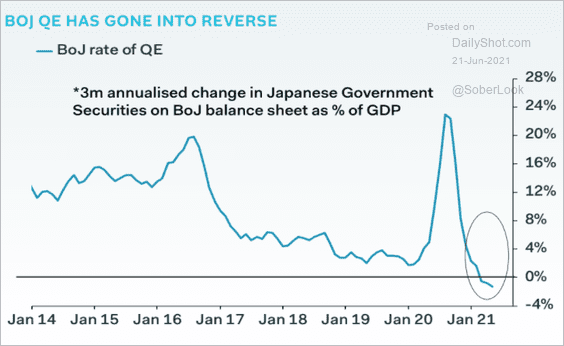 Source: Pantheon Macroeconomics
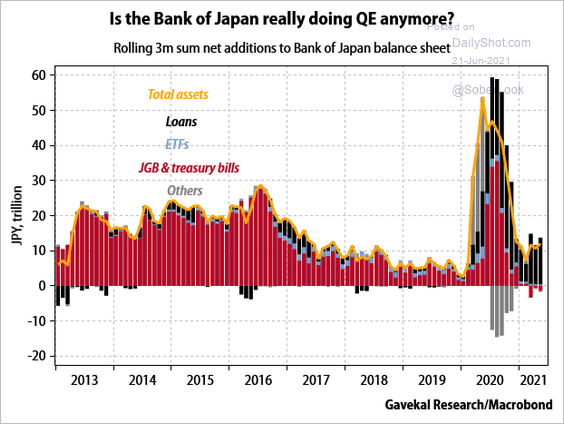 Source: Gavekal Research
Back to Index
The Eurozone
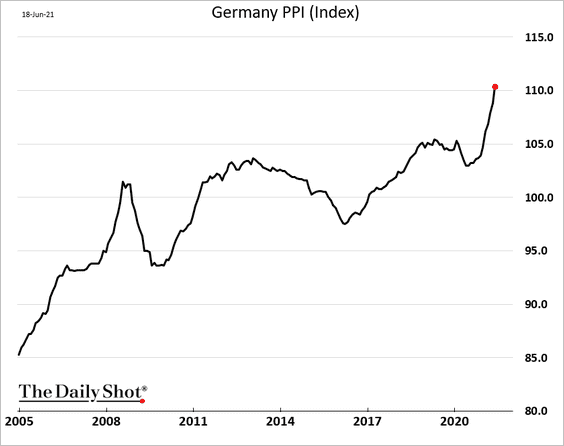
1. Germany’s producer prices are surging.
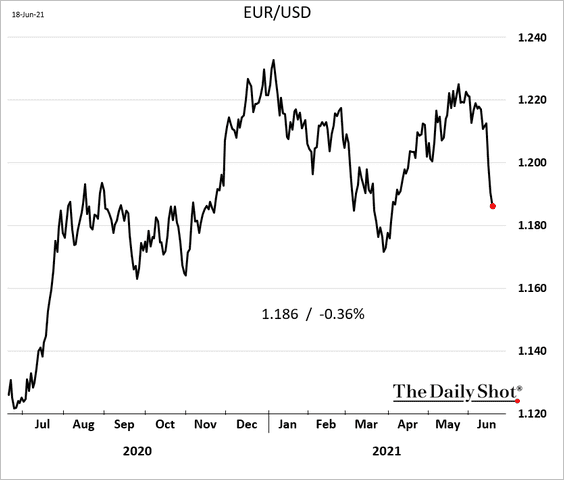
2. The euro has been under pressure vs. USD.
3. Economists expect a rebound in household consumption this year.
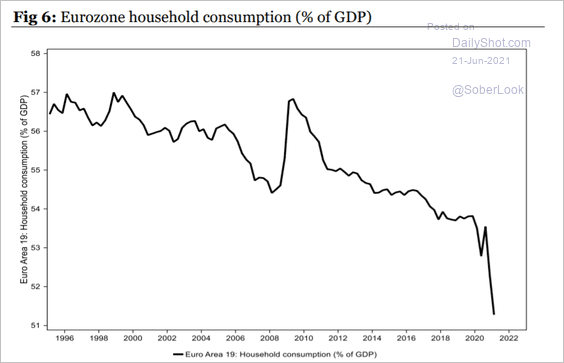 Source: Longview Economics
4. Excess reserves continue to climb.
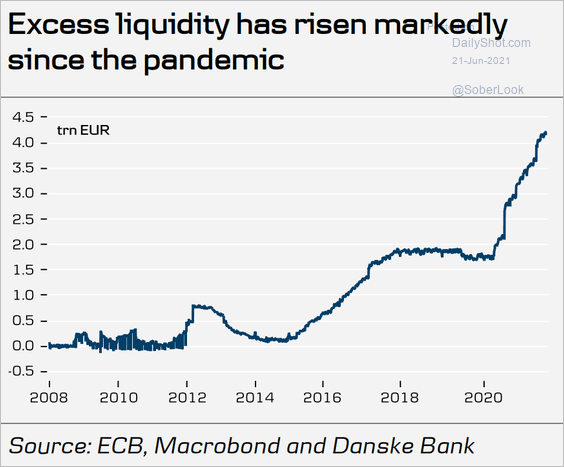 Source: Danske Bank
Back to Index
The United Kingdom
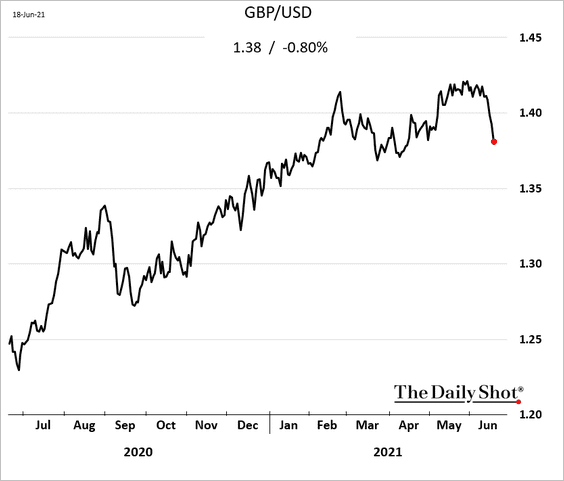
1. The pound took a hit last weevs. USD.
Separately, this chart shows the pound’s global use.
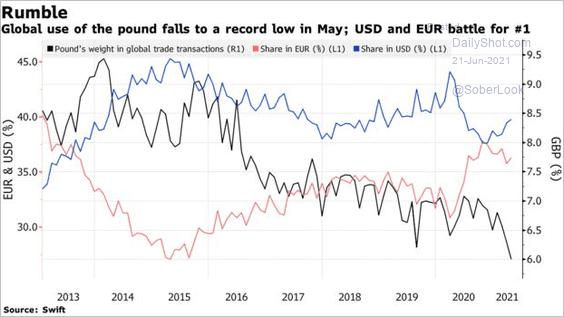 Source: @markets Read full article
——————–
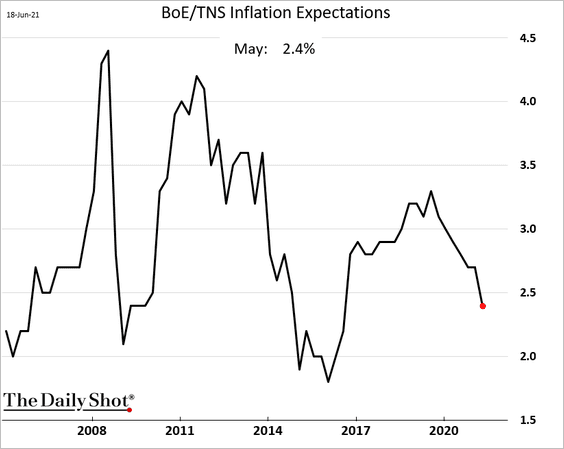
2. Survey-based inflation expectations have been easing.
3. The market now expects a somewhat faster pace of BoE rate hikes.
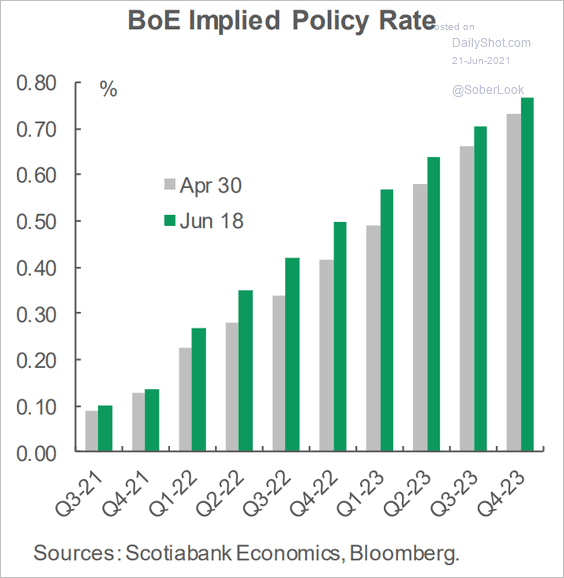 Source: Scotiabank Economics
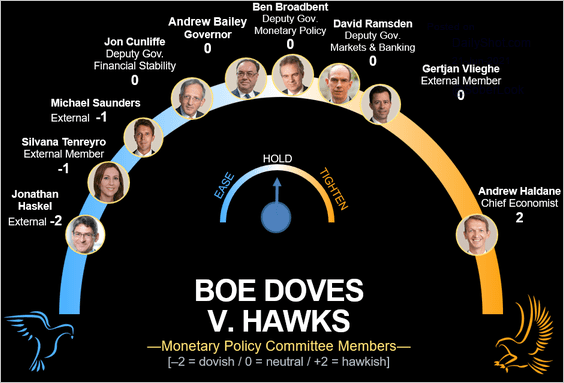
Separately, here is Bloomberg’s MPC members’ hawkishness estimate.
 Source: @markets Read full article
——————–
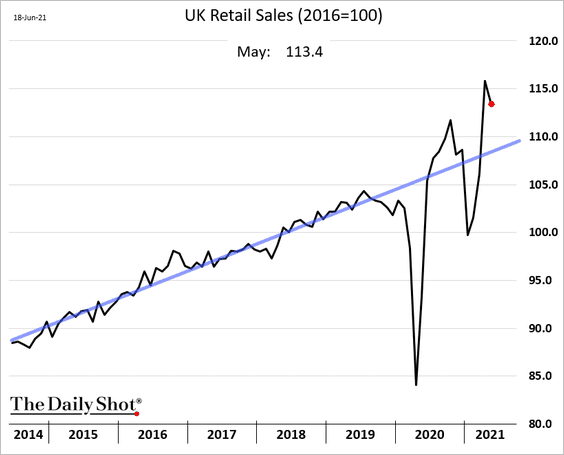
4. Retail sales remain above the pre-COVID trend (ex fuel shown below).
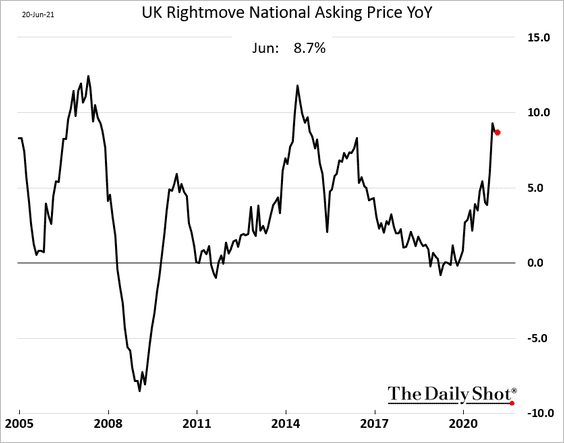
5. Home price gains have paused.
6. Foreign- and domestic-bound investment flows have diverged.
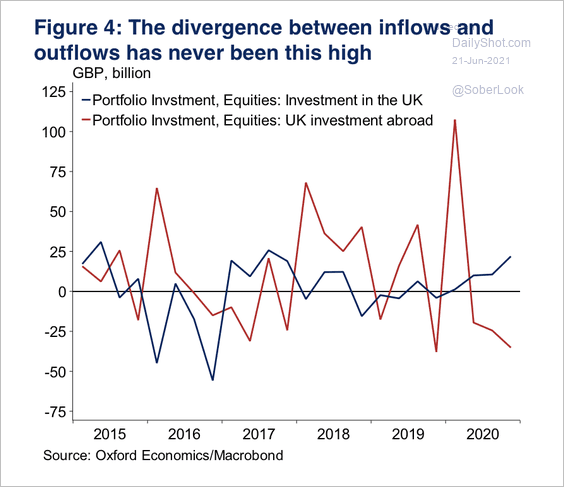 Source: Oxford Economics
Back to Index
The United States
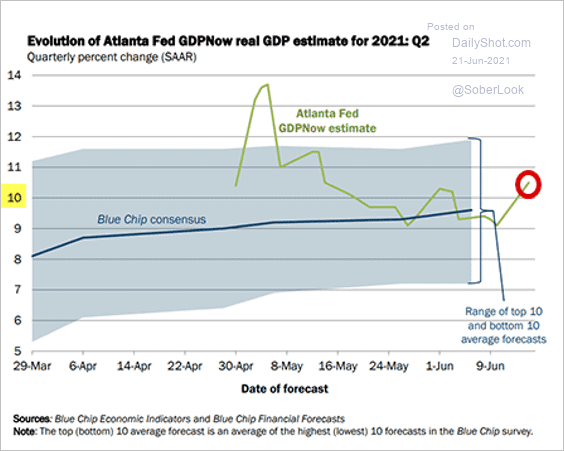
1. Let’s begin with some updates on GDP growth.
• The Atlanta Fed’s GDPNow estimate for Q2 is above 10%.
 Source: @AtlantaFed Read full article
But the NY Fed’s model is more subdued.
 Source: NY Fed
• Median forecasts call for above-trend GDP growth – a stark contrast to the decade that followed the financial crisis.
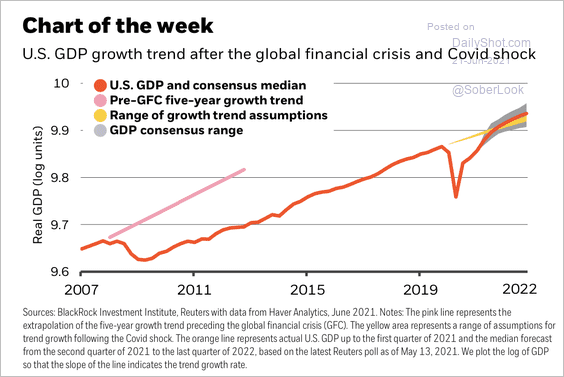 Source: BlackRock
• When is the next recession?
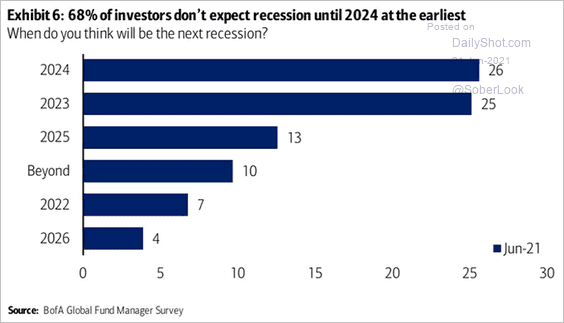 Source: @ISABELNET_SA, @BofAML
——————–
2. Next, we have some updates on inflation.
• Options-based expectations of the headline CPI exceeding 2.5% over the next five years have eased.
 Source: Arbor Research & Trading
• Fund managers’ inflation expectations have peaked.
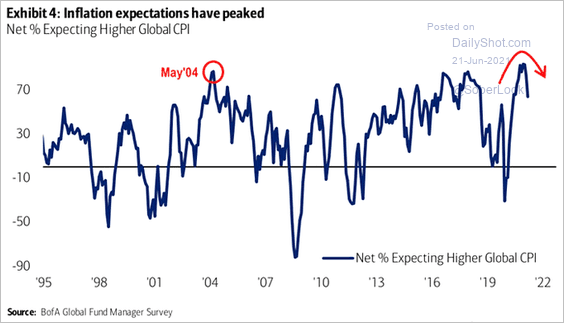 Source: @ISABELNET_SA, @BofAML
• Below are the key CPI indices (price levels) vs. pre-COVID trends.
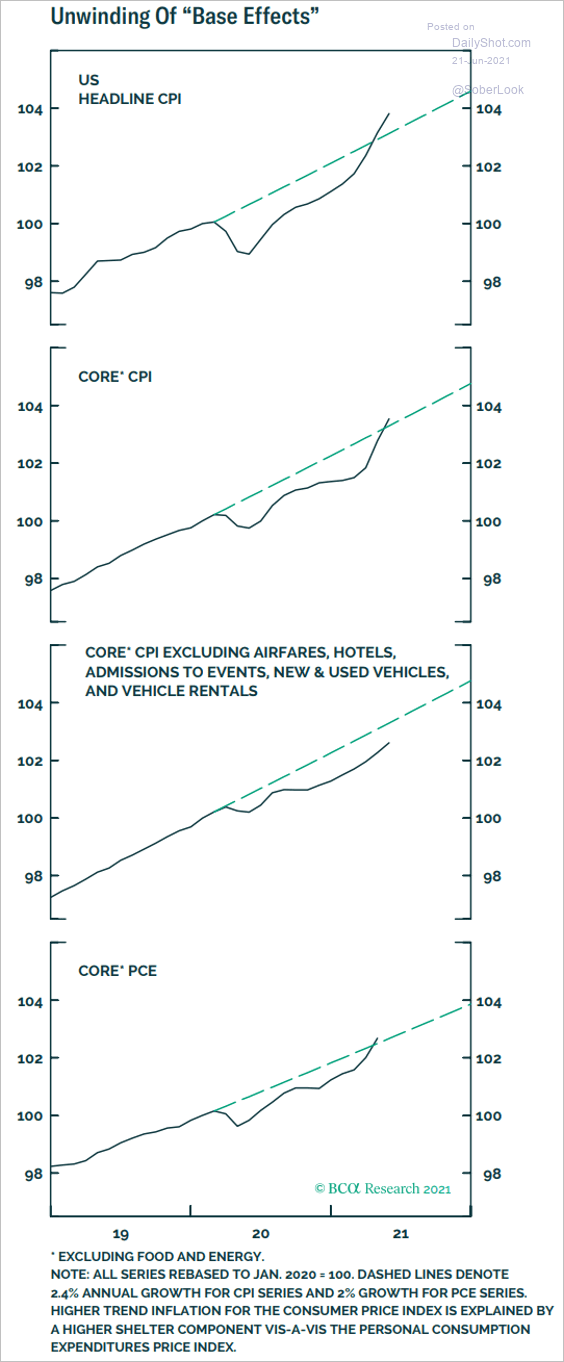 Source: BCA Research
• This chart shows consumer inflation expectations by sector.
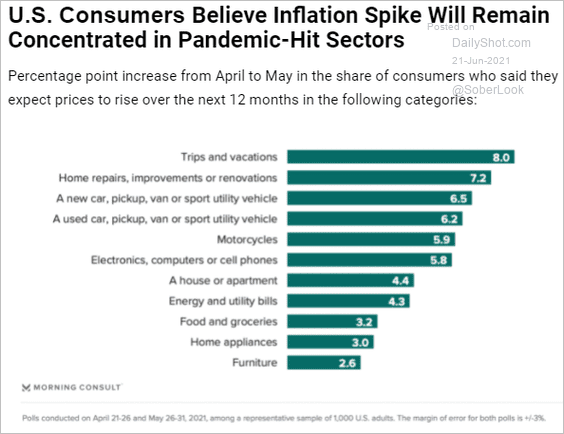 Source: Morning Consult Read full article
• Search activity for “transitory” has exploded.
![]() Source: @Not_Jim_Cramer
Source: @Not_Jim_Cramer
——————–
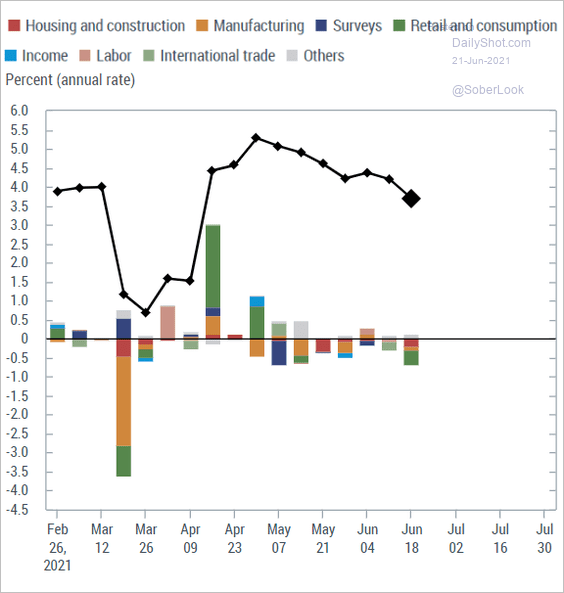
3. Service-sector activity in the NY Fed’s district (NY, part of NJ, part of CT) has accelerated.
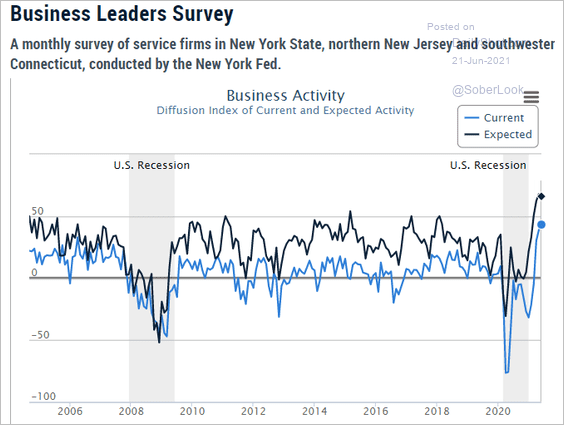 Source: NY Fed
4. Retail sales have shifted to “going out” sectors as Americans become more comfortable with various activities.
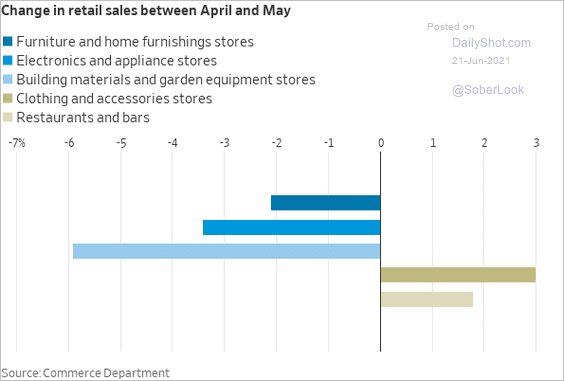 Source: @WSJ Read full article
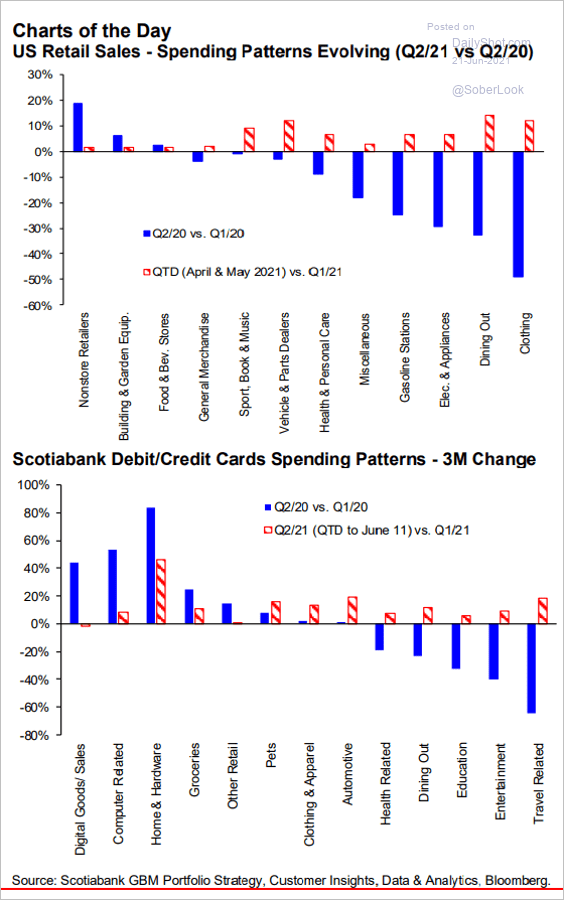 Source: Hugo Ste-Marie, Portfolio & Quantitative Strategy Global Equity Research, Scotia Capital
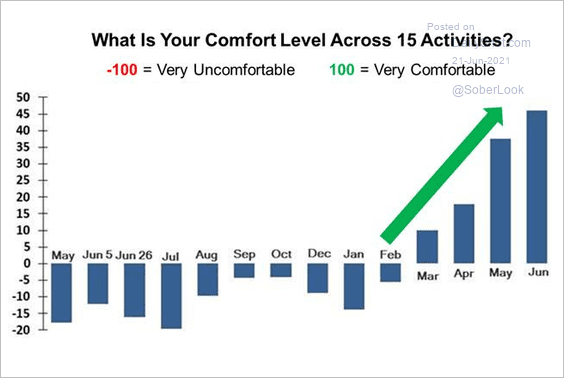 Source: Evercore ISI
Back to Index
Global Developments
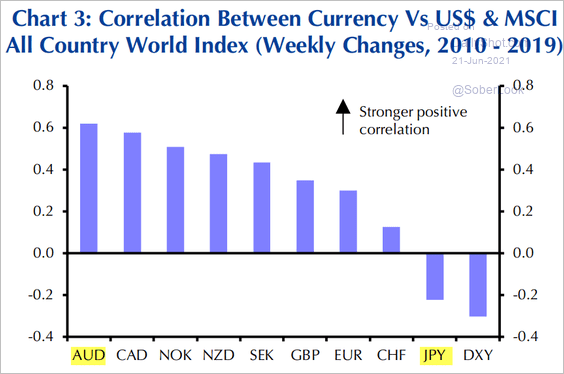
1. Which currencies were hit the hardest after the Fed’s hawkish tilt?
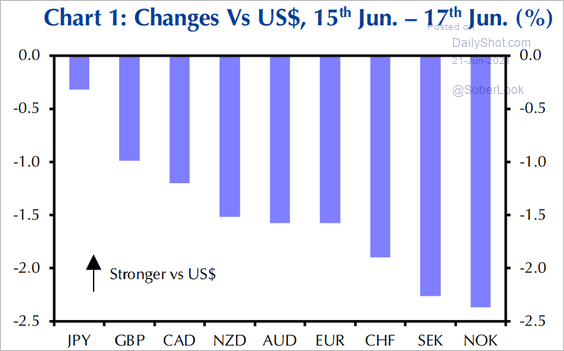 Source: Capital Economics
2. Bloomberg’s US dollar index is above the 50-day moving average.
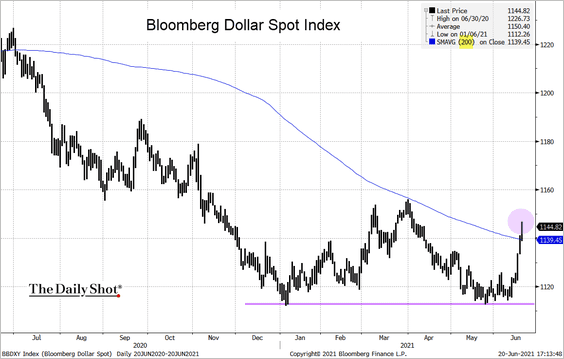 Source: @TheTerminal, Bloomberg Finance L.P.
3. This chart shows mobility trackers for select economies.
![]() Source: Capital Economics
Source: Capital Economics
4. US consumer goods spending stands out vs. other large economies.
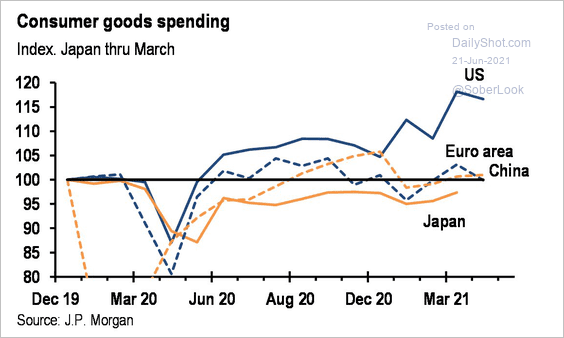 Source: JP Morgan; @carlquintanilla
5. Here is the distribution of cross-border vs. domestic trade by region.
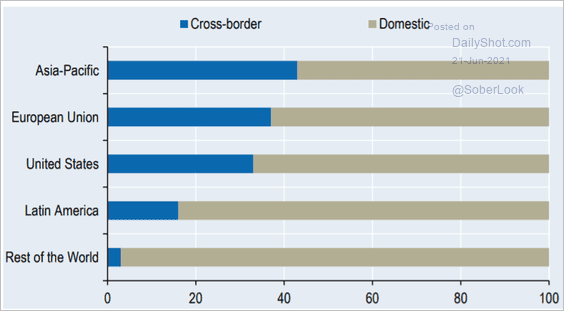 Source: OECD Read full article
——————–
Food for Thought
1. GDP per hour worked:
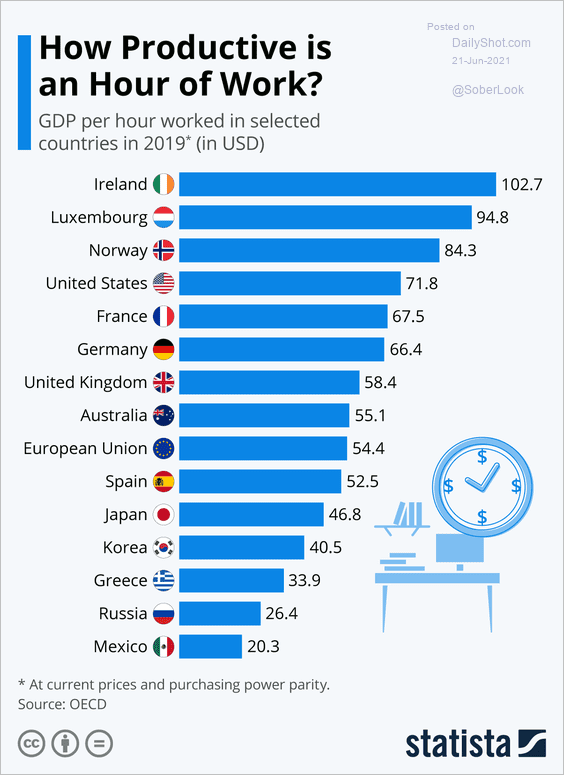 Source: Statista
2. Employment vs. school closings:
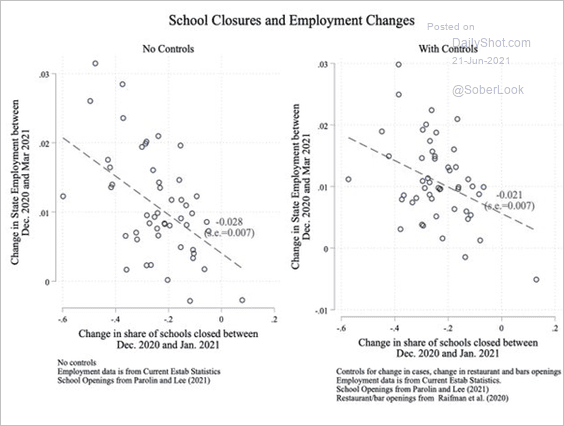 Source: @arindube
3. Labor force participation for recent college graduates:
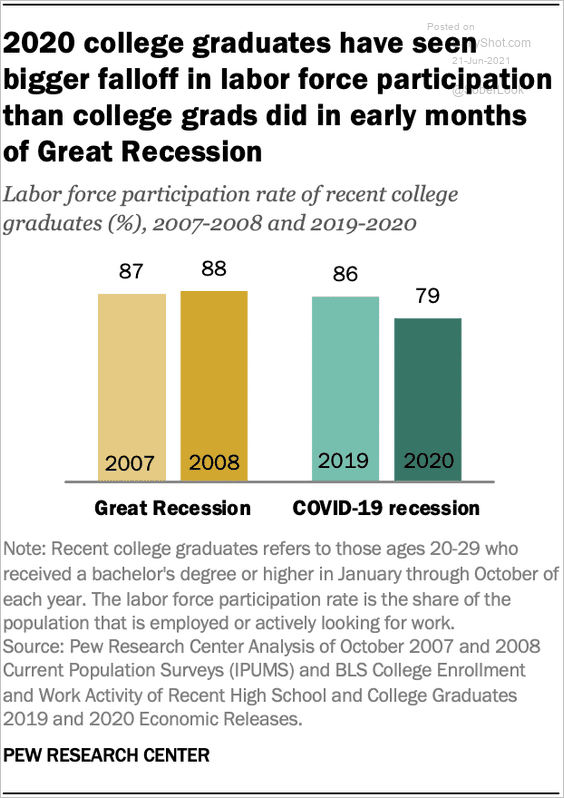 Source: Pew Research Center Read full article
4. WhatsApp users:
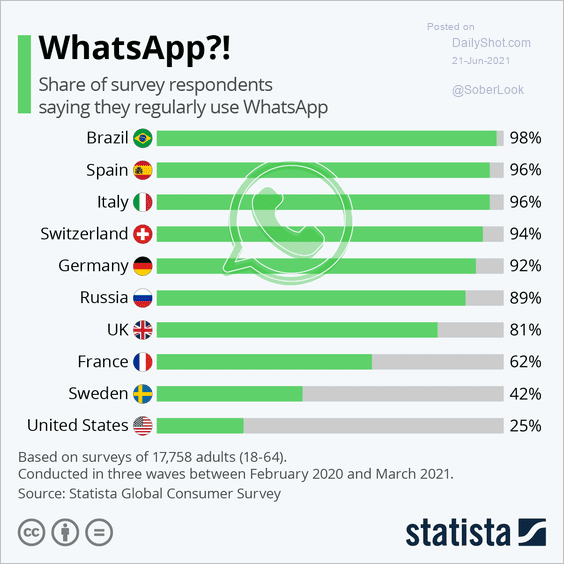 Source: Statista
5. Video game activities:
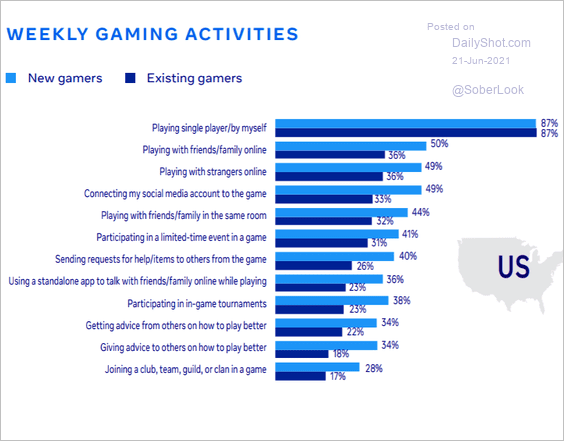 Source: Facebook Gaming Read full article
6. Executions:
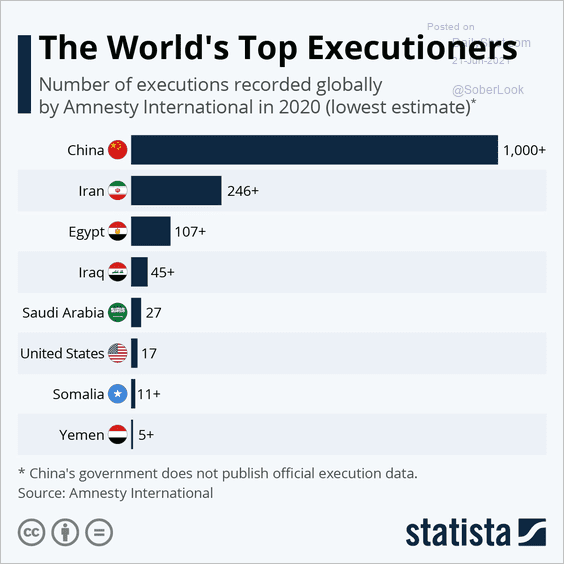 Source: Statista
7. Gun carry laws:
 Source: Statista
8. US Jewish population becoming more diverse:
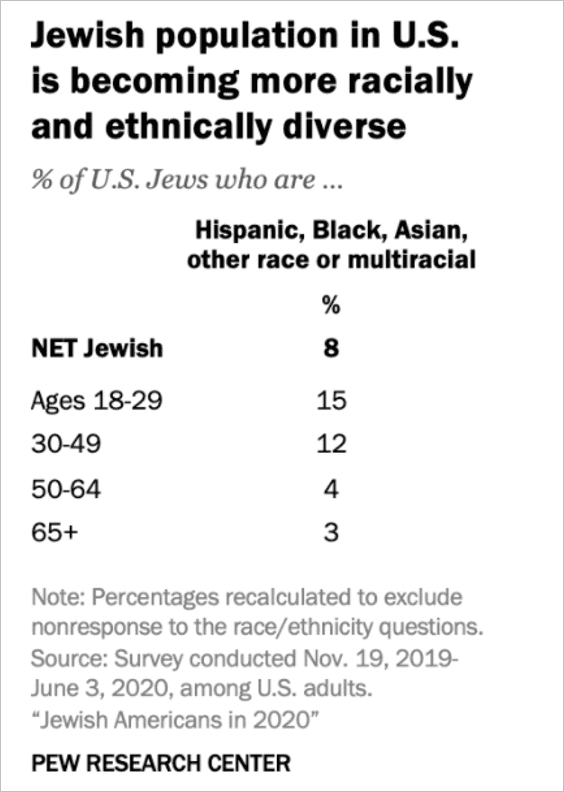 Source: Pew Research Center Read full article
9. What animal could you beat in a fight?
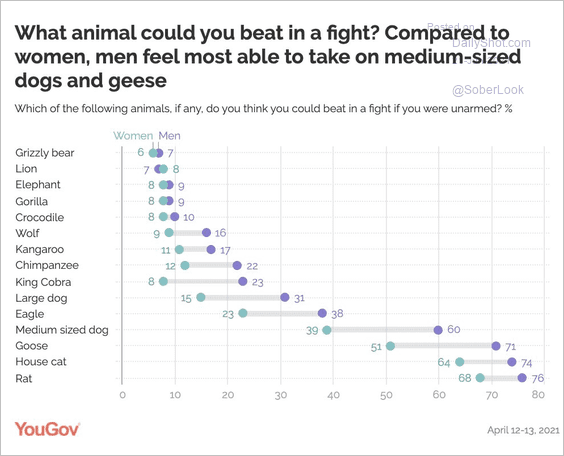 Source: @crampell, YouGov Read full article
——————–
Back to Index