
The Daily Shot: 23-Jun-21
• The United States
• The United Kingdom
• The Eurozone
• Japan
• China
• Emerging Markets
• Cryptocurrency
• Commodities
• Energy
• Equities
• Rates
• Global Developments
• Food for Thought
The United States
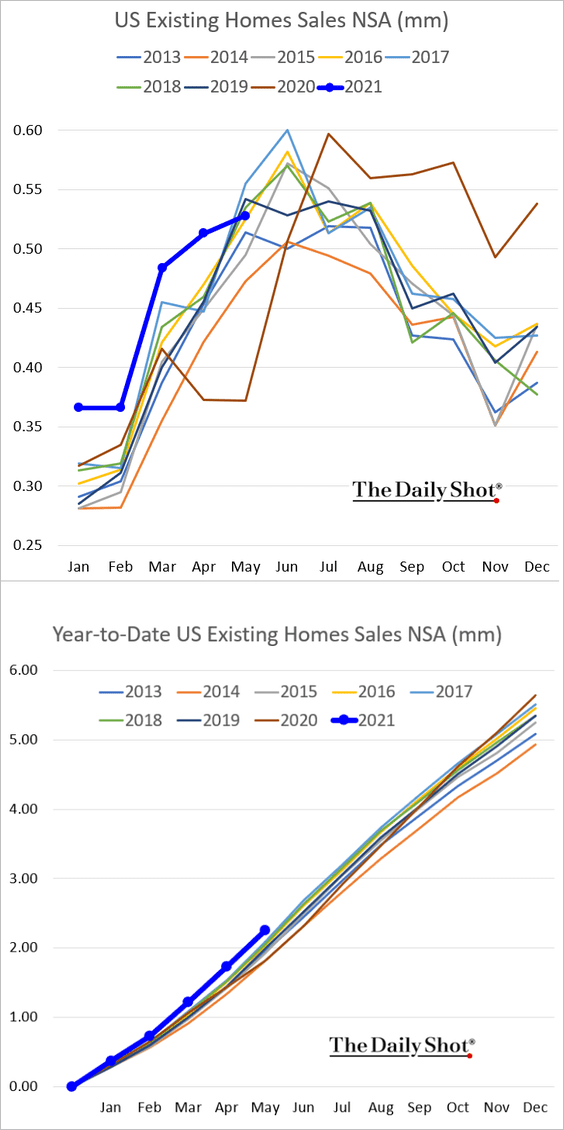
1. Existing home sales continue to lose momentum, with the May figure nearing 2016 levels. The second chart shows cumulative year-to-date sales.
Home prices are soaring, …
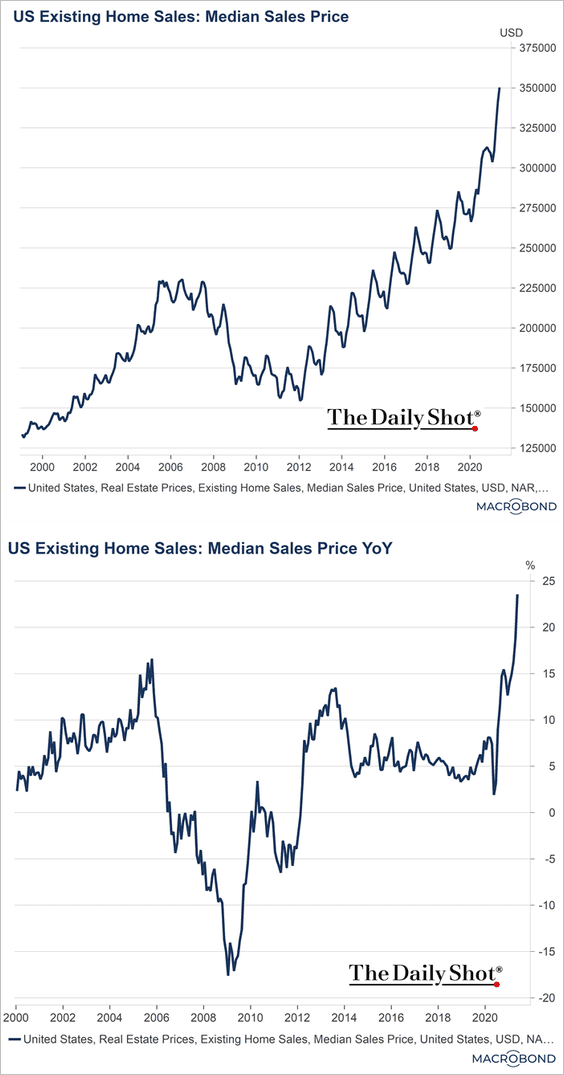 Source: Chart and data provided by Macrobond
… and inventories remain depressed.
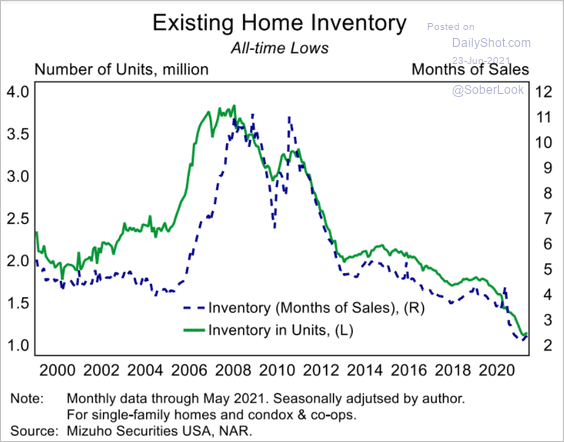 Source: Mizuho Securities USA
——————–
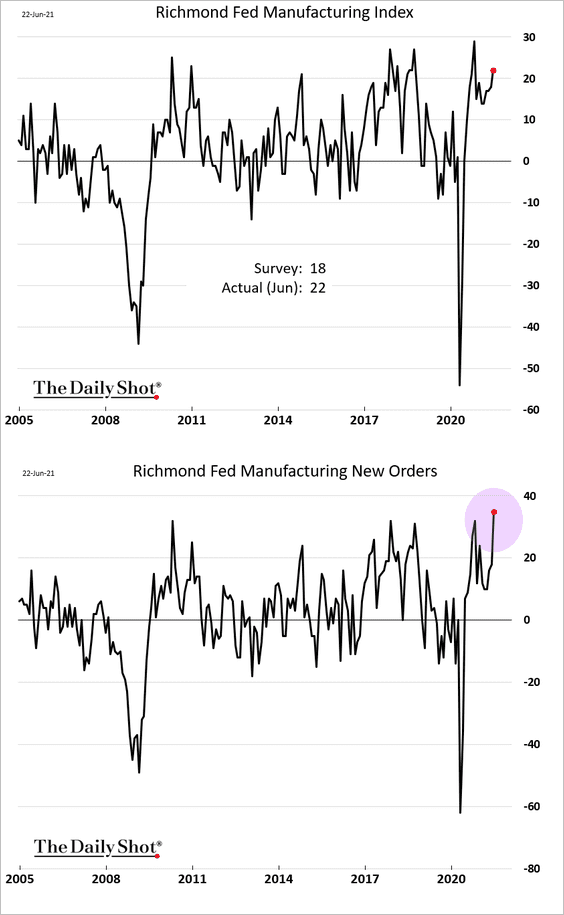
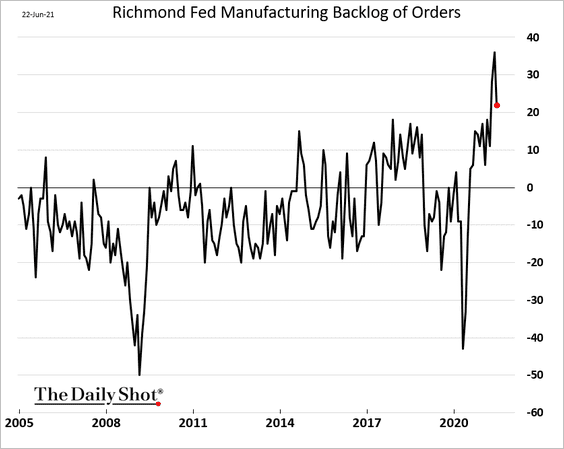
2. The Richmond Fed’s manufacturing report topped market estimates as new orders surge (2nd chart).
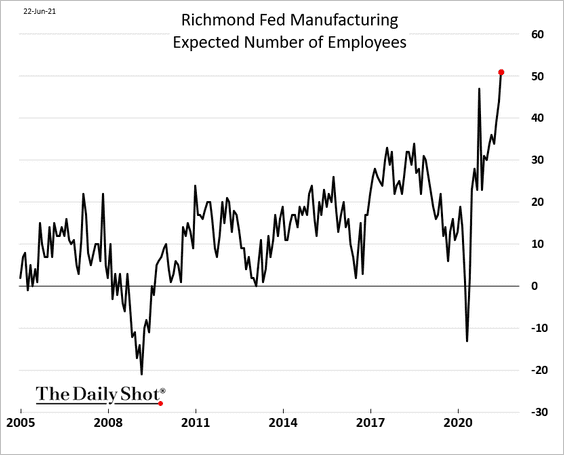
• Manufacturers are rapidly boosting wages, …
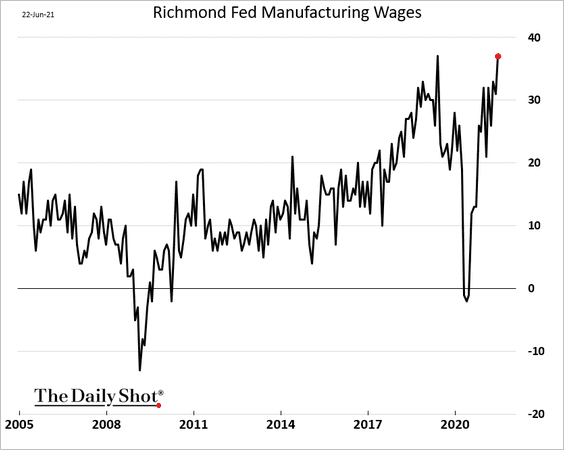
… as the hiring plans index hits a record high.
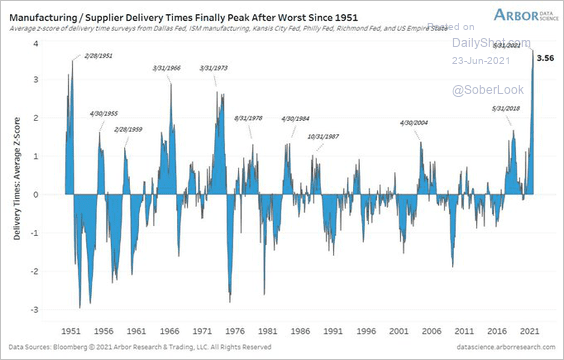
• The “supplier delivery times” index is still extraordinarily high but appears to have peaked, …
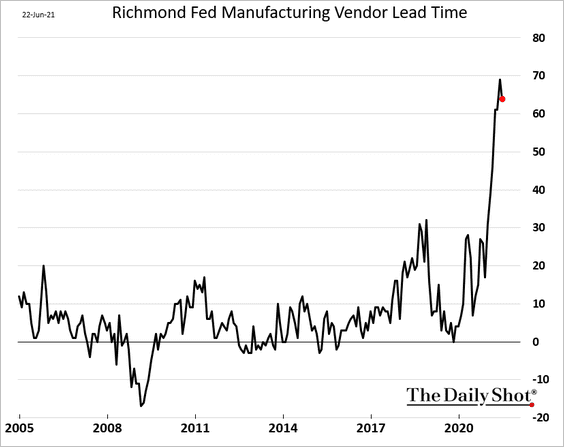
… which is also the case in other regions of the country.
 Source: @benbreitholtz
The “backlog of orders” index has also peaked.
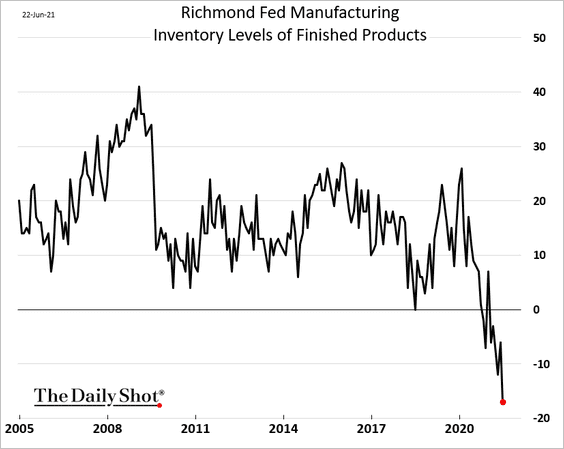
But inventory declines have accelerated.
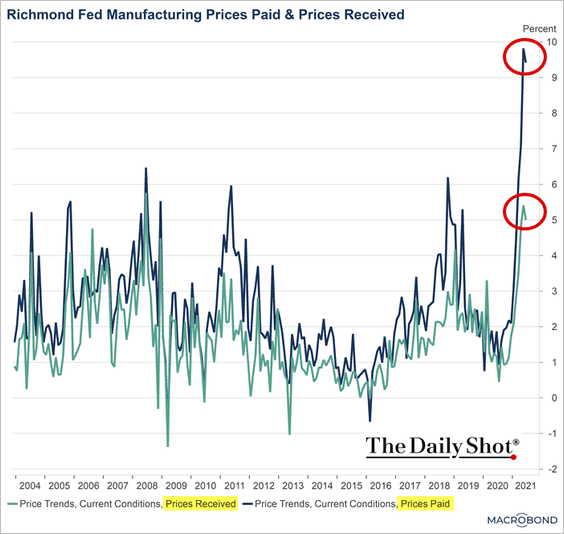
• Price indices are peaking as well.
 Source: Chart and data provided by Macrobond
——————–
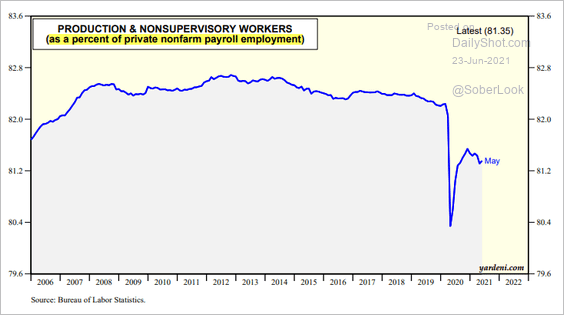
3. Bosses are at work, but workers have not returned yet.
 Source: Yardeni Research
Will terminating the emergency unemployment benefits remedy this situation? Job search data suggest not.
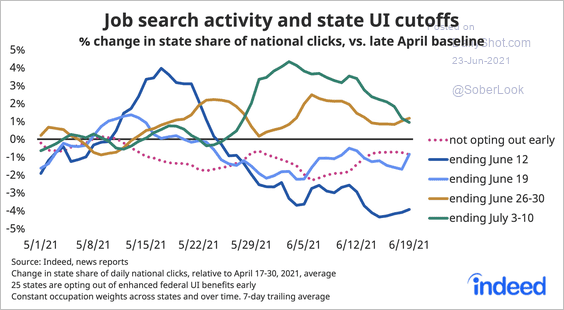 Source: @GregDaco, @indeed, @JedKolko
——————–
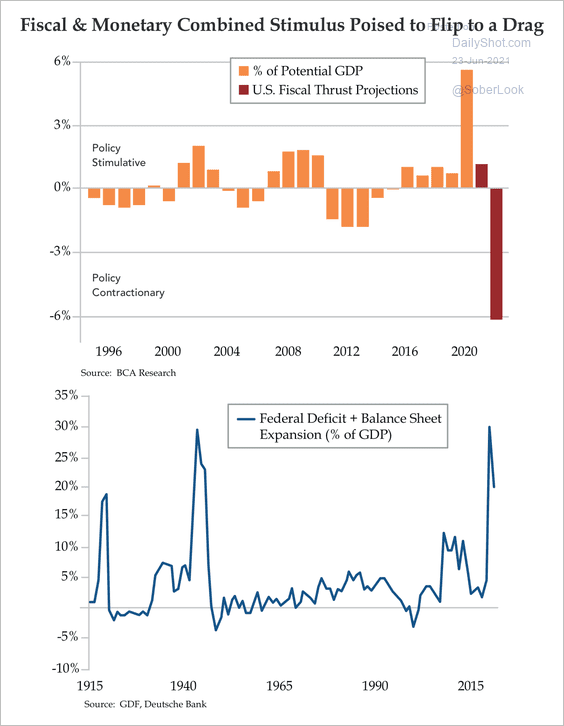
4. Fiscal and monetary policy has not been this coordinated since World War II. But the US could soon face a declining fiscal and monetary impulse.
 Source: Quill Intelligence
——————–
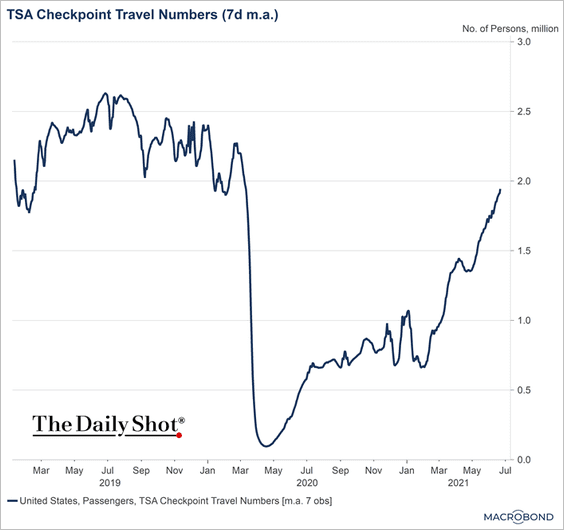
5. Air travel continues to rebound, putting pressure on understaffed airlines and TSA.
 Source: Chart and data provided by Macrobond
Back to Index
The United Kingdom
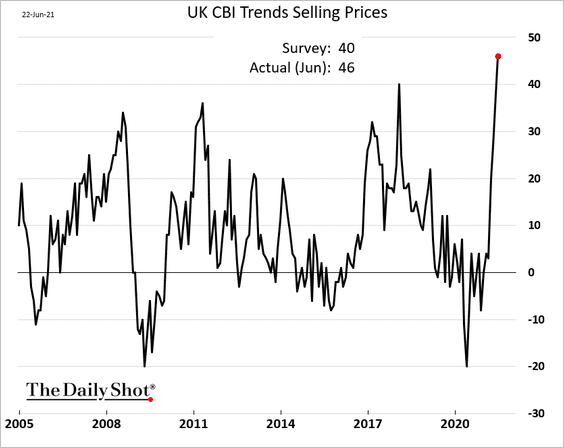
1. Industrial orders are surging, …
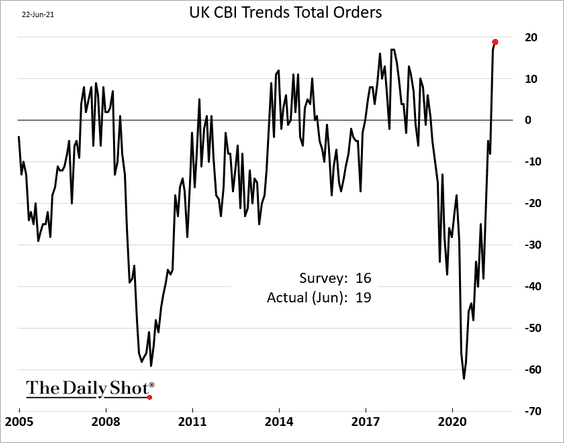
… and so are prices.
 Source: Reuters Read full article
We should see a substantial jump in industrial production.
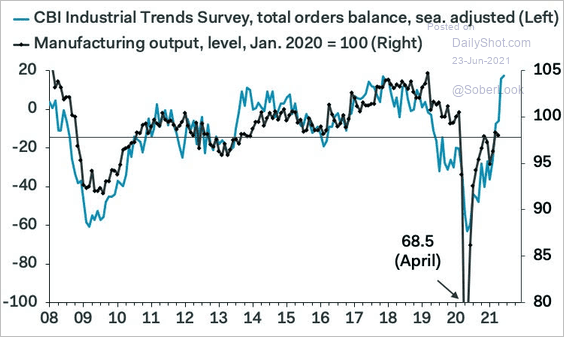 Source: Pantheon Macroeconomics
——————–
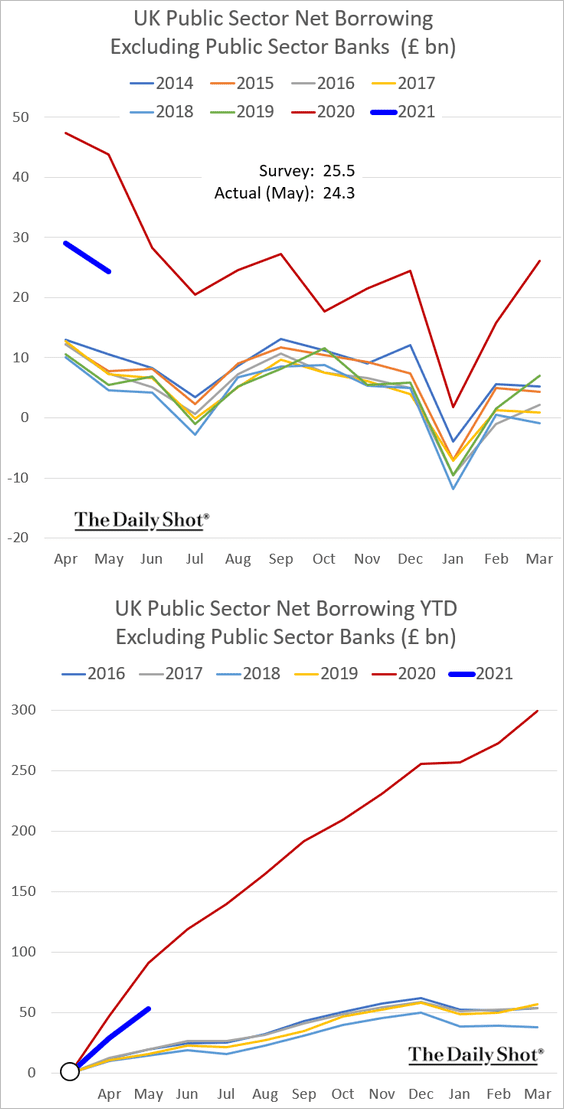
2. Government borrowing has been massive but lower than expected. The second chart shows cumulative borrowing for each fiscal year.
Back to Index
The Eurozone
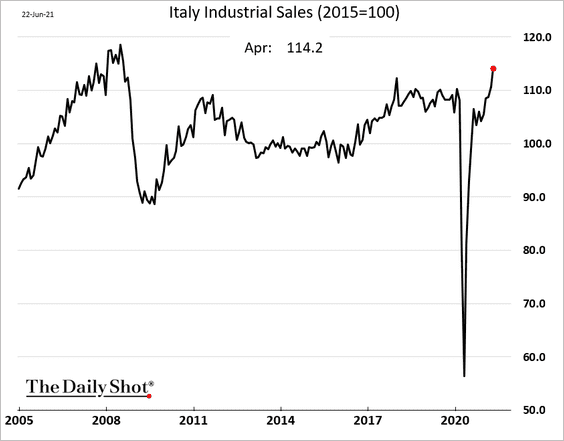
1. Italian industrial sales surged in recent months.
2. Eurozone consumer confidence is above pre-COVID levels.
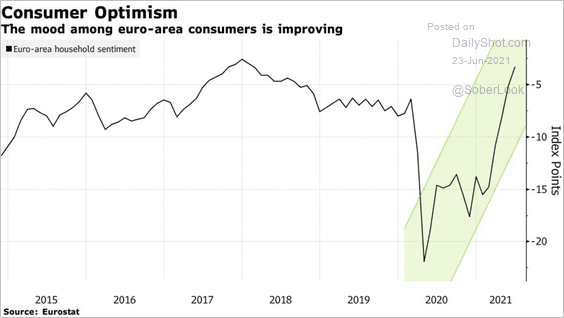 Source: @markets Read full article
3. This chart shows the ECB’s GDP and inflation projections with a couple of scenarios.
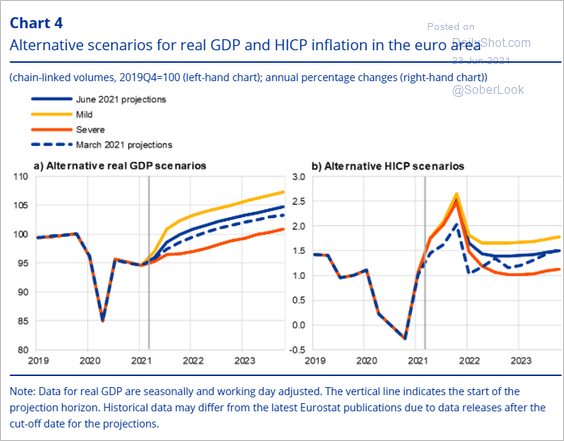 Source: ECB Read full article
4. Job postings continue to climb.
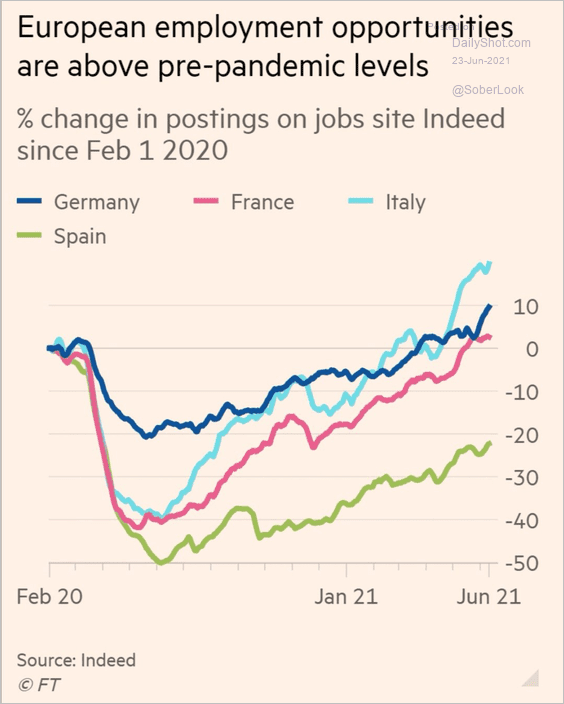 Source: @TonyCarterJones, @FT Read full article
Back to Index
Japan
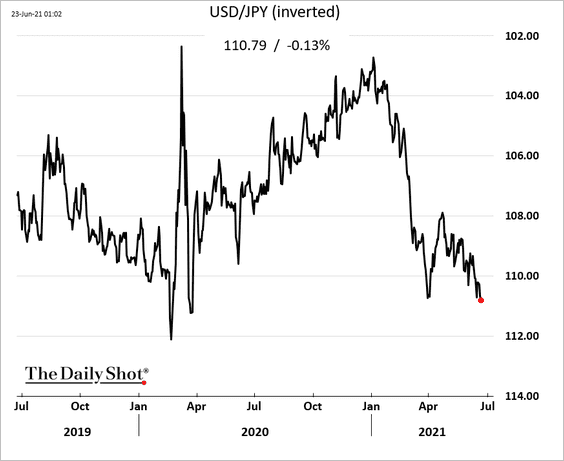
1. The yen has been trending lower vs. USD.
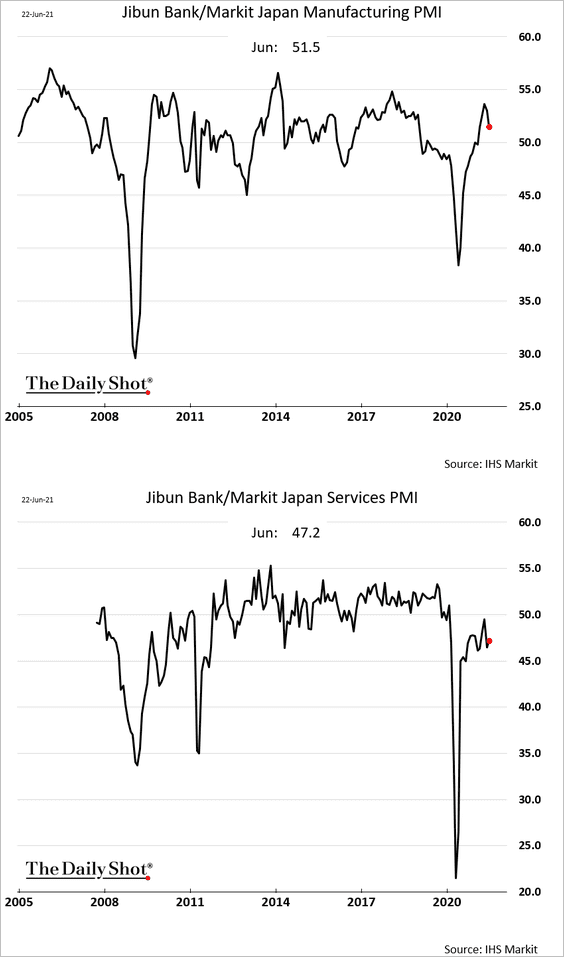
2. Manufacturing growth slowed in June, while services remain in contraction territory (PMI < 50).
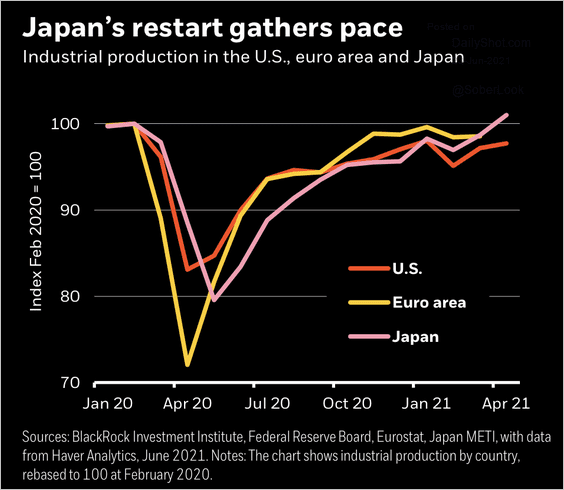
3. Industrial production has been outperforming the US and Eurozone. However, despite economic improvements, BlackRock expects the Bank of Japan to remain highly accommodative for the foreseeable future.
 Source: BlackRock
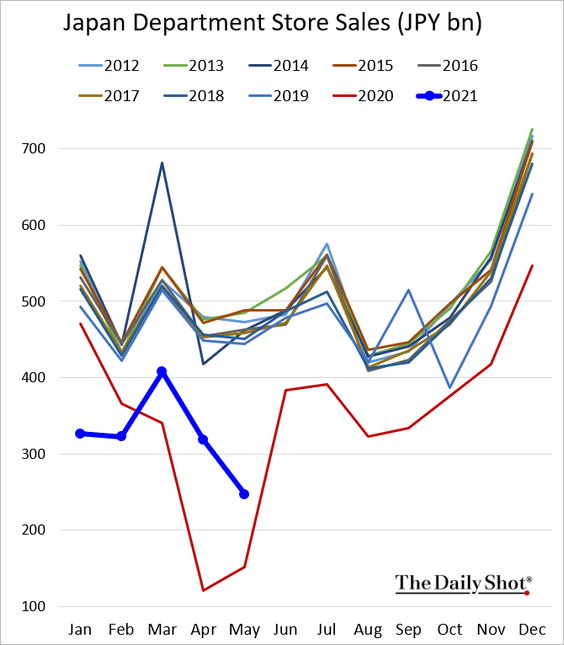
4. Department store sales are moving in the wrong direction.
Back to Index
China
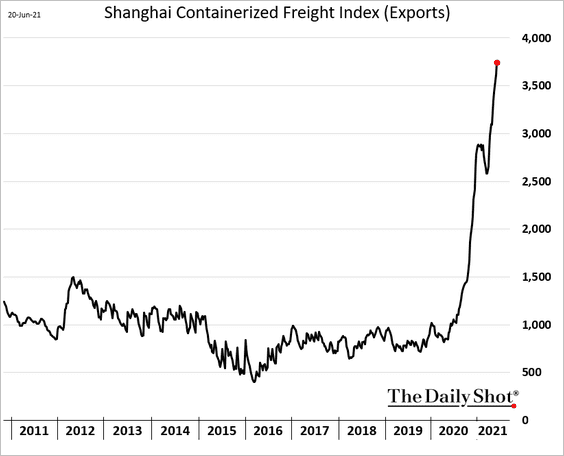
1. Container shipping costs continue to surge.
2. China has regained US import market share.
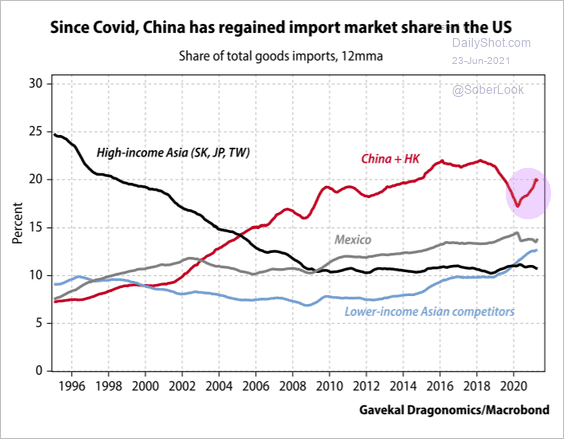 Source: Gavekal Research
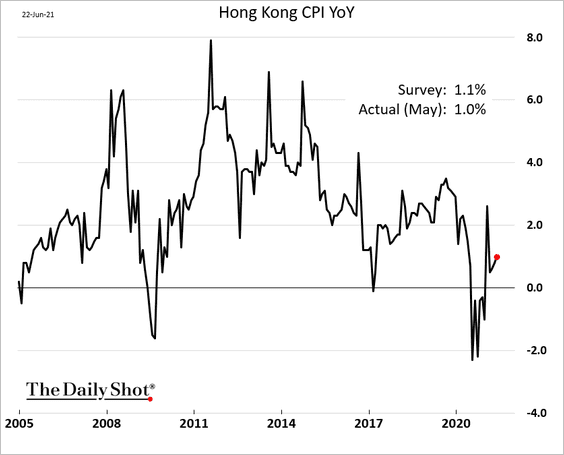
3. Hong Kong’s consumer inflation remains subdued.
Back to Index
Emerging Markets
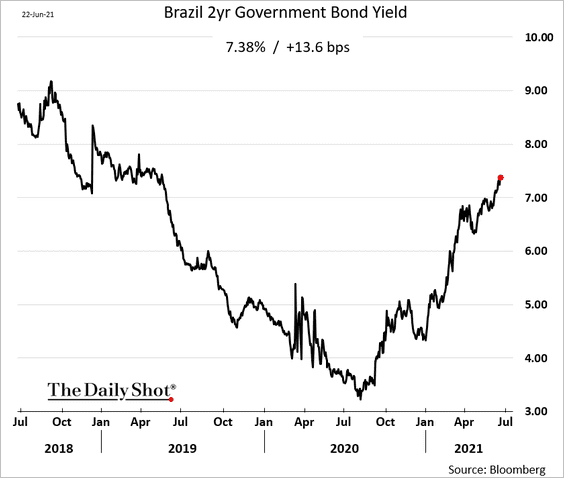
1. Brazil’s short-term bond yields keep climbing, as the market prices in more rate hikes.
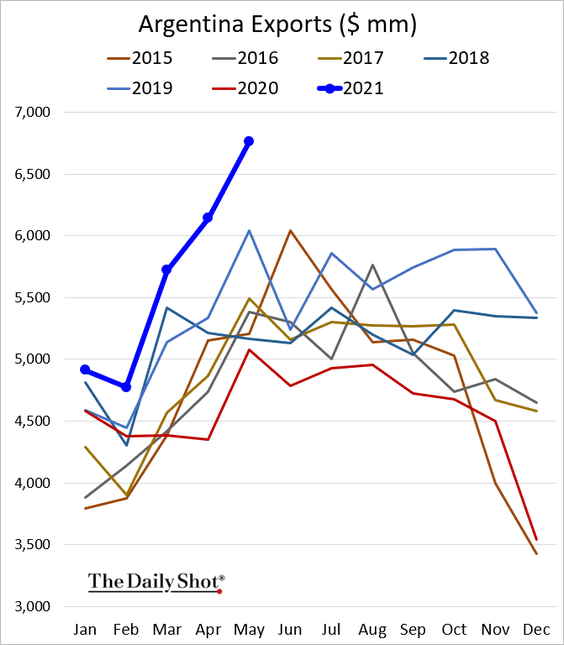
2. It’s been a good year for Argentina’s exports as commodity prices surged.
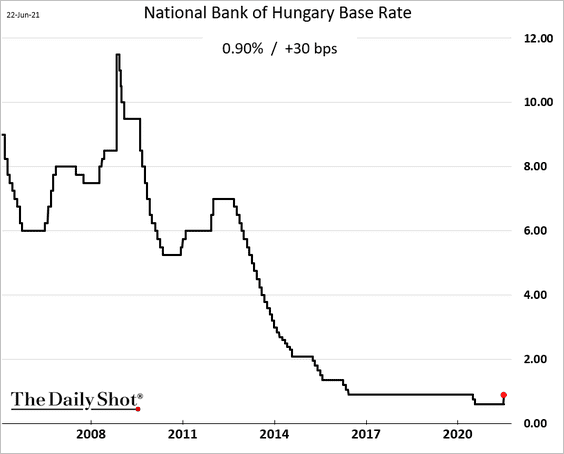
3. Hungary’s central bank hiked rates for the first time in years.
Back to Index
Cryptocurrency
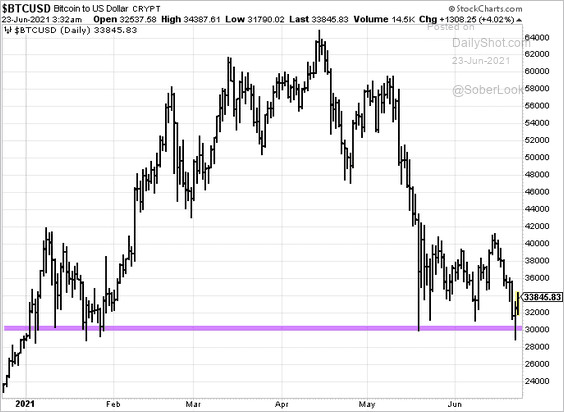
1. Once again, Bitcoin held support at 30k.
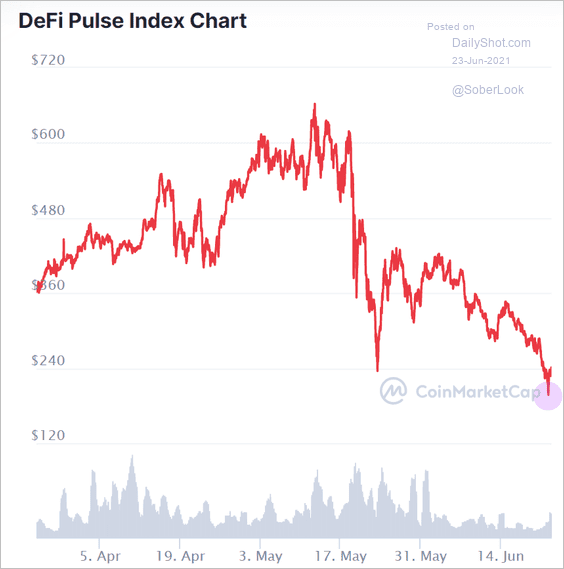
2. After a massive decline, DeFi tokens also appear to have stabilized (for now).
 Source: CoinMarketCap
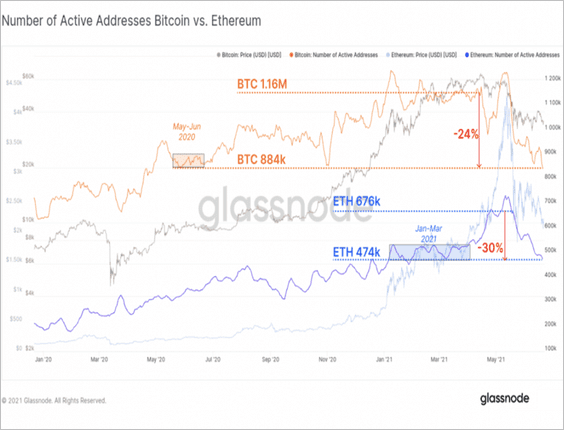
3. The number of Bitcoin and Ethereum active addresses has declined over the past few months, indicating slower blockchain activity.
 Source: Glassnode Read full article
4. Bitcoin futures open interest dropped by more than half in two months.
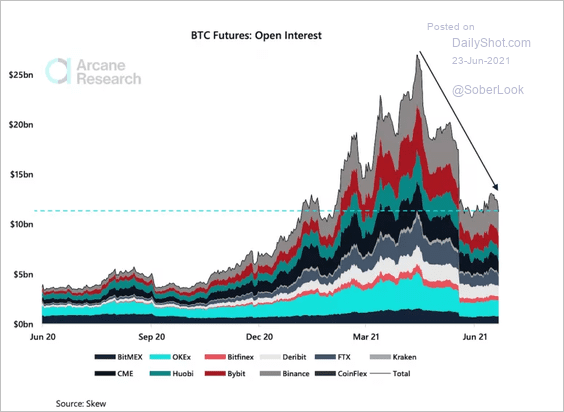 Source: Arcane Research Read full article
5. MicroStrategy’s most recent $500 million bond used to finance additional purchases of Bitcoin dropped below par amid the crypto selloff.
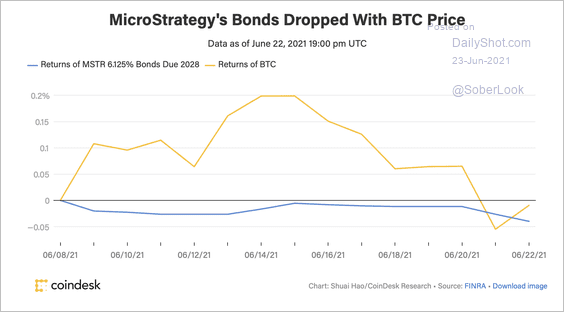 Source: CoinDesk Read full article
6. Crypto miners have contributed to graphics chip (GPU) shortages, as prices followed Ethereum higher (GPUs are used for parallel processing).
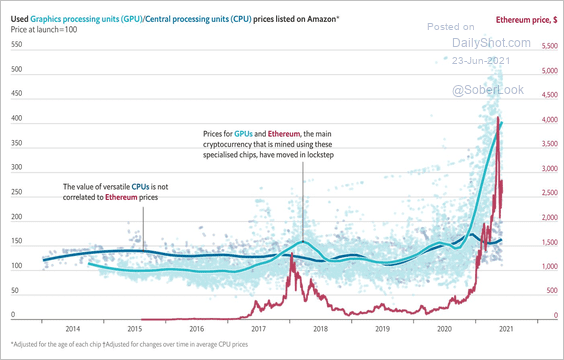 Source: @adam_tooze, The Economist Read full article
Back to Index
Commodities
US milk futures tumbled in recent weeks amid ample supply.
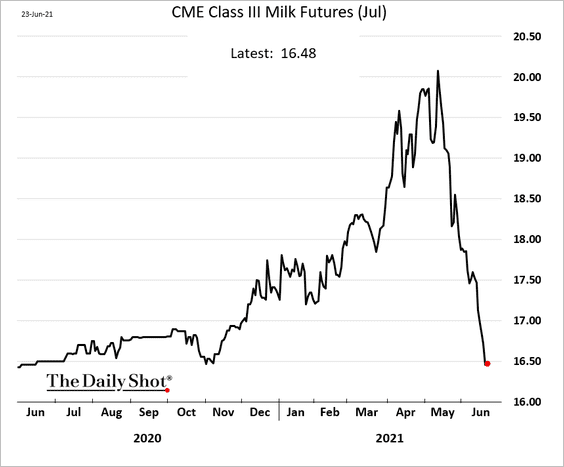
 Source: Wisconsin Farmer Read full article
Back to Index
Energy
1. The Brent – Dubai crude oil spread is approaching multi-year highs (more on the topic here).
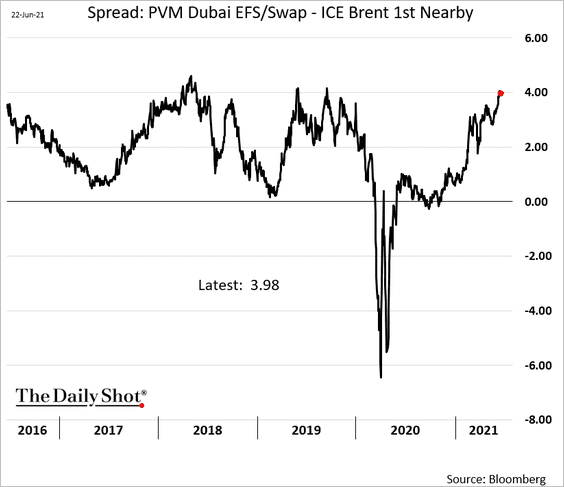 h/t @iamsharoncho
2. OPEC’s market share is expected to expand in the decades ahead as tight oil production peaks.
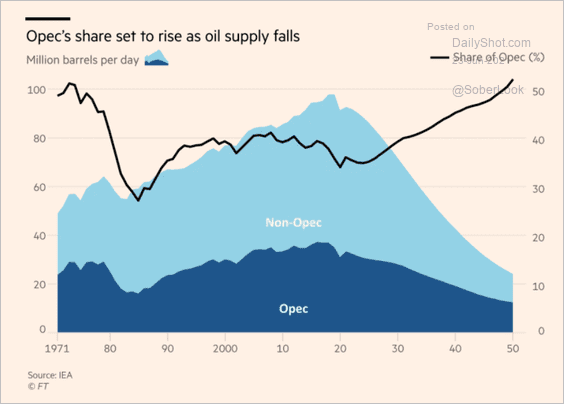 Source: @financialtimes Read full article
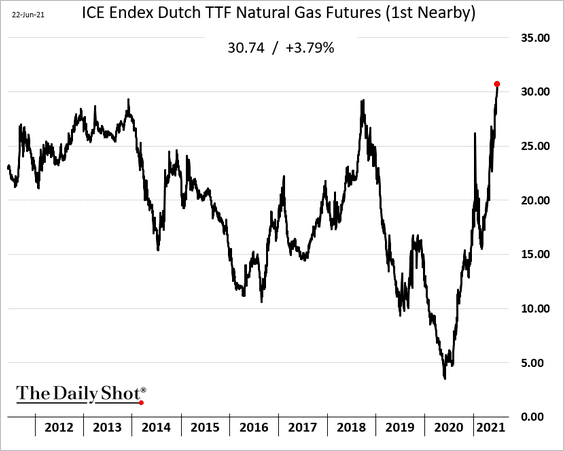
3. European natural gas is hitting multi-year highs, which should further boost LNG prices.
Back to Index
Equities
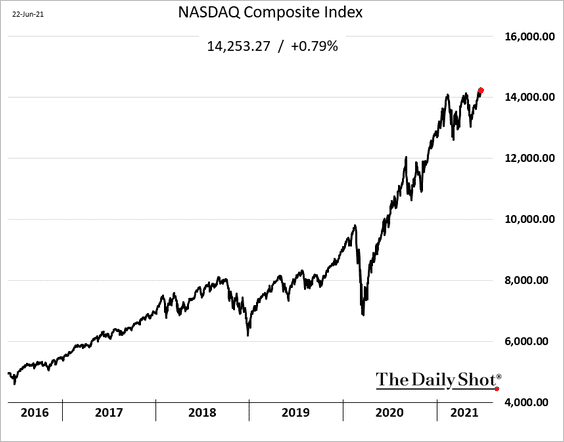
1. Stocks continue to rally, …
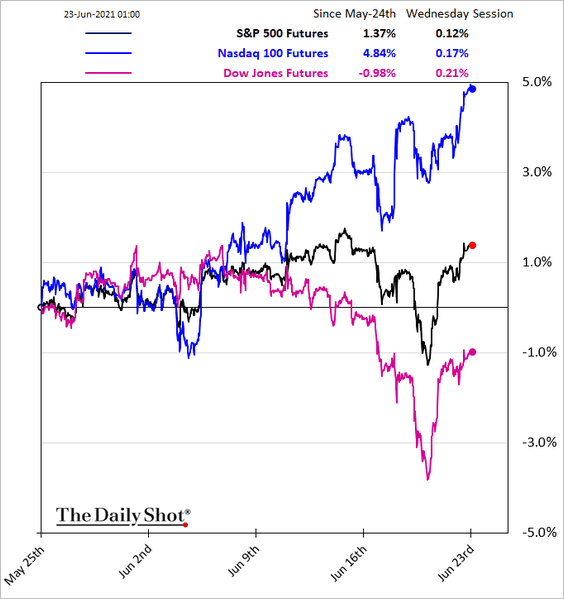
… with the Nasdaq Composite hitting a record high.
——————–
2. Equity fund inflows have been impressive.
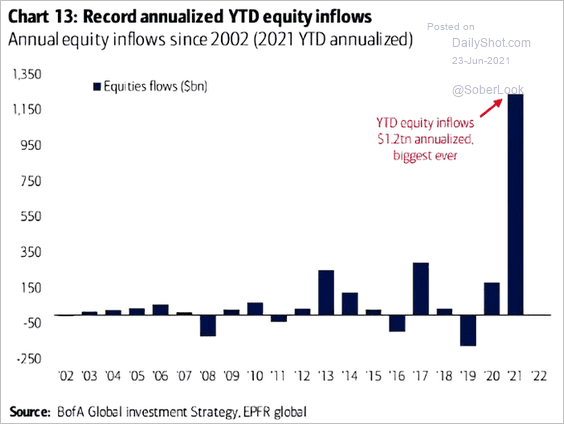 Source: @ISABELNET_SA, @BofAML
3. There is a big gap in returns on equity (ROE) and valuations between the US and the rest of the world (ROW).
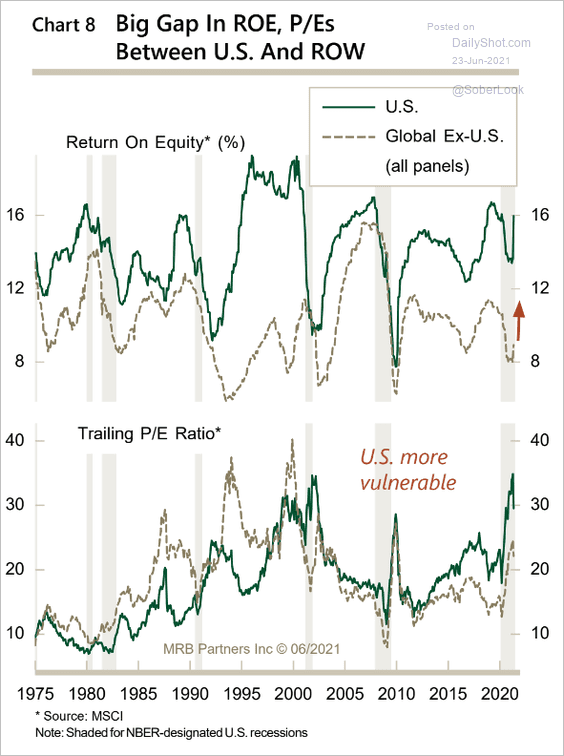 Source: MRB Partners
But the US outperformance may have peaked.
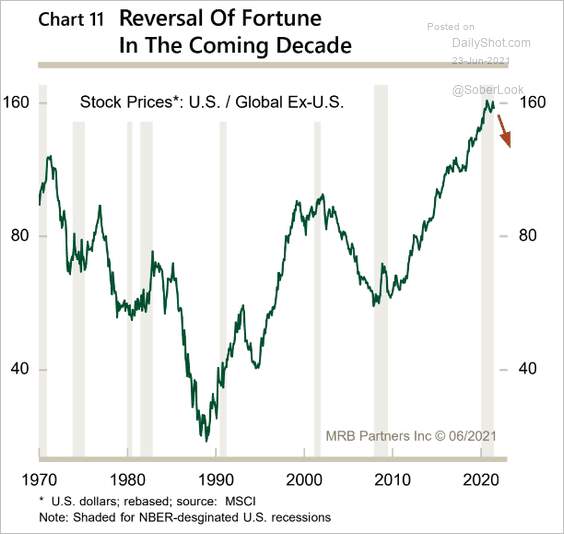 Source: MRB Partners
——————–
4. In the past year, the inverse correlation between the dollar and the US equity market has strengthened.
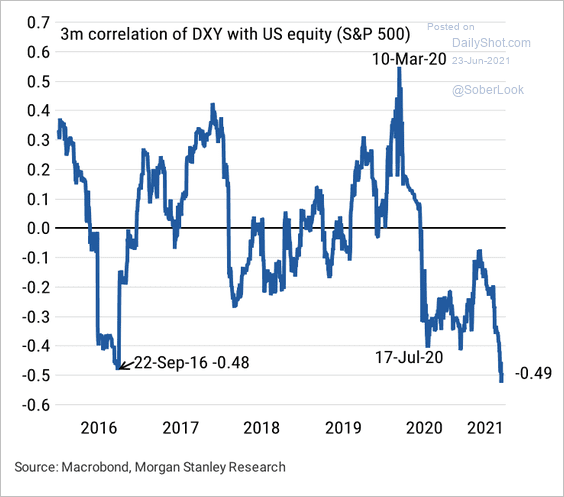 Source: Morgan Stanley Research
5. Despite negative Treasury returns and a positive correlation with stocks this year, a 60/40 allocation has still mustered a Sharpe ratio close to one, according to Cornerstone Macro.
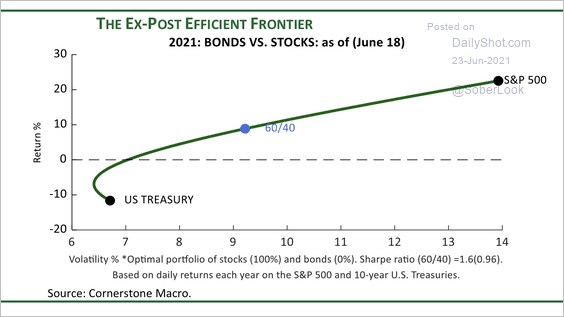 Source: Cornerstone Macro
6. The ratio of global equity market capitalization to world GDP is at record highs.
 Source: MRB Partners
7. This chart shows investors’ sector allocations relative to historical averages (Evercore ISI survey).
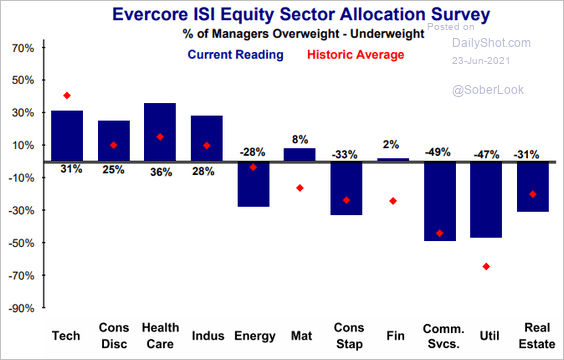 Source: Evercore ISI
8. Actively managed ETFs took off this year.
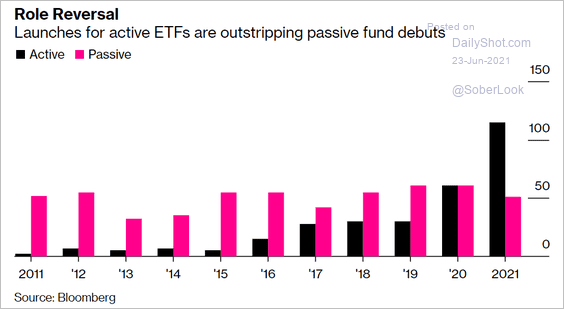 Source: @markets Read full article
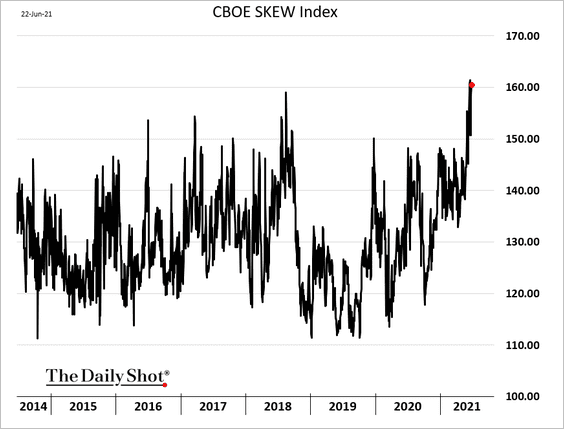
9. The CBOE Skew index remains elevated, pointing to strong demand for downside protection.
Back to Index
Rates
1. The Fed is fully absorbing all the new Treasury supply at this point. The situation will change once the US Treasury exhausts its cash balances.
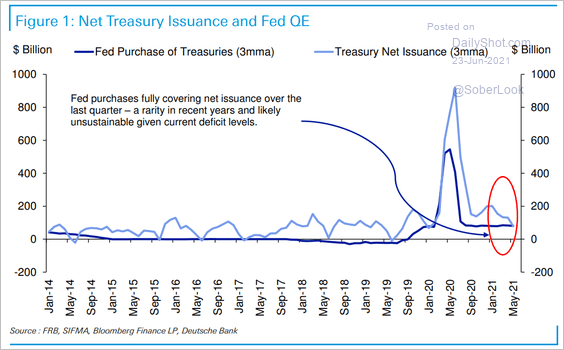 Source: Deutsche Bank Research
2. BlackRock views the latest update to the Fed’s inflation projection as a catch-up to account for past undershoots of the 2% target.
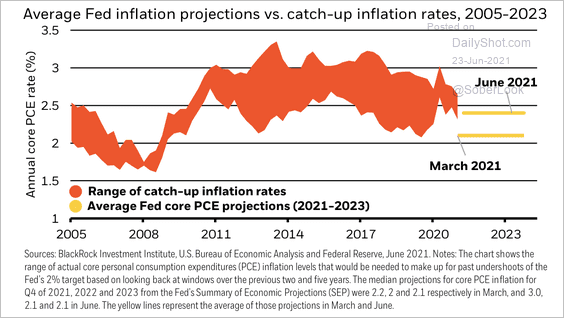 Source: BlackRock
3. In recent decades, the Fed has not been able to raise rates above the natural rate of interest (r*). That’s why estimating r* is so important.
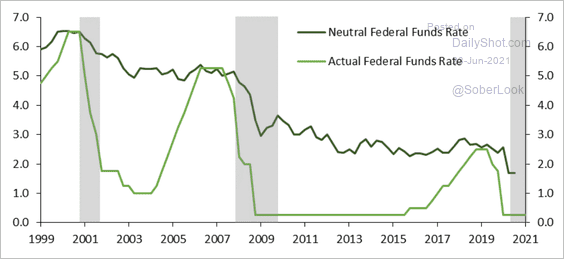 Source: Cornerstone Macro
Back to Index
Global Developments
1. Here is a look at asset performance year-to-date.
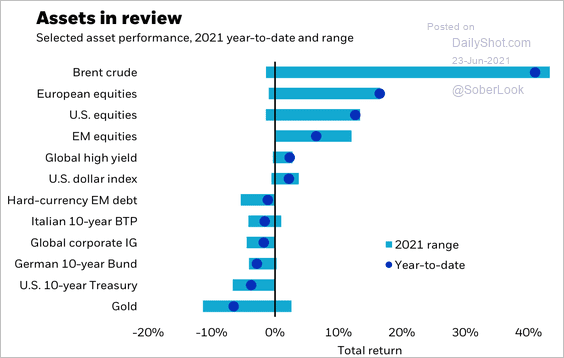 Source: BlackRock
2. Higher US real yields relative to China’s economic surprise index point to a recovery in the dollar this summer.
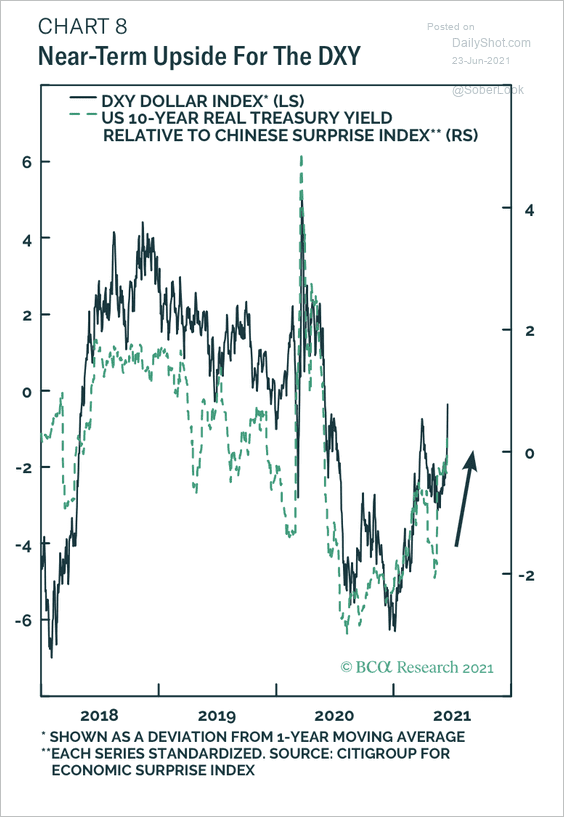 Source: BCA Research
3. Semiconductor delivery delays are worsening, …
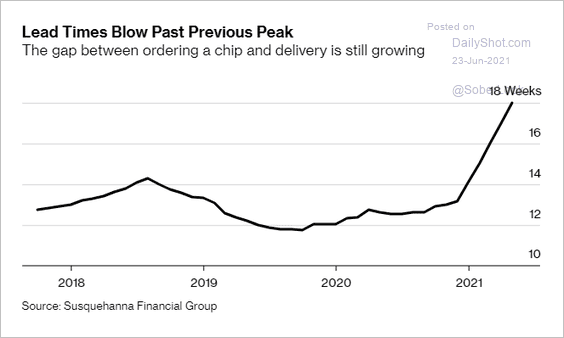 Source: @tracyalloway, @ianmking Read full article
… pushing chip prices higher.
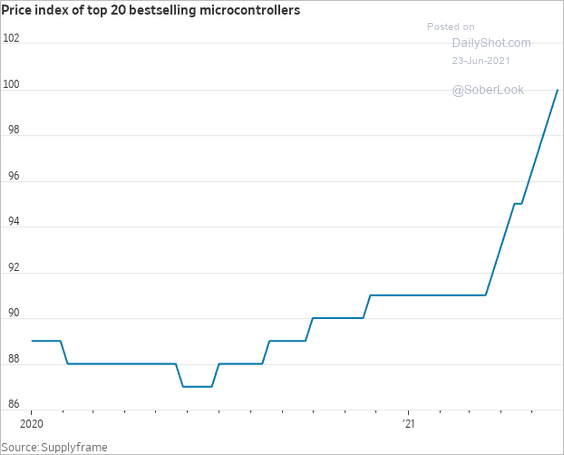 Source: @WSJ Read full article
——————–
4. The number of Bloomberg stories about inflation has surged this year.
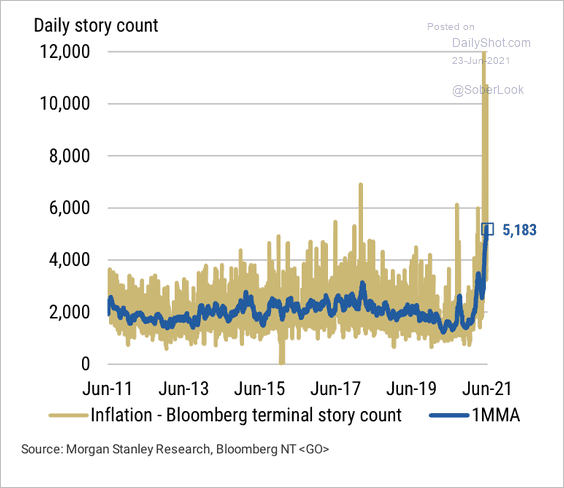 Source: Morgan Stanley Research
5. Inflation-adjusted global goods trade continues to climb.
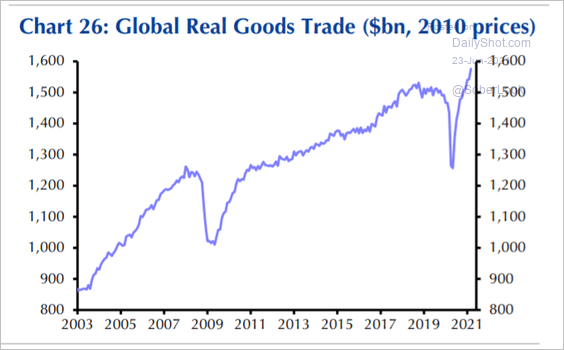 Source: Capital Economics
6. Home price increases have accelerated in many economies.
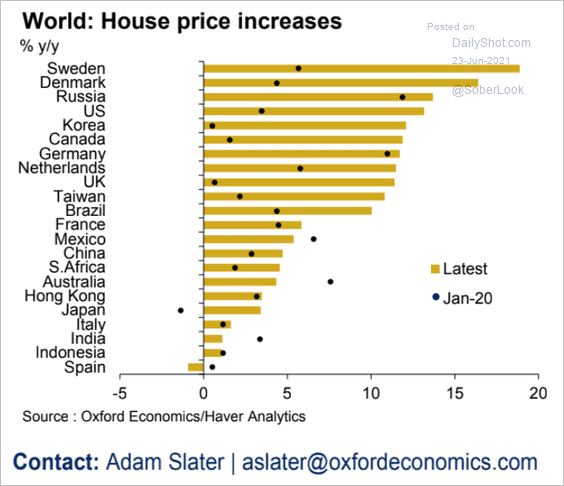 Source: Oxford Economics
——————–
Food for Thought
1. US property taxes by county:
 Source: @TaxFoundation Read full article
2. Corporate tax rates around the world:
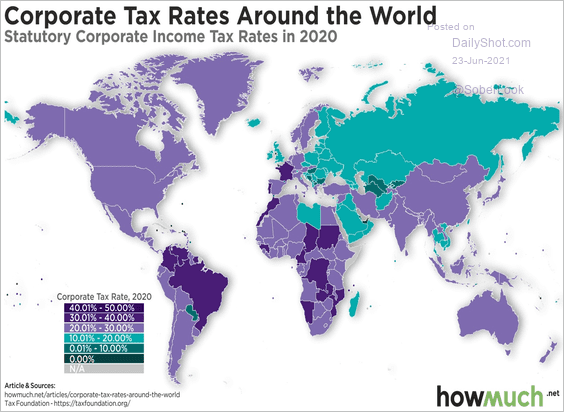 Source: @howmuch_net Read full article
3. Changes in US labor force participation rates:
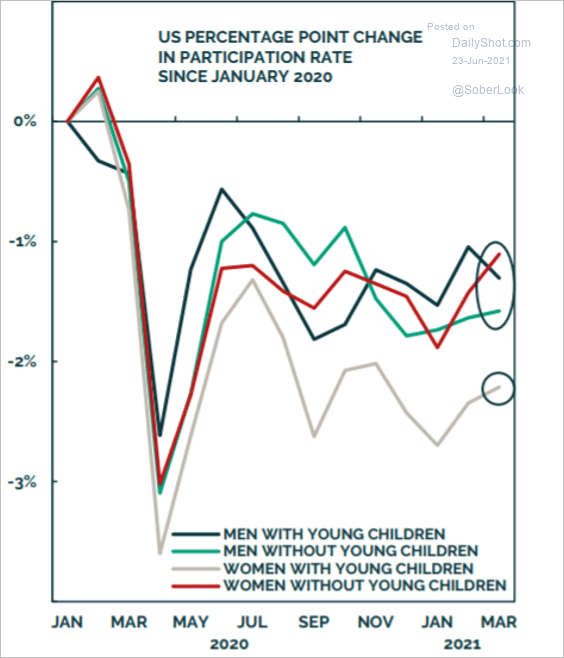 Source: BCA Research
4. Deaths due to long working hours:
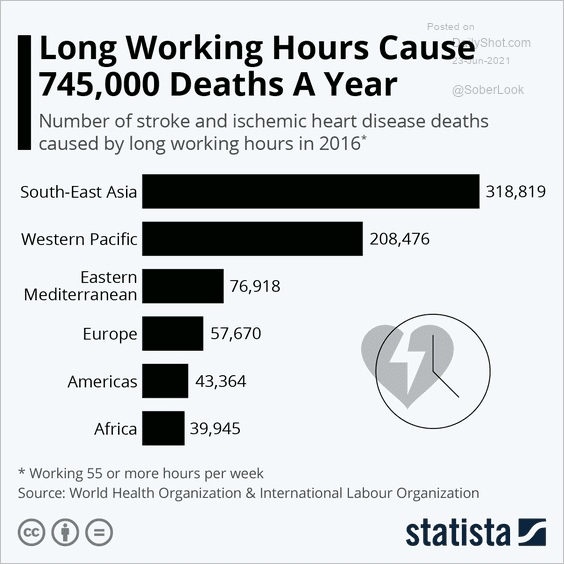 Source: Statista
5. Fraudulent emergency unemployment benefits claims in New York:
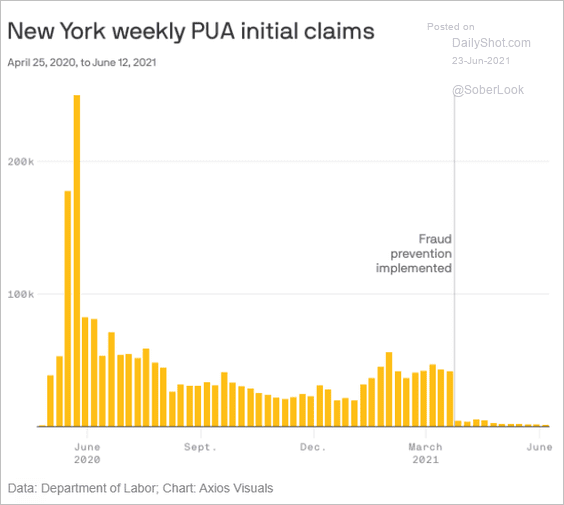 Source: @axios Read full article
6. Top 50 fast-food chains:
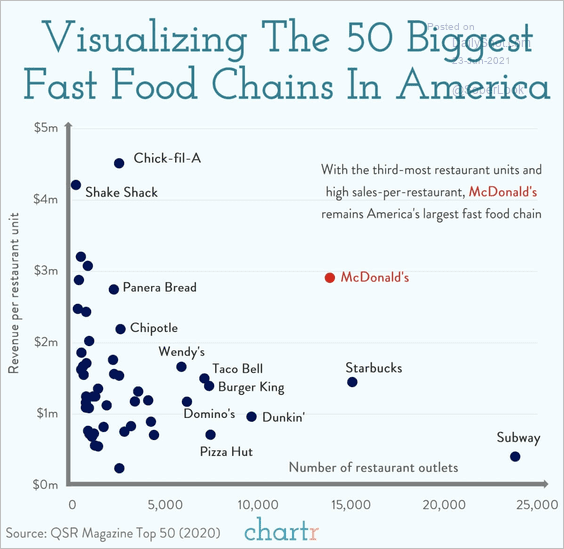 Source: @chartrdaily Read full article
7. Where do you charge your electric vehicle?
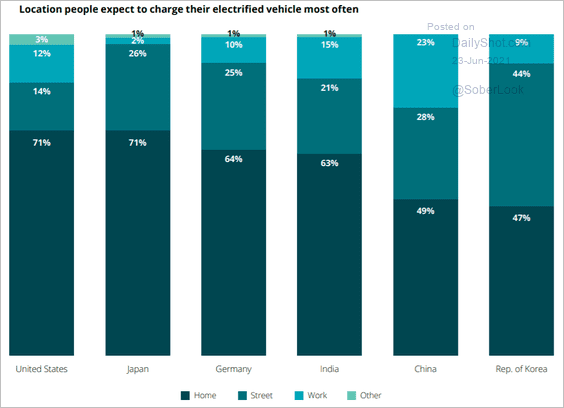 Source: Deloitte Read full article
8. Tech companies’ revenue per minute:
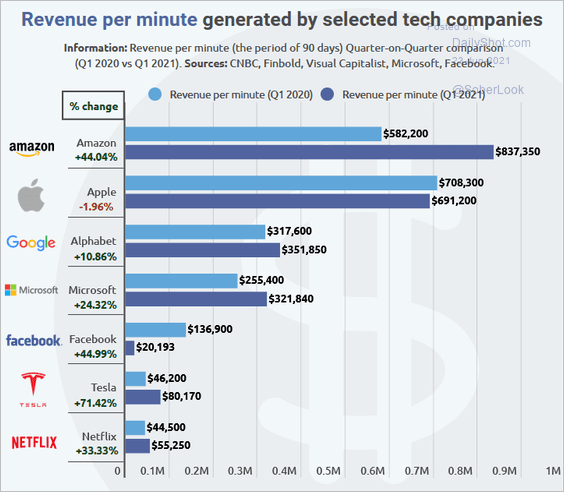 Source: Finbold.com Read full article
9. Can hydrogen be used as fuel in aviation?
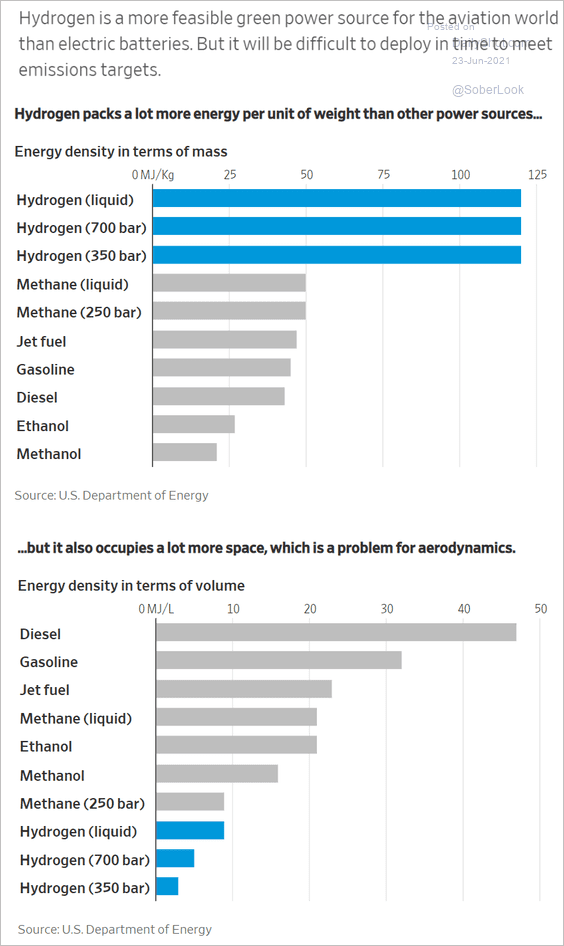 Source: @WSJ Read full article
10. Gen-Z mobile social users, by platform:
 Source: Insider Intelligence Read full article
11. Favorite entertainment activity:
 Source: Deloitte Read full article
12. Nostalgic comedy viewing:
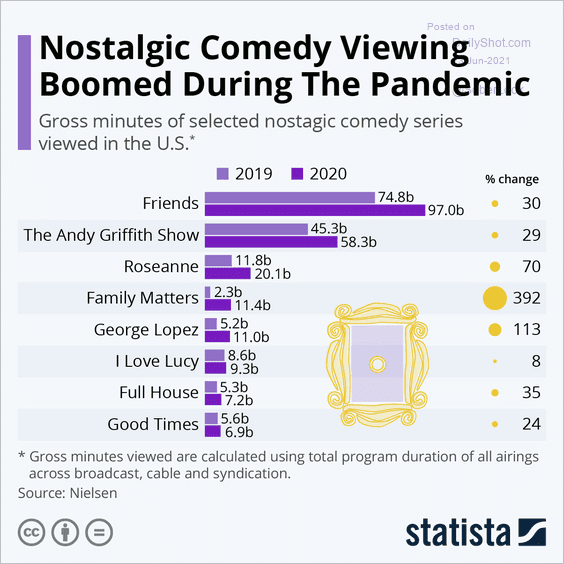 Source: Statista
——————–
Back to Index