
The Daily Shot: 30-Jun-21
• The United States
• The United Kingdom
• The Eurozone
• Europe
• Japan
• Asia – Pacific
• China
• Emerging Markets
• Energy
• Equities
• Rates
• Global Developments
• Food for Thought
The United States
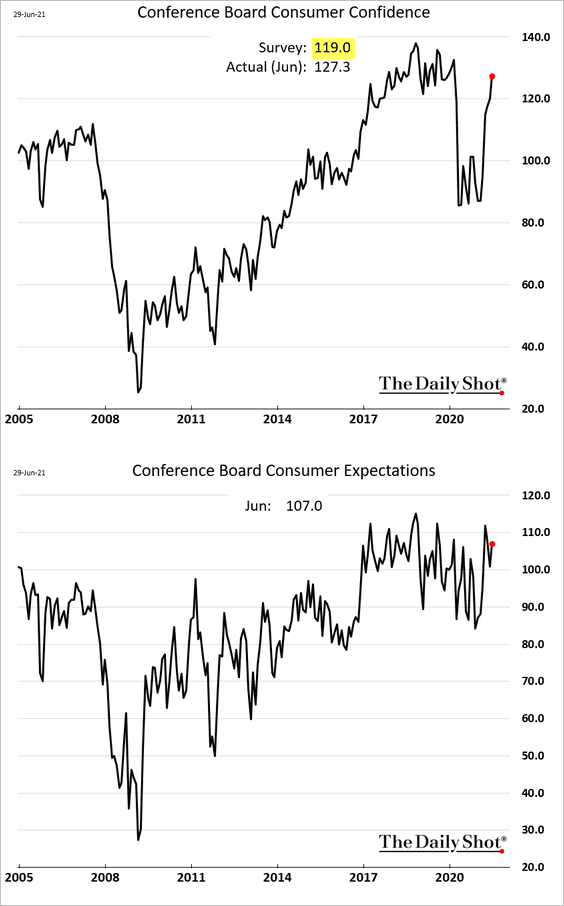
1. The Conference Board Consumer Confidence Index jumped this month, topping expectations.
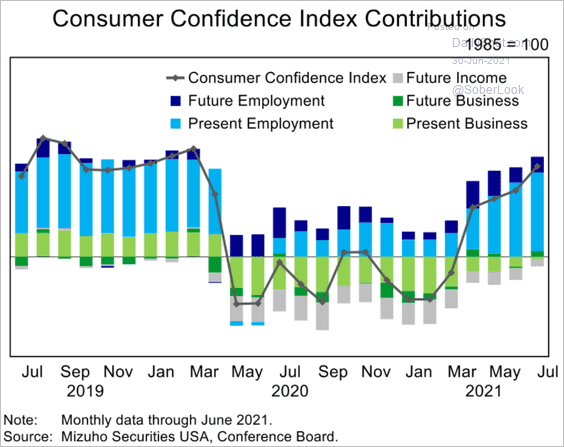
Here are the contributions to this index.
 Source: Mizuho Securities USA
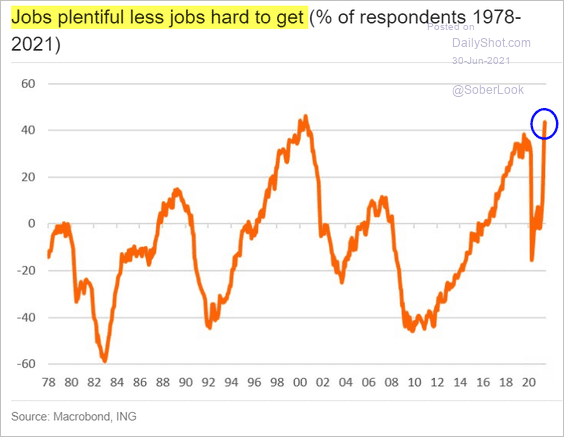
• The labor differential hit the highest level in over two decades, pointing to rising confidence in the job market (a chart for our friends at the Fed).
 Source: ING
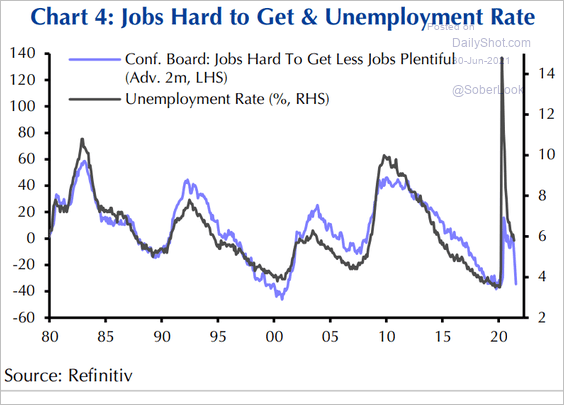
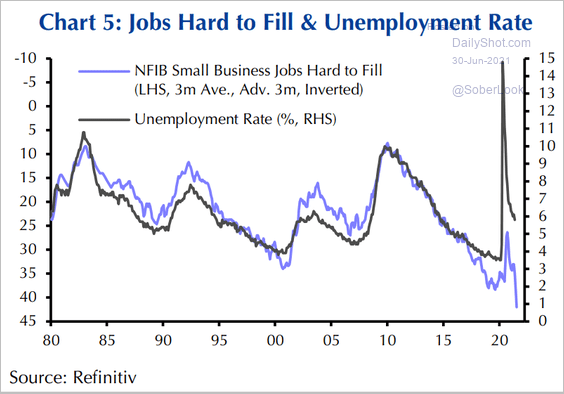
Based on the Conference Board’s “jobs hard to get” index, the unemployment rate is rapidly heading lower.
 Source: Capital Economics
The NFIB small business data support this assessment.
 Source: Capital Economics
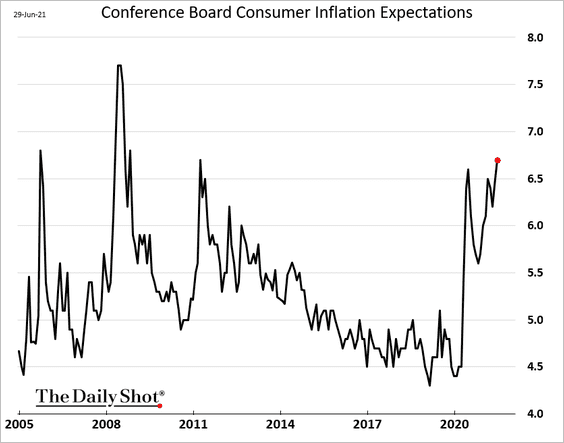
• Just as we saw in the U. Michigan survey, households’ inflation expectations remain elevated.
——————–
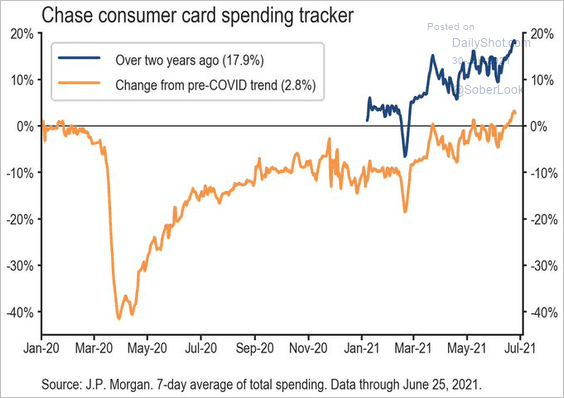
2. Credit/debit card data continue to show robust consumer spending.
– JP Morgan:
 Source: JP Morgan; @carlquintanilla
– Bank of America:
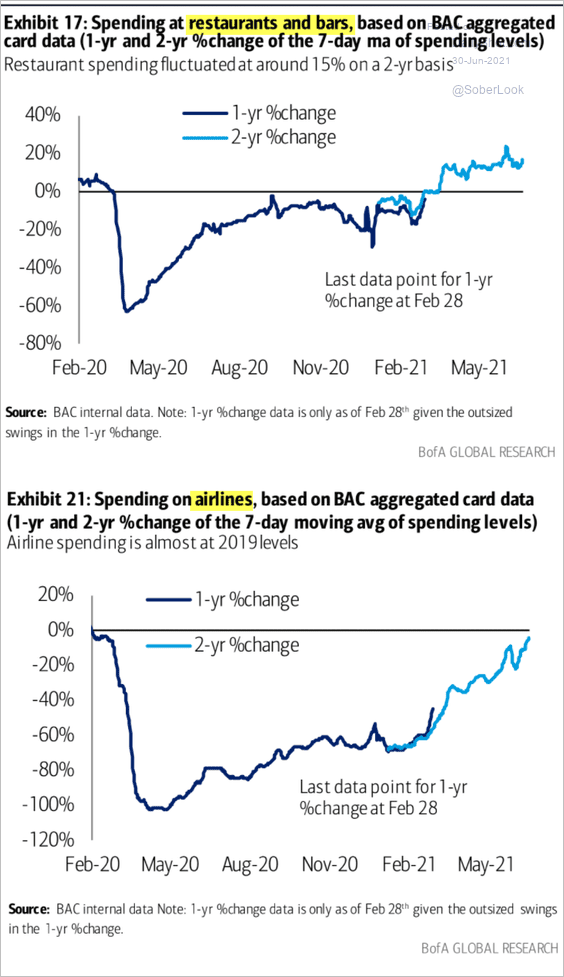 Source: BofA Global Research
• Many households are sitting on sizeable excess savings, which may support further spending.
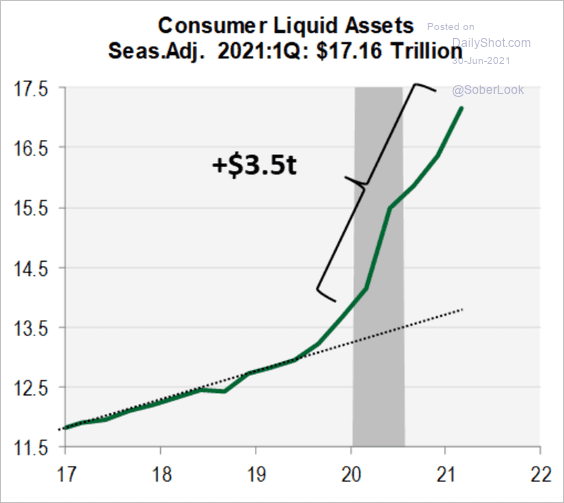 Source: Cornerstone Macro
• According to a survey from Evercore ISI, retailers are ecstatic.
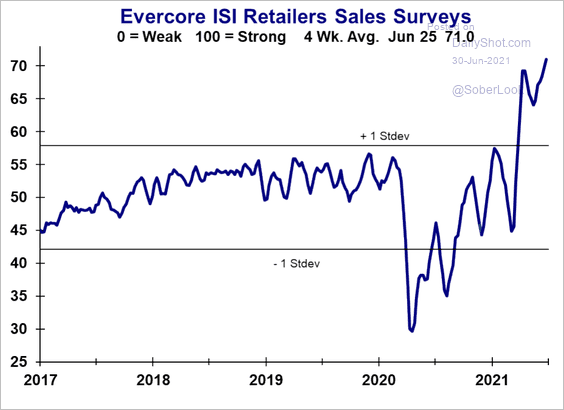 Source: Evercore ISI
And this time, they have pricing power – the most in 15 years.
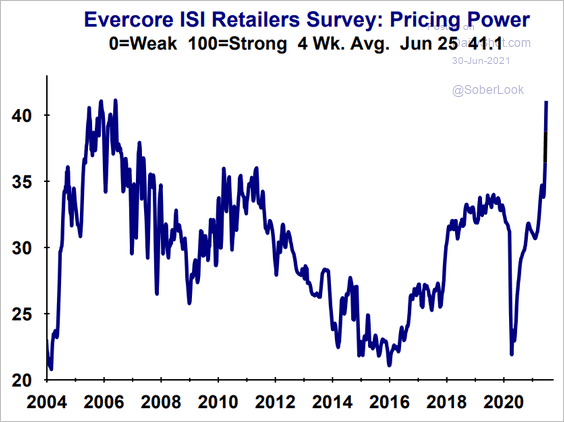 Source: Evercore ISI
——————–
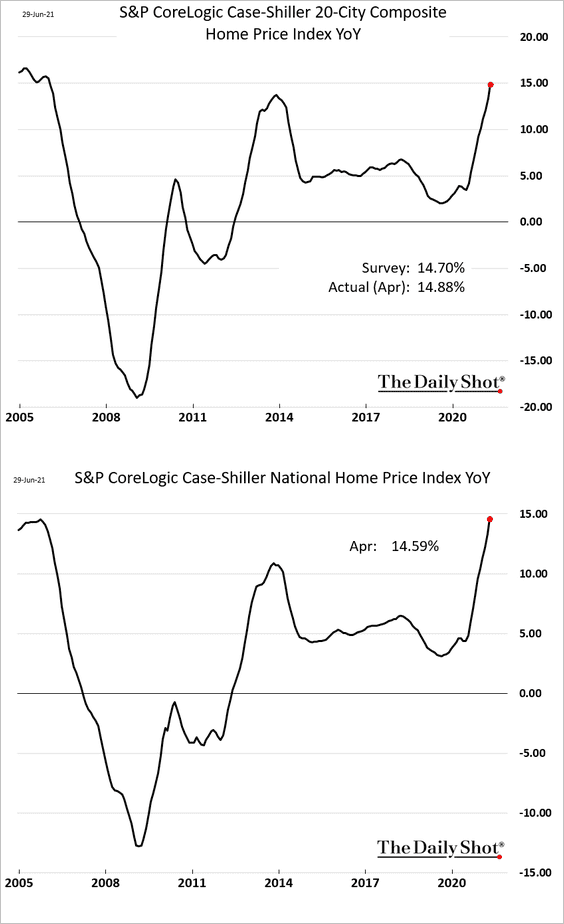
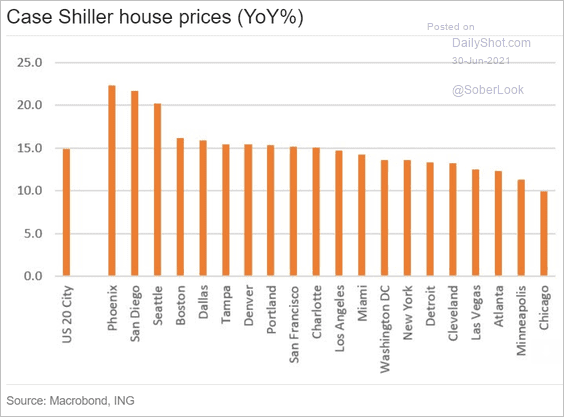
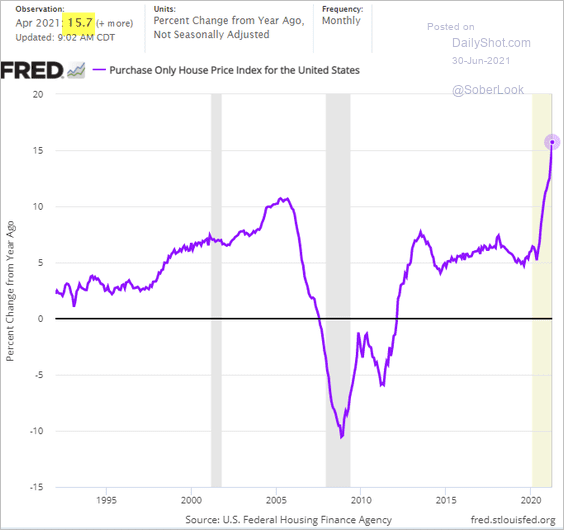
3. Home prices continue to surge. The 14.6% year-over-year gain at the national level (2nd chart) is a record high for this index.
• Below are the price increases by metro area.
 Source: ING
• A similar index from FHFA shows a gain of 15.7% vs. April of 2020.
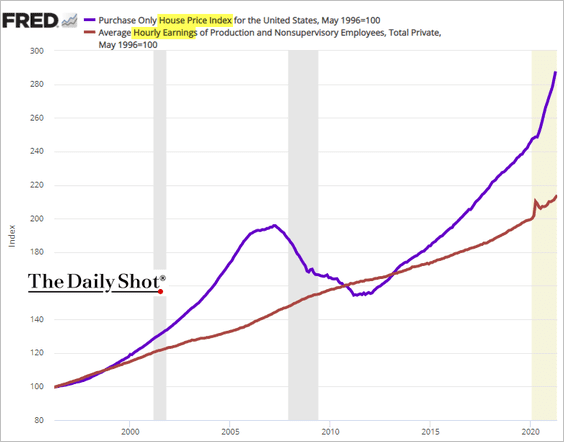
• Home prices are rapidly outpacing wages.
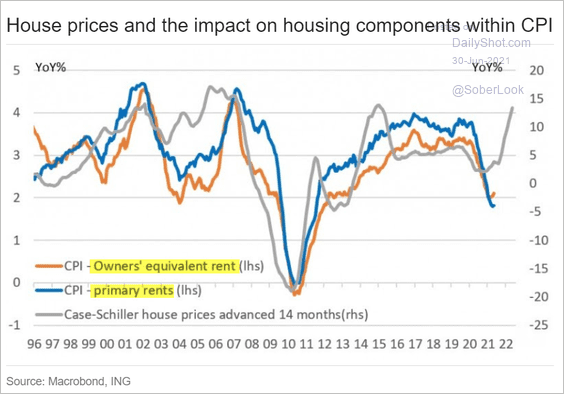
• The home price surge suggests significant gains in housing-related components of the CPI.
 Source: ING
——————–
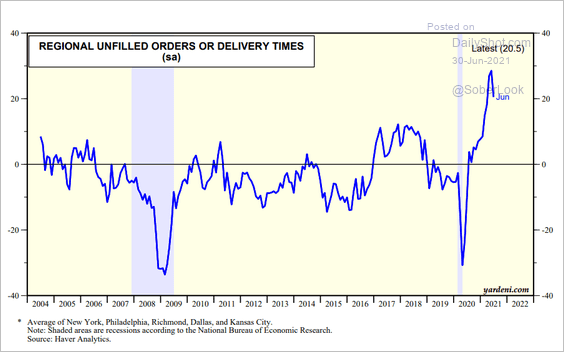
4. This month’s regional Fed manufacturing reports point to a peak in supply-chain bottlenecks. To be sure, the problem will plague US businesses for months to come, but this could be the beginning of the end.
 Source: Yardeni Research
Back to Index
The United Kingdom
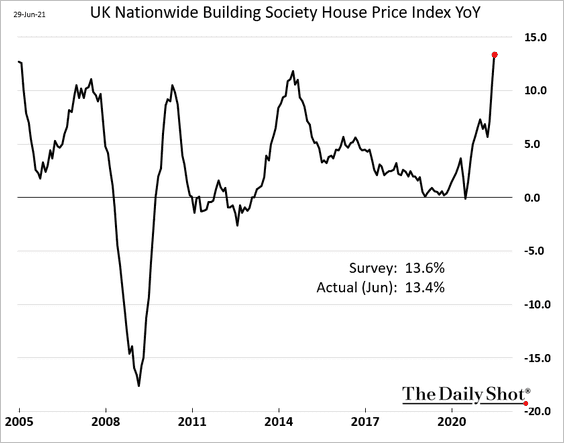
1. Home price appreciation hit the highest level in years.
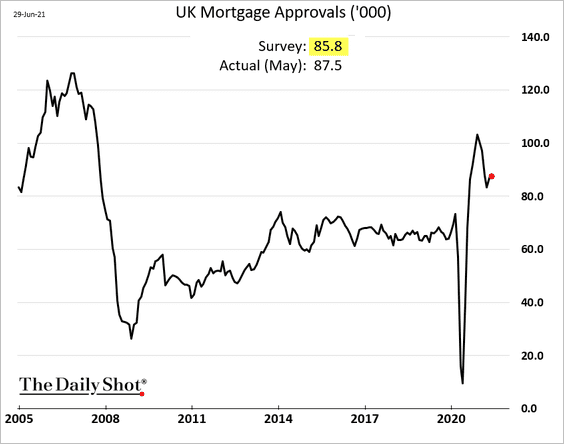
2. Mortgage approvals topped forecasts.
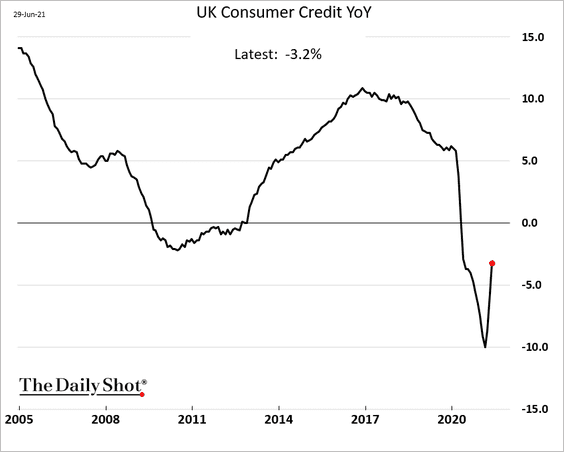
And consumer credit appears to have bottomed.
——————–
3. Credit card spending seems to be moderating.
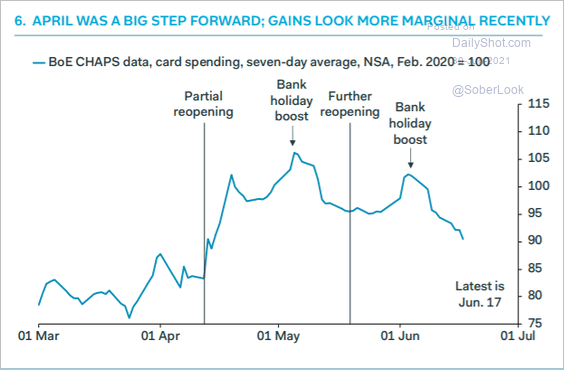 Source: Pantheon Macroeconomics
4. These charts illustrate the shift from self-employed and part-time work to full-time.
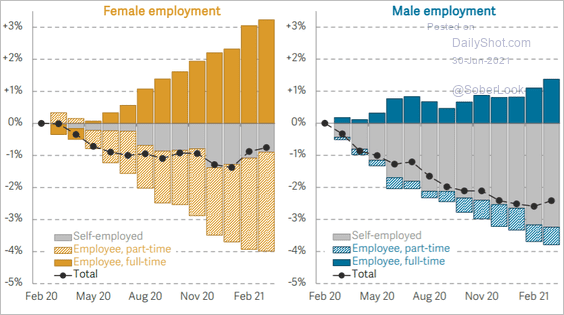 Source: Resolution Foundation Read full article
5. Public transport usage remains well below pre-COVID levels.
![]() Source: Pantheon Macroeconomics
Source: Pantheon Macroeconomics
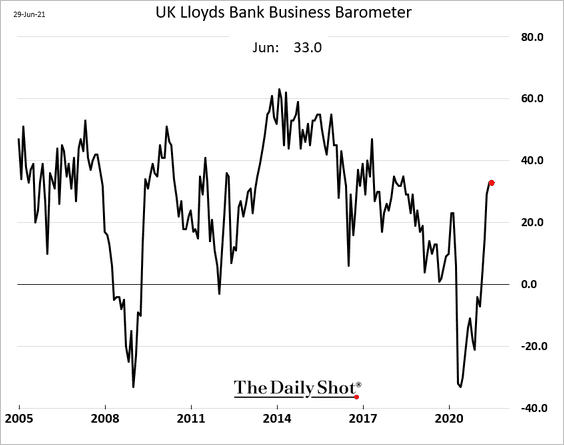
6. The Lloyds Business Barometer paused in June but remained well above pre-COVID levels.
7. Businesses continue to struggle with Brexit-related trade restrictions.
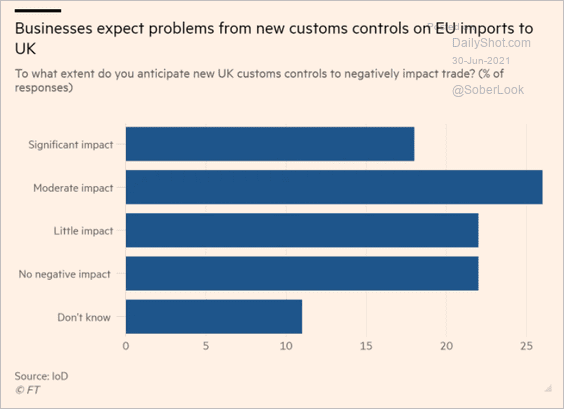 Source: @financialtimes Read full article
8. Who is looking to move?
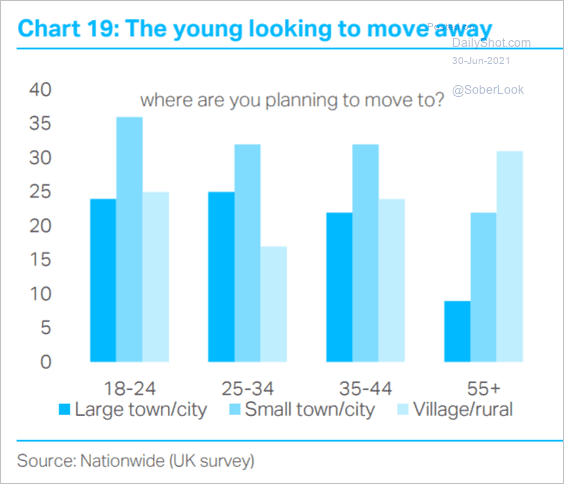 Source: TS Lombard
Back to Index
The Eurozone
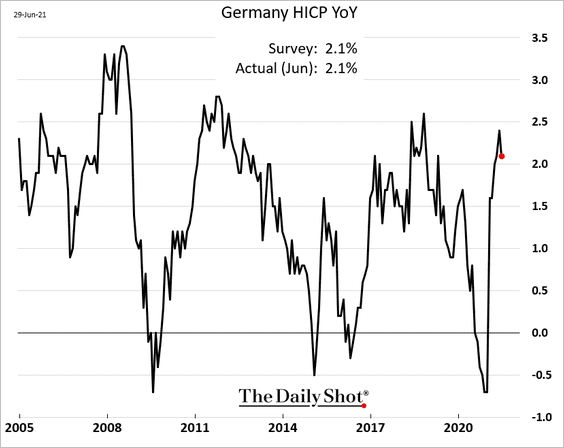
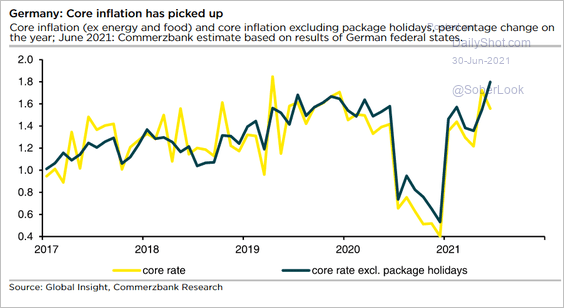
1. German inflation report was roughly in line with expectations.
The core inflation excluding vacation packages (which tend to be highly volatile) is rising quickly.
 Source: Commerzbank Research
Here is a forecast for core inflation from Pantheon Macroeconomics.
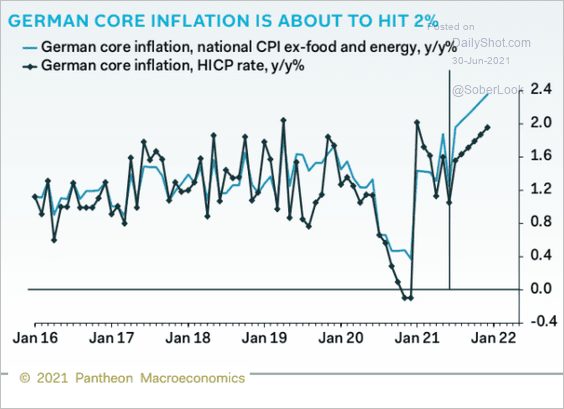 Source: Pantheon Macroeconomics
——————–
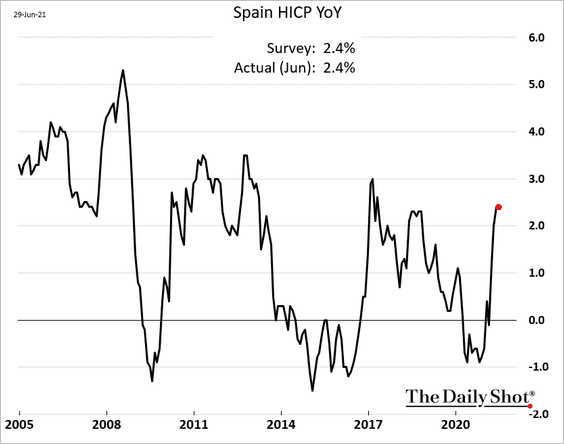
2. This chart shows Spain’s consumer inflation.
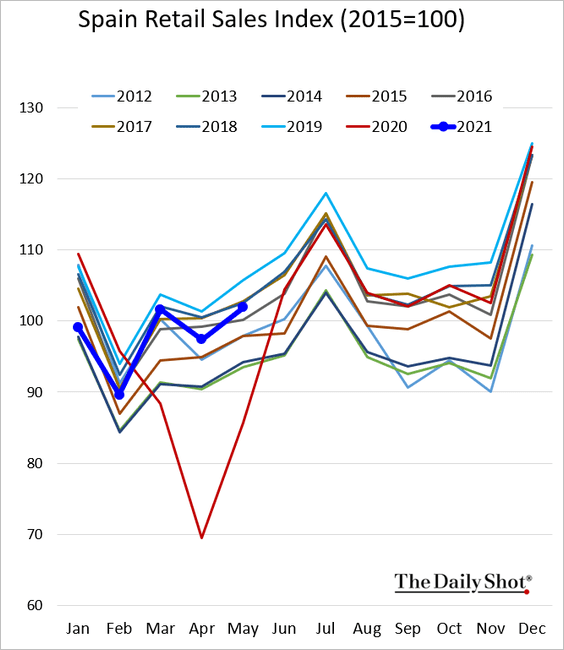
Separately, Spanish retail sales remain well below pre-COVID levels.
——————–
3. At the Eurozone level, economists expect inflation to moderate next year.
 Source: Barclays Research
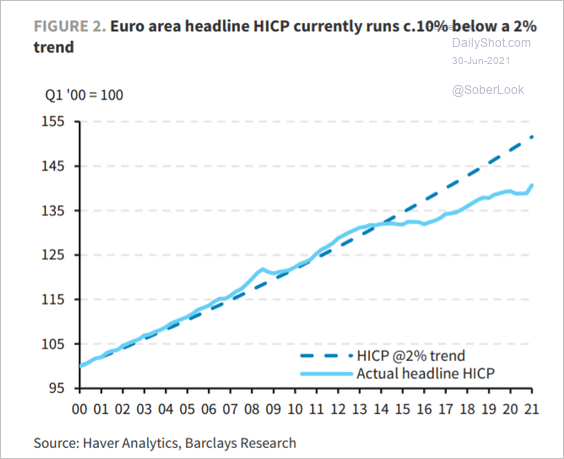
Prices are still running well below the 2% trend line.
 Source: Barclays Research
——————–
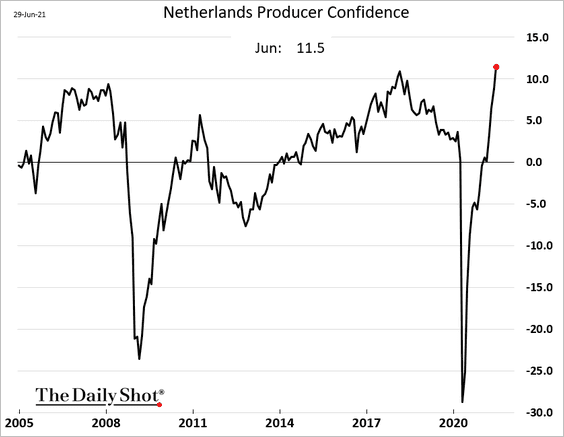
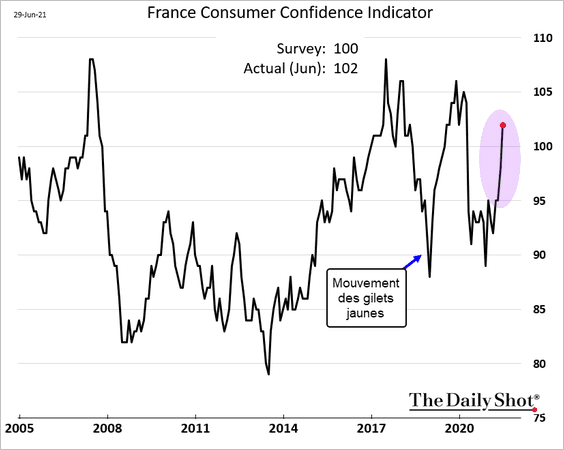
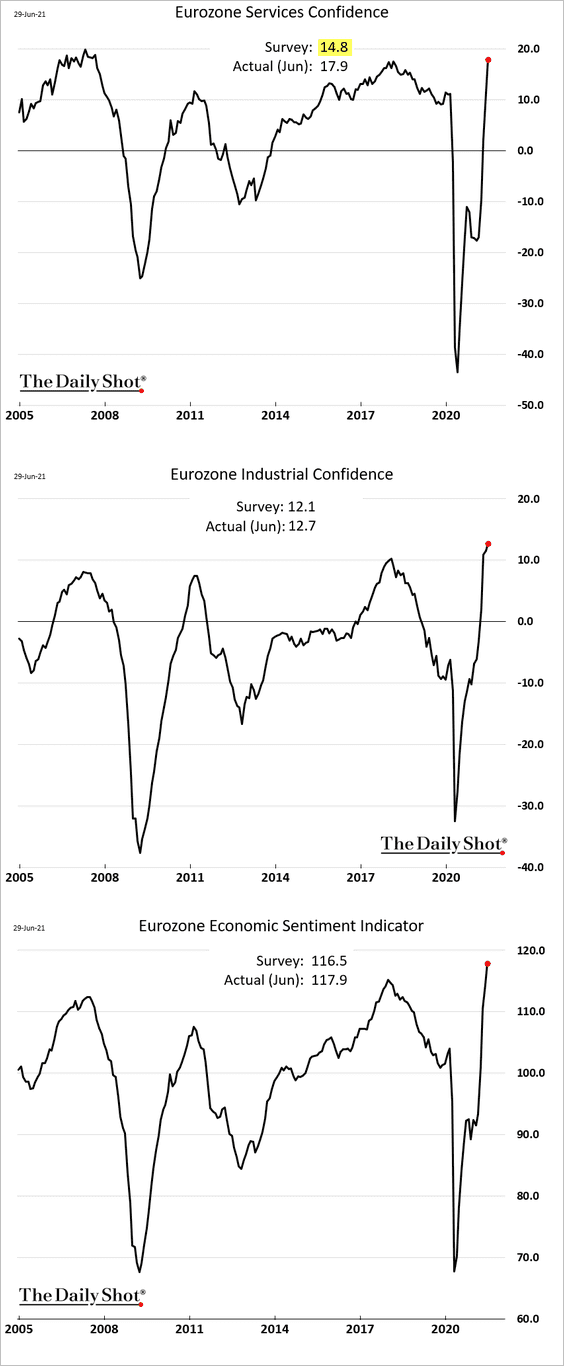
4. Euro-area sentiment indicators are surging.
• Dutch producer confidence:
• French consumer confidence:
• Sentiment at the Eurozone level (services surprised to the upside):
——————–
5. Euro-area household lending has been relatively stable. However, corporate loan flows were negative for the second month in a row.
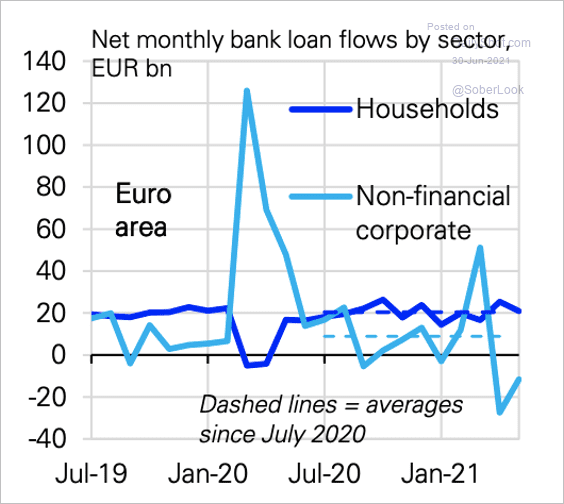 Source: Deutsche Bank Research
Back to Index
Europe
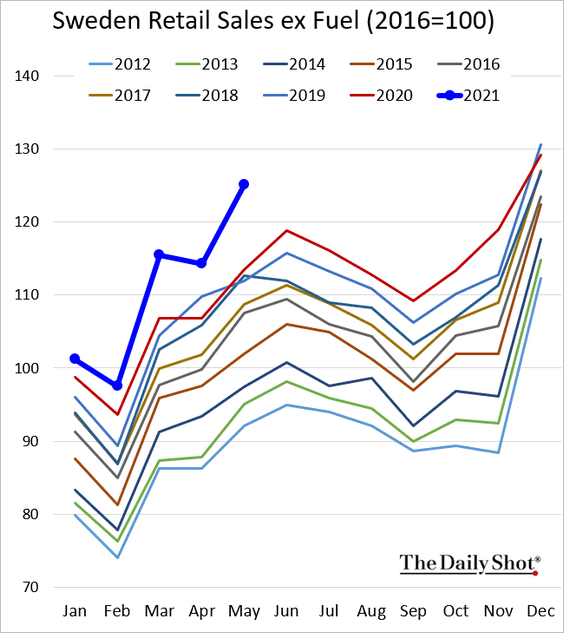
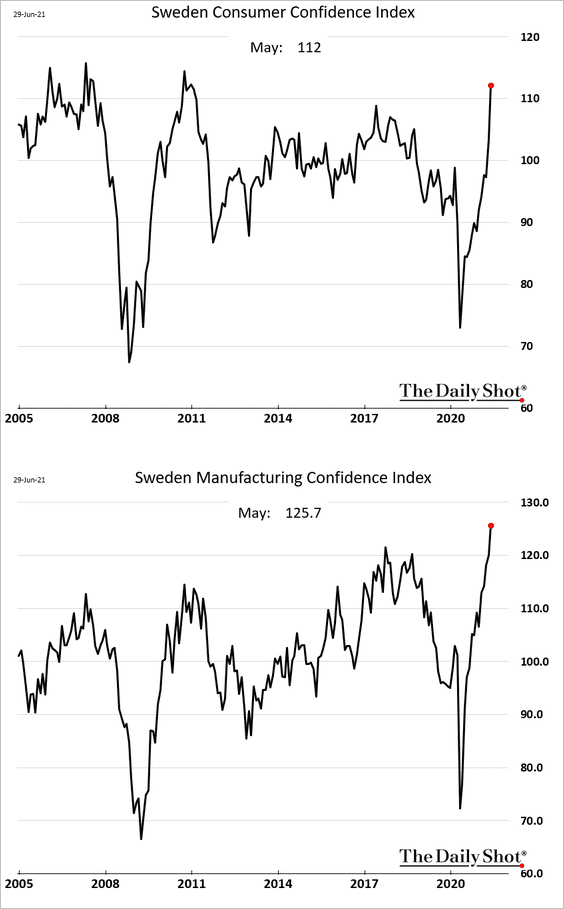
1. Let’s begin with Sweden.
• Retail sales are surging.
• Sentiment indicators are hitting multi-year highs.
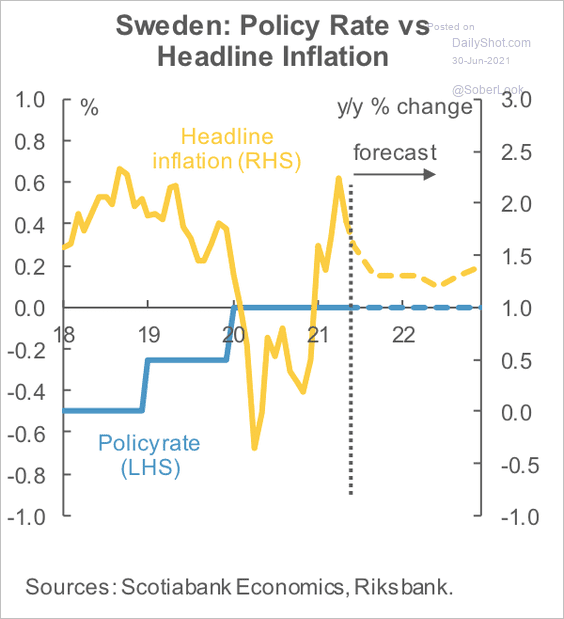
• Scotiabank expects Sweden’s Riksbank to retain a cautious bias on raising rates, potentially forecasting a deceleration of inflationary pressures.
 Source: Scotiabank Economics
——————–
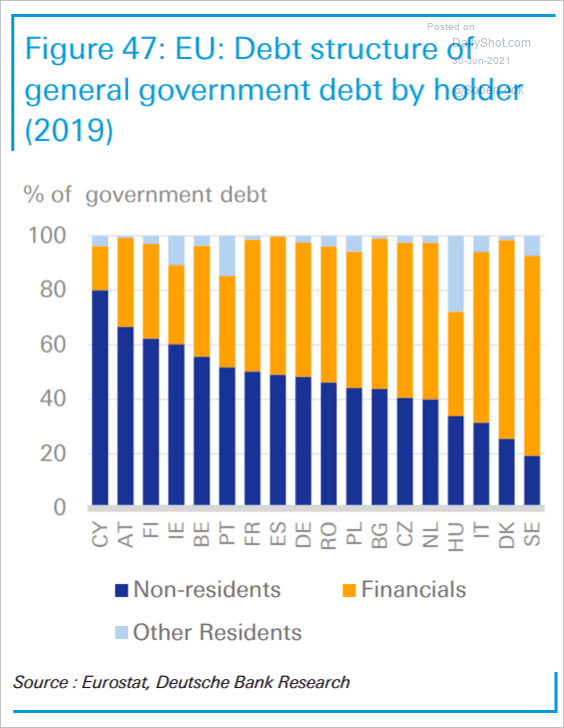
2. Who holds EU government debt?
 Source: Deutsche Bank Research
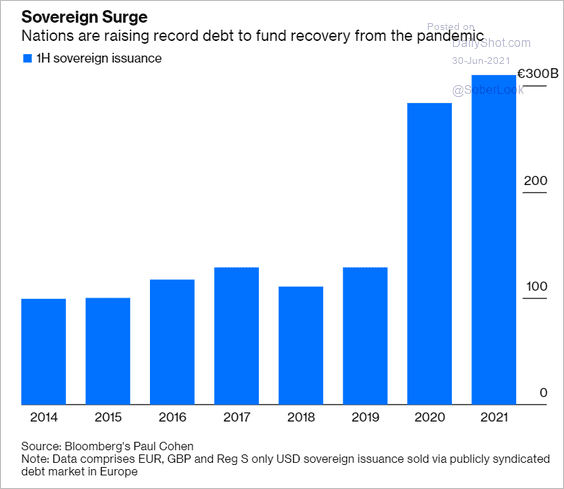
3. Sovereign debt issuance hit record levels this year, …
 Source: @marcusashworth, @bopinion Read full article
… boosted by EU COVID bonds.
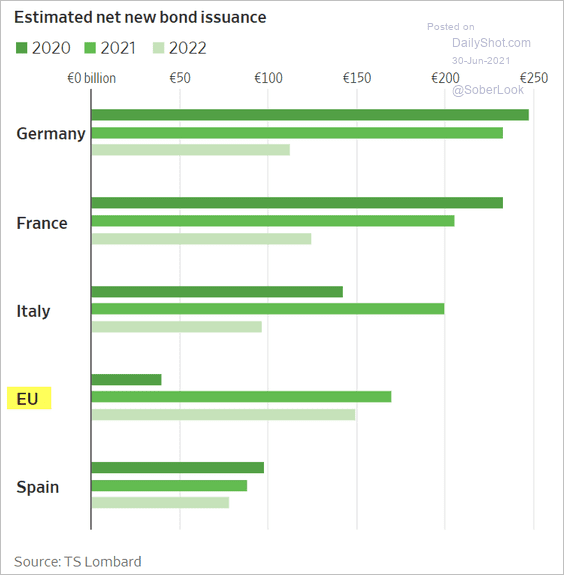 Source: @WSJ Read full article
——————–
4. Right-wing parties are less favorable toward the EU.
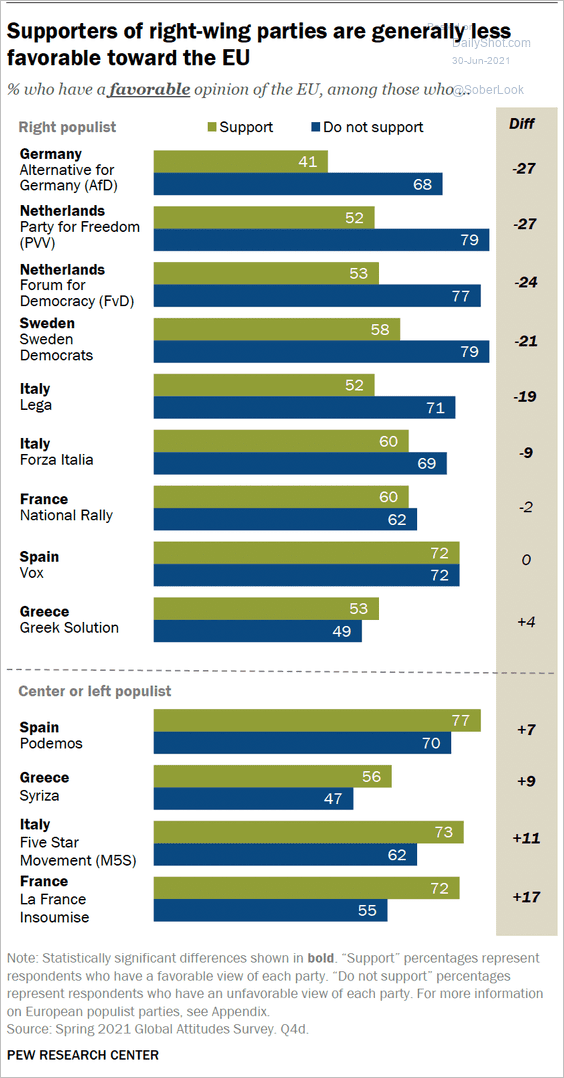 Source: Pew Research Center Read full article
5. Battery manufacturing has been surging in the EU.
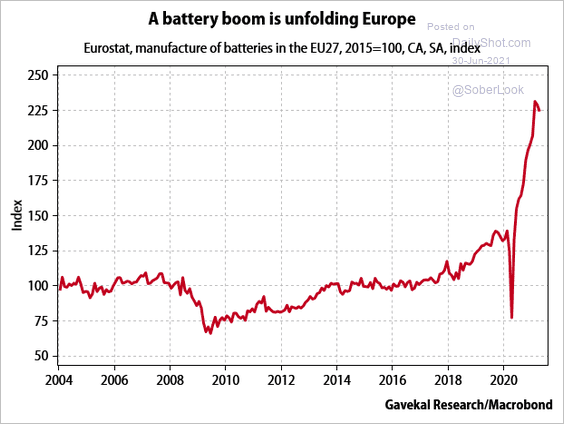 Source: Gavekal Research
Back to Index
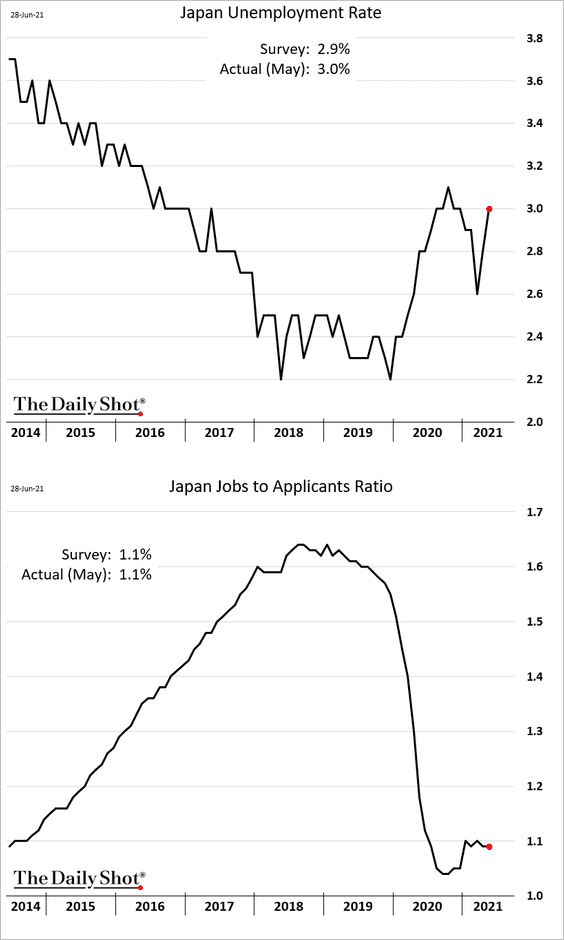
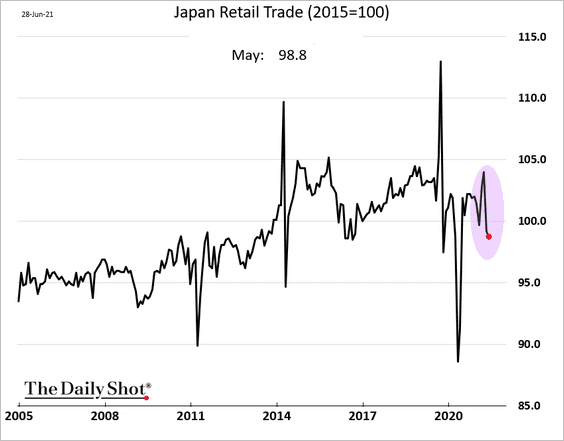
Japan
1. The labor market isn’t recovering.
2. Retail sales weakened further in May.
3. Industrial production tumbled.
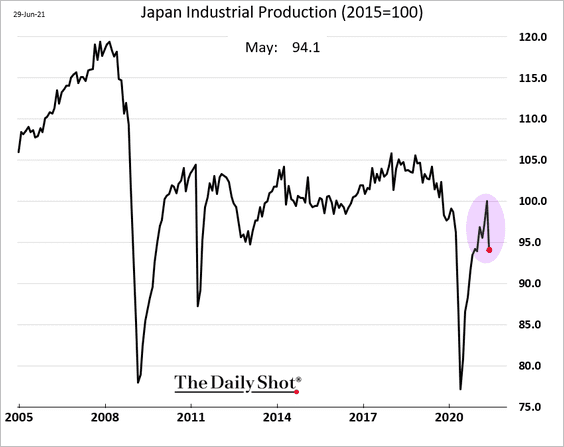
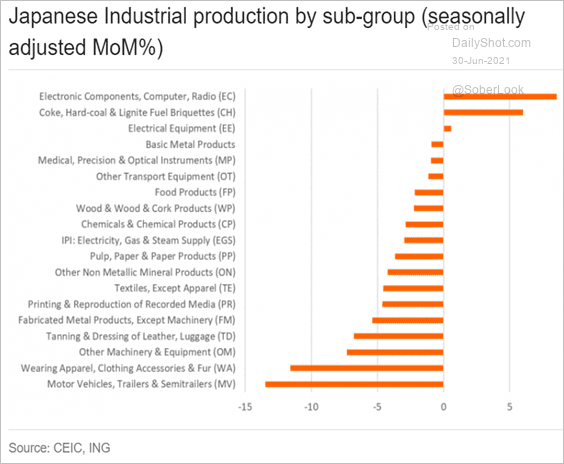 Source: ING
Back to Index
Asia – Pacific
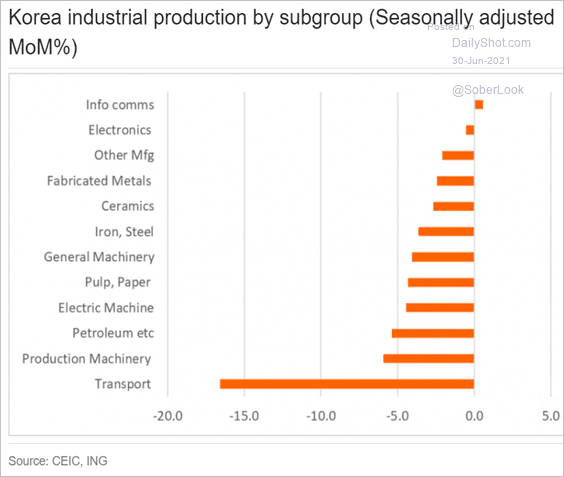
1. South Korea’s industrial production has been moderating but remains above pre-COVID levels.
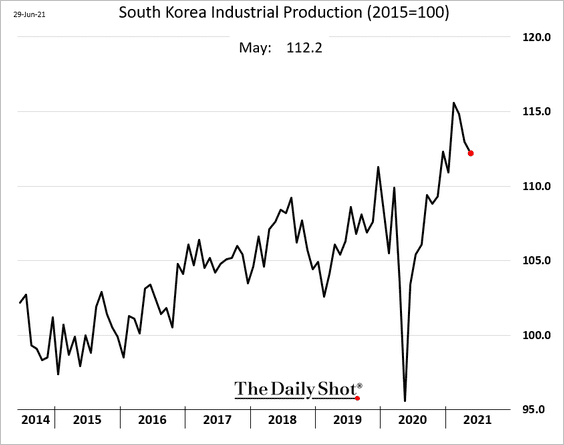
Most sectors saw a decline in output last month.
 Source: ING
——————–
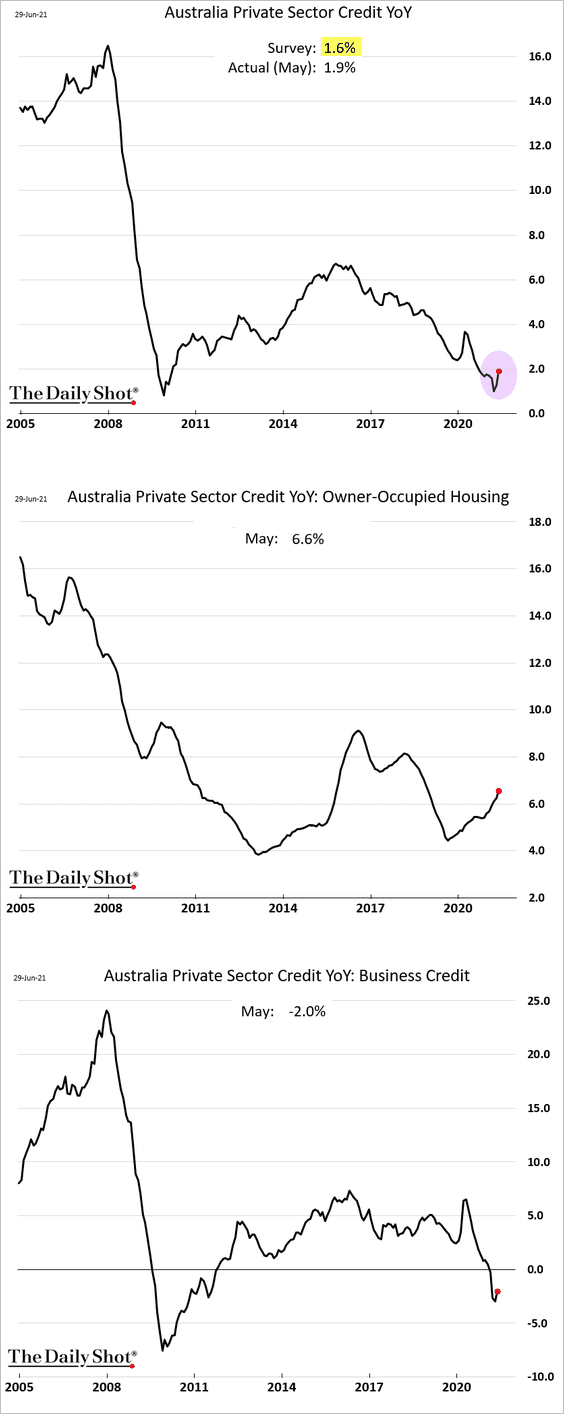
2. Australia’s private-sector credit growth has bottomed.
3. Volatility in Asian equity markets is at pre-COVID levels.
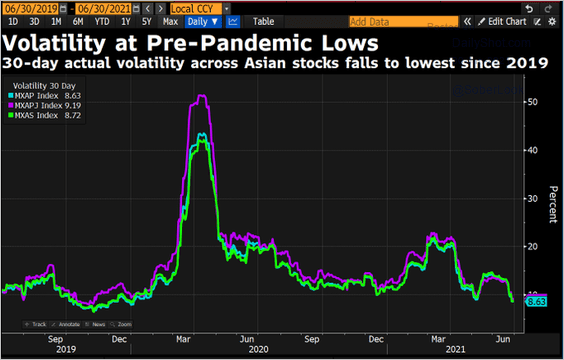 Source: @DavidInglesTV
Back to Index
China
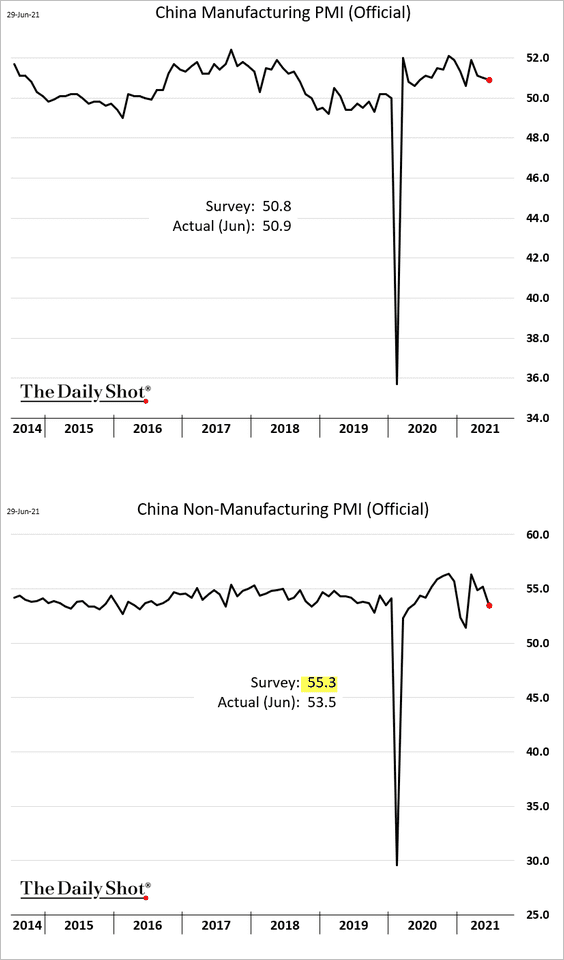
1. Manufacturing growth remained relatively stable this month, but services decelerated.
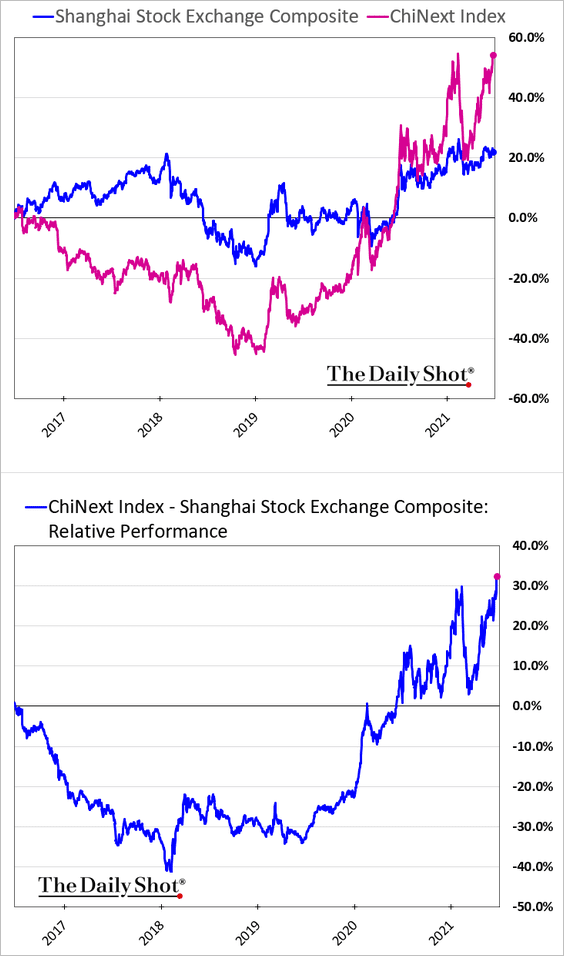
2. Small growth stocks (ChiNext) have been popular lately.
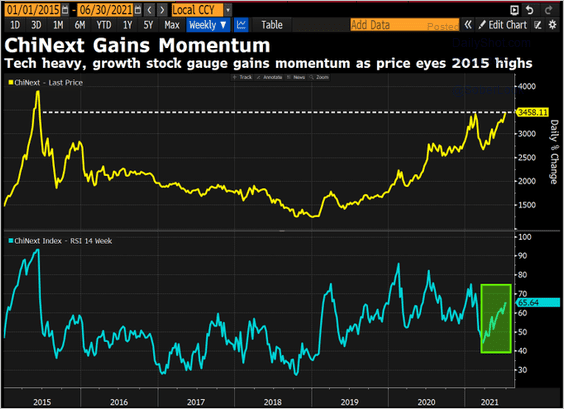 Source: @DavidInglesTV
 h/t John Liu
——————–
3. The recent rise in producer prices points to higher export prices (China exporting inflation).
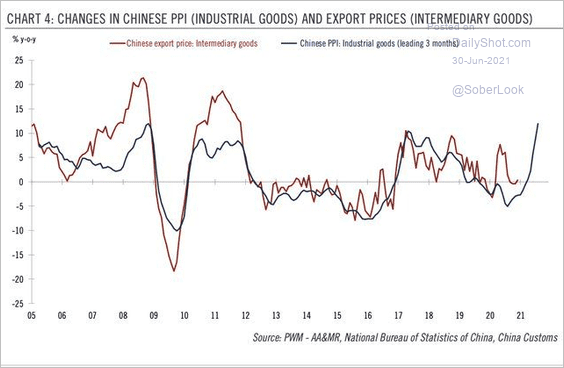 Source: Gustavo Fuhr; Pictet Wealth Management
4. Barriers to foreign direct investment have been easing (at least in theory).
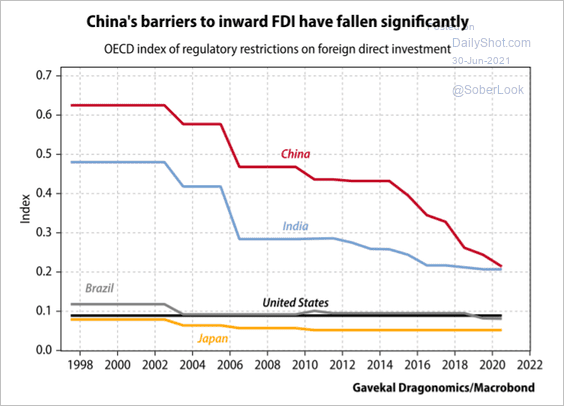 Source: Gavekal Research
Back to Index
Emerging Markets
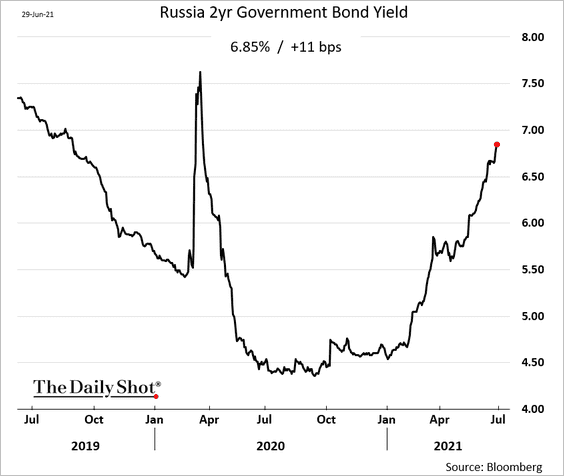
1. Russia’s central bank may get more aggressive in fighting inflation.
 Source: Bloomberg Read full article
Short-term bond yields keep climbing.
——————–
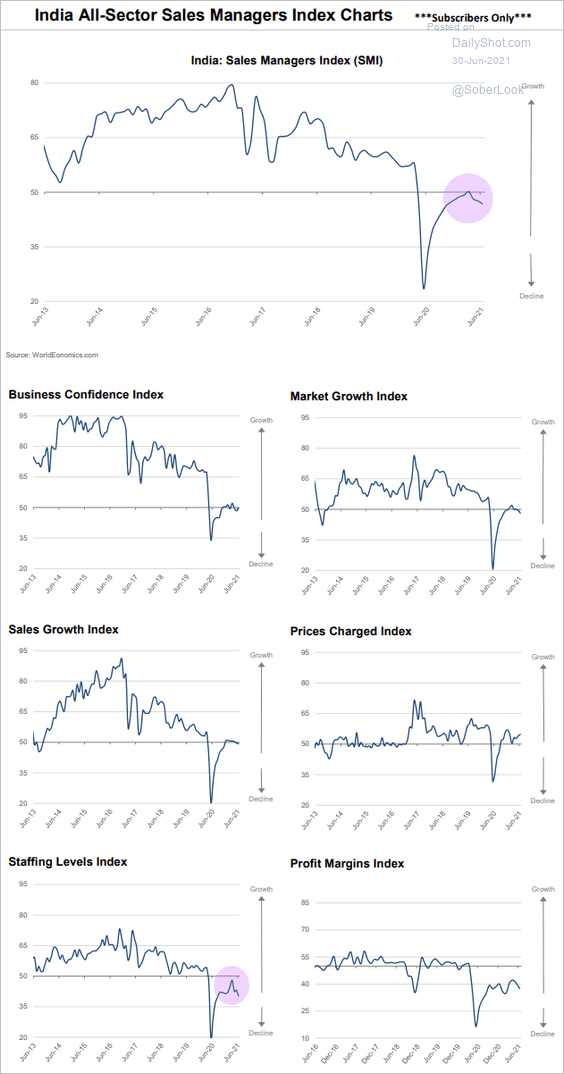
2. The World Economics SMI report for India shows a deepening recession.
 Source: World Economics
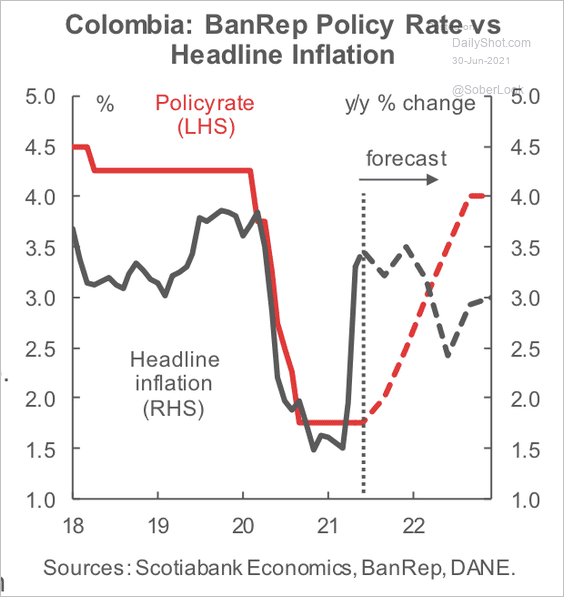
3. Scotiabank expects Colombia’s central bank to raise rates later this year.
 Source: Scotiabank Economics
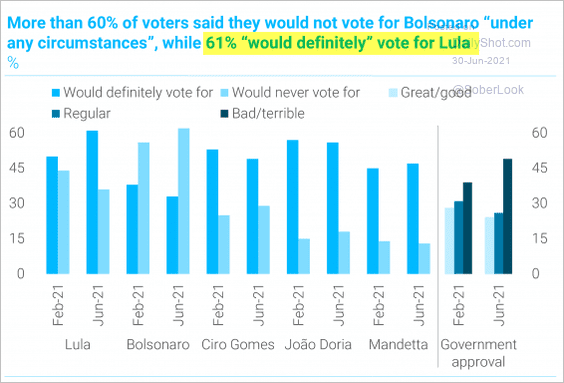
4. Will Luiz Inácio Lula da Silva make a comeback (see story)? Latin America is making a decisive shift to the left.
 Source: TS Lombard
5. This scatterplot shows external risks vs. inflation threat levels.
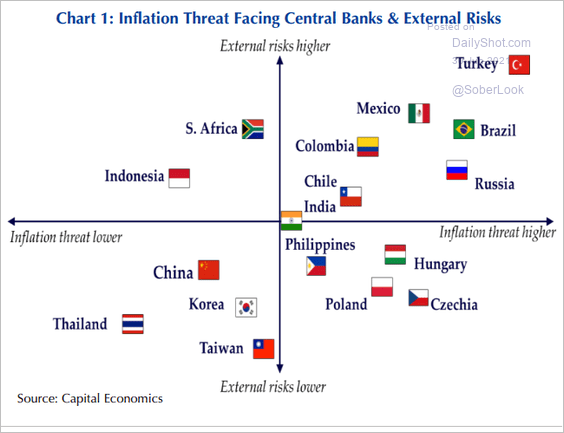 Source: Capital Economics
Back to Index
Energy
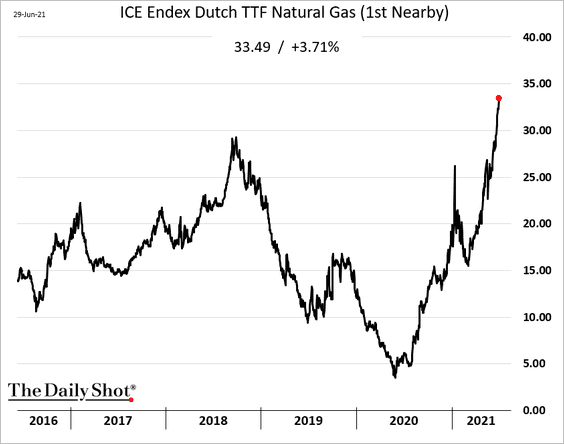
1. European natural gas prices continue to surge, further raising LNG demand.
2. OPEC has plenty of spare production capacity.
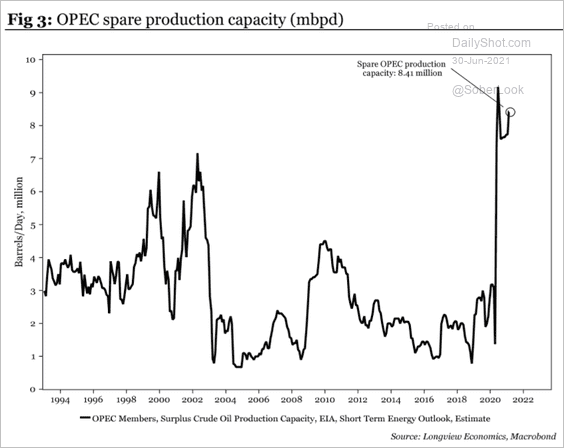 Source: Longview Economics
3. Next, we have some data on North American pipeline infrastructure.
• Pipeline capacity growth (through 2019/2020):
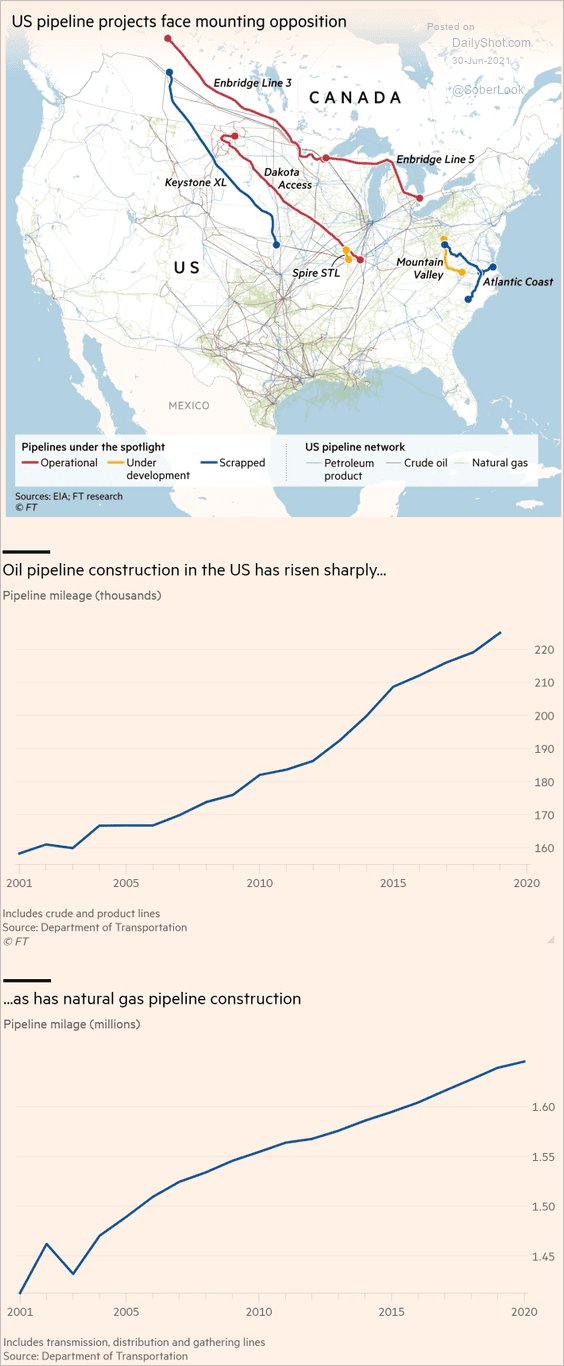 Source: @financialtimes Read full article
• A slowdown in 2021:
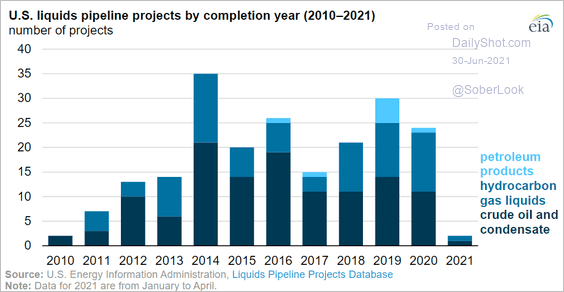 Source: @EIAgov Read full article
——————–
4. This chart shows US wind capacity by region:
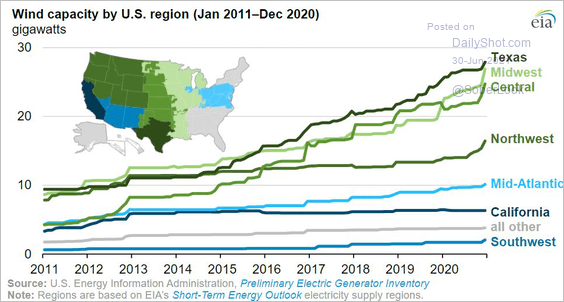 Source: @EIAgov Read full article
Back to Index
Equities
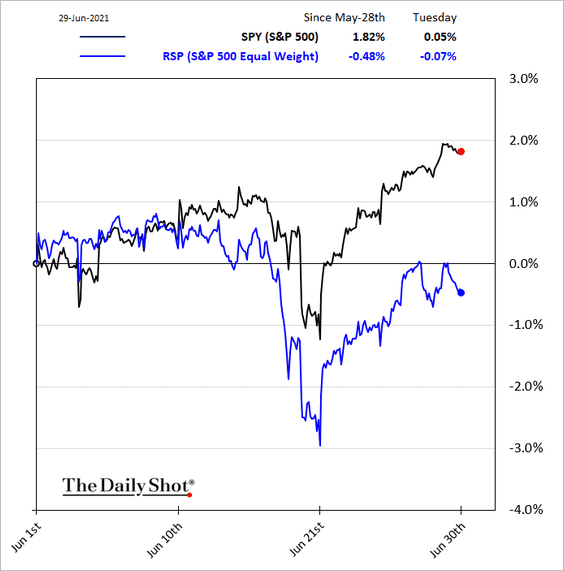
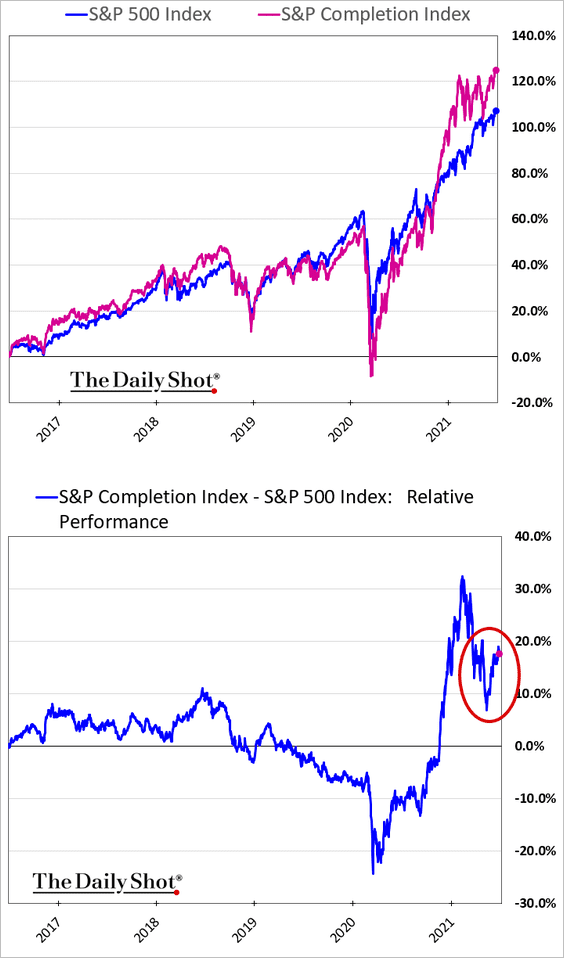
1. Smaller members of the S&P 500 have been underperforming.
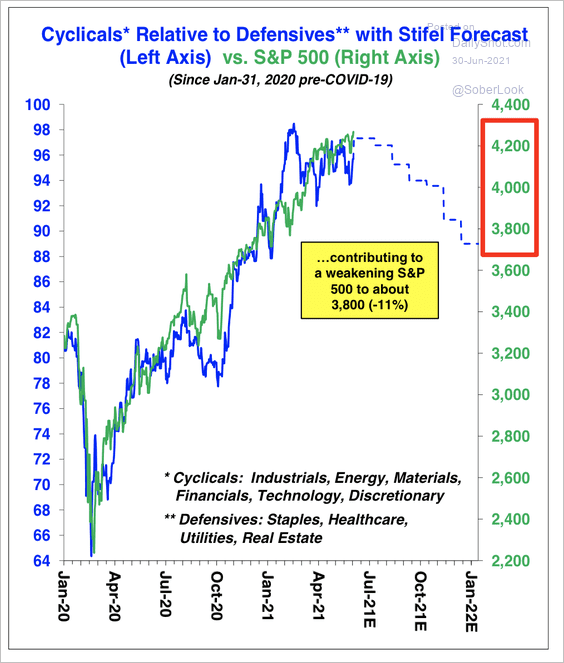
2. Stifel expects the cyclical/defensive recovery trade to correct in the second half of this year, along with the S&P 500 (2 charts).
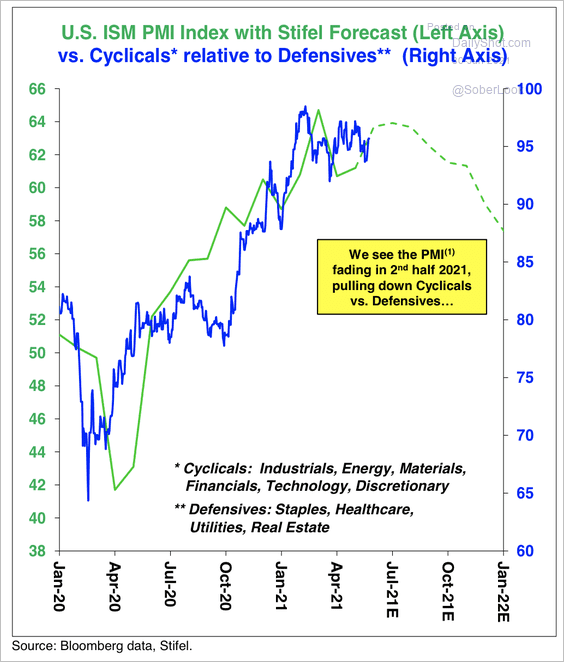 Source: Stifel
 Source: Stifel
——————–
3. Late/end-of-cycle stocks (typically defensive) have significantly underperformed over the past year.
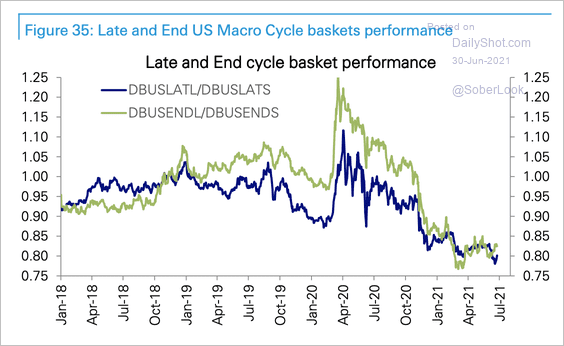 Source: Deutsche Bank Research
4. Money-losing companies have been raising a great deal of capital with secondary offerings.
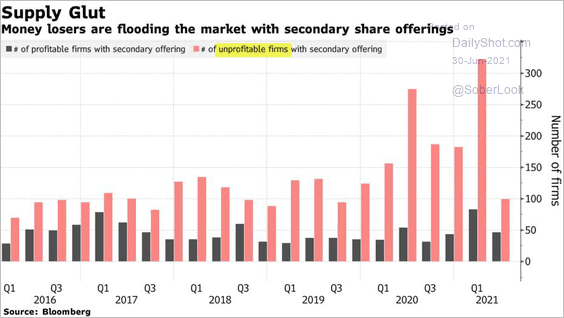 Source: @markets Read full article
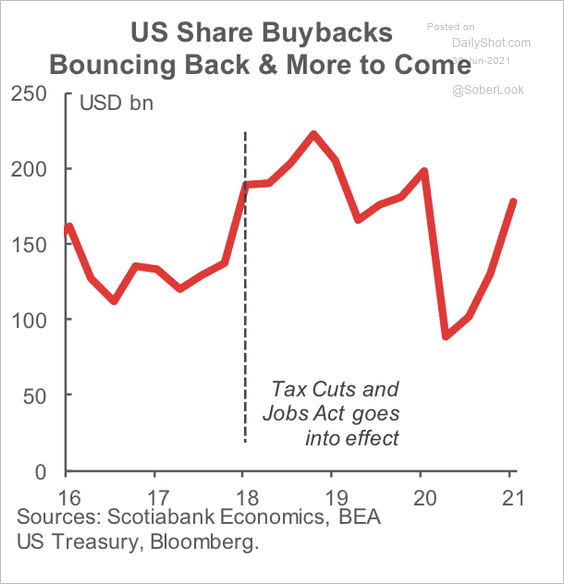
5. Share buybacks could continue to rise after banks received the green light from the Fed upon passing their stress tests, according to Scotiabank.
 Source: Scotiabank Economics
Here is the composition of the S&P 500 buyback yield:
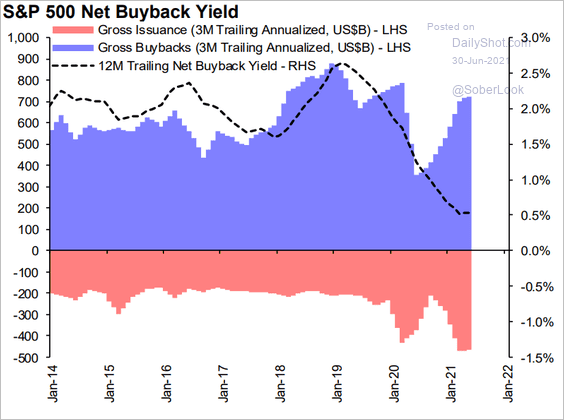 Source: Hugo Ste-Marie, Portfolio & Quantitative Strategy Global Equity Research, Scotia Capital
——————–
6. More firms are putting out positive guidance.
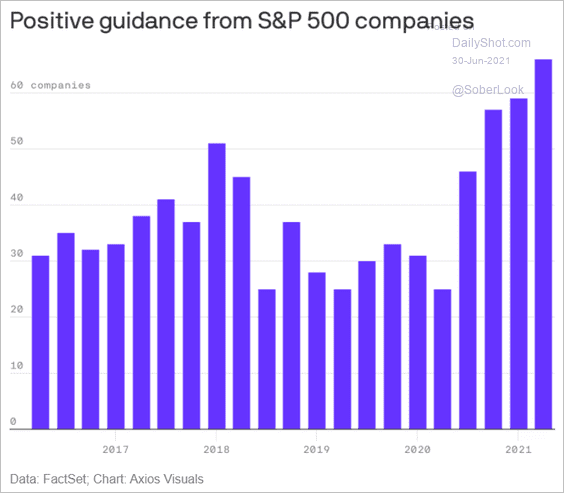 Source: @axios Read full article
7. Net bullish option volume has risen over the past month, led by retail traders.
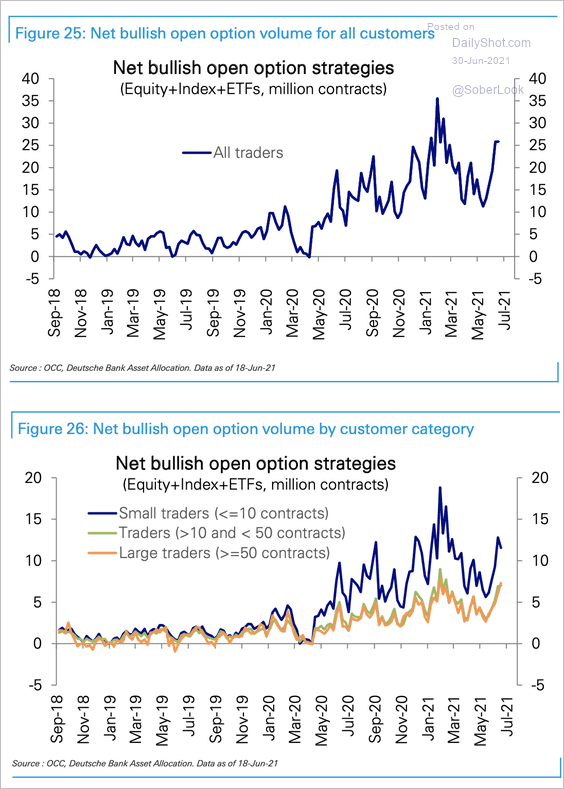 Source: Deutsche Bank Research
At the same time, investors positioning for downside protection in equity markets have been buying out-of-the-money put options. This has led to put volatility skews trading at some of the richest levels in the past few years, according to III Capital Management. That’s why we saw the CBOE SKEW Index hitting record highs (see chart).
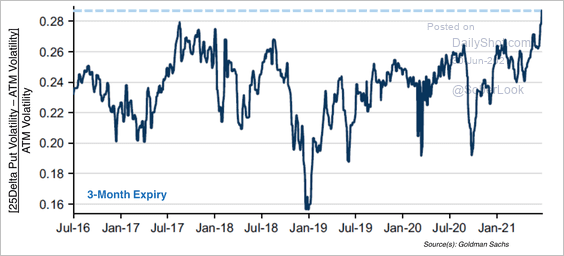 Source: Goldman Sachs, III Capital Management
——————–
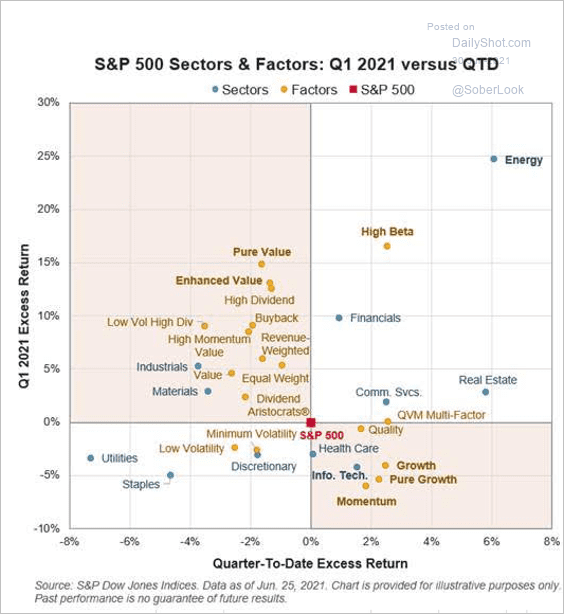
8. How did different sectors and equity factors perform in Q2 vs. Q1?
 Source: S&P Global Market Intelligence
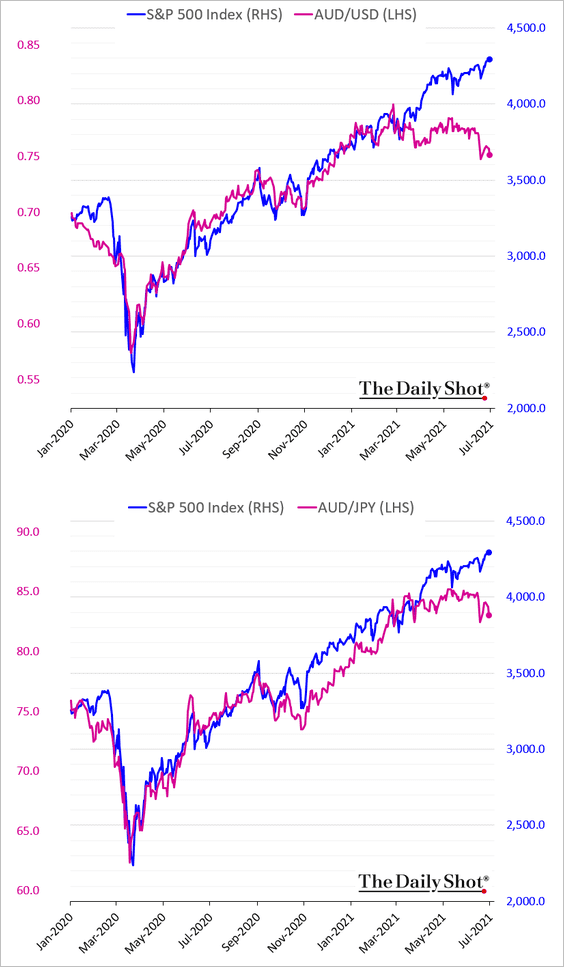
9. The Australian dollar, which is an indicator of global risk appetite, continues to underperform US stocks.
10. Stocks not included in the S&P 500 have been outperforming lately.
 h/t @TheOneDave
Back to Index
Rates
1. The expected resumption of the Treasury curve steepening trend hasn’t started yet.
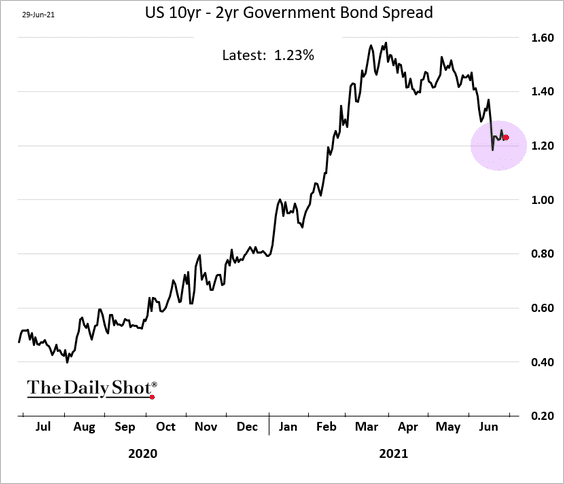
There is certainly room for the cuve to steepen.
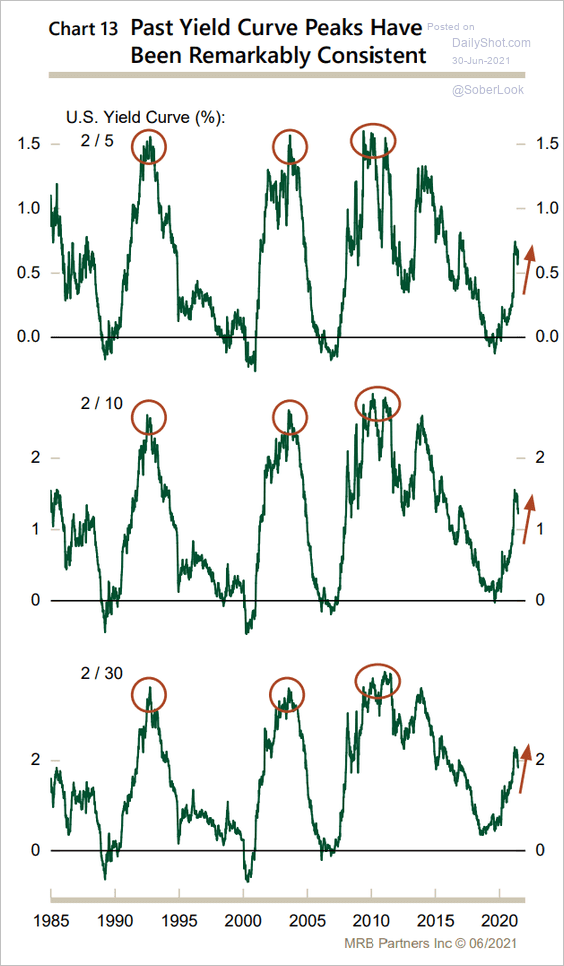 Source: MRB Partners
——————–
2. The 10-year Treasury yield has not caught up with the rise in global manufacturing PMI.
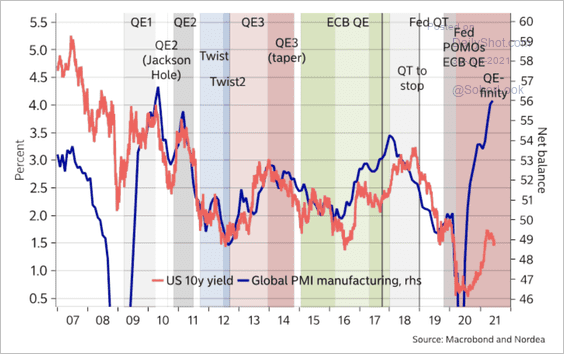 Source: Nordea Markets
3. The market-based timing of the first Fed hike has shifted to late November of next year.
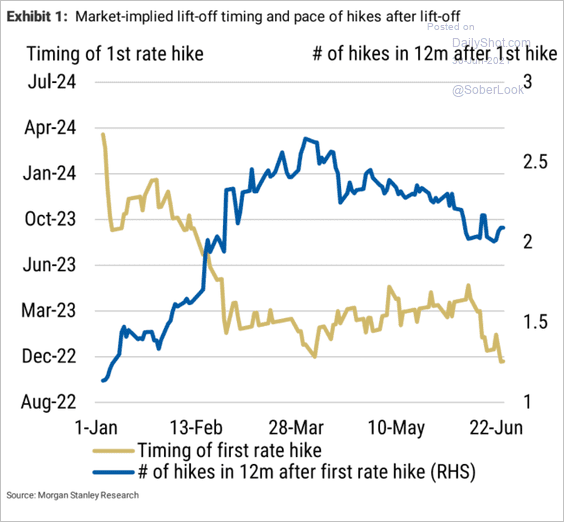 Source: Morgan Stanley Research
4. Breakeven rates (inflation expectations) are tracking the relative performance of equity cyclicals vs. non-cyclicals.
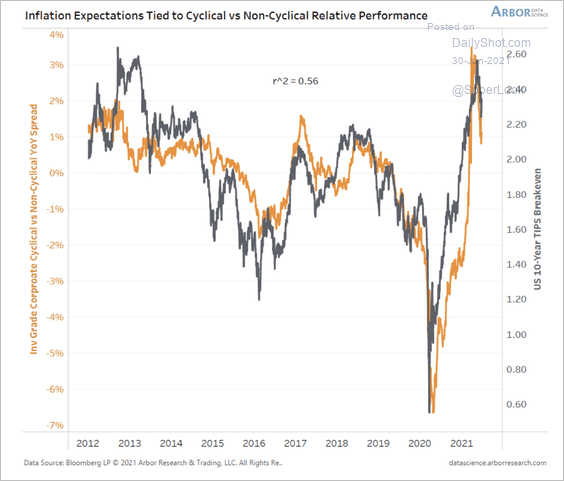 Source: Arbor Research & Trading
Back to Index
Global Developments
1. Let’s start with a summary of June PMI (business activity) data.
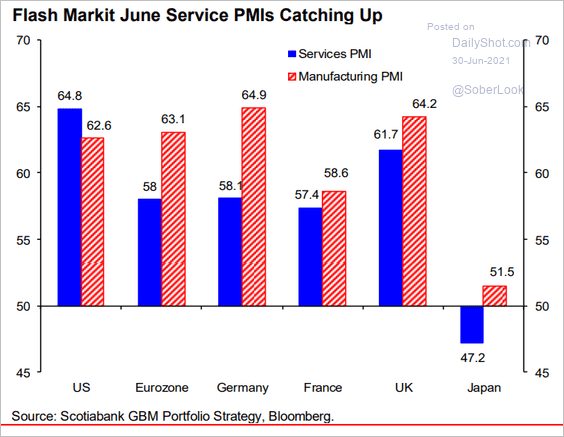 Source: Hugo Ste-Marie, Portfolio & Quantitative Strategy Global Equity Research, Scotia Capital
2. The world faces unusually low borrowing costs and record debt levels.
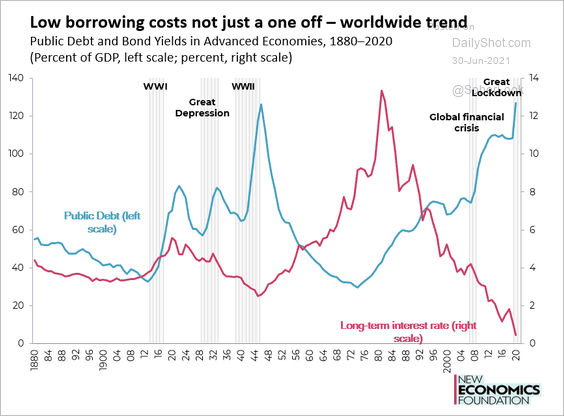 Source: @Frank_vanlerven, @Nef
3. Except for 2018, more than half of active fixed income managers have beaten their prospectus benchmark each year.
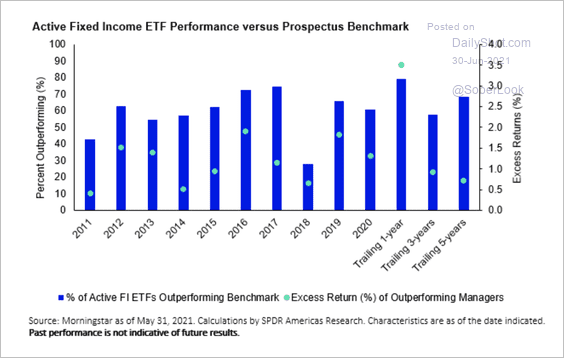 Source: SPDR Americas Research, @mattbartolini
4. This chart shows central banks’ balance sheets as a percentage of GDP.
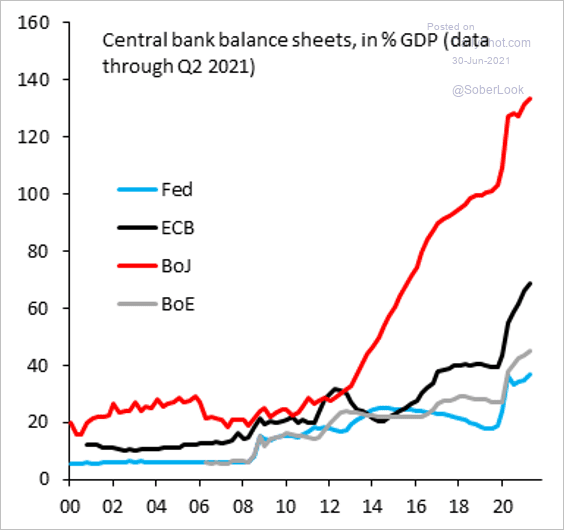 Source: @RobinBrooksIIF
5. How does the public in each country view the government’s coronavirus response?
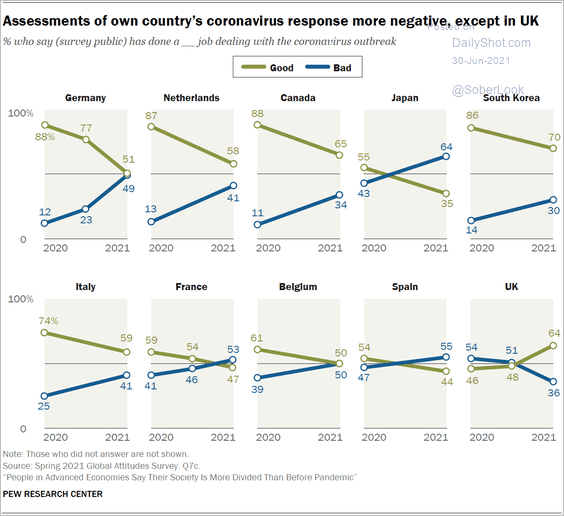 Source: Pew Research Center Read full article
6. Finally, we have the projected share of the working-age population by country.
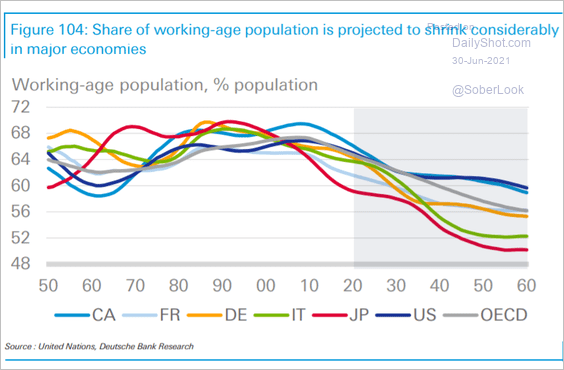 Source: Deutsche Bank Research
——————–
Food for Thought
1. Changes in the foreign-born population across US metro areas:
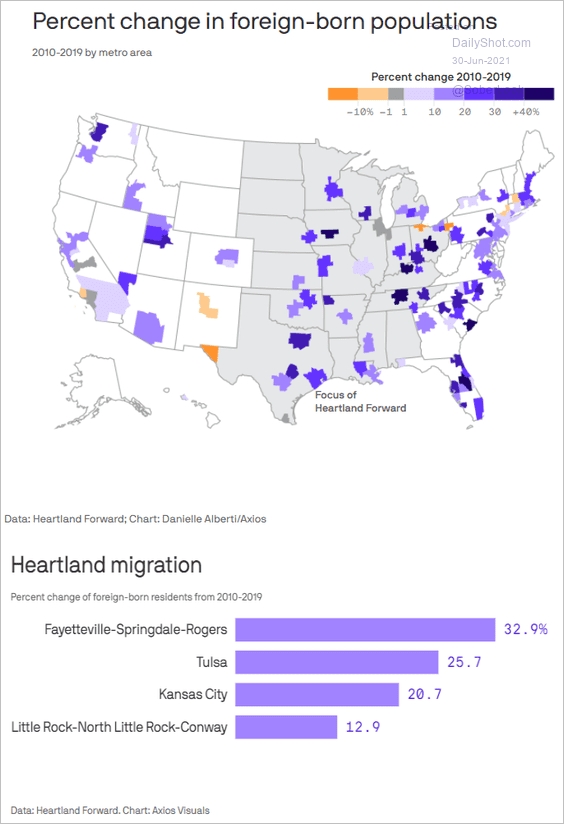 Source: @axios Read full article
2. Warm weather in Seattle and Portland:
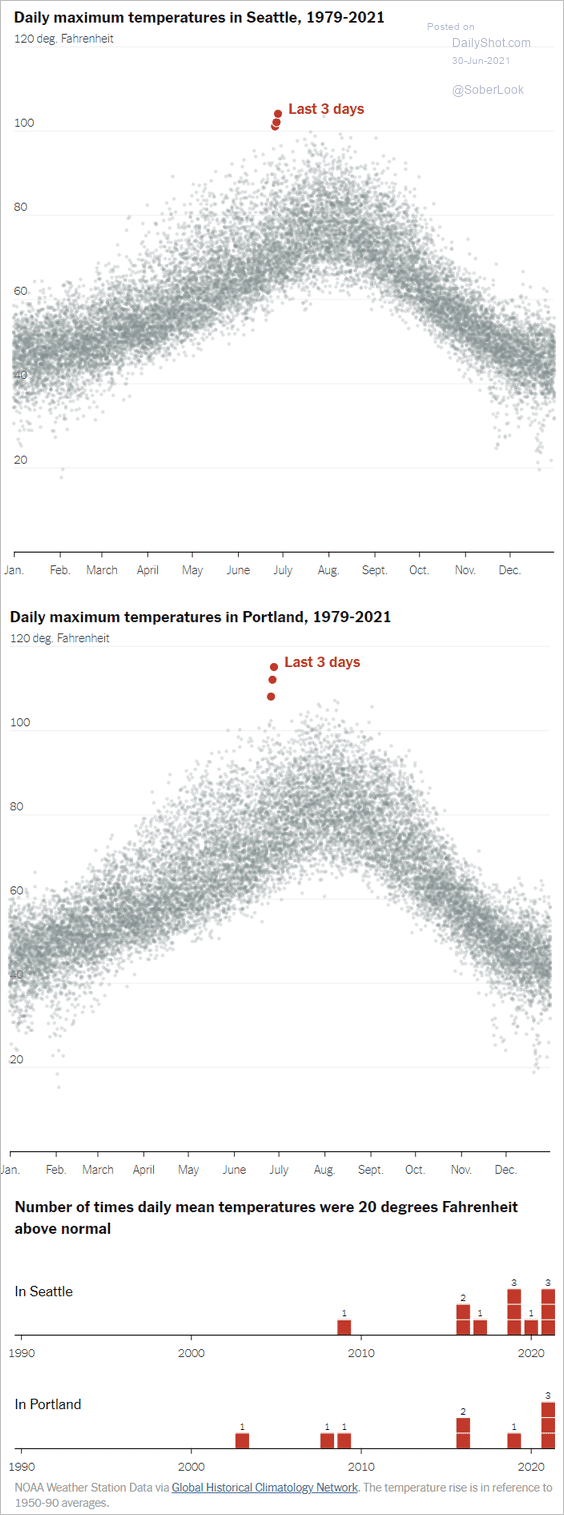 Source: The New York Times Read full article
3. Cities’ exposure to environmental factors:
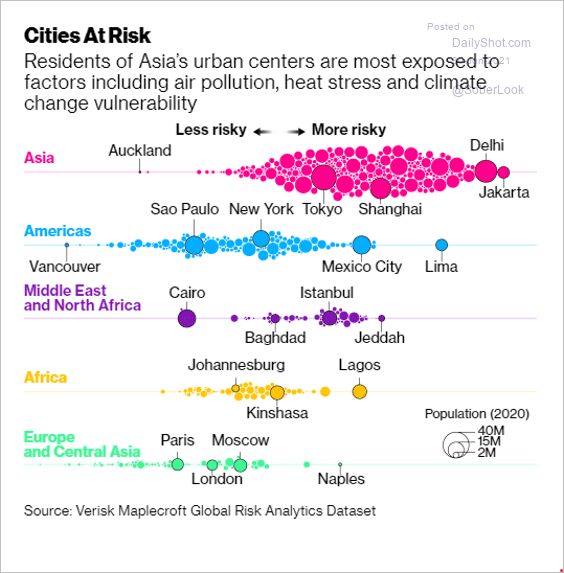 Source: @business Read full article
4. US cities with highest population losses and gains (past 12 months):
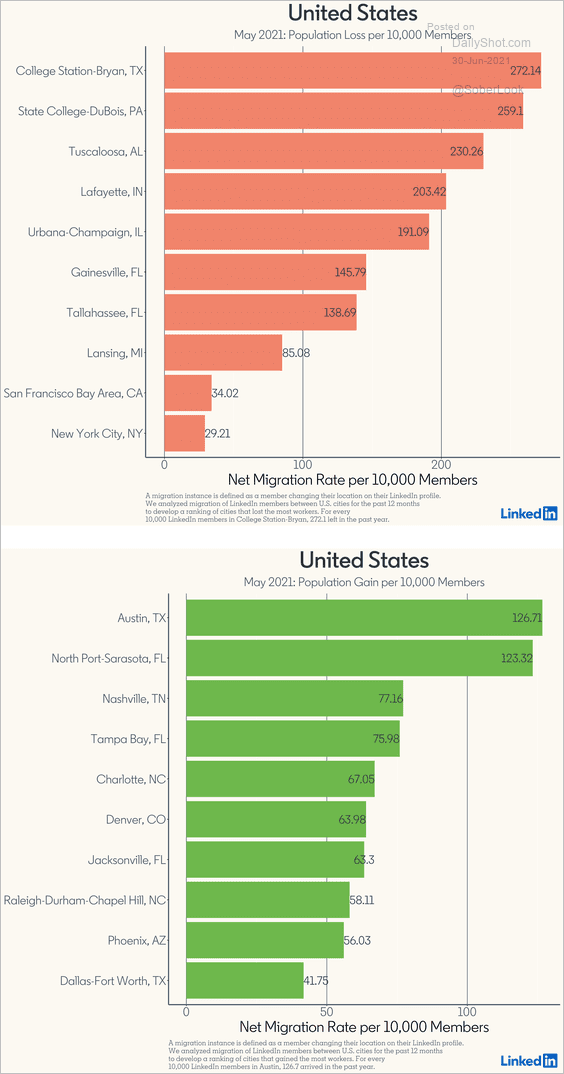 Source: LinkedIn Economic Graph
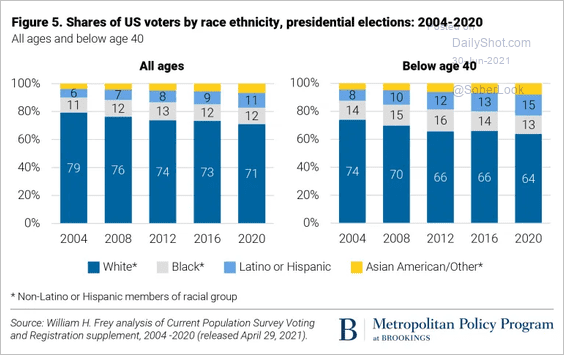
5. The demographic profile of US voters in 2020 vs. 2004:
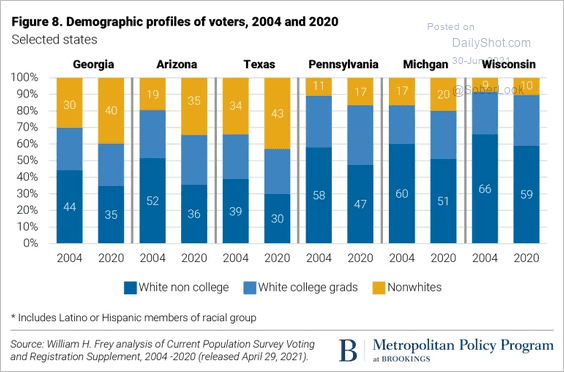 Source: Brookings Read full article
 Source: Brookings Read full article
——————–
6. Prime-time cable news show hosts:
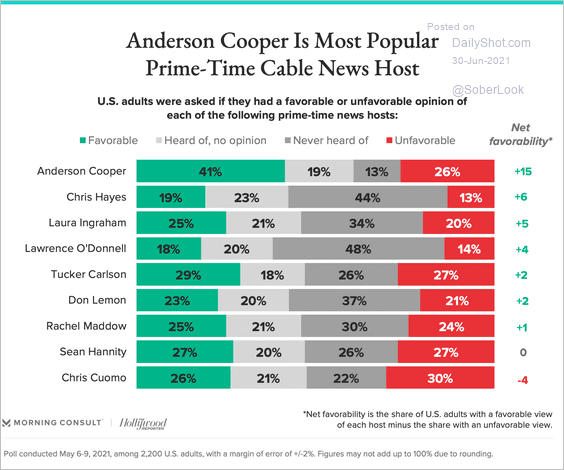 Source: Morning Consult Read full article
7. The Delta variant vs. vaccination rates in the US:
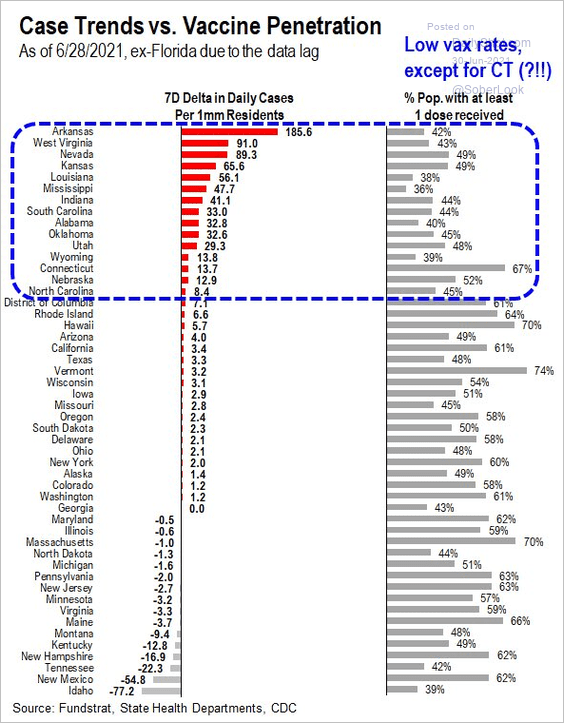 Source: @carlquintanilla, @fundstrat
The Delta variant globally:
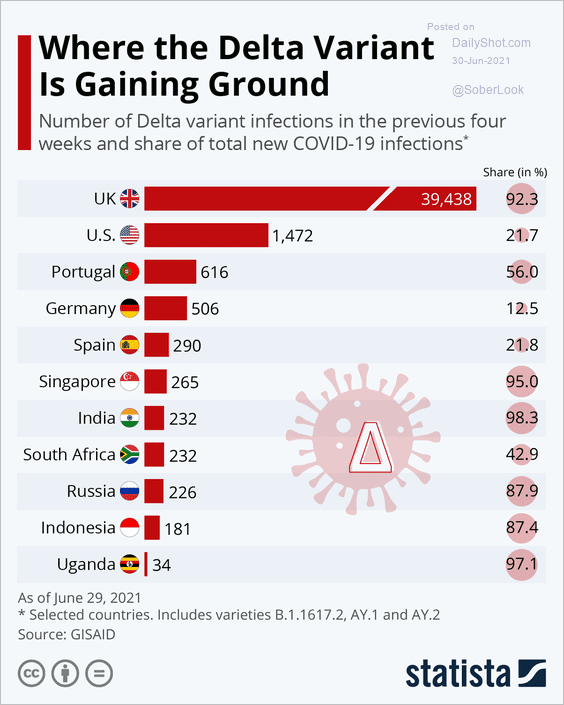 Source: Statista
——————–
8. US restaurant price inflation:
 Source: @lisaabramowicz1, @theterminal
9. Rounds of golf:
 Source: @business Read full article
——————–
Back to Index