
The Daily Shot: 06-Jul-21
• Energy
• Commodities
• Equities
• Alternatives
• Credit
• Rates
• Emerging Markets
• China
• Asia – Pacific
• The Eurozone
• Europe
• The United Kingdom
• The United States
• Global Developments
• Food for Thought
Energy
1. The OPEC+ production increase is off the table for now as the impasse continues.
 Source: Reuters Read full article
Oil prices jumped.
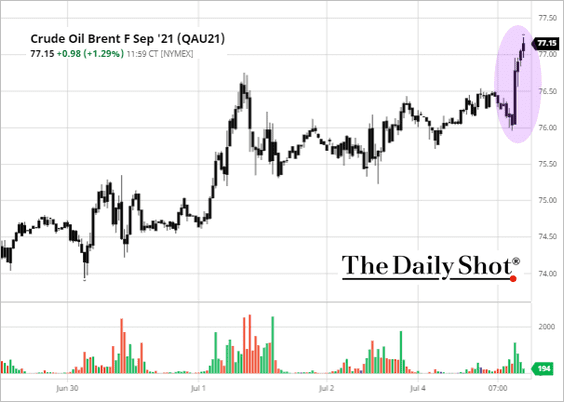 Source: barchart.com
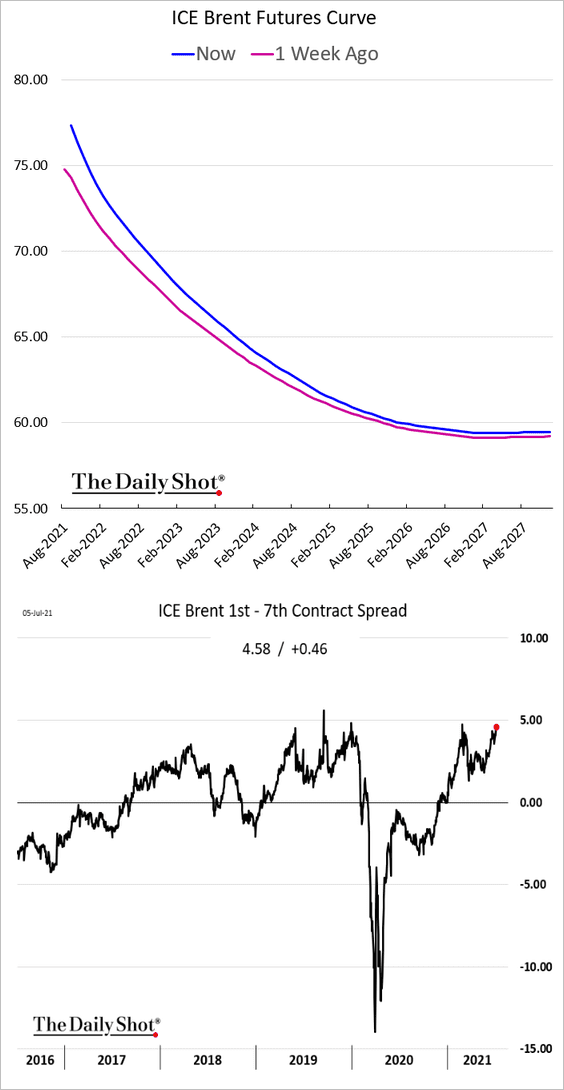
The Brent curve moved deeper into backwardation.
——————–
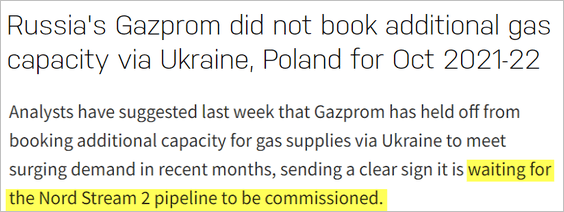
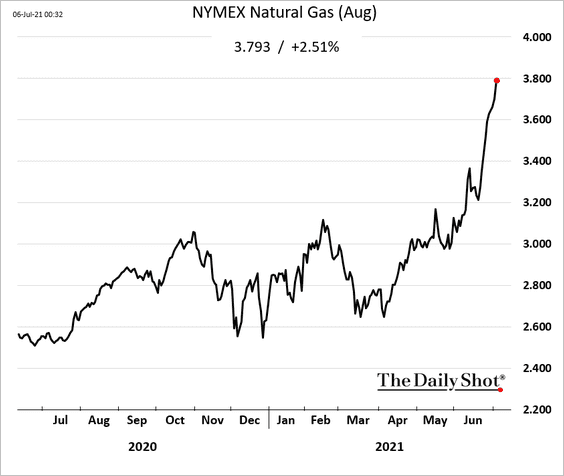
2. Russia put the squeeze on Europe’s natural gas market. The goal is to spook Europe into getting the Nord Stream 2 pipeline completed quickly.
 Source: Nasdaq/Reuters Read full article
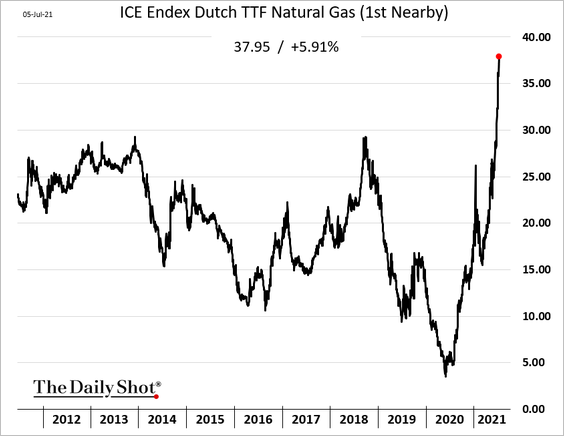
European natural gas futures are soaring.
US natural gas futures are also sharply higher.
Back to Index
Commodities
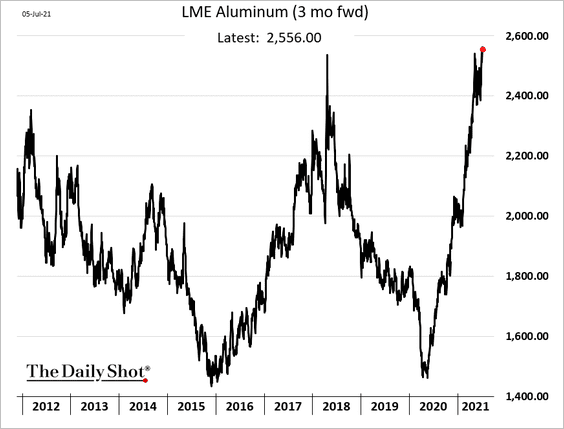
1. Aluminum prices are surging.
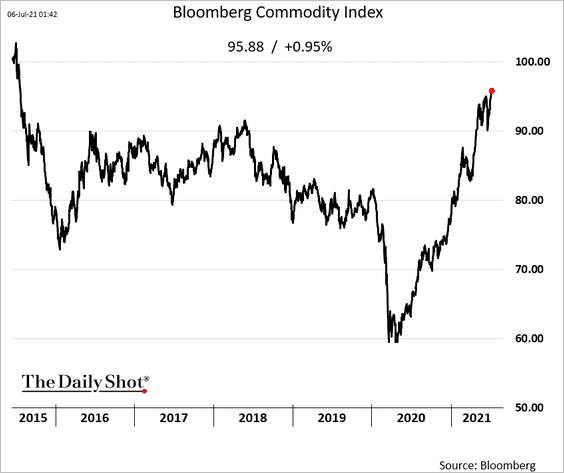
2. Bloomberg’s broad commodity index hit the highest level since 2015, boosted by the recent jump in oil prices.
Back to Index
Equities
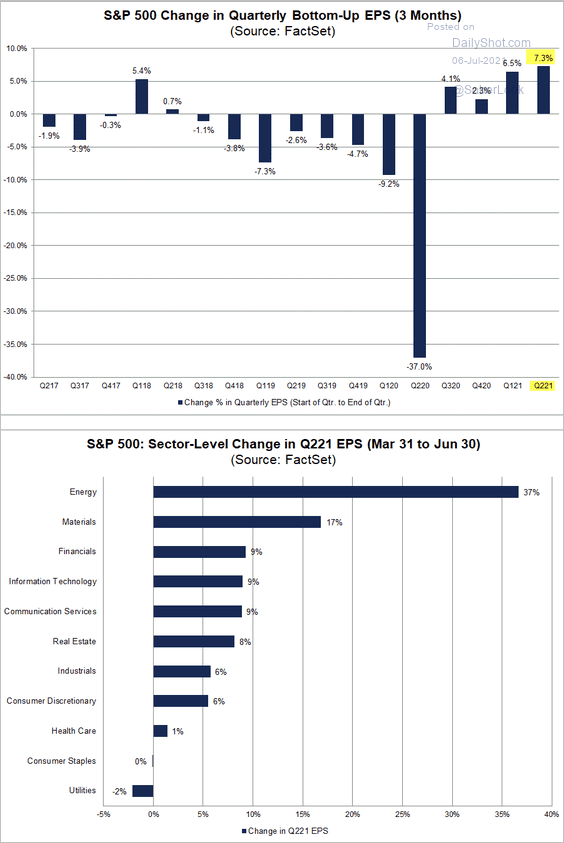
1. The 3-month increase in expected S&P 500 earnings per share (EPS) for Q2 was the highest in years. The second chart shows EPS changes by sector.
 Source: @FactSet
2. It was an unusually strong first half of the year for global stocks.
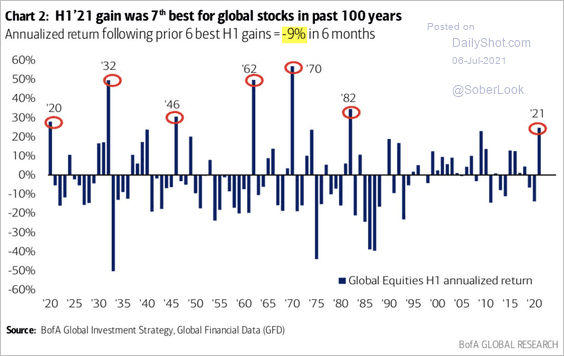 Source: BofA Global Research; @DiMartinoBooth
3. Starting last year, global investors held more US equities than US investors owned abroad.
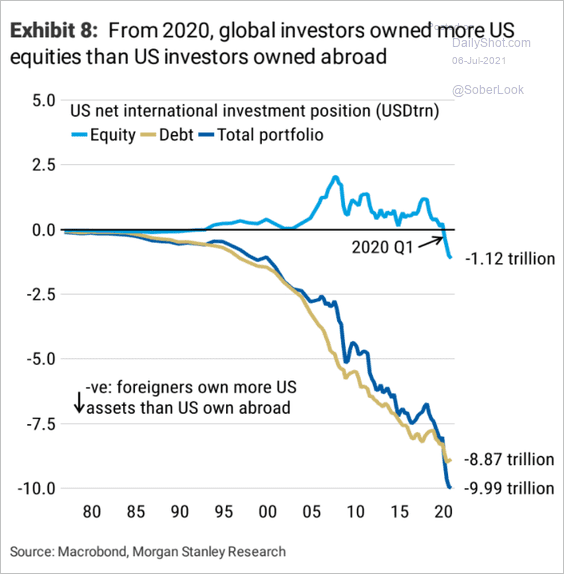 Source: Morgan Stanley Research
4. Higher inflation expectations tend to be good for stock performance.
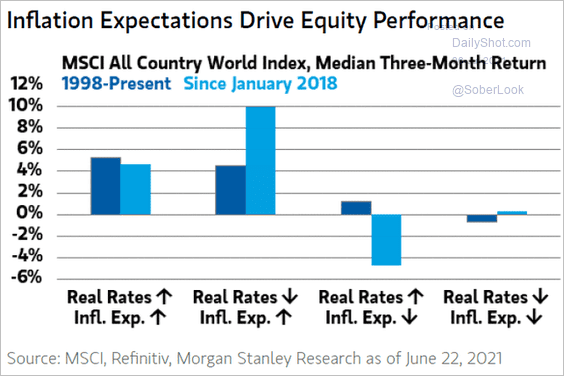 Source: @ISABELNET_SA, @MorganStanley
5. Merrill Lynch private clients’ equity allocations hit a record high.
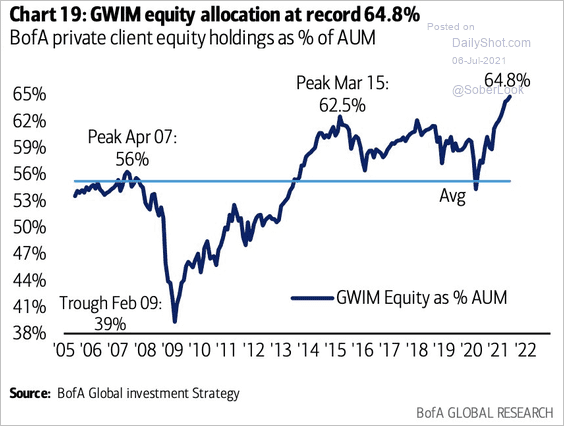 Source: @PMack1224
And they increasingly hold high-beta stocks.
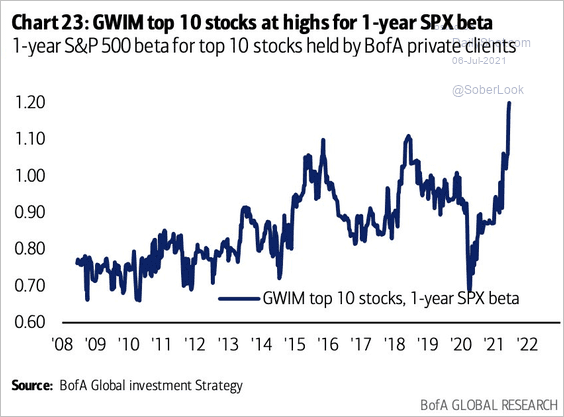 Source: @PMack1224
——————–
6. Margin debt as a share of the S&P 500 market cap remains relatively low.
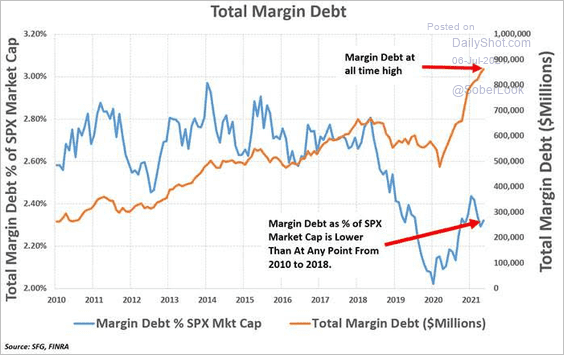 Source: Chris Murphy
7. Individual investors remain a force in US equities.
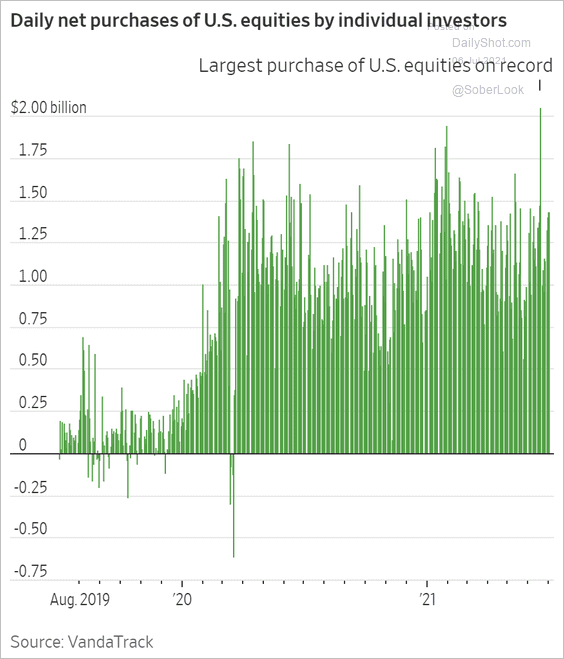 Source: @WSJ Read full article
8. This graphic shows the breakdown of Robinhood’s revenue.
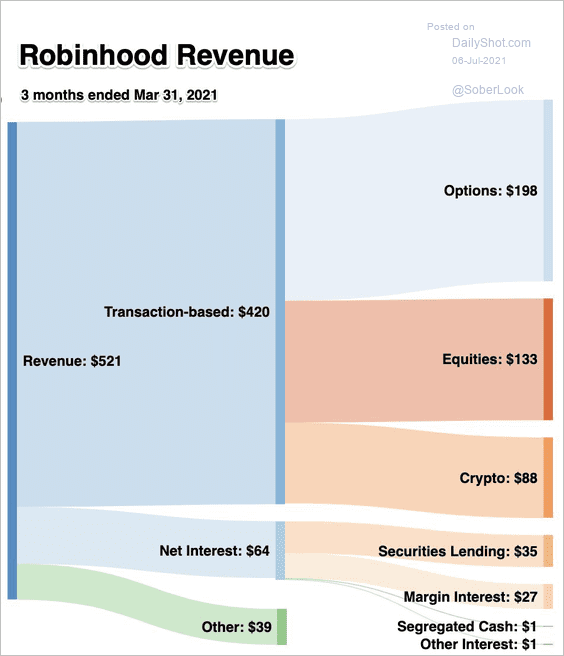 Source: @rexsalisbury
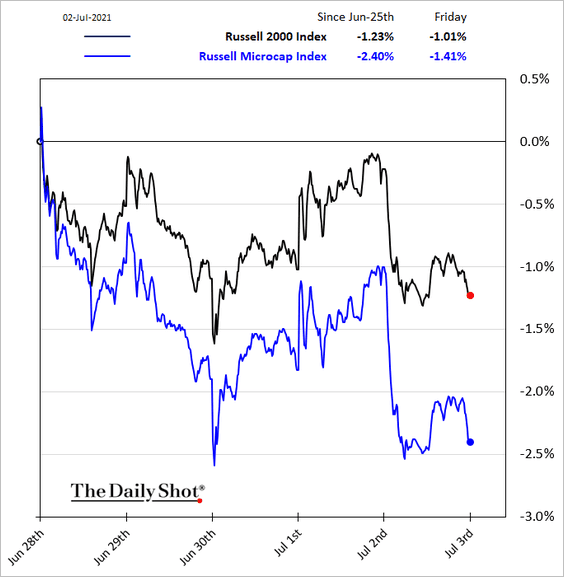
9. Microcaps (favored by the Reddit crowd) have underperformed over the past month.
10. Information technology, the largest sector in the S&P 500, has a relatively low effective tax rate of just under 17%.
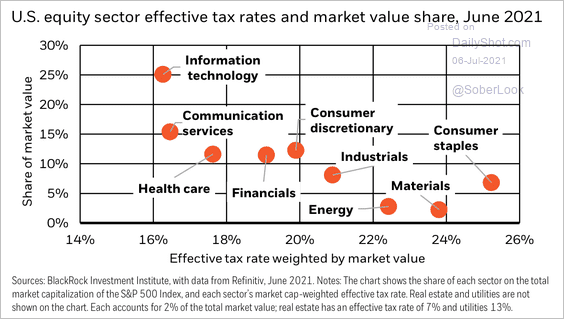 Source: BlackRock
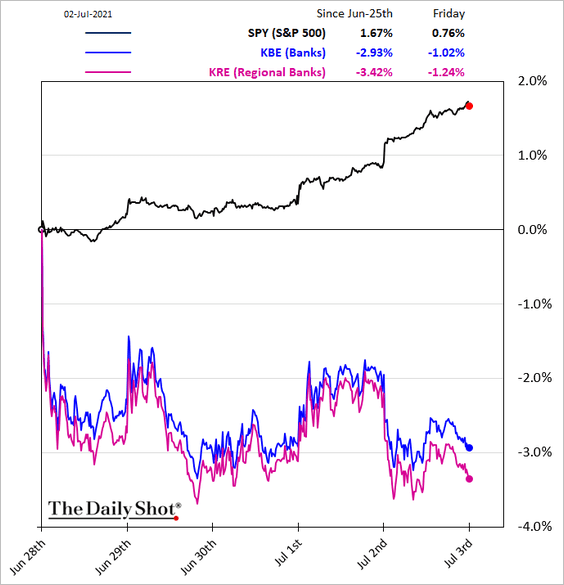
11. Bank shares underperformed last week amid lower Treasury yields.
Back to Index
Alternatives
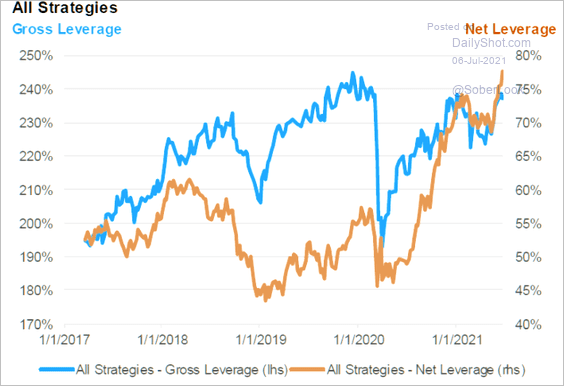
1. Hedge fund leverage has been climbing.
 Source: JP Morgan; @themarketear
2. PE acquisitions are surging this year. Given frothy valuations, the latest vintages are likely to underperform.
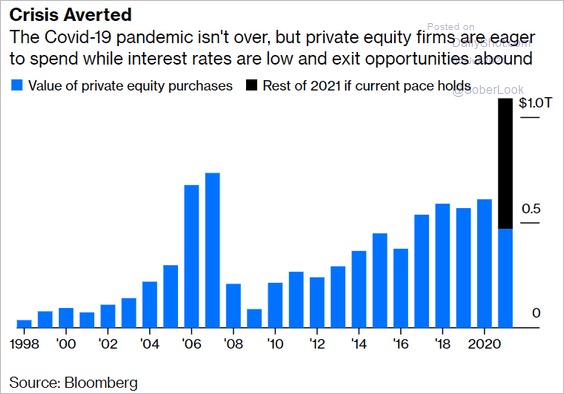 Source: Tara Lachapelle, @bopinion Read full article
3. Pre-money valuations of European startups are climbing.
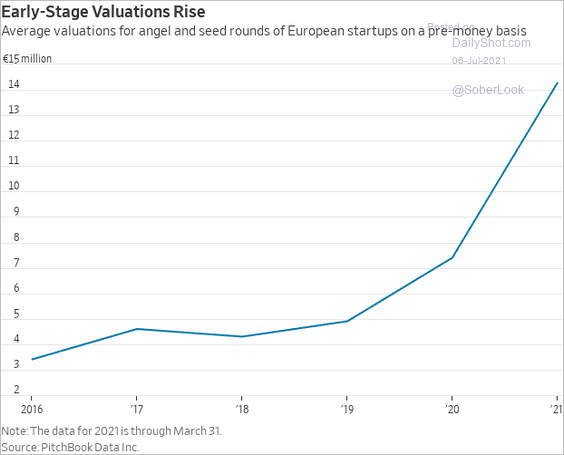 Source: @WSJ Read full article
4. Here are the top countries for VC activity in Africa.
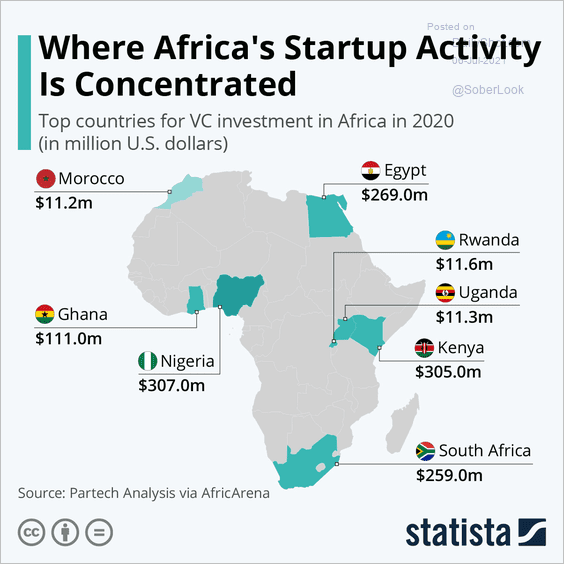 Source: Statista
5. The sports card market has been heating up.
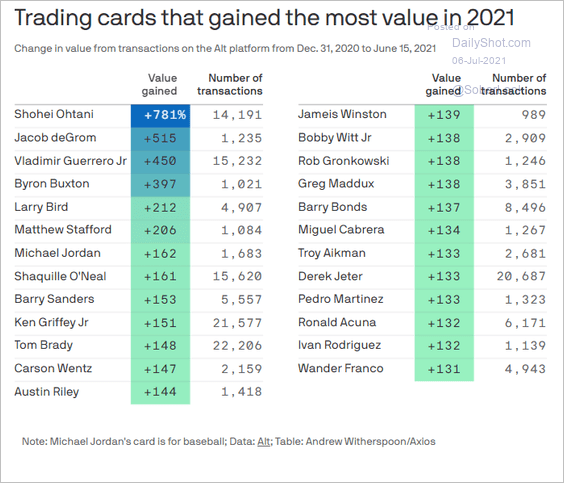 Source: @axios Read full article
Back to Index
Credit
1. US banks have been easing lending standards on consumer credit …
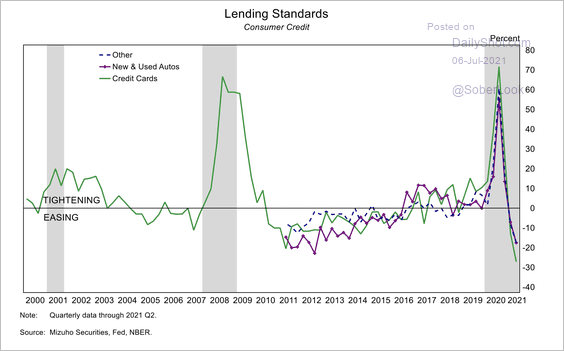 Source: Mizuho Securities USA
… and mortgages (especially jumbo loans).
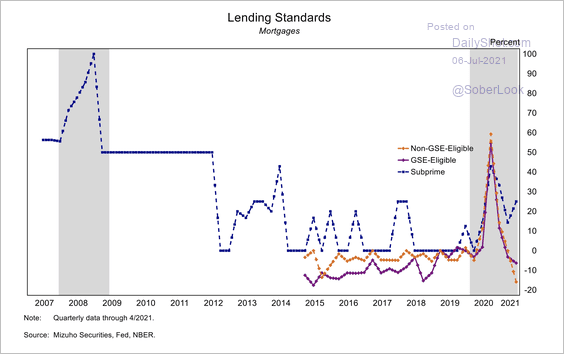 Source: Mizuho Securities USA
Lenders are encouraged by the ongoing household deleveraging.
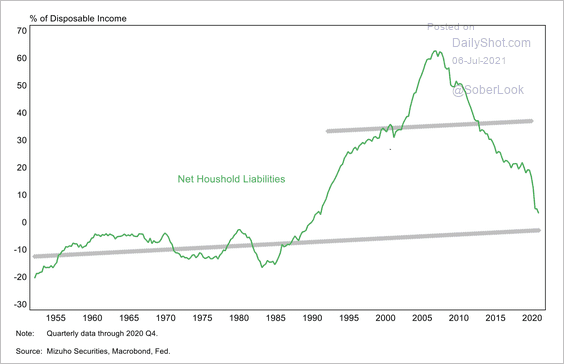 Source: Mizuho Securities USA
——————–
2. Small banks are responsible for most of the growth in commercial real estate lending in recent years.
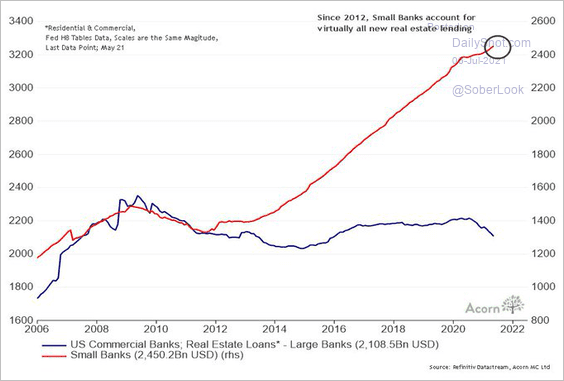 Source: @RichardDias_CFA
3. As discussed previously, the loan-to-deposit ratio continues to decline, especially for large banks. The recent declines have been driven by the Fed’s QE, which sharply boosted deposits.
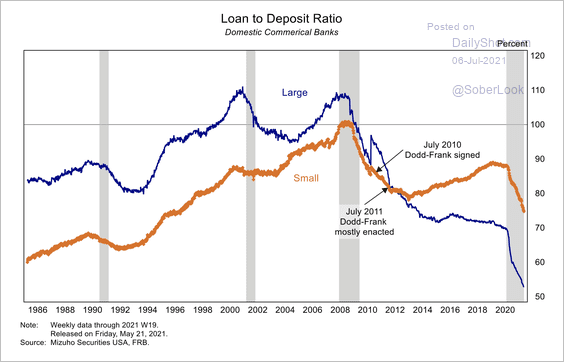 Source: Mizuho Securities USA
By the way, the table below illustrates how QE increases deposits in the banking system.
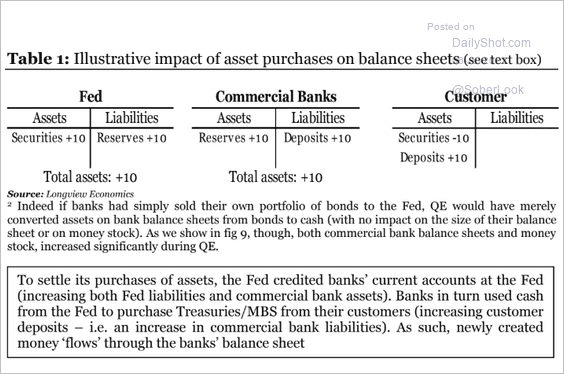 Source: Longview Economics
——————–
4. 2021 has been a good year for BBB-rated corporate debt issuance.
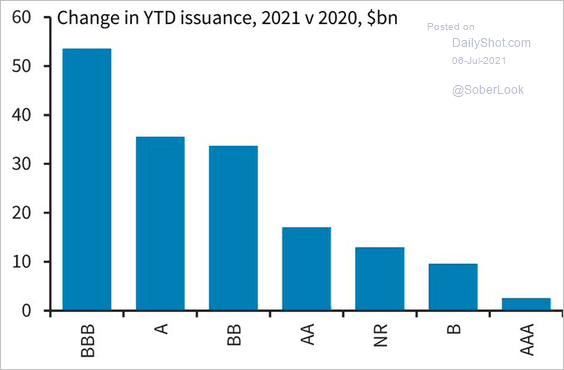 Source: Barclays Research; @tracyalloway
5. The impact of the 2013 taper tantrum on corporate spreads was relatively muted.
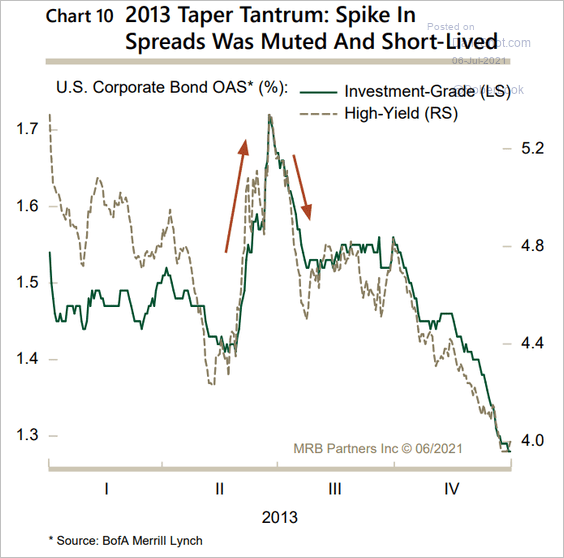 Source: MRB Partners
6. Investors can’t get enough of US taxable munis.
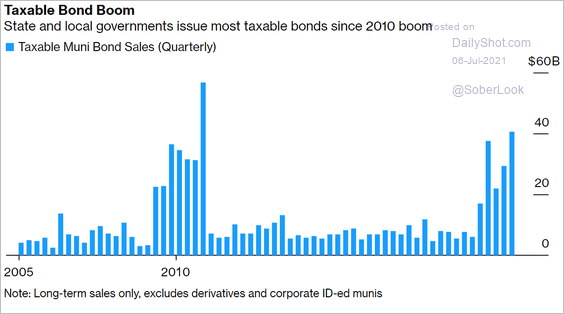 Source: Bloomberg Read full article
Back to Index
Rates
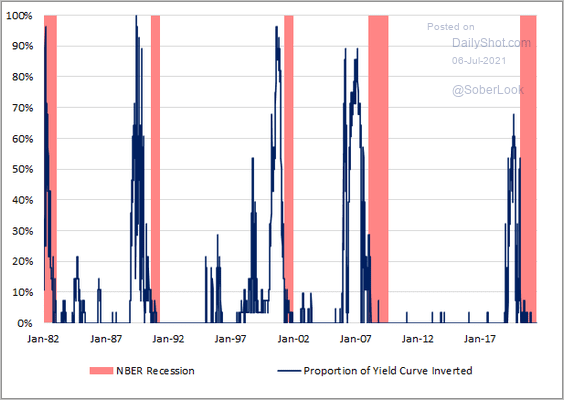
1. The Treasury curve remains a superb predictor of recessions.
 Source: @toby_n
2. TIPS inflows in the first half of this year have been impressive.
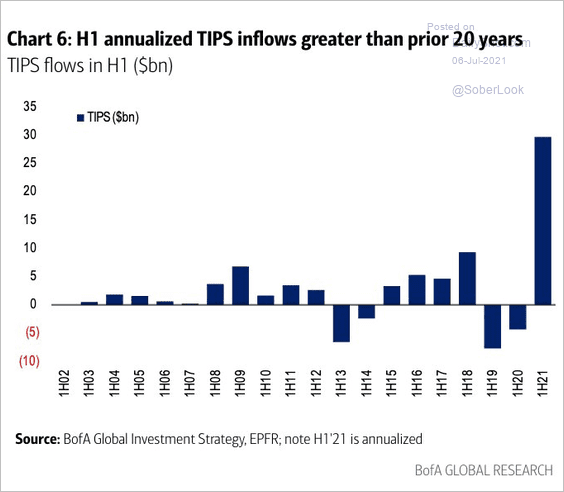 Source: BofA Global Research; @RobinWigg
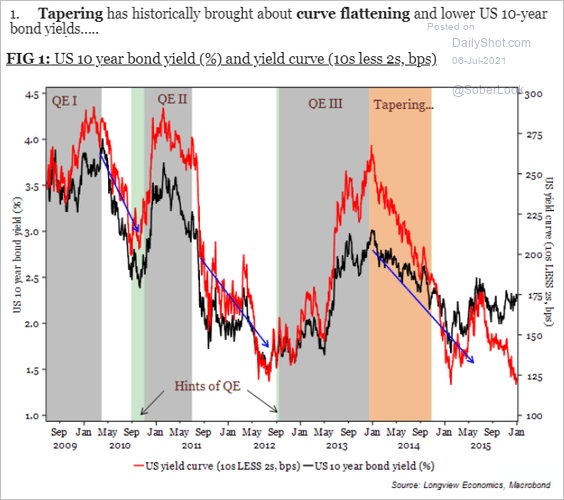
3. QE tapering tends to flatten the yield curve.
 Source: Longview Economics
4. Correction: we had the wrong image in yesterday’s rates section, item #3. Here is the correct chart, which shows Nordea’s forecast for the Fed’s taper (starting in Q4 of this year).
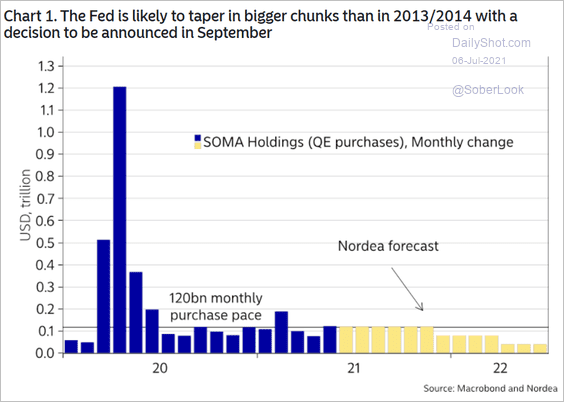 Source: Nordea Markets
Back to Index
Emerging Markets
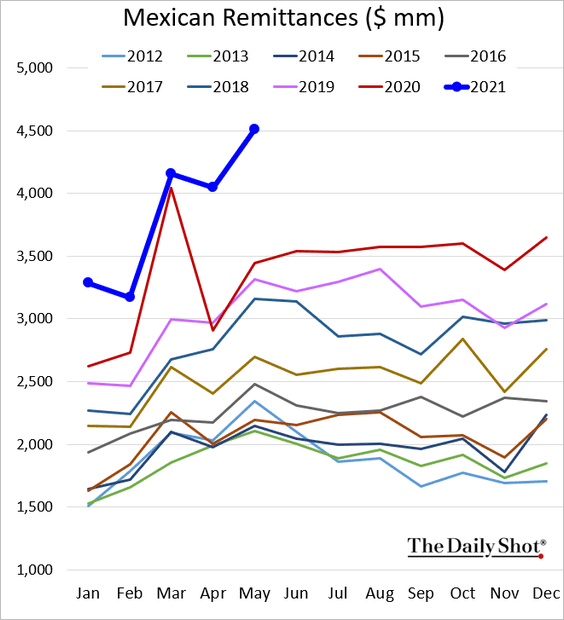
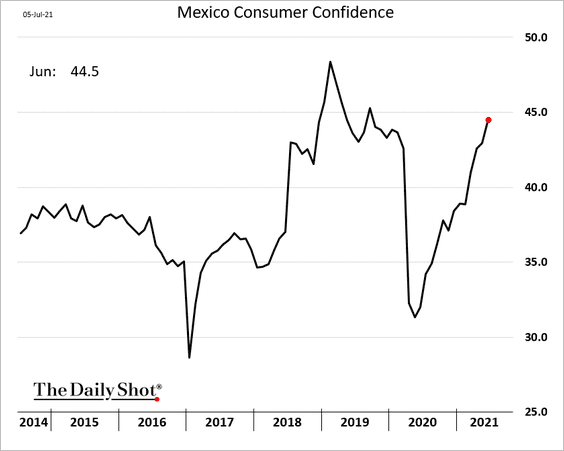
1. Let’s begin with Mexico.
• Remittances hit a record high amid robust demand for labor in the US.
• Manufacturing activity is almost stable (PMI approaching 50).
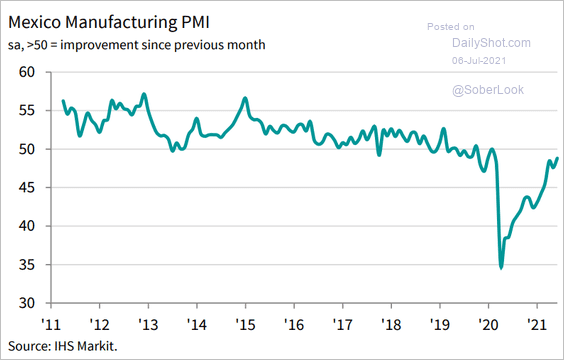 Source: IHS Markit
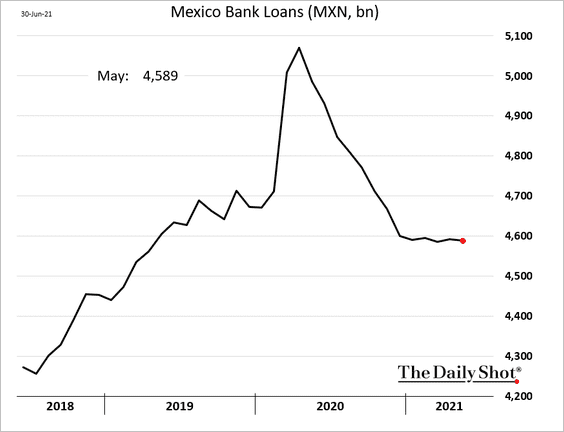
• Loan growth has stalled.
• Consumer confidence is now above pre-COVID levels.
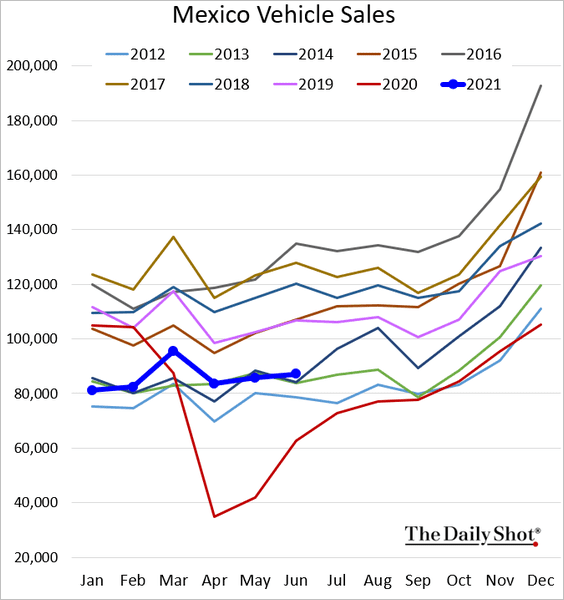
• Car sales remain soft.
——————–
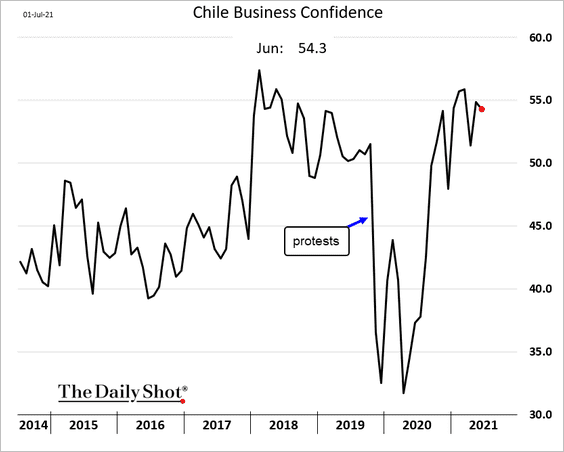
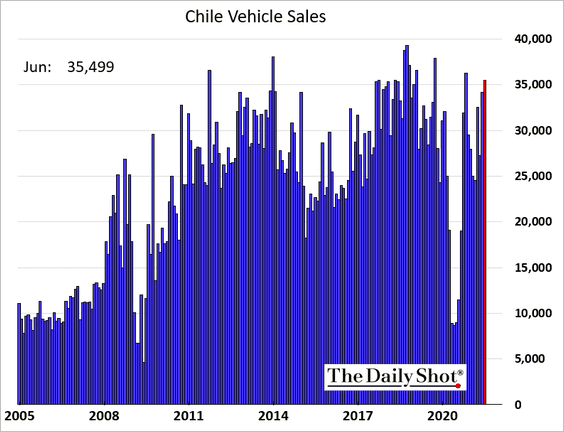
2. Next, we have some updates on Chile.
• Business confidence:
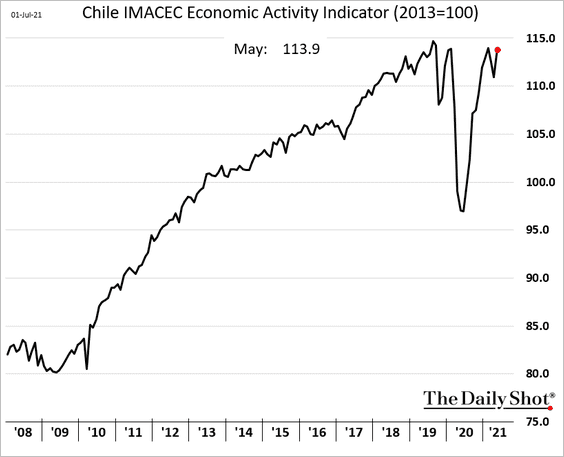
• Economic activity:
• Vehicle sales:
——————–
3. Colombia’s unemployment rate is moving in the wrong direction, …
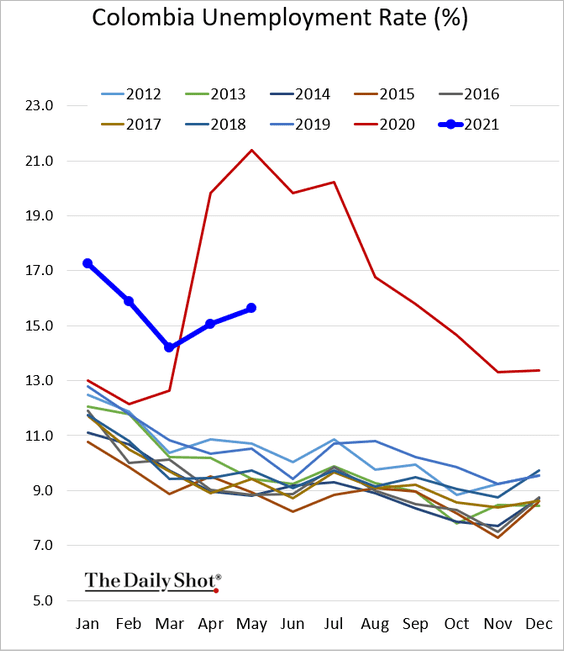
… as COVID rates surge.
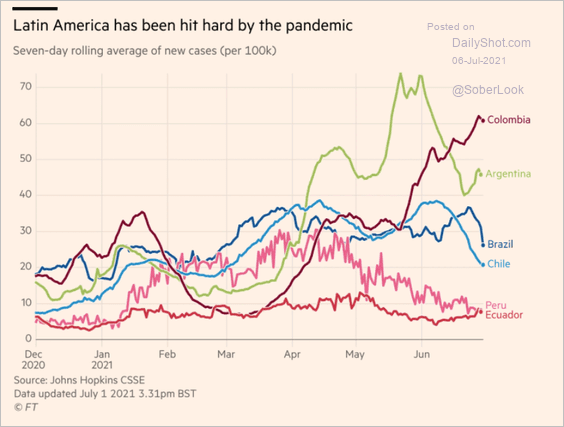 Source: @financialtimes Read full article
——————–
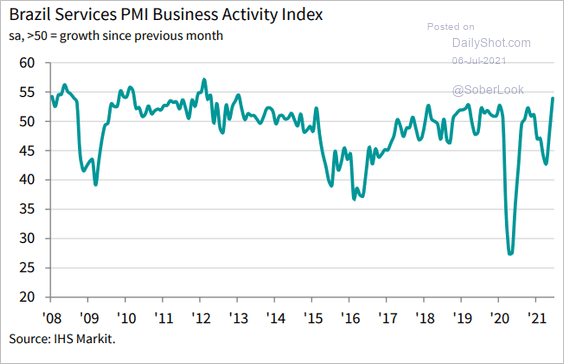
4. Brazil’s service-sector PMI hit the highest level since 2012.
 Source: IHS Markit
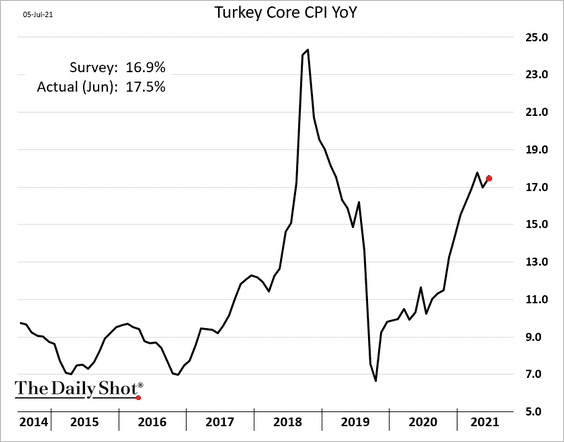
5. Turkey’s core inflation is holding above 17% amid the recent lira weakness.
Separately, international exposure to Turkey has become the smallest among major EM countries.
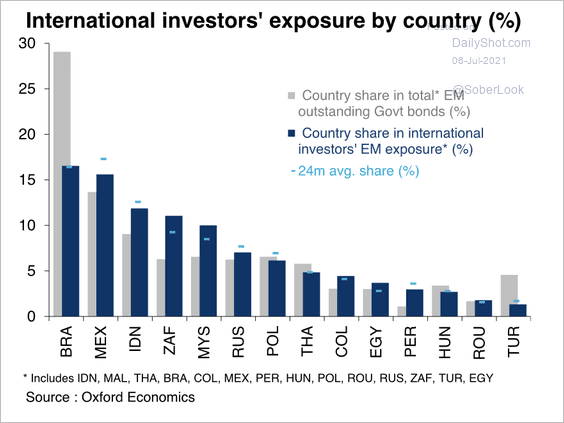 Source: Oxford Economics
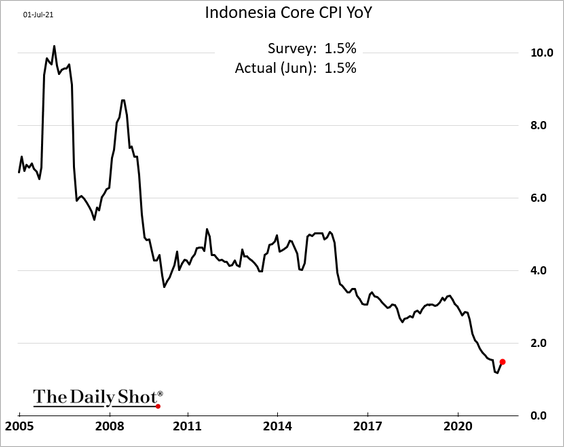
6. Indonesia’s inflation remains tepid.
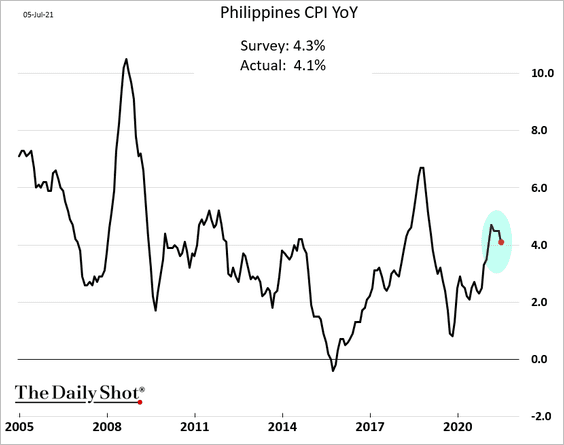
7. The Philippine CPI was lower than expected. But the recent peso weakness could boost inflation later this year.
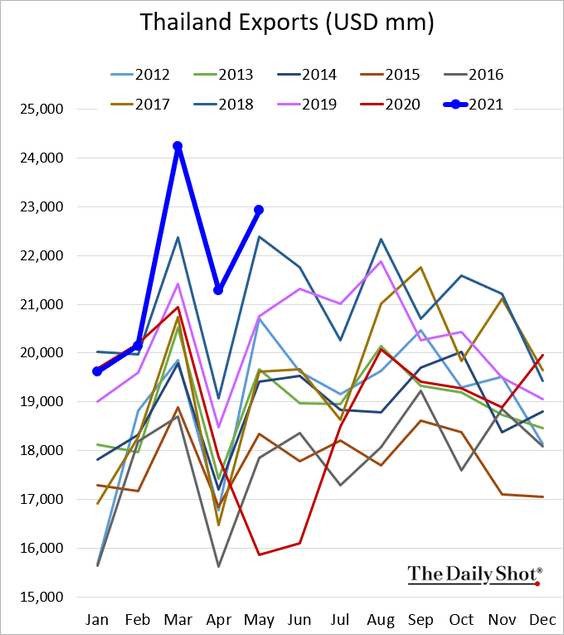
8. Thai exports remain at multi-year highs.
9. India’s service industries are in a recession (PMI well below 50).
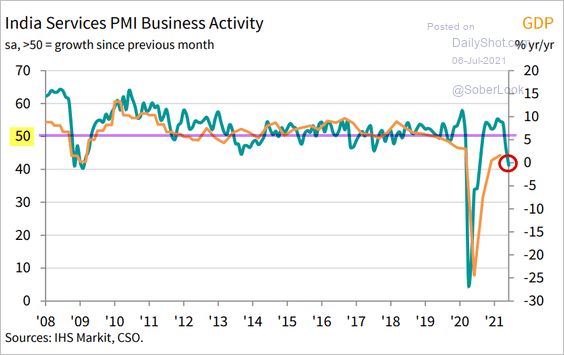 Source: IHS Markit
Separately, this chart shows how Indians have been investing recently.
 Source: Statista
——————–
10. EM stocks have been lagging global peers.
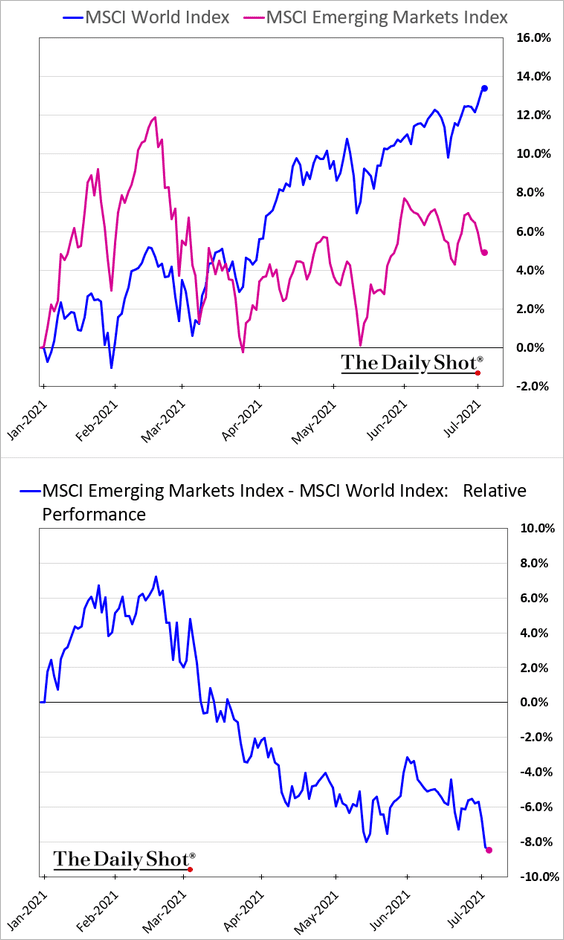 h/t @LK_bloomberg
11. This chart shows government bond yield volatility for select issuers.
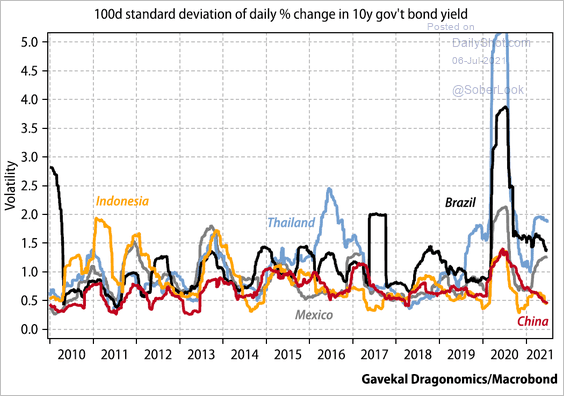 Source: Gavekal Research
12. Finally, we have hard-currency bonds as a share of total government debt.
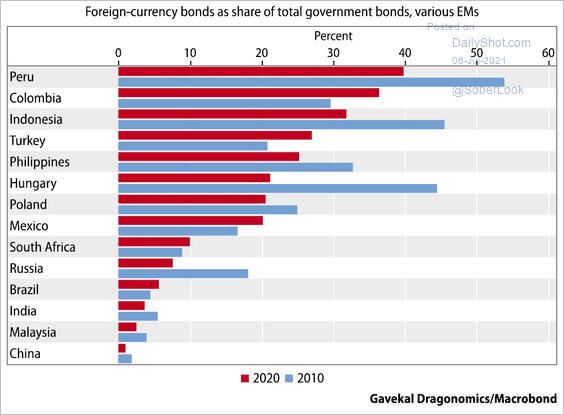 Source: Gavekal Research
Back to Index
China
1. Below are the contributions to China’s bond market growth over the past two decades.
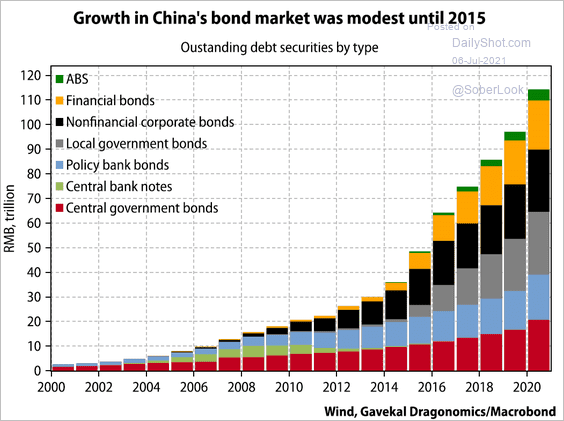 Source: Gavekal Research
• Here is the distribution of debt securities by type.
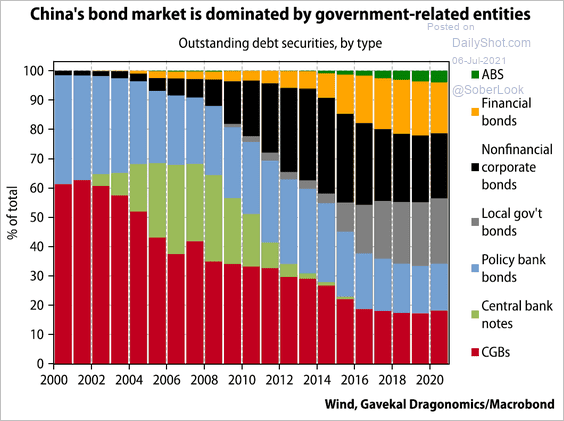 Source: Gavekal Research
• Who are the holders of China’s bonds?
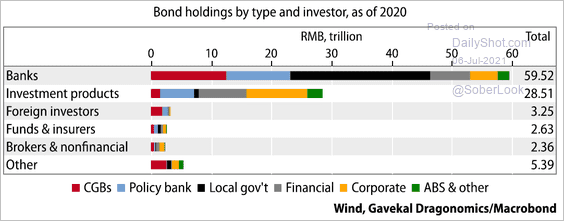 Source: Gavekal Research
——————–
2. Bonds of some of the most stressed entities remain under pressure.
• Huarong:
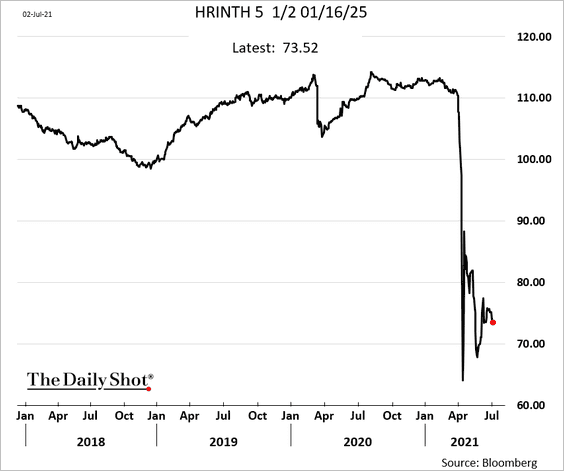
• Evergrande:
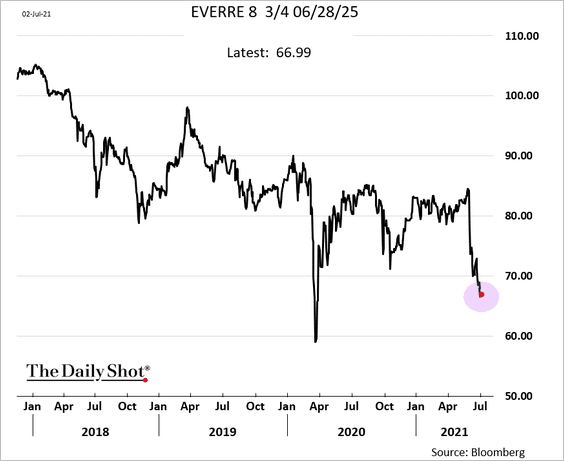
This chart shows the maturity profile of some vulnerable debt.
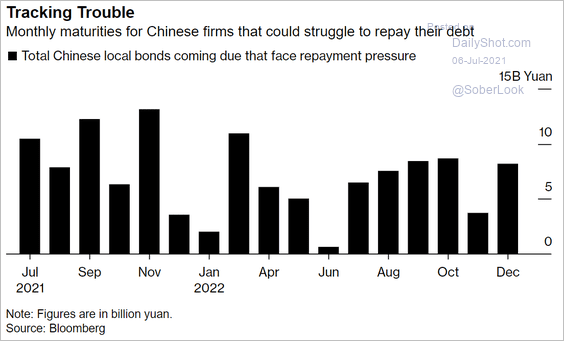 Source: Bloomberg Read full article
——————–
3. Investment slowed broadly across sectors over the past quarter, with a sharp falloff in small and medium-sized businesses.
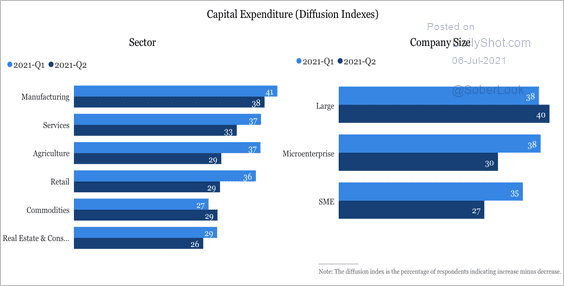 Source: China Beige Book
4. A rebound in the dollar poses a near-term challenge for Chinese equities.
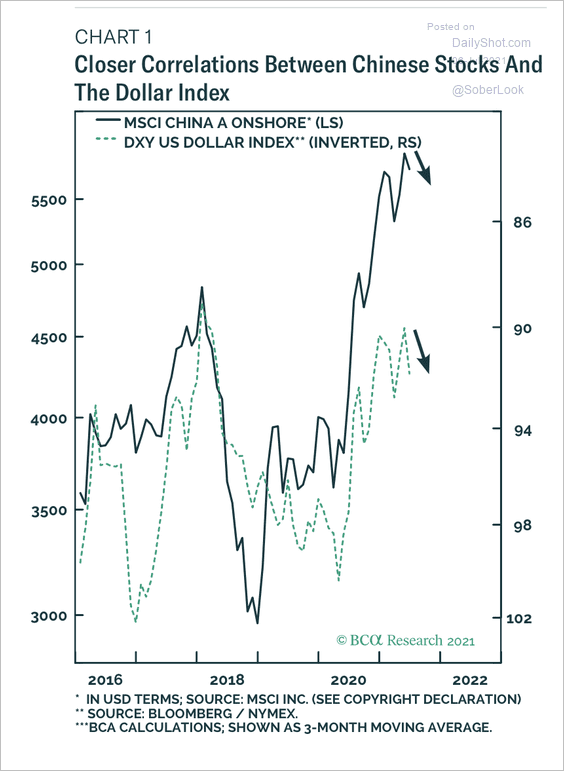 Source: BCA Research
5. Will we see further declines in household savings?
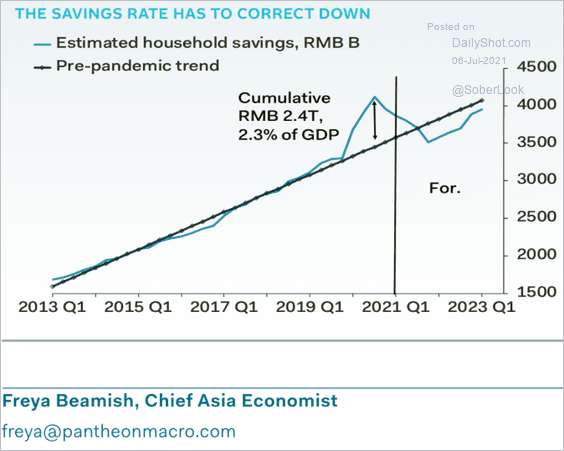 Source: Pantheon Macroeconomics
Back to Index
Asia – Pacific
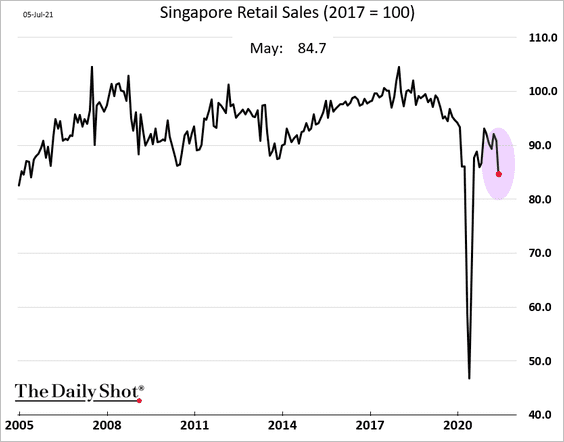
1. Singapore’s retail sales sagged in May.
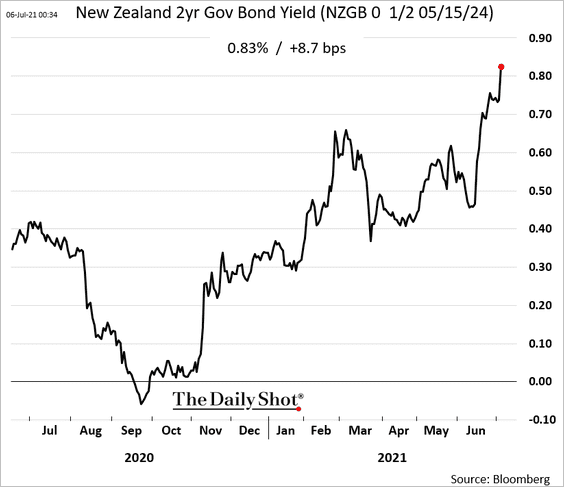
2. The market increasingly expects the RBNZ to hike in November (2021) to cool the real estate bubble.
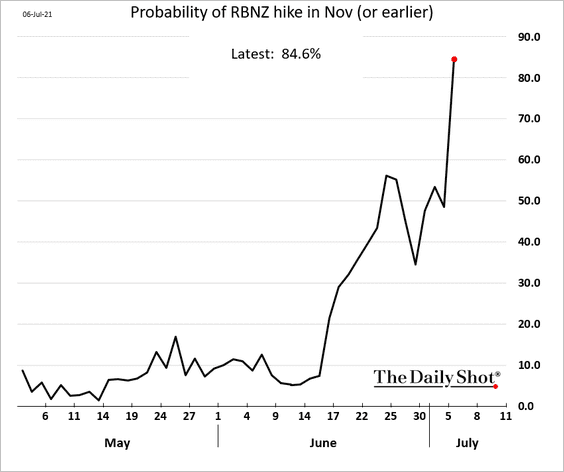
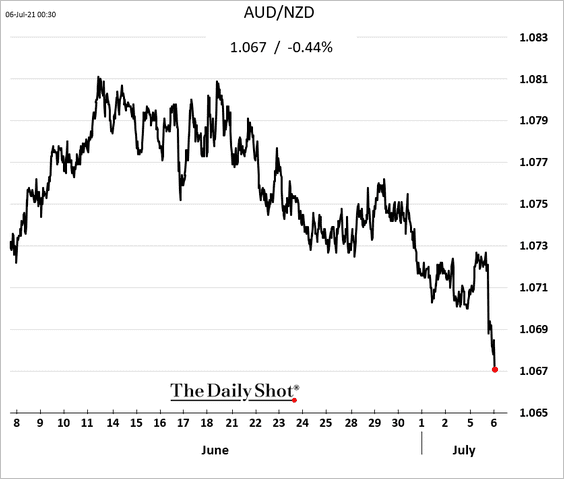
Bond yields and the Kiwi dollar are climbing.
——————–
3. Here is Australia’s Beveridge curve.
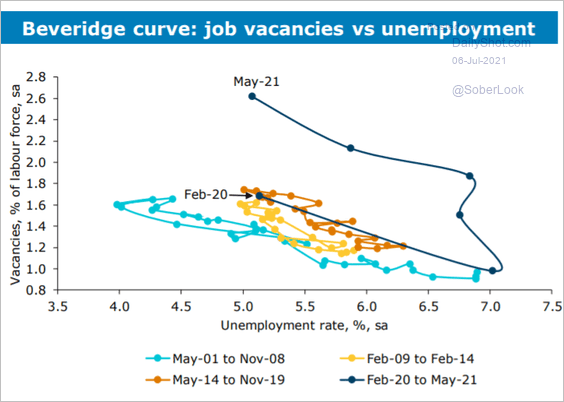 Source: ANZ Research
4. Shares of Asian firms with weak balance sheets have outperformed (based on indices from Goldman Sachs).
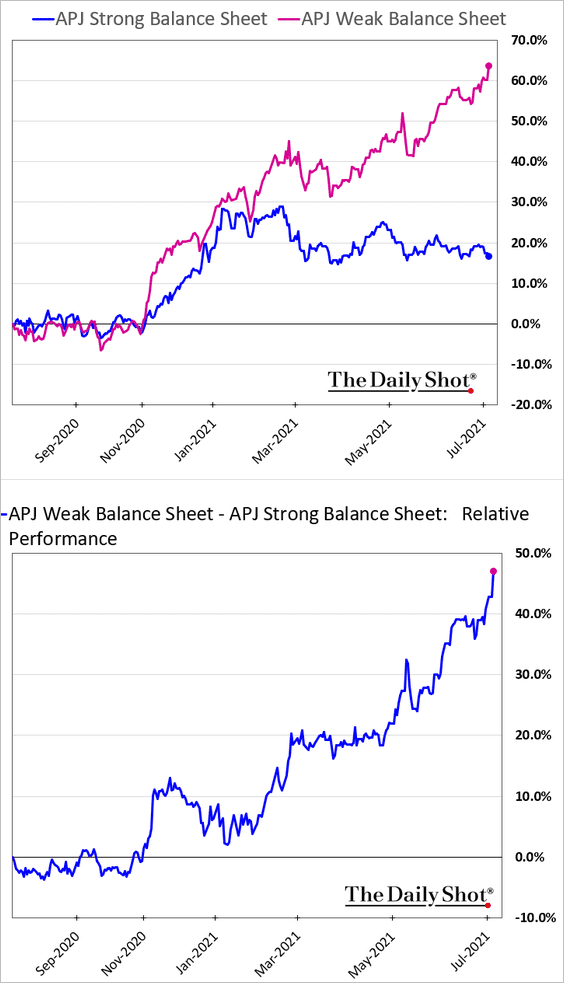 h/t Cormac Mullen
Back to Index
The Eurozone
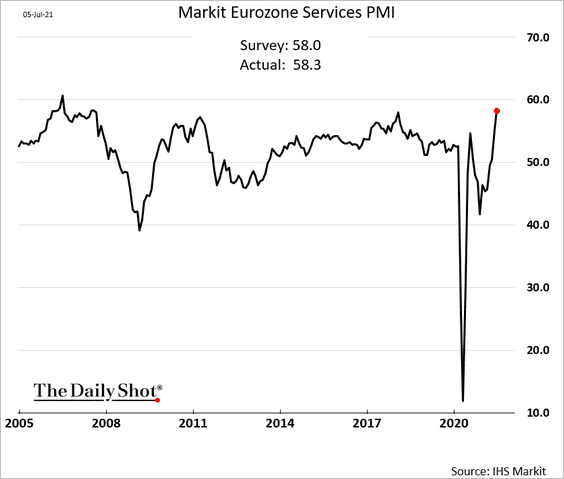
1. Service-sector activity has been accelerating.
• Italy:
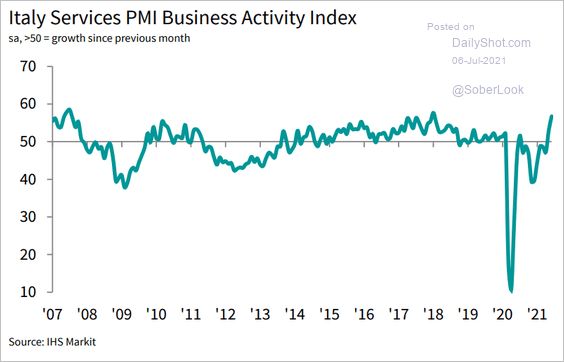 Source: IHS Markit
• Spain:
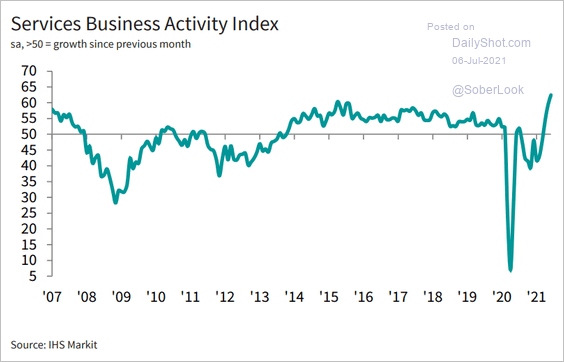 Source: IHS Markit
• The Eurozone:
——————–
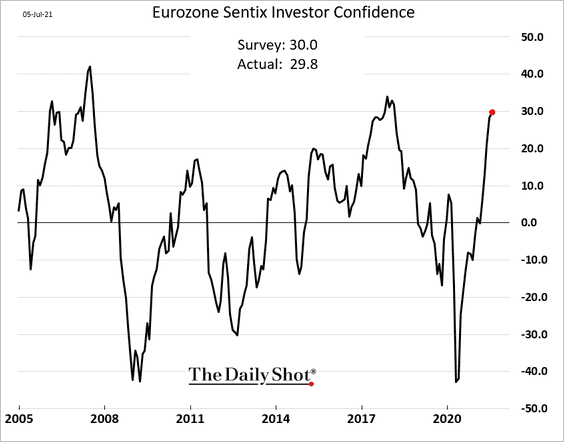
2. Investor confidence remains robust.
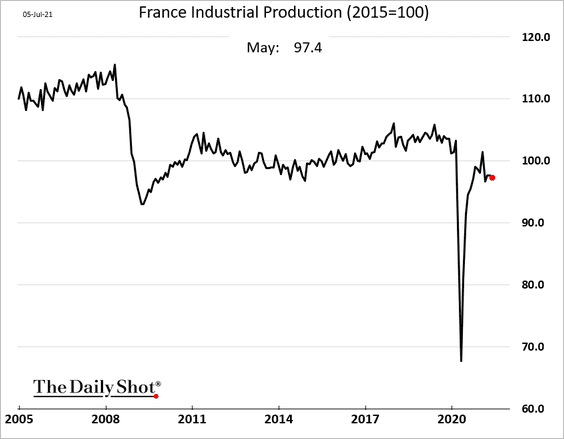
3. French industrial production is still substantially below pre-COVID levels.
4. German car production continues to fall amid semiconductor shortages.
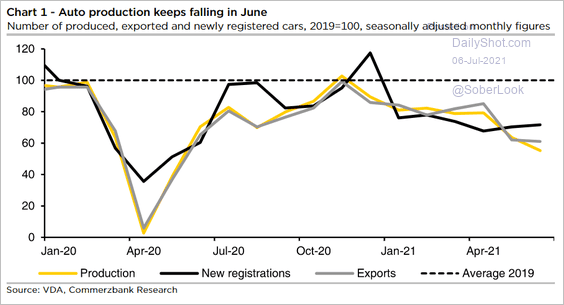 Source: Commerzbank Research
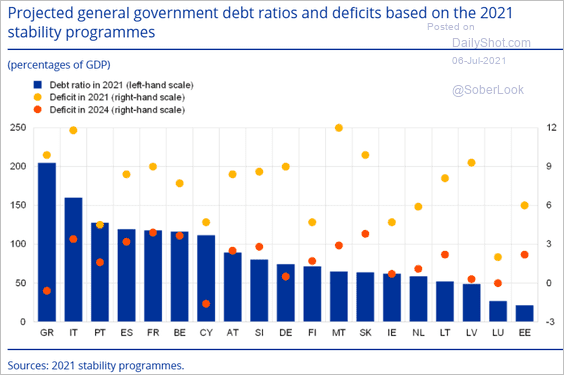
5. According to the ECB,
Some euro area countries are not planning to reduce their deficits to below the 3% of GDP threshold within the forecasting horizon, especially some with high debt-to-GDP ratios (most notably Italy, Spain, Belgium and France), while several others, including the former programme countries Greece, Cyprus and Portugal, are planning for comparably smaller budget deficits. The euro area average debt-to-GDP ratio is projected in the stability programmes to exceed 103% in 2021, implying an increase of around 17 percentage points compared with the pre-crisis level in 2019.
 Source: ECB Read full article
6. What percentage of euro-area firms received government support?
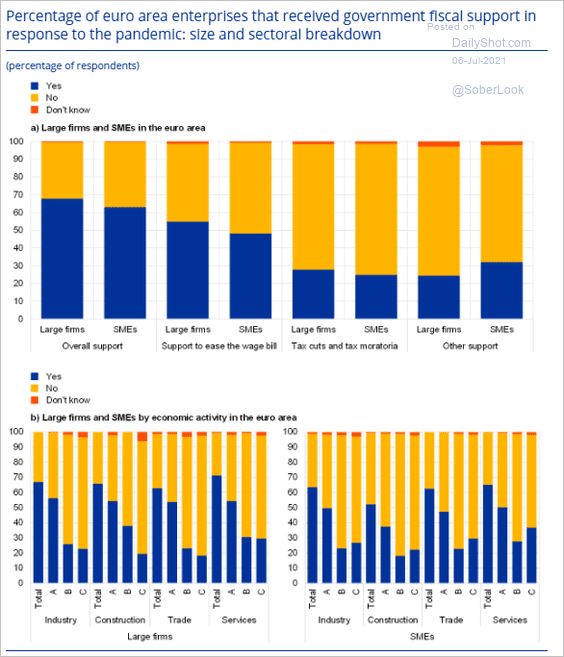 Source: ECB Read full article
7. There is still slack in the Eurozone’s labor markets.
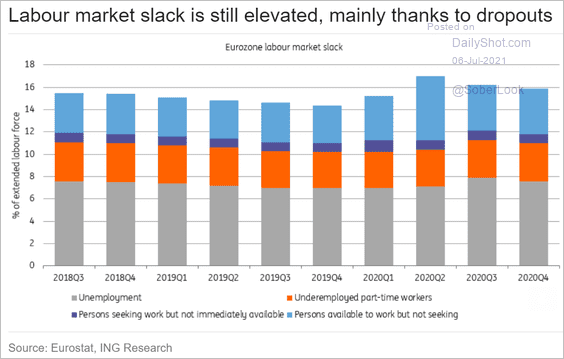 Source: ING
Back to Index
Europe
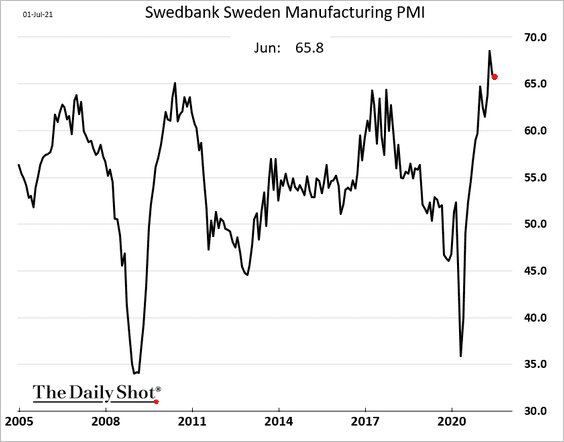
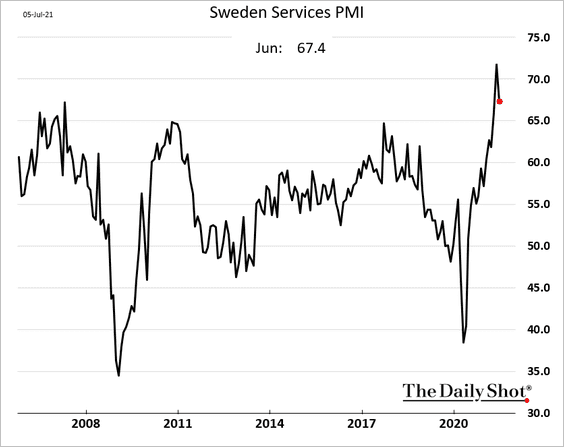
1. Sweden’s business growth remains exceptionally strong (2 charts).
——————–
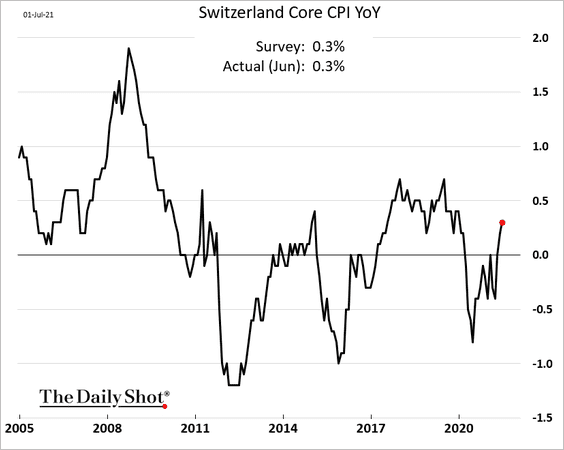
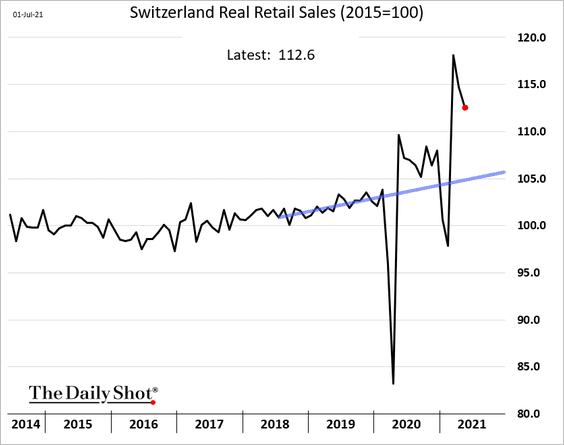
2. Swiss inflation continues to rebound.
The country’s retail sales are well above the pre-COVID trend.
——————–
3. Central European manufacturing is surging (2 charts).
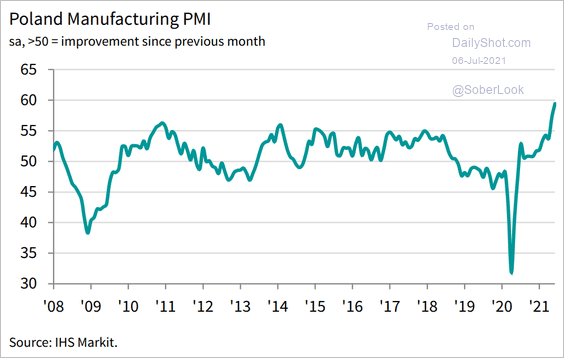 Source: IHS Markit
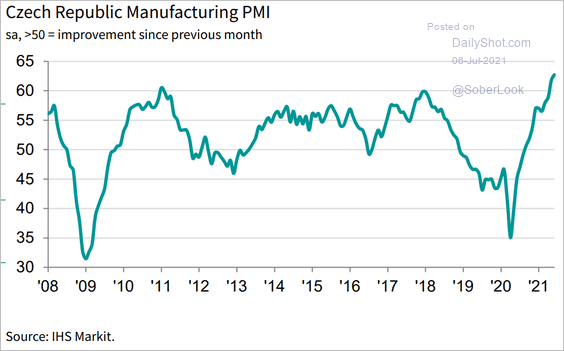 Source: IHS Markit
——————–
4. Flows into European equities have been impressive.
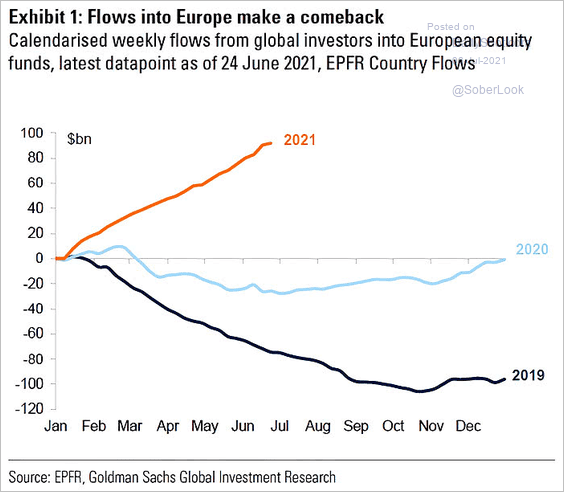 Source: @ISABELNET_SA, @GoldmanSachs
5. These charts show the expected duration of working life in the EU.
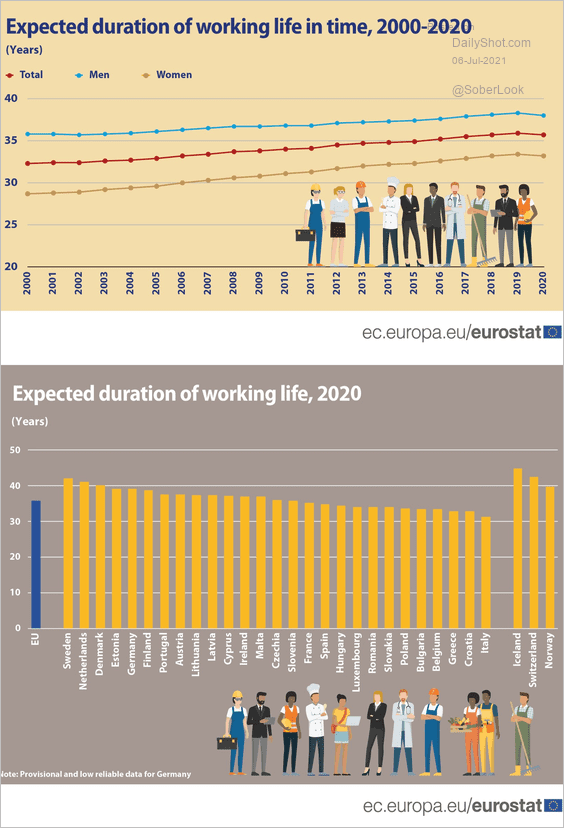 Source: Eurostat Read full article
Back to Index
The United Kingdom
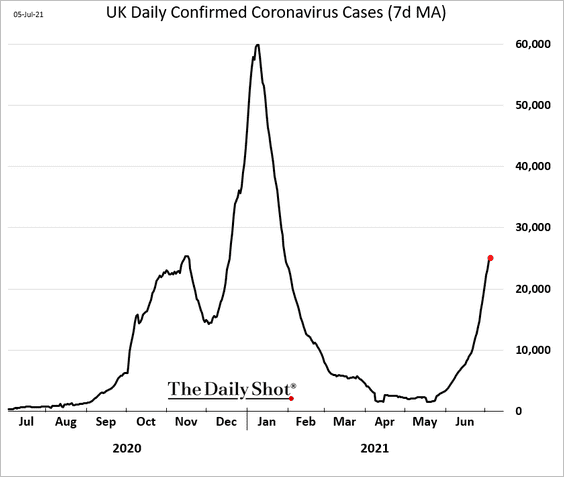
1. COVID cases are on the rise.
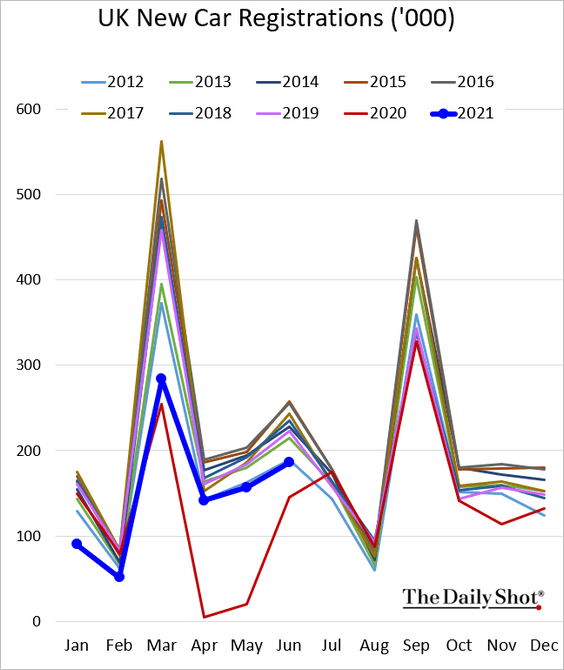
2. New car registrations are tracking 2012 levels.
3. Manufacturing growth remained strong last month.
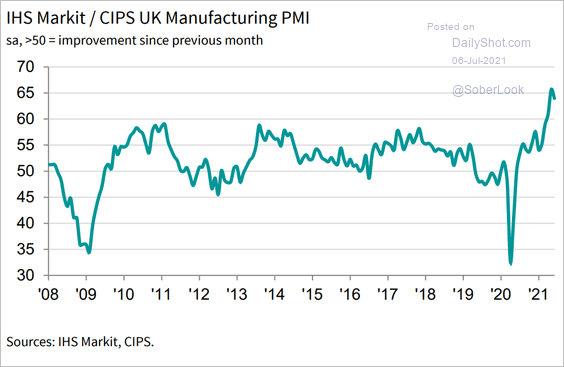 Source: IHS Markit
4. Business surveys suggest that the service-sector CPI will accelerate.
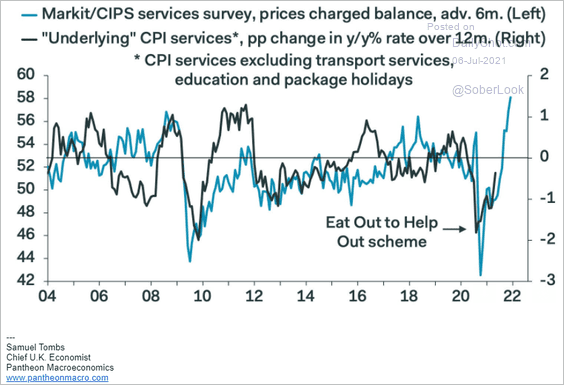 Source: Pantheon Macroeconomics
Back to Index
The United States
1. Many economists do not expect inflation to exceed 3% next year.
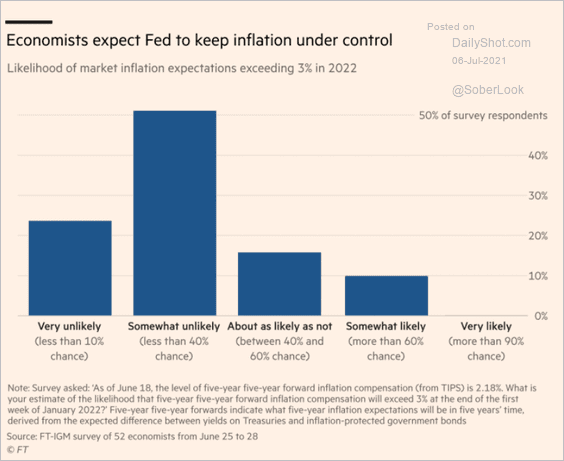 Source: @financialtimes Read full article
2. When will the unemployment rate return to pre-COVID levels?
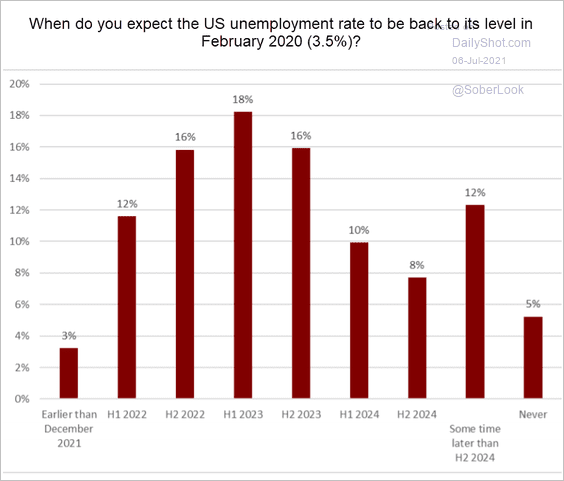 Source: FT, Chicago Booth Read full article
3. The correlation between consumer spending and disposable income has broken down.
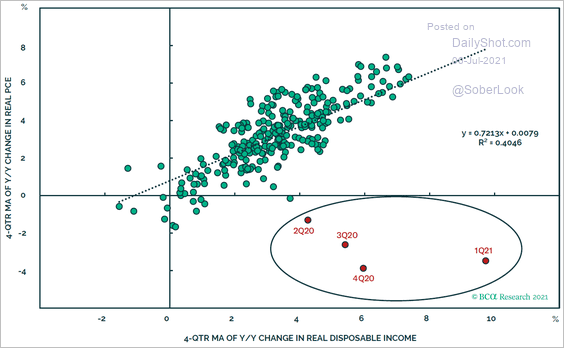 Source: BCA Research
4. High-income households drove the decline and the rebound in consumer spending.
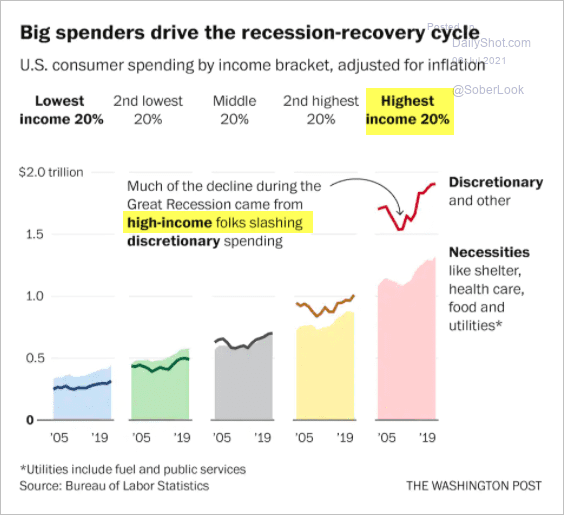 Source: @byHeatherLong, @andrewvandam Read full article
5. This chart shows US household wealth as a percentage of GDP.
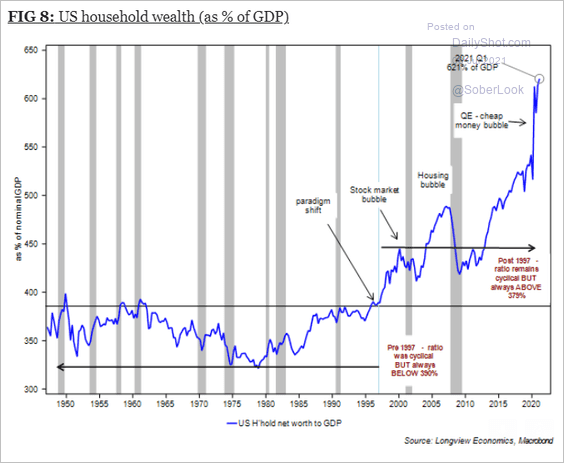 Source: Longview Economics
6. Morgan Stanley’s CapEx expectations index continues to climb.
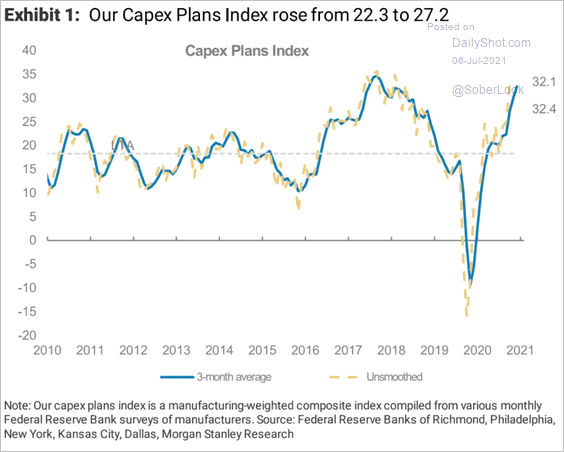 Source: Morgan Stanley Research
Back to Index
Global Developments
1. The rebound in activity levels has been uneven across sectors.
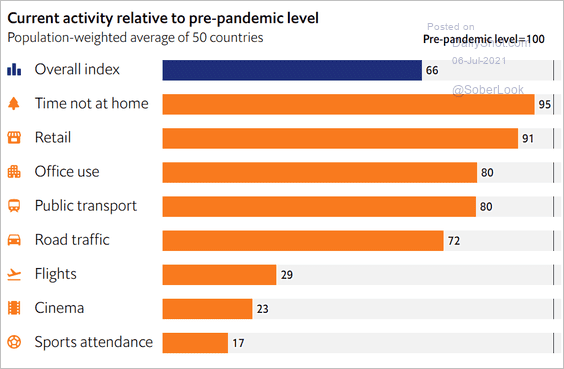 Source: The Economist Read full article
2. Home prices are pushing into bubble territory again.
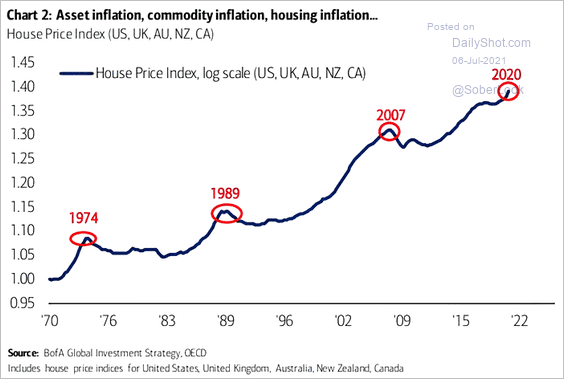 Source: @ISABELNET_SA, @BofAML
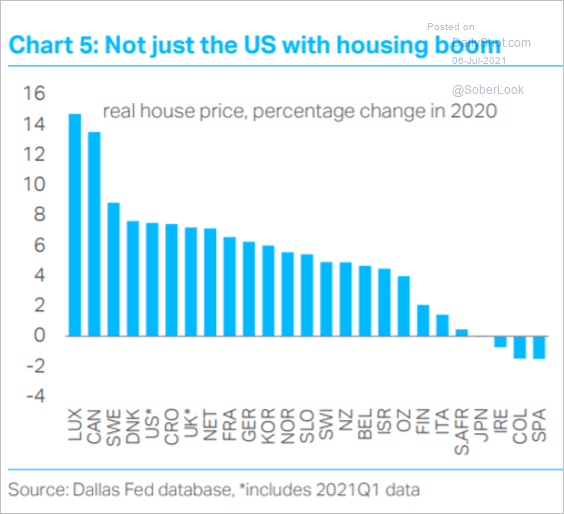 Source: TS Lombard
——————–
3. The global manufacturing PMI has peaked.
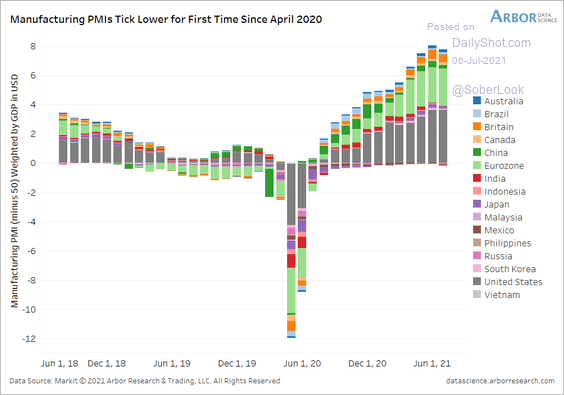 Source: Arbor Research & Trading
4. How has the distribution of consumer spending changed since 2009?
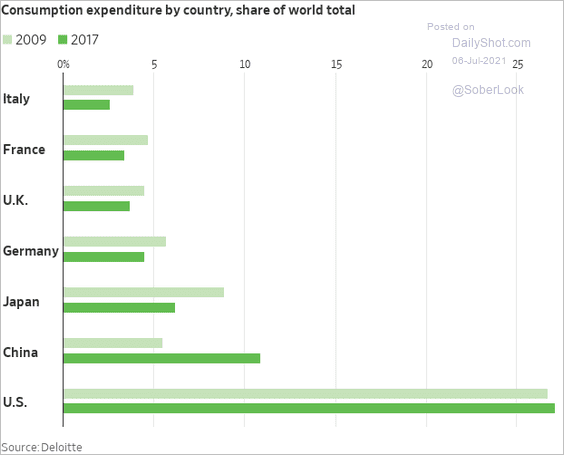 Source: @WSJ Read full article
——————–
Food for Thought
1. US tax return backlog:
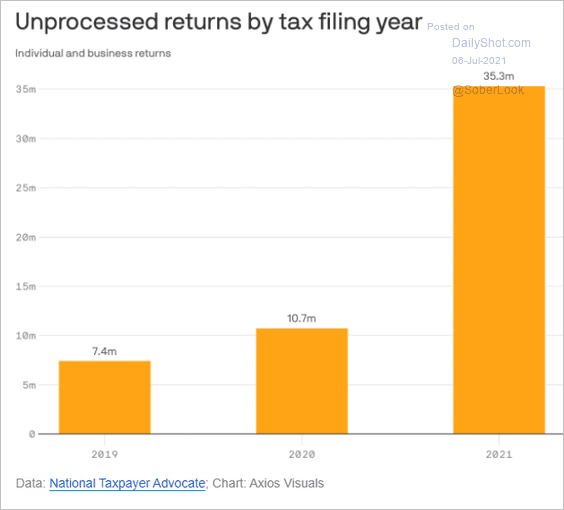 Source: @axios Read full article
2. Inheritance and gift tax as a share of total tax revenue:
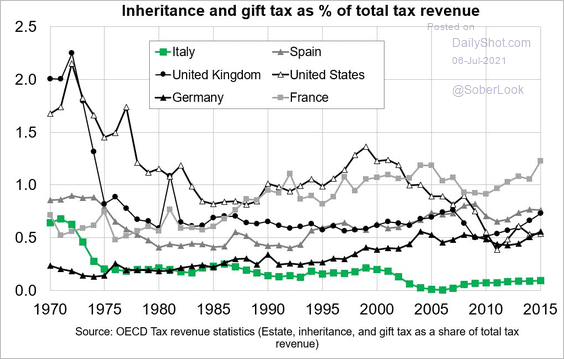 Source: OECD, @MorelliSal
3. Video gaming platforms:
 Source: Statista
4. Apple’s top suppliers:
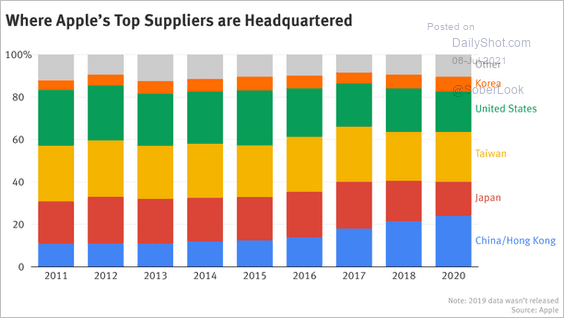 Source: The Information Read full article
5. Changing Jewish identity in the US:
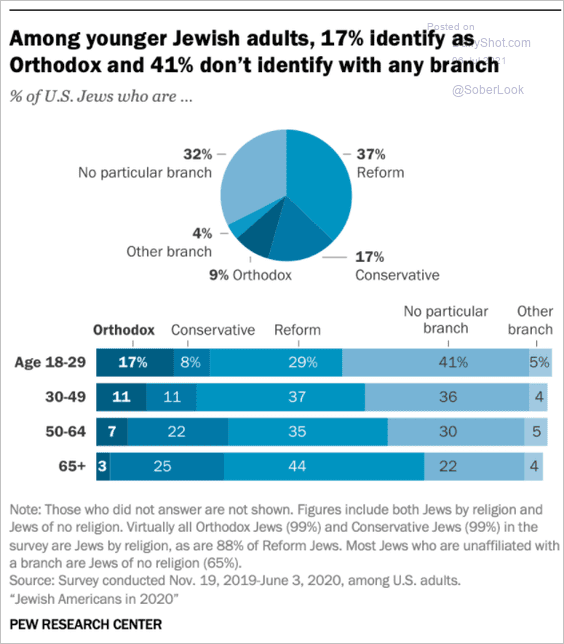 Source: Pew Research Center Read full article
6. US religious service attendance:
 Source: Gallup Read full article
7. Water requirements for different foods:
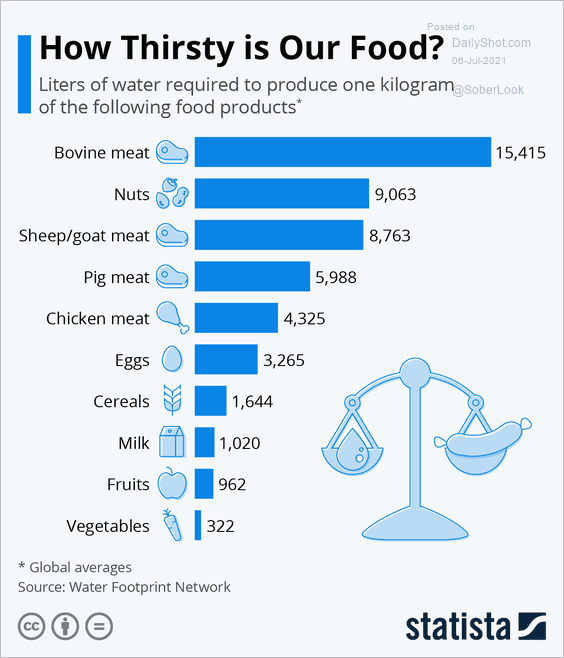 Source: Statista
8. Lawn and garden equipment emissions:
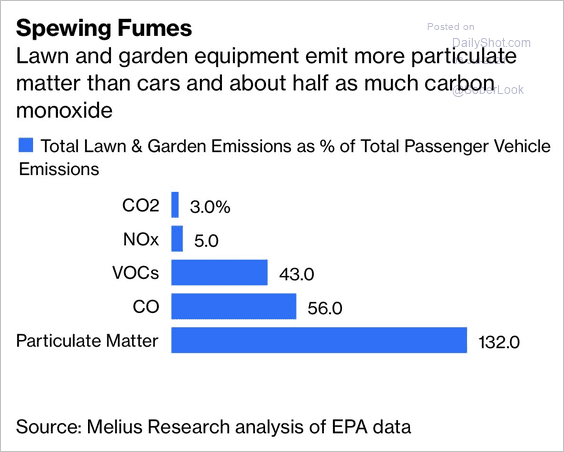 Source: Bloomberg Read full article
9. Awareness of the Delta variant:
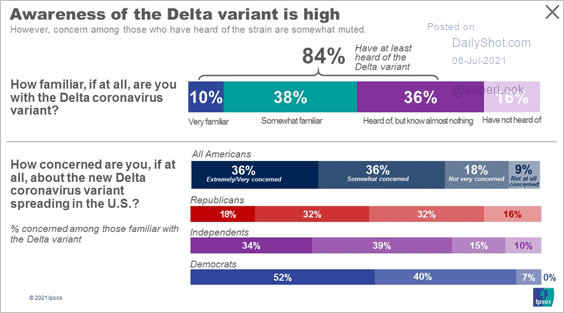 Source: Ipsos Read full article
10. Percentage of vegetarian restaurants in Europe:
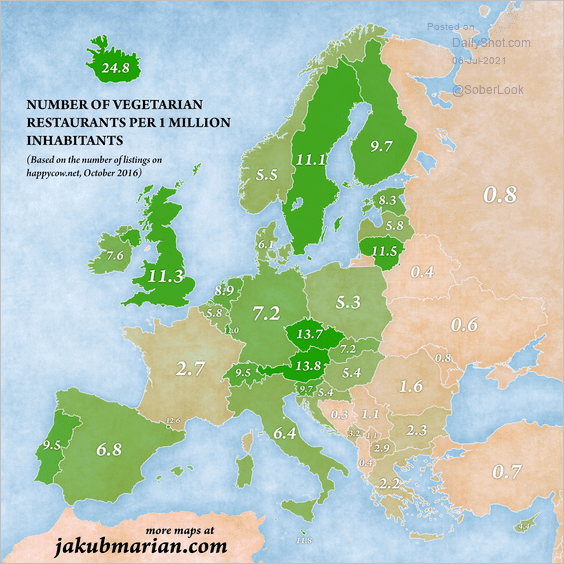 Source: jakubmarian.com Read full article
——————–
Back to Index