
The Daily Shot: 13-Jul-21
• The United States
• Europe
• Asia – Pacific
• China
• Emerging Markets
• Cryptocurrency
• Commodities
• Energy
• Equities
• Credit
• Global Developments
• Food for Thought
The United States
1. Job postings on Indeed are now substantially higher than the levels we saw before the pandemic.
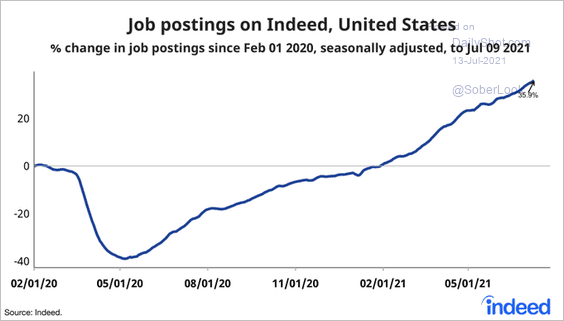 Source: @JedKolko, @indeed
Consumer and business survey data suggest that the unemployment rate should be below 4%.
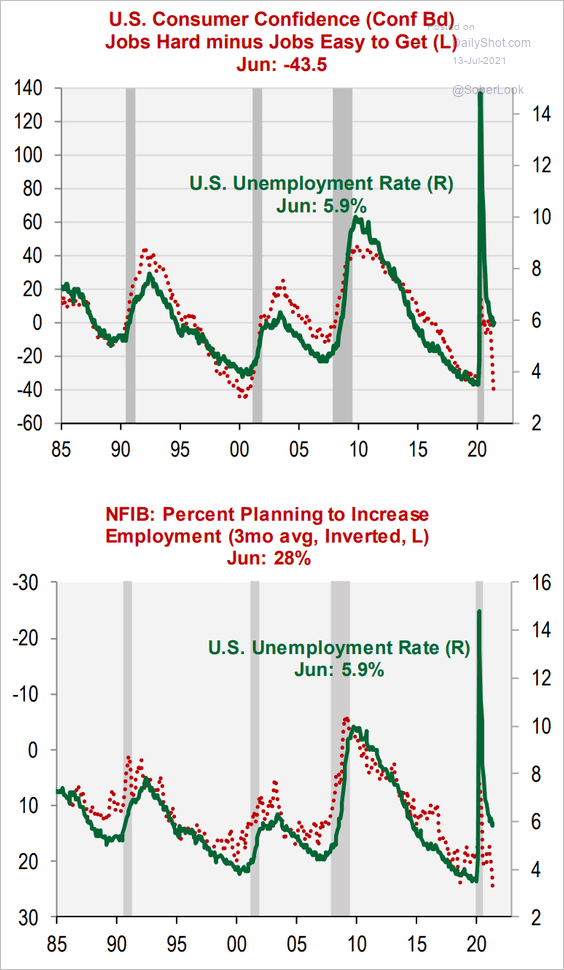 Source: Cornerstone Macro
——————–
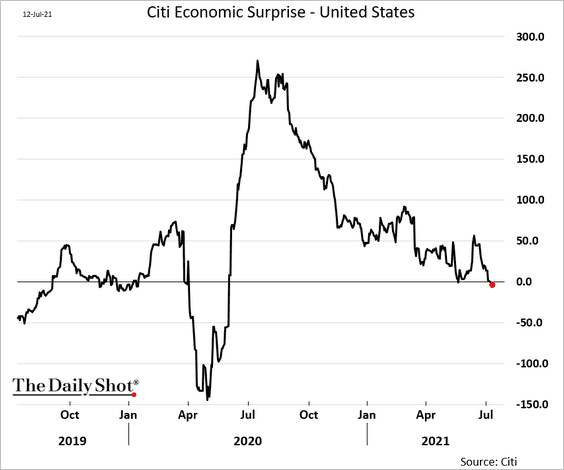
2. The Citi Economic Surprise index is back below zero, pointing to some loss of economic momentum.
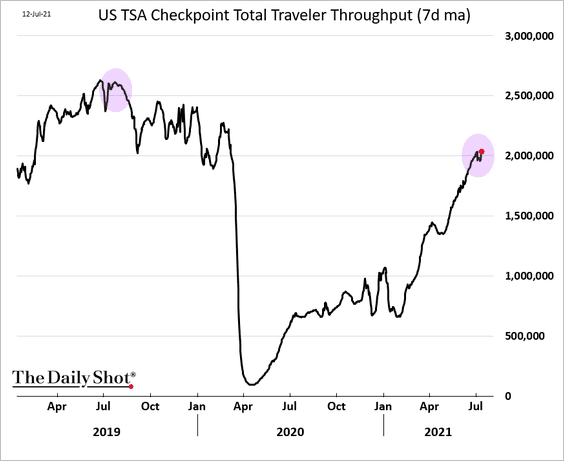
3. Air travel continues to recover but is still about half a million (per day) below the July of 2019 throughput.
4. Next, we have some updates on inflation.
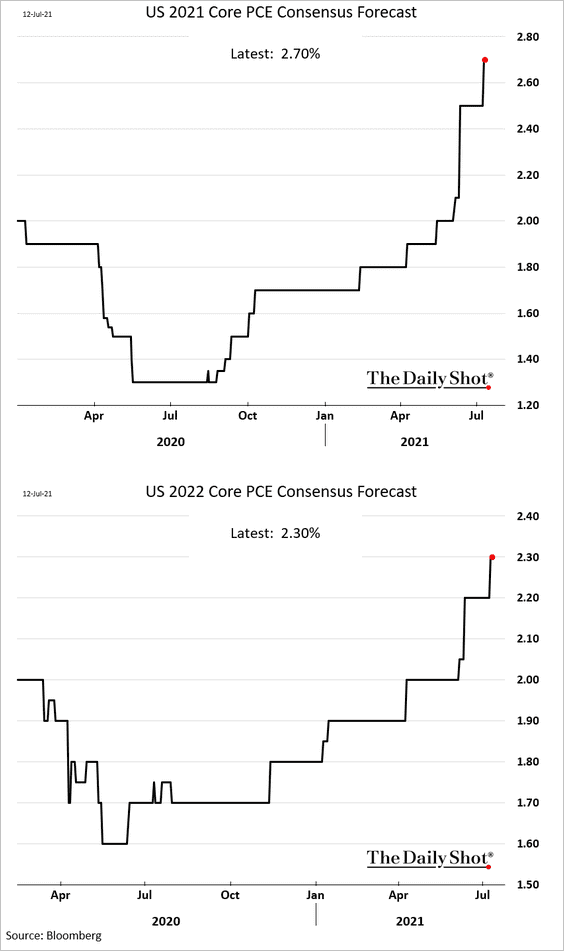
• Economists continue to upgrade their inflation forecasts.
• Increases in US freight rates accelerated last month.
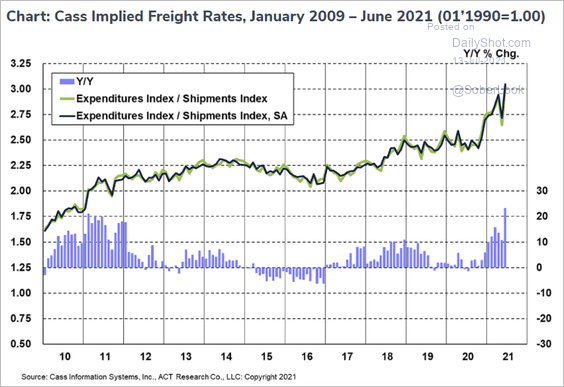 Source: Cass Information Systems
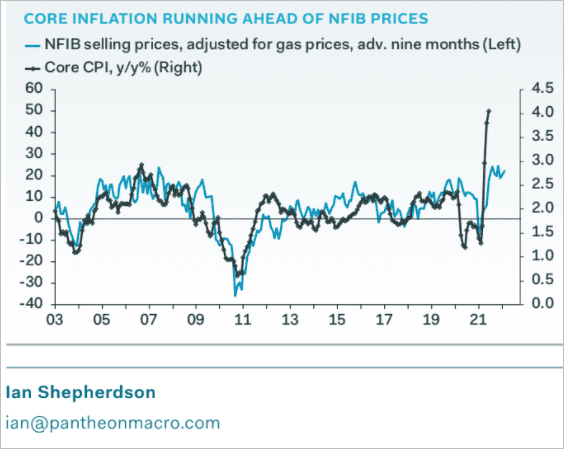
• According to the NFIB small business data, the core CPI should moderate soon.
——————–
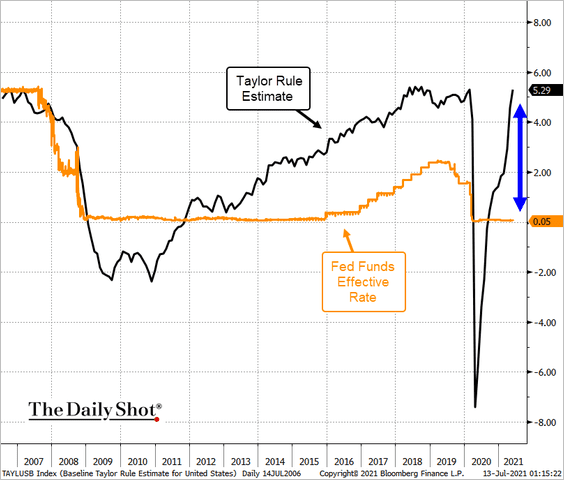
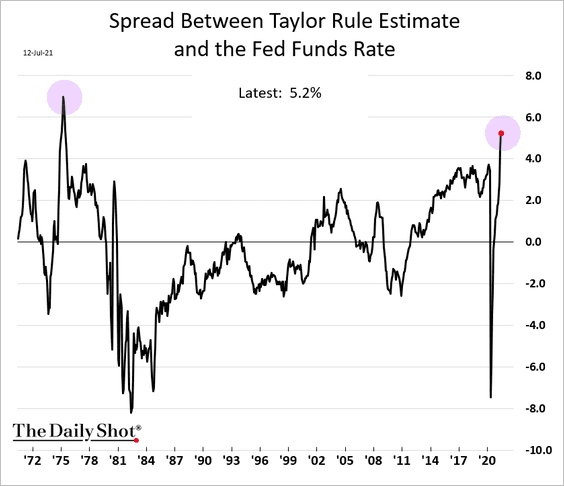
5. The spread between the Taylor Rule (an estimate of where a central bank policy rate should be) and the fed funds rate has widened sharply.
 Source: @TheTerminal, Bloomberg Finance L.P.
In fact, we just hit levels we haven’t seen since the 1970s. And that was an interesting decade.
——————–
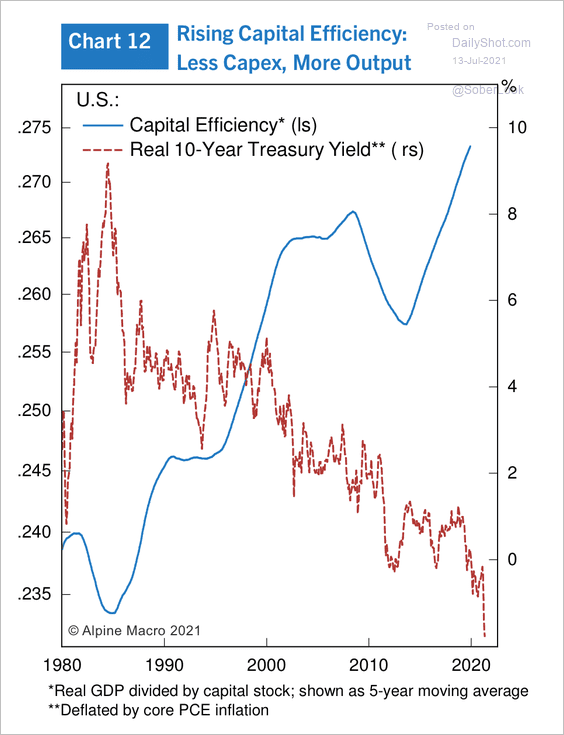
6. The capital efficiency ratio has risen since 1985, which implies that less capital investment is required to generate the same amount of output.
 Source: Alpine Macro
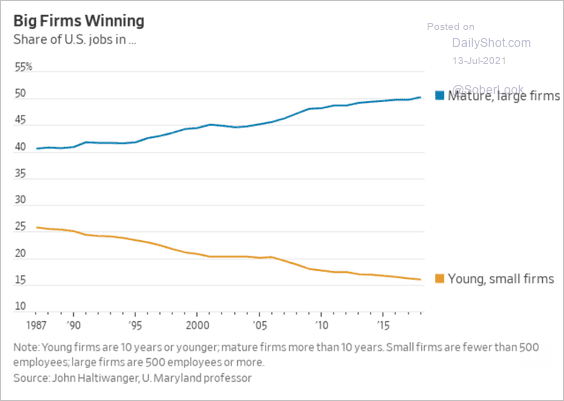
7. Established large firms increasingly dominate hiring in the US.
 Source: @WSJ Read full article
Back to Index
Europe
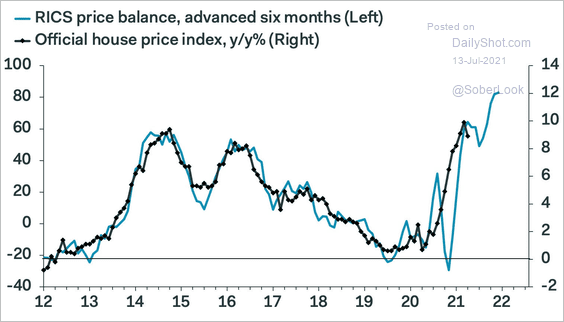
1. The UK’s official house price index is expected to accelerate further.
 Source: Pantheon Macroeconomics
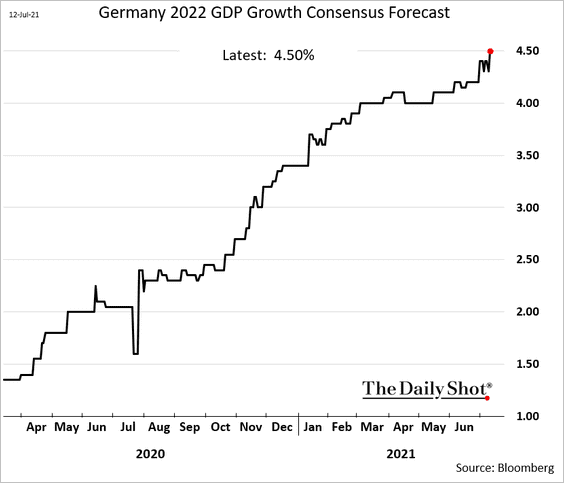
2. Economists continue to upgrade their forecasts for Germany’s GDP growth in 2022.
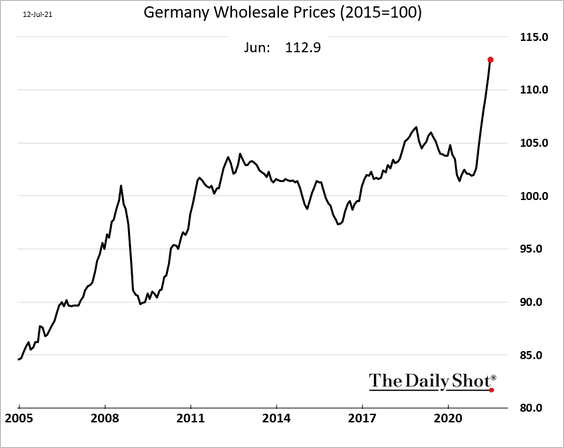
3. German wholesale prices are surging.
Back to Index
Asia – Pacific
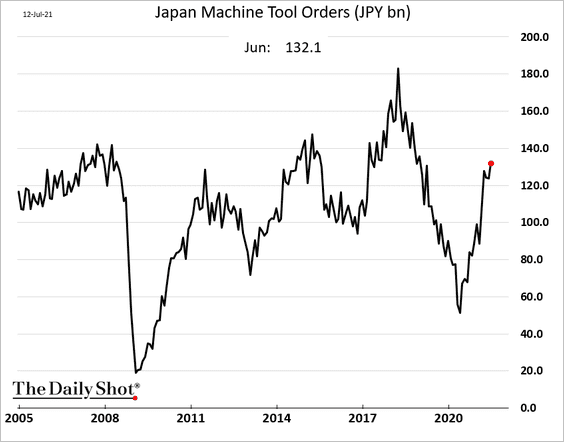
1. Japan’s machine tool orders continue to climb.
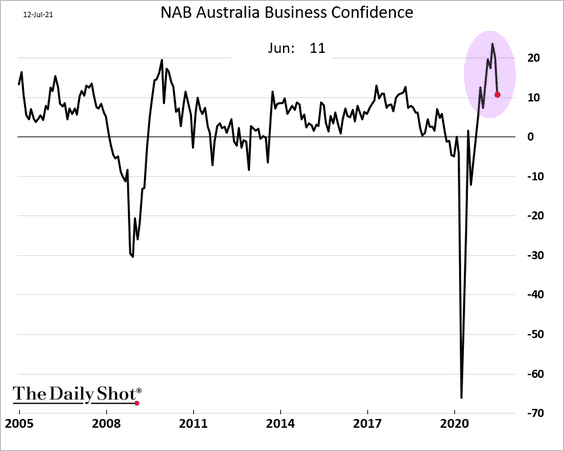
2. Australia’s business confidence took a hit last month.
 Source: Reuters Read full article
Back to Index
China
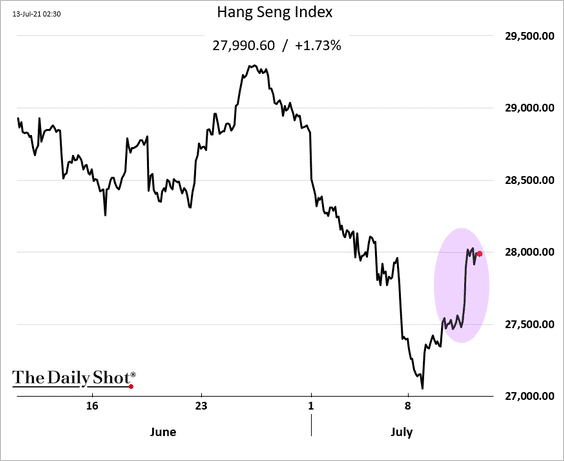
1. Exports accelerated in June, exceeding forecasts.
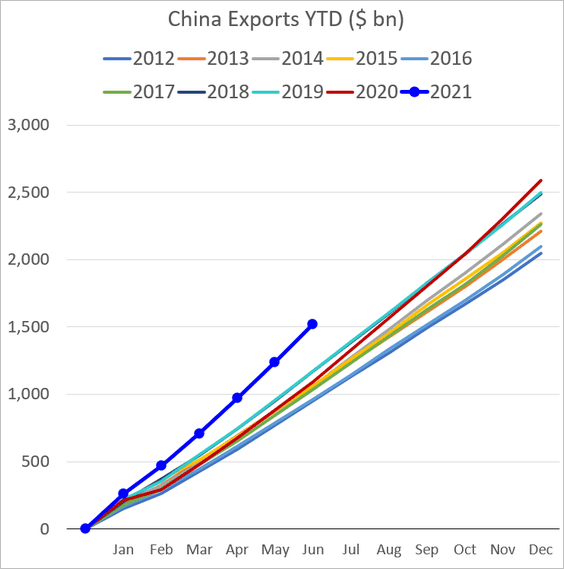
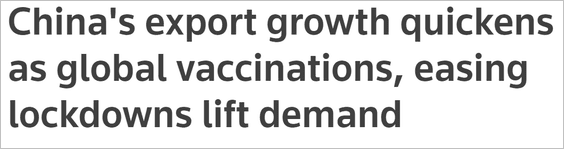 Source: Reuters Read full article
Shares in Hong Kong jumped in response to the report.
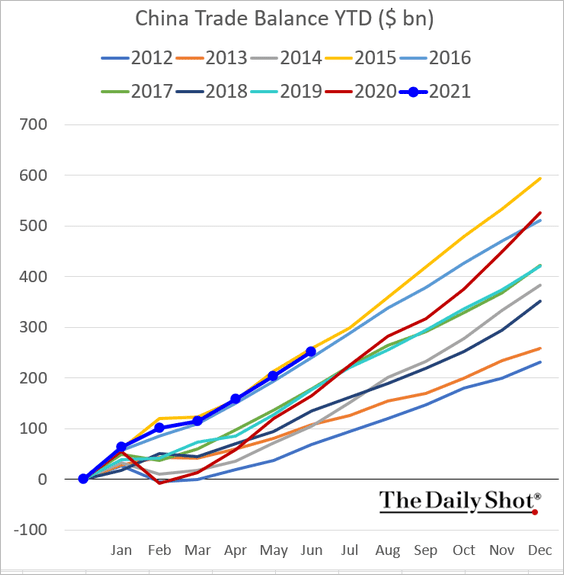
Here is the trade balance (year-to-date).
——————–
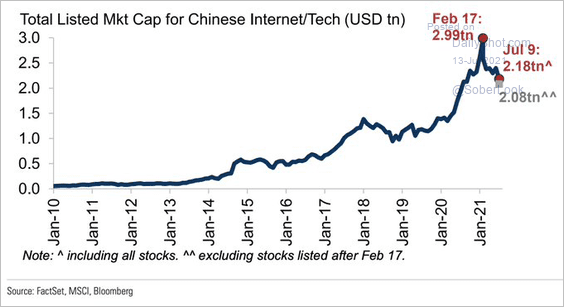
2. Beijing’s tech crackdown did some damage to public shares’ market cap.
 Source: Goldman Sachs; @Schuldensuehner
Back to Index
Emerging Markets
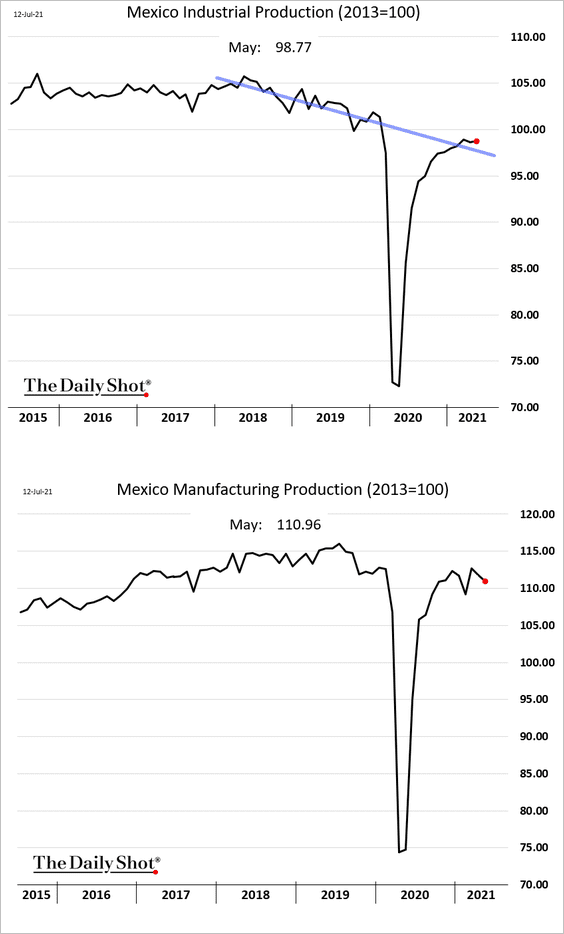
1. Mexico’s manufacturing output (2nd chart) declined in May.
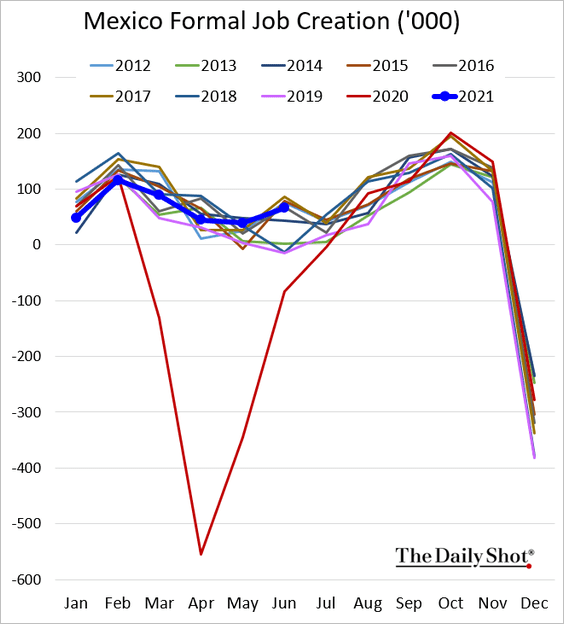
Formal job creation seems to be improving.
——————–
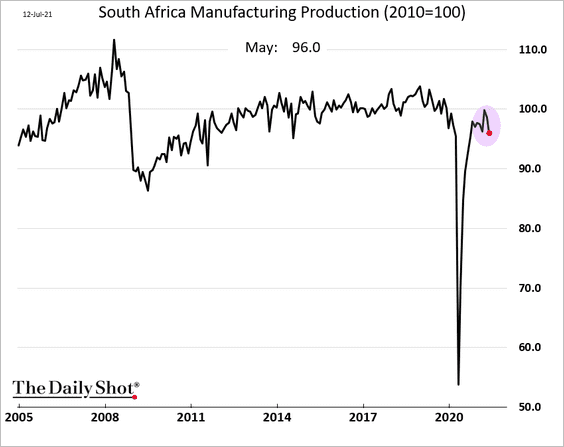
2. South Africa’s manufacturing production also declined in May.
3. Next, we have some updates on India.
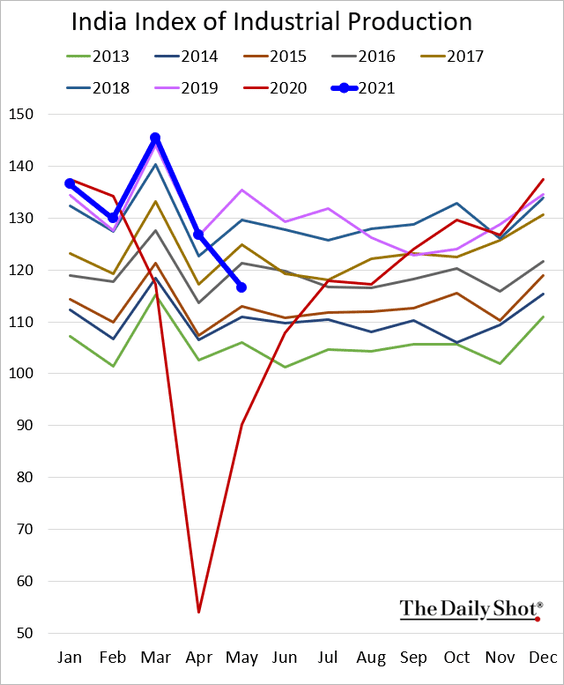
• Industrial production tumbled in May.
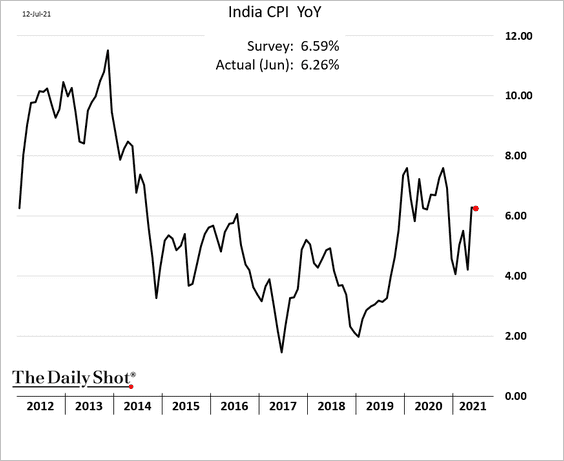
• Inflation held steady last month.
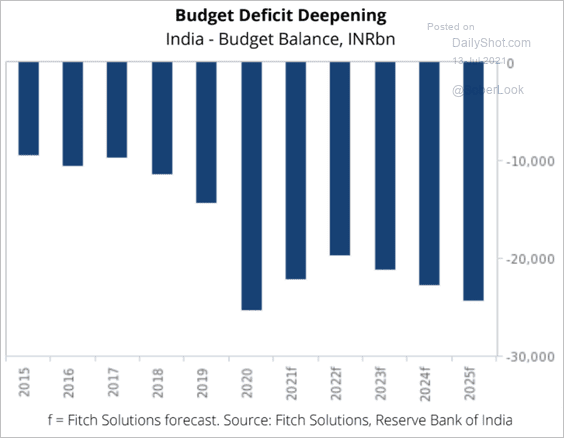
• The budget deficit is expected to keep deepening.
 Source: Fitch Solutions Macro Research
——————–
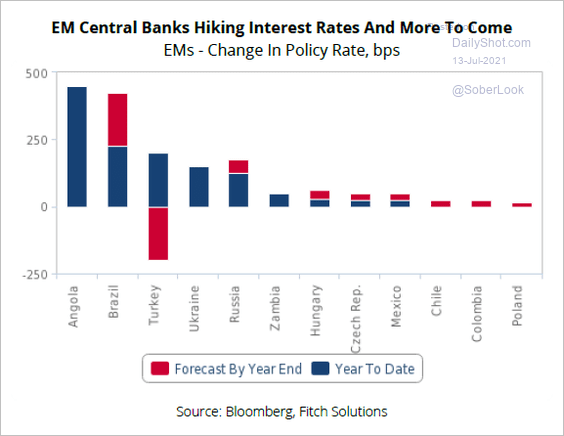
4. There are more rate hikes on the way this year.
 Source: Fitch Solutions Macro Research
Back to Index
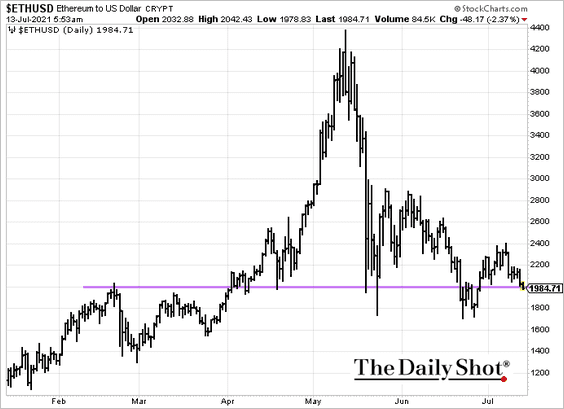
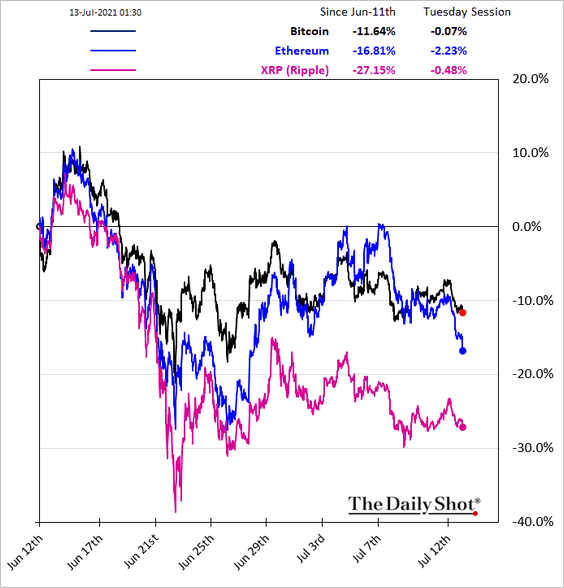
Cryptocurrency
1. Ethereum is back below $2k.
2. Here is the relative performance over the past 30 days.
Back to Index
Commodities
1. The recent copper-oil divergence has been unusual.
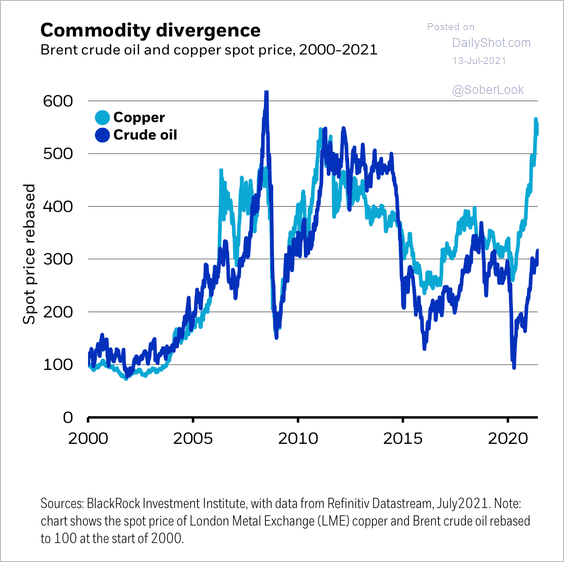 Source: BlackRock
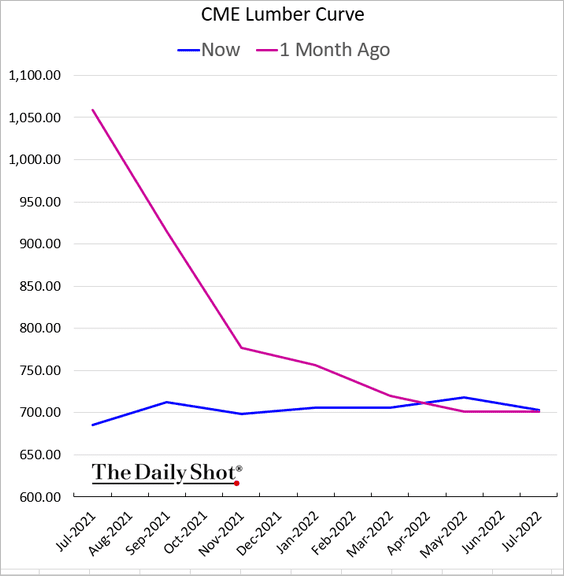
2. US lumber futures continue to plummet. We are down over 50% from the peak on the September contract.
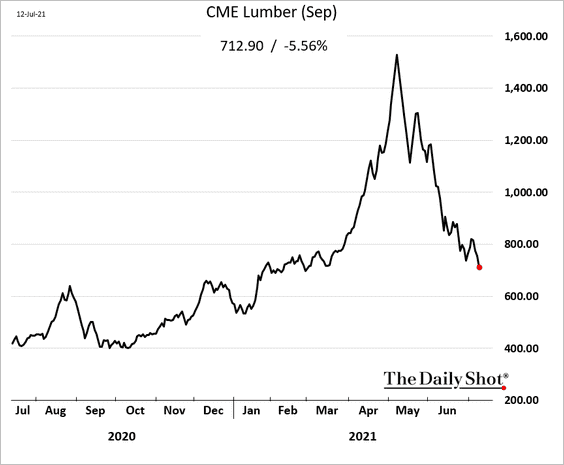
The curve is now in contango (an indication of a well-supplied market).
——————–
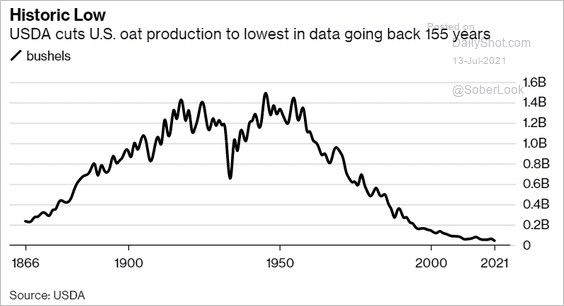
3. Oat futures are climbing.
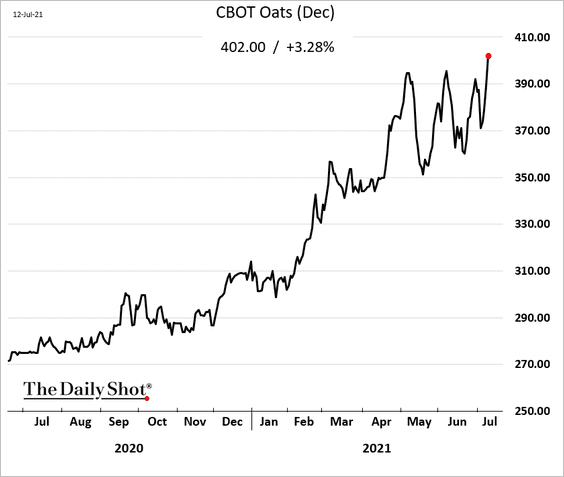
US oat production is the lowest in at least 155 years.
 Source: Bloomberg Read full article
——————–
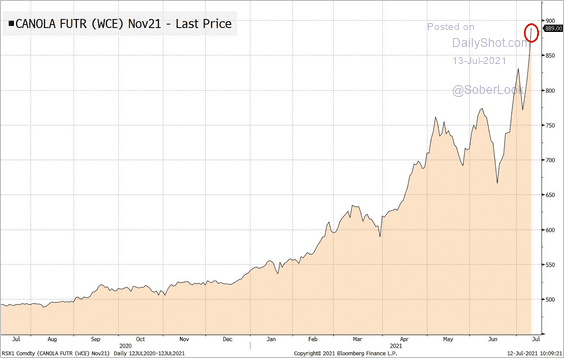
4. Canola prices are surging due to drought conditions on the Canadian Prairies. Farmers are canceling deliveries to grain handlers who are forced to cover their short positions, sending prices higher.
 Source: @TheStalwart
Back to Index
Energy
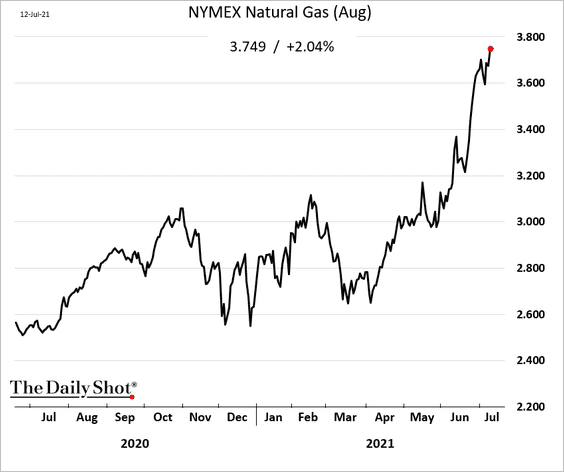
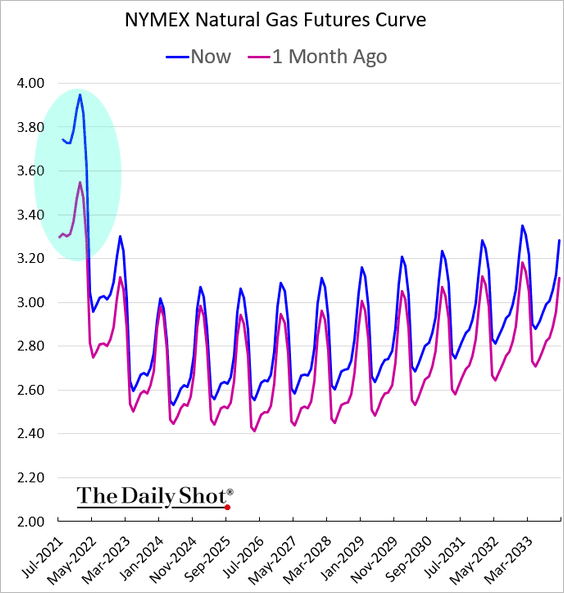
1. US natural gas prices keep climbing.
The curve has moved deeper into backwardation.
——————–
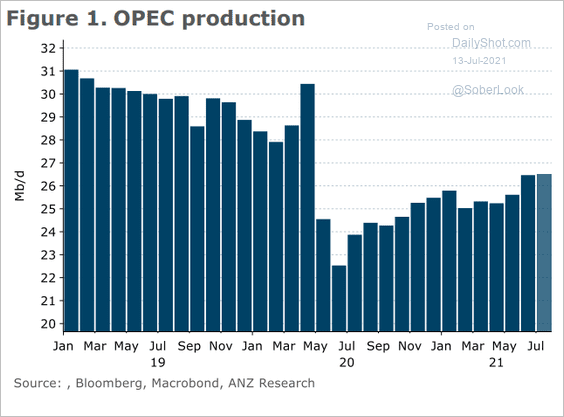
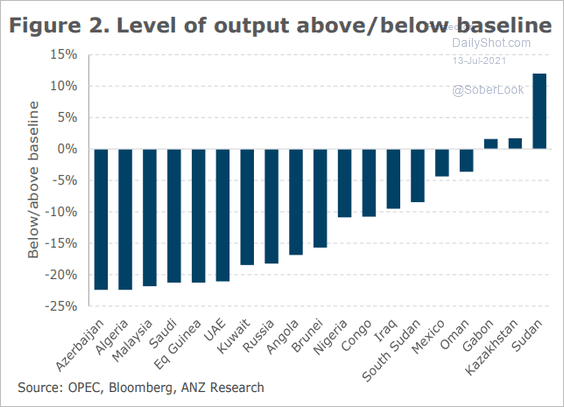
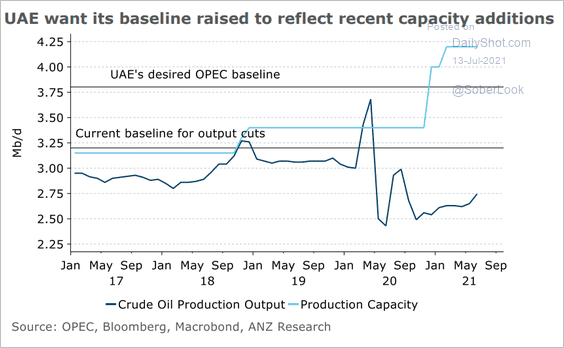
2. Next, we have some data on OPEC.
• Production:
 Source: ANZ Research
• Production relative to baseline:
 Source: ANZ Research
• UAE’s “desired” vs. actual baseline (the cause of the OPEC+ impasse):
 Source: ANZ Research
Back to Index
Equities
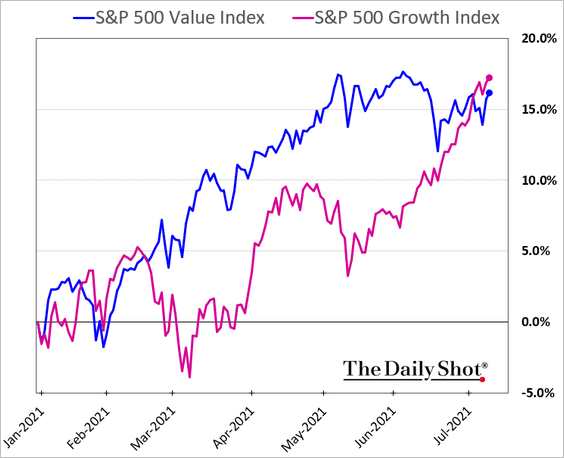
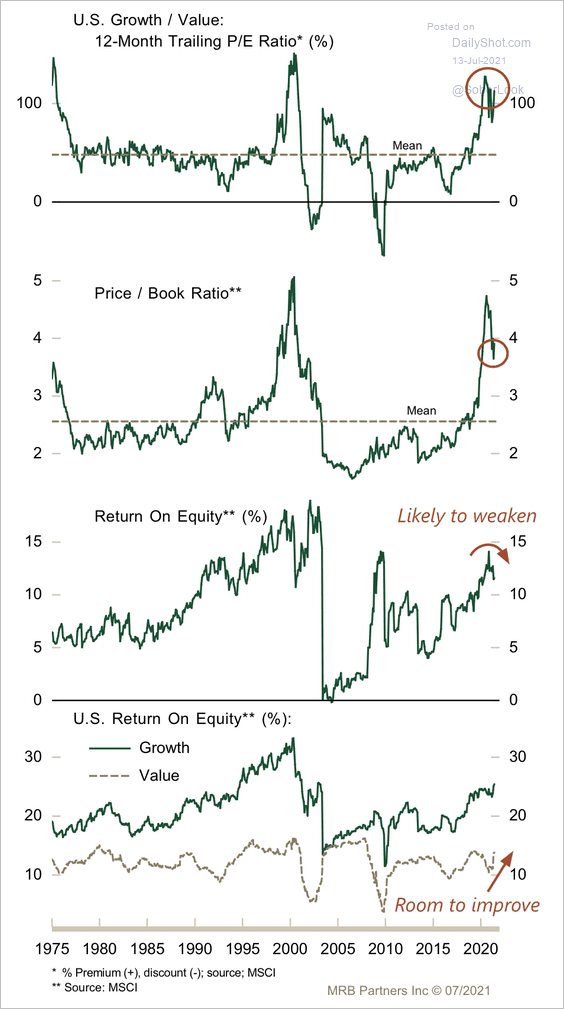
1. Growth stocks are now outperforming value on a year-to-date basis.
• Growth remains relatively expensive by historical standards.
 Source: MRB Partners
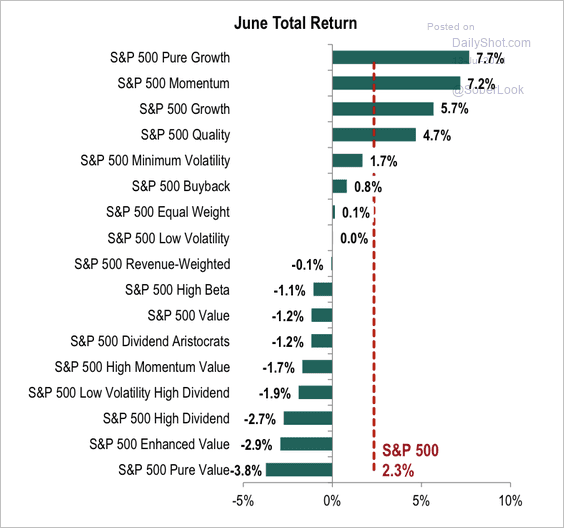
• The pure growth factor had its best month in June relative to pure value since March 2020, according to S&P Global (2 charts).
 Source: S&P Global Market Intelligence
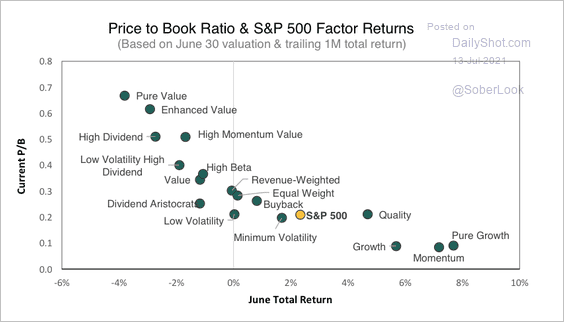 Source: S&P Global Market Intelligence
——————–
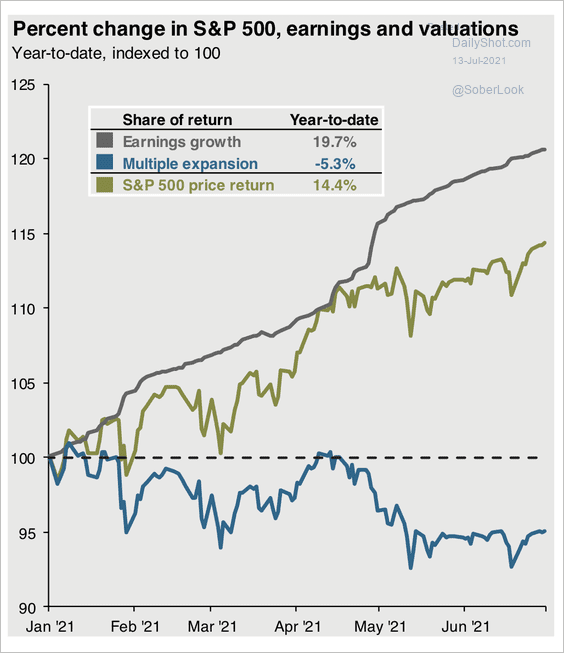
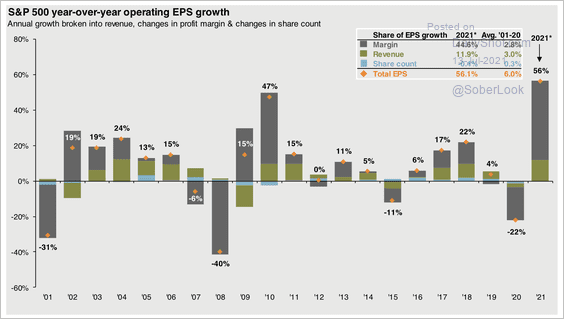
2. Earnings growth has been a key driver of equity performance this year.
 Source: JP Morgan Asset Management
3. Margin expansion has also been strong.
 Source: JP Morgan Asset Management
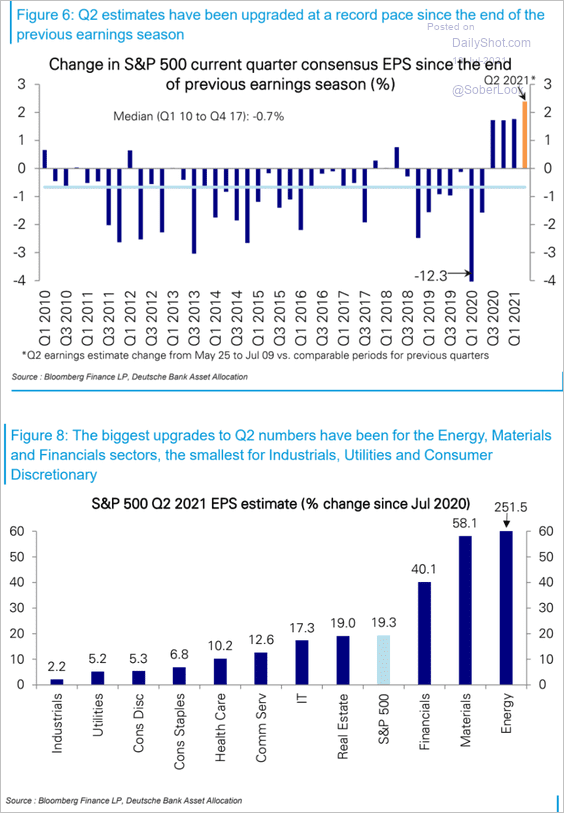
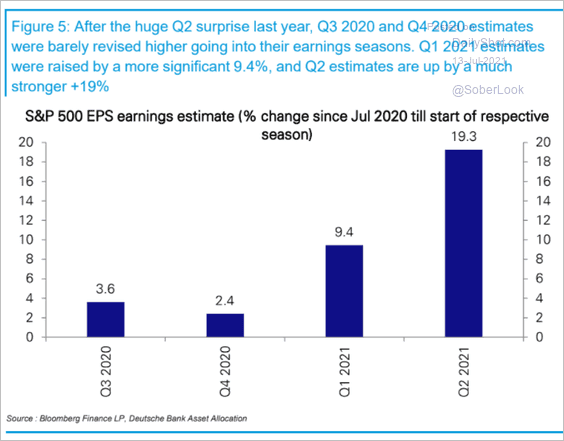
4. As mentioned previously, the Q2 earnings estimates had the biggest upgrade we’ve seen in years (updated charts below).
 Source: Deutsche Bank Research
The bar has been raised substantially.
 Source: Deutsche Bank Research
——————–
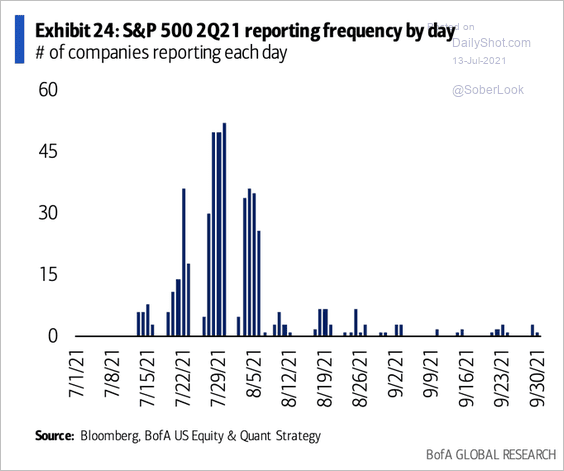
5. Here comes the earnings season.
 Source: @MylesUdland, @BofA_Business
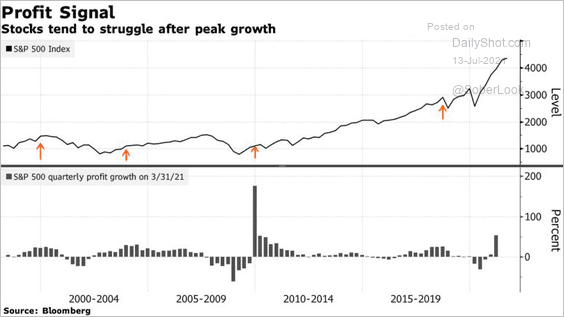
6. Stocks tend to struggle after peak profit growth.
 Source: @markets Read full article
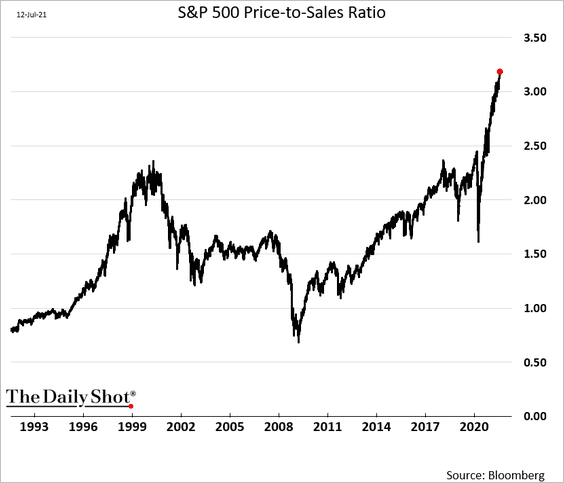
7. Below is the S&P 500 price-to-sales ratio.
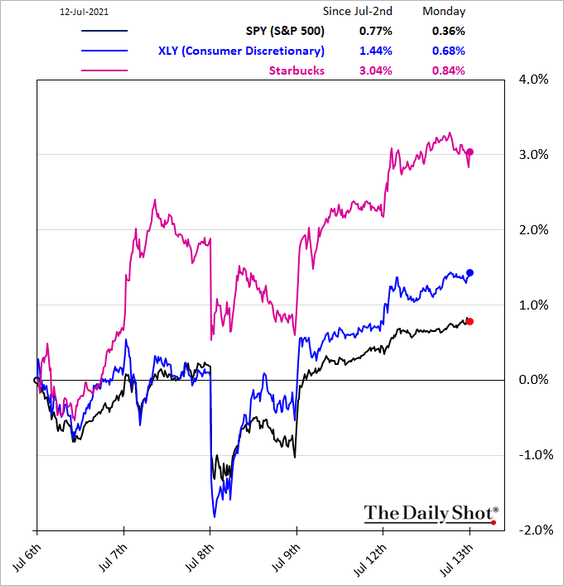
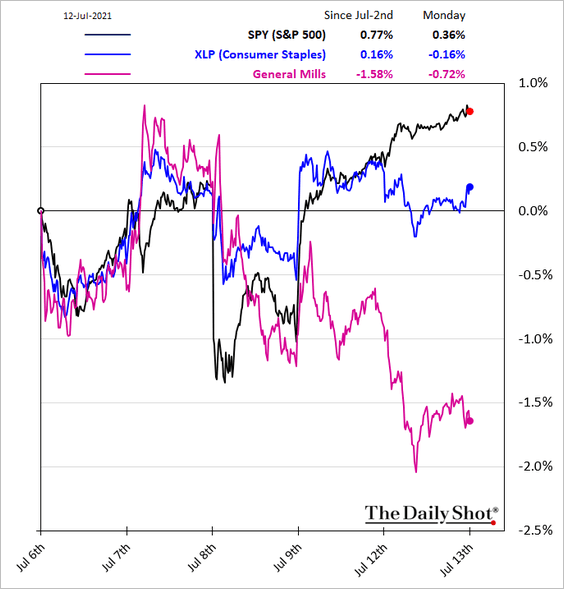
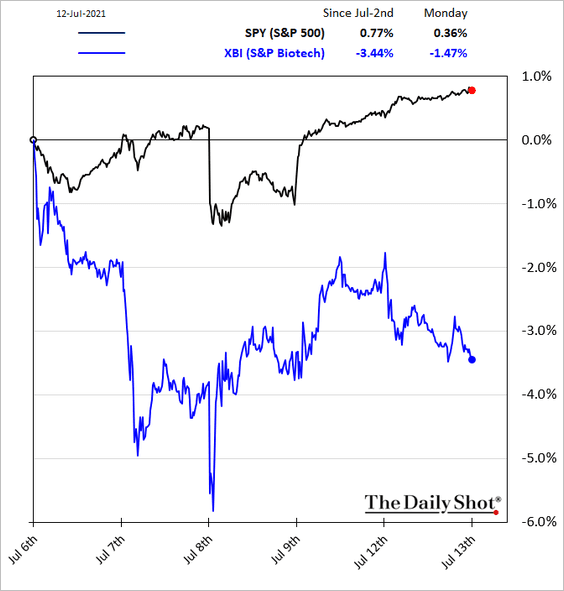
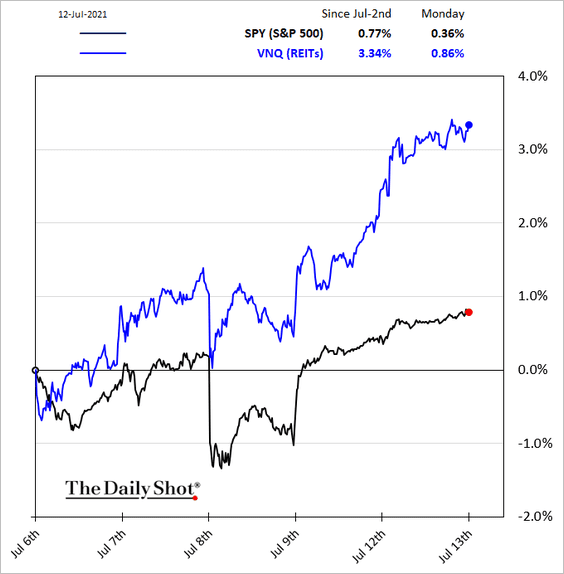
8. Next, we have some sector updates.
• Consumer Discterionary:
• Consumer Staples:
• Biotech:
• Transportation:
![]()
• Real estate operators (REITs):
Back to Index
Credit
1. The CCC – single-B bond spread hit the lowest level since 2007.
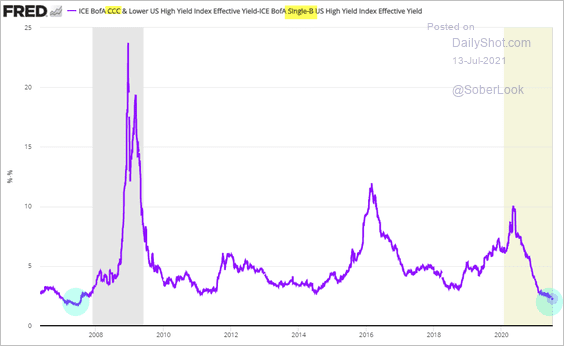
The spread between high-yield and investment-grade indices is also extraordinarily tight.
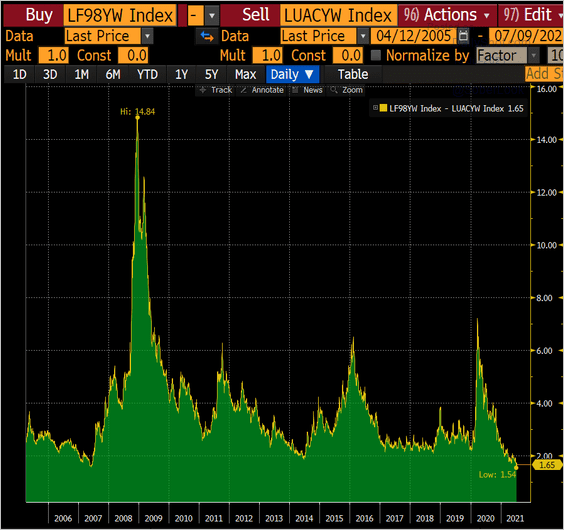 Source: @lisaabramowicz1
——————–
2. Leveraged loan lender protections are melting away.
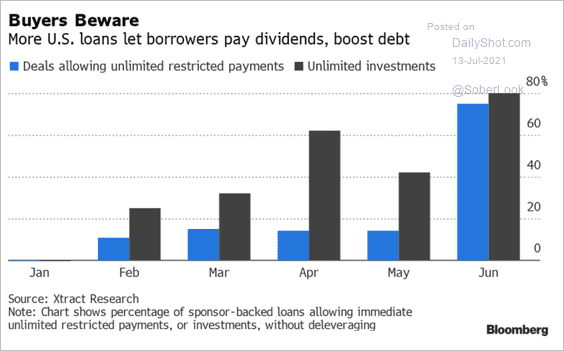 Source: @bloomberglaw Read full article
3. Morgan Stanley’s wealth management clients are borrowing a lot of money.
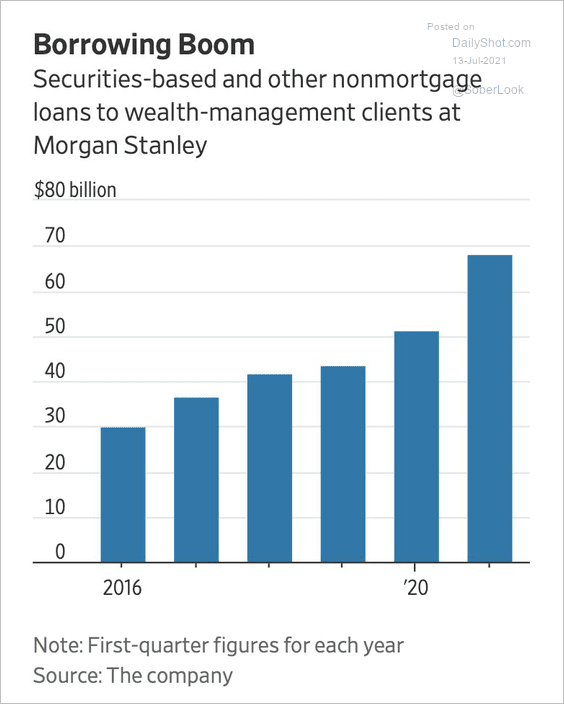 Source: @jessefelder, @WSJ Read full article
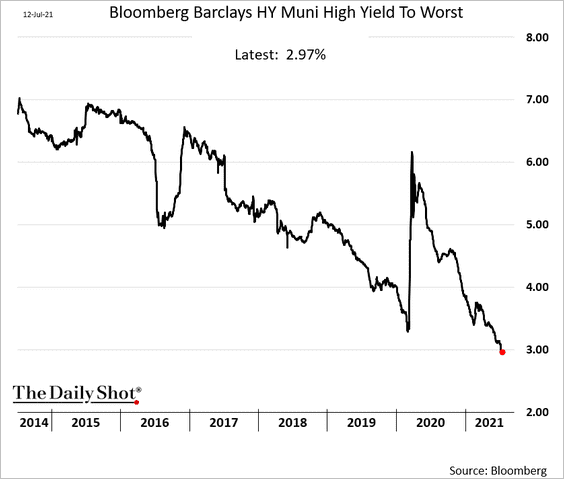
4. High-yield muni yields are near record lows.
Back to Index
Global Developments
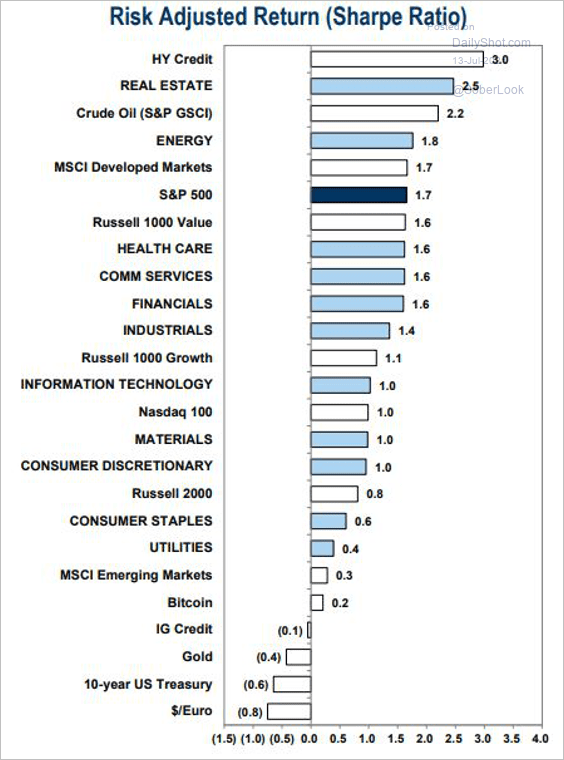
1. Let’s begin with the year-to-date risk-adjusted returns.
 Source: Goldman Sachs; @TheStalwart Read full article
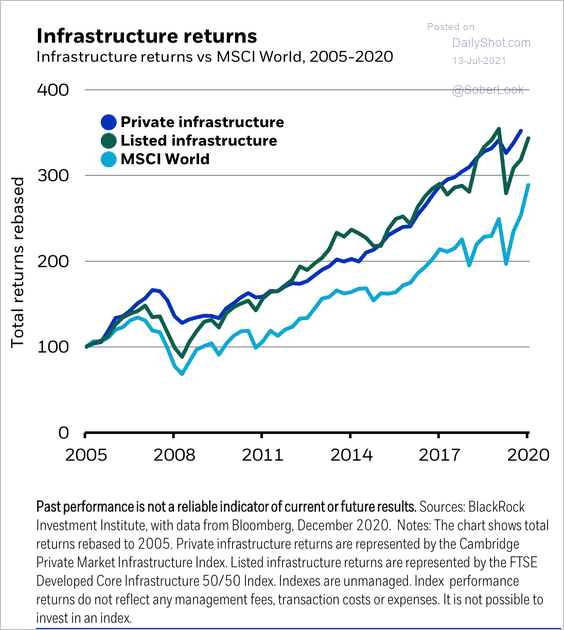
2. Infrastructure assets have outperformed the stock market since 2005.
 Source: BlackRock
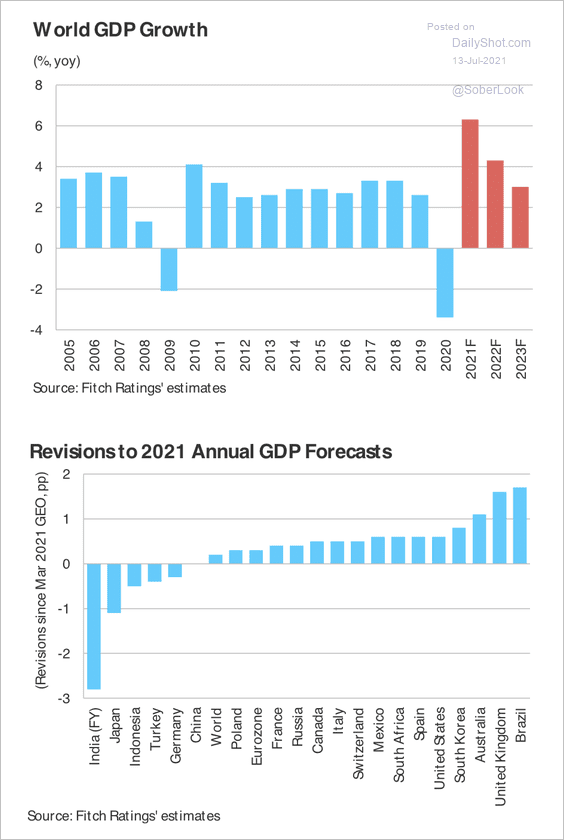
3. Fitch expects world GDP to grow by 6.3% this year, higher than its March forecast of 6.1%. Upward revisions are primarily focused on developed economies and reflect positive data surprises and service sector reopenings.
 Source: Fitch Ratings
4. Below is a summary of unemployment rates and job retention schemes.
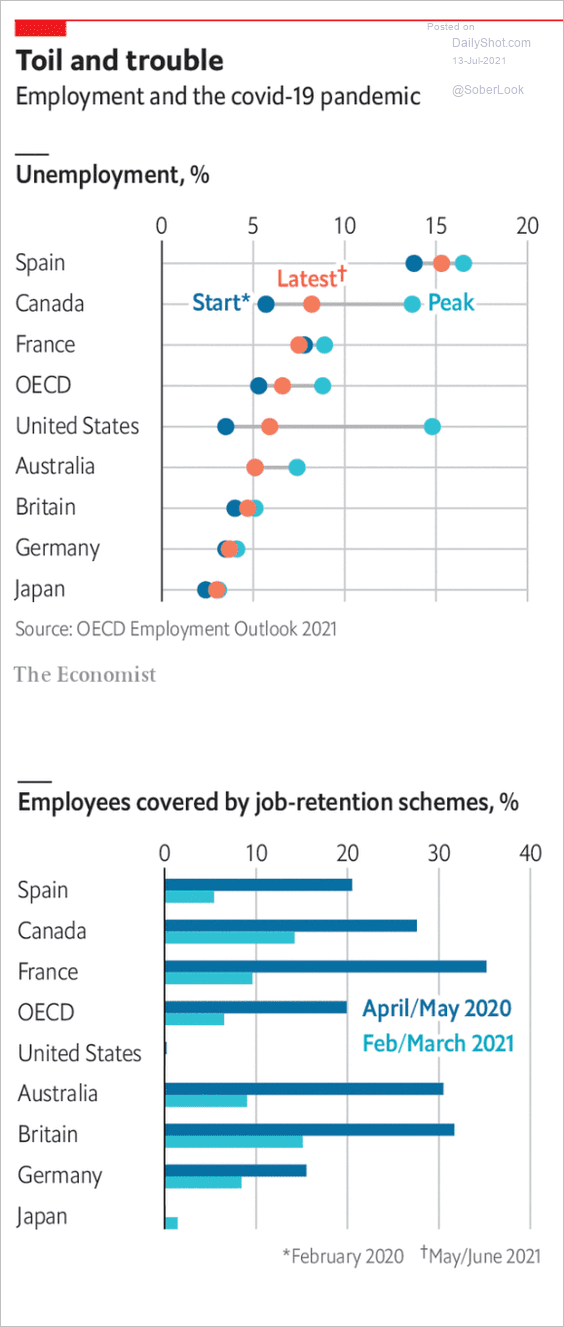 Source: The Economist Read full article
——————–
Food for Thought
1. Boosting sustainable lifestyle:
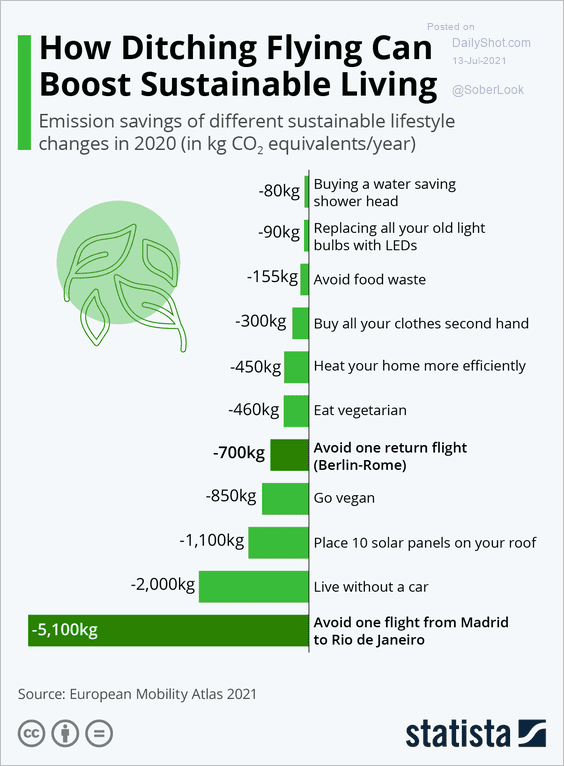 Source: Statista
2. Methane emissions:
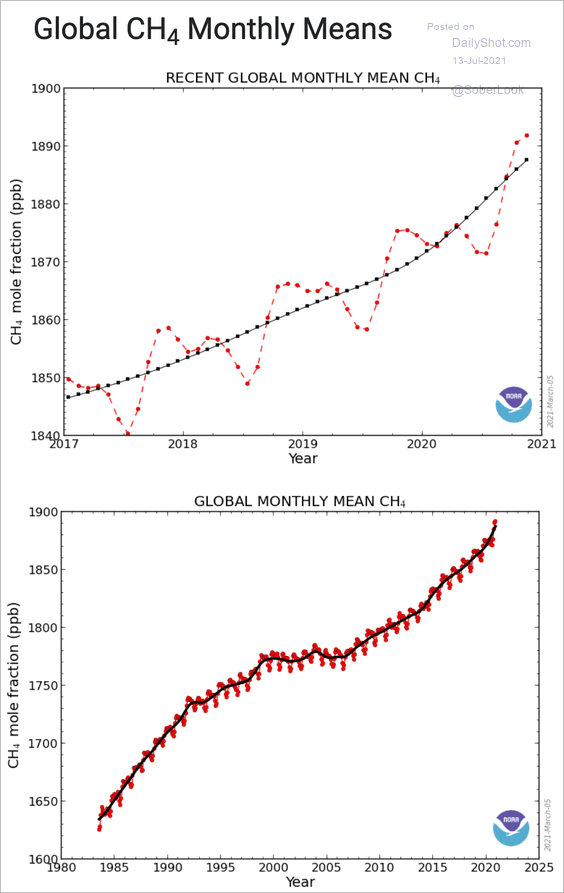 Source: NOAA Read full article
• CO2 emissions (2 charts):
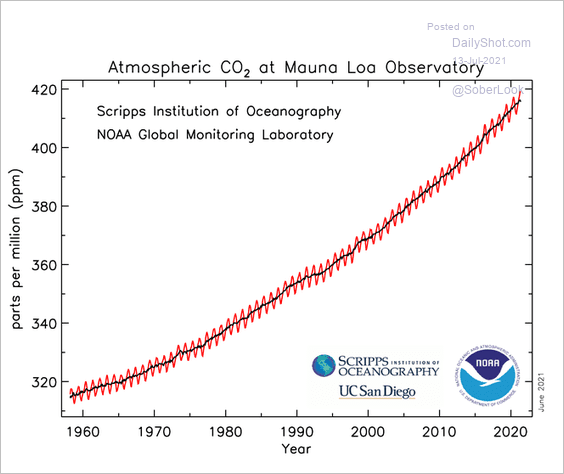 Source: NOAA, Scripps Institution of Oceanography at UC San Diego
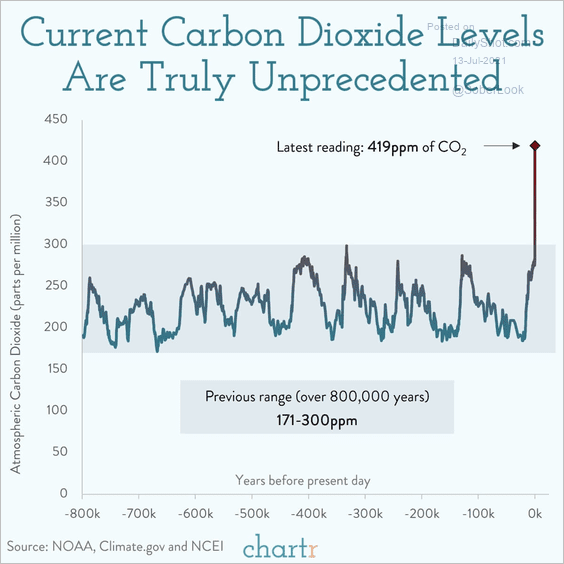 Source: @chartrdaily
——————–
3. US H-1B visas by occupation:
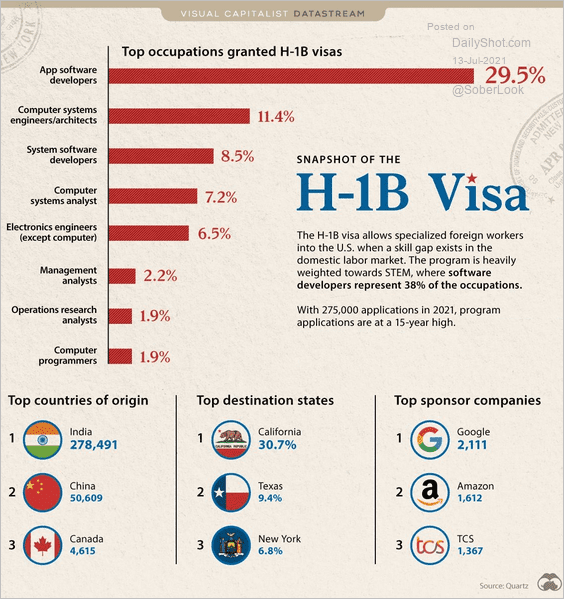 Source: Visual Capitalist Read full article
4. Support for ACA:
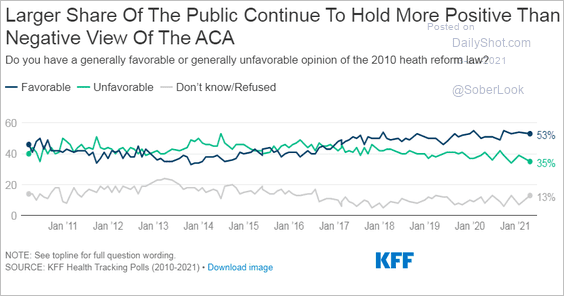 Source: KFF Read full article
5. The Delta variant prevalence:
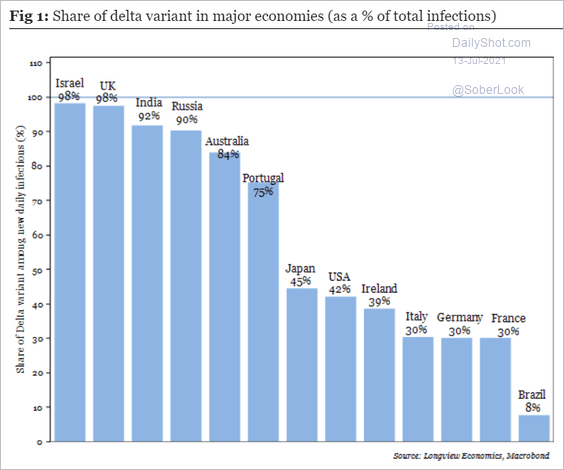 Source: Longview Economics
6. Regretting wars:
 Source: Statista
7. Bike-sharing vs. other modes of transportation:
![]() Source: Statista
Source: Statista
8. US car rentals and car rental prices:
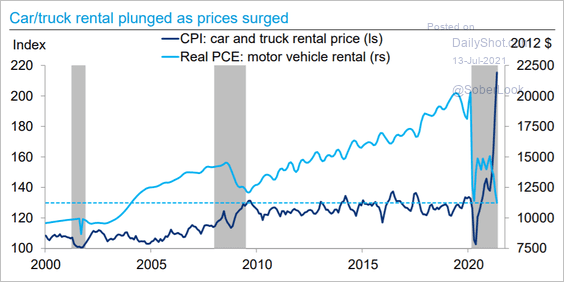 Source: Deutsche Bank Research
9. Most popular shows and movies on Netflix in June:
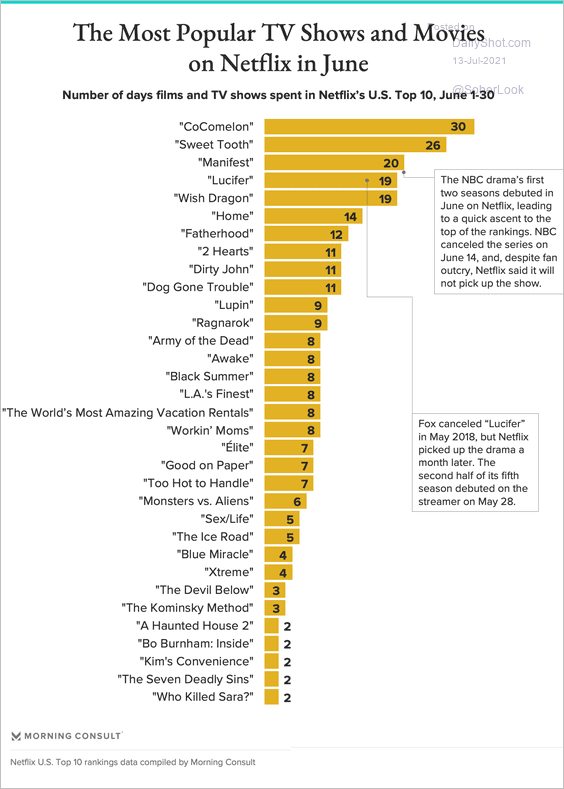 Source: Morning Consult Read full article
——————–
Back to Index