
The Daily Shot: 20-Jul-21
• The United States
• The United Kingdom
• Europe
• Asia – Pacific
• China
• Emerging Markets
• Cryptocurrency
• Energy
• Equities
• Alternatives
• Credit
• Rates
• Global Developments
• Food for Thought
The United States
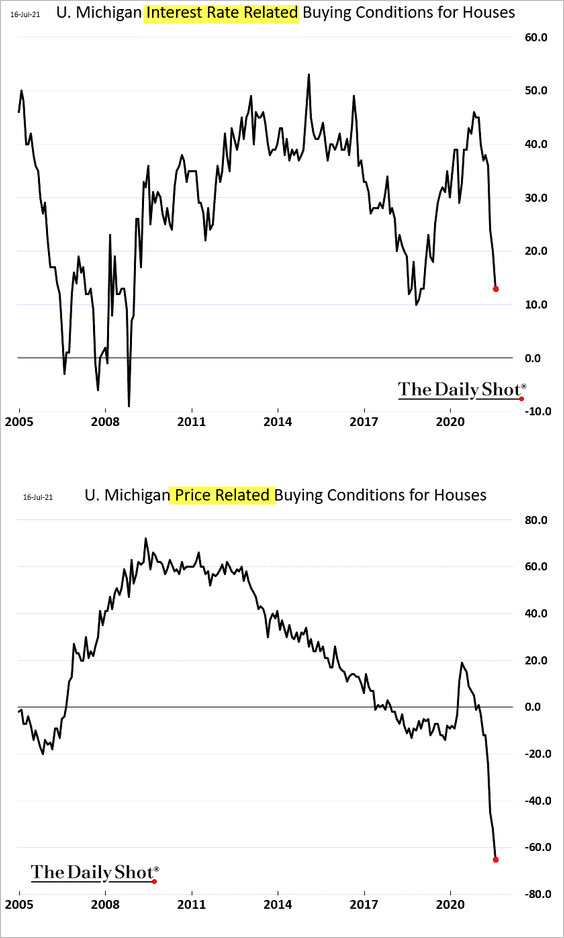
1. Let’s begin with the housing market.
• Consumers increasingly see housing as too expensive, and fewer households are comfortable with the current mortgage rates.
• Nonetheless, demand remains robust.
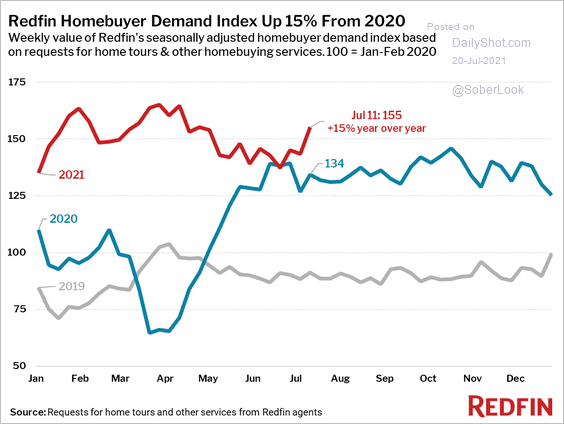 Source: Redfin
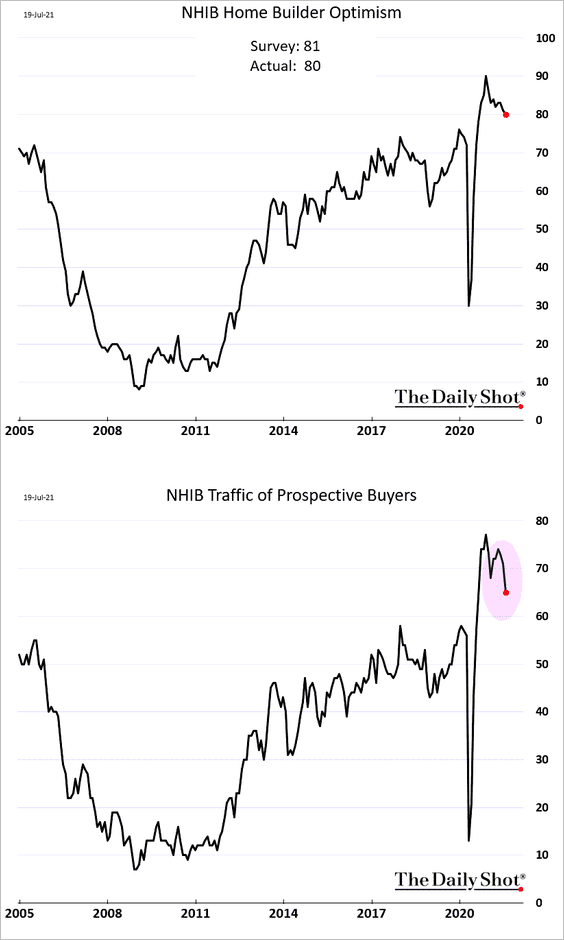
• Homebuilders have been somewhat less upbeat as traffic of prospective buyers pulls back from the highs.
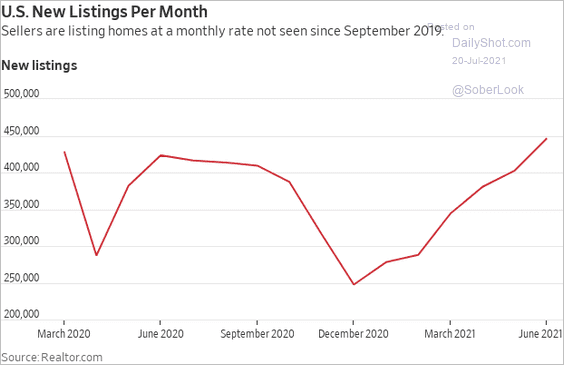
• New listings are up as sellers take advantage of the price surge.
 Source: @WSJ Read full article
• Some sellers have been dropping prices.
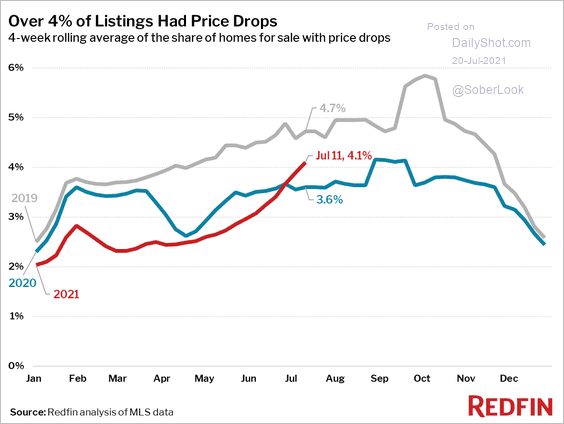 Source: Redfin
• Pending home sales are still elevated for this time of the year.
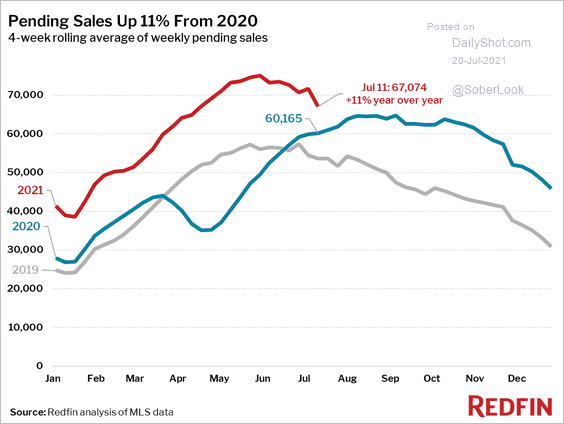 Source: Redfin
• Single-family housing rents are surging, especially for high-end properties.
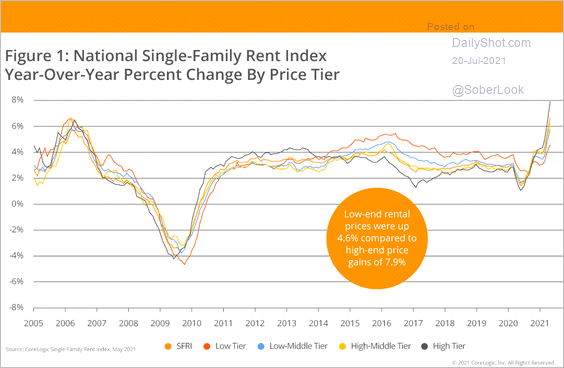 Source: CoreLogic
——————–
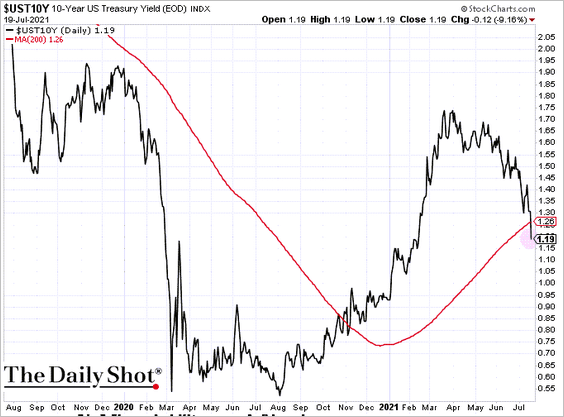
2. The 10yr Treasury yield dipped below 1.2%, crossing the 200-day moving average. We should see lower mortgage rates in the days ahead.
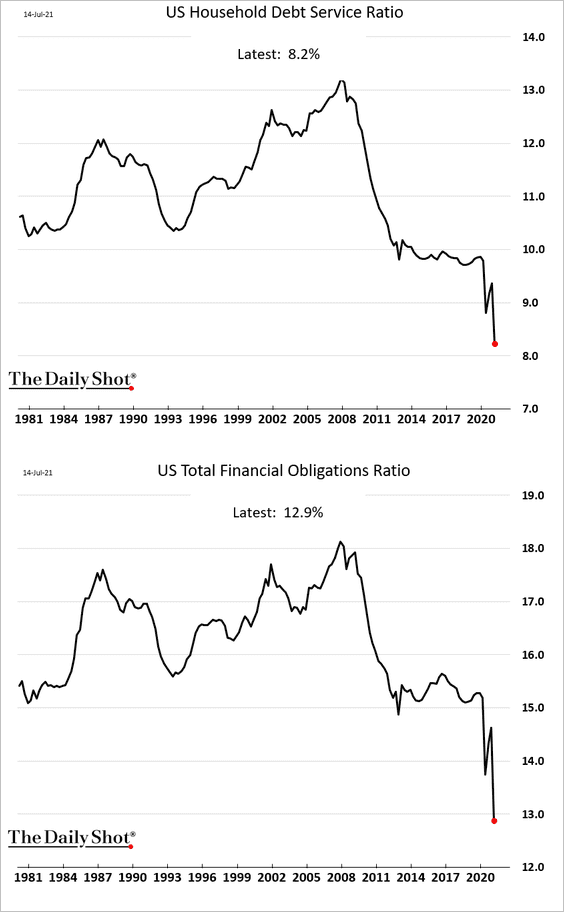
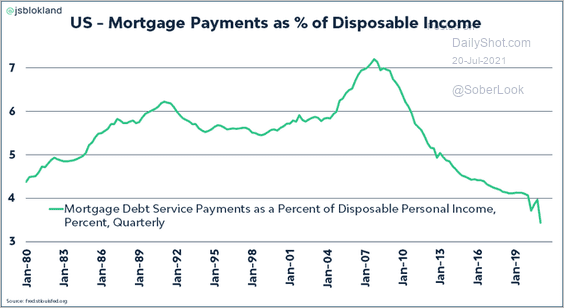
3. Next, let’s take a look at household credit trends.
• US household debt service ratio and the overall financial obligations ratio hit a multi-decade low.
 Source: @jsblokland
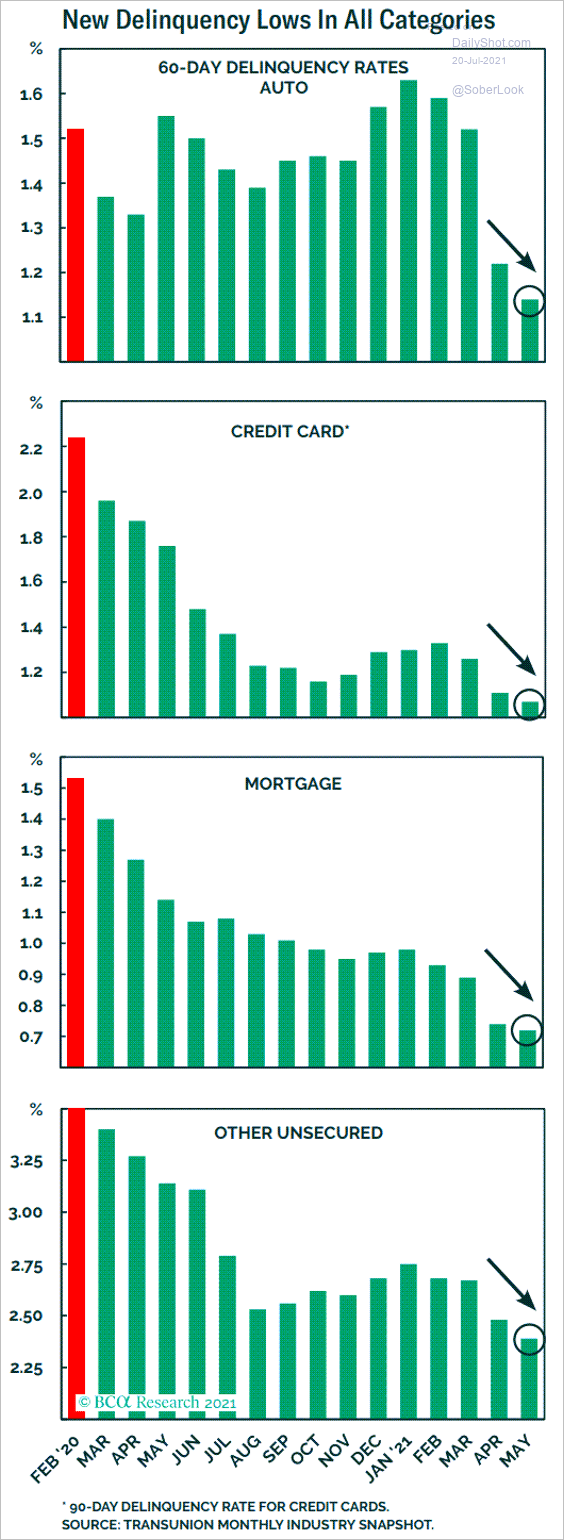
• Delinquiencies have declined across all debt categories.
 Source: BCA Research
——————–
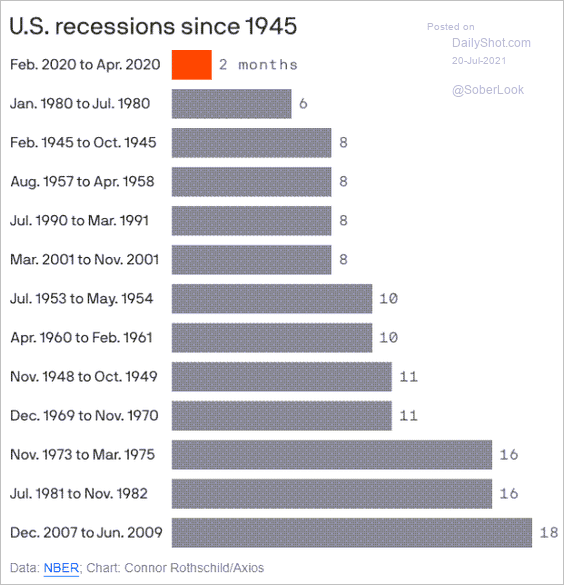
4. The NBER decision to set the COVID recession at just two months was a bit surprising.
 Source: CNBC Read full article
 Source: @axios Read full article
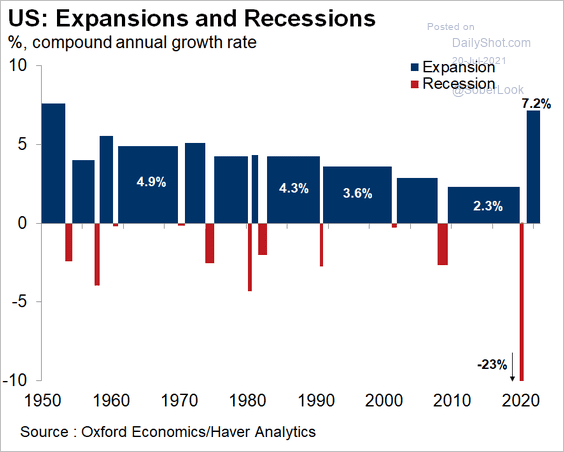 Source: @GregDaco, @nber
——————–
4. Businesses continue to report unusually low inventories.
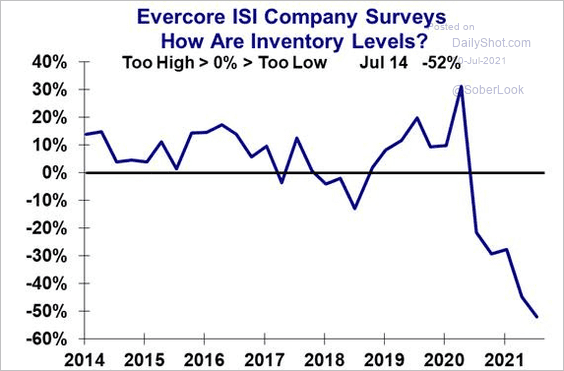 Source: Evercore ISI
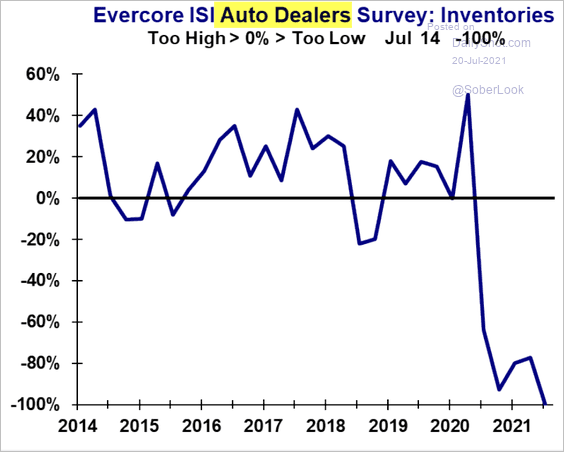 Source: Evercore ISI
Search activity related to supply chain bottlenecks has been moderating.
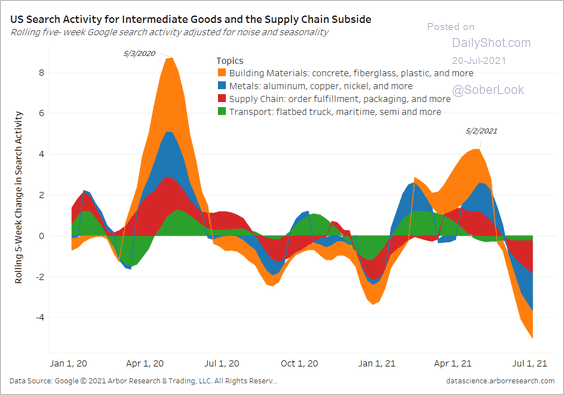 Source: Arbor Research & Trading
——————–
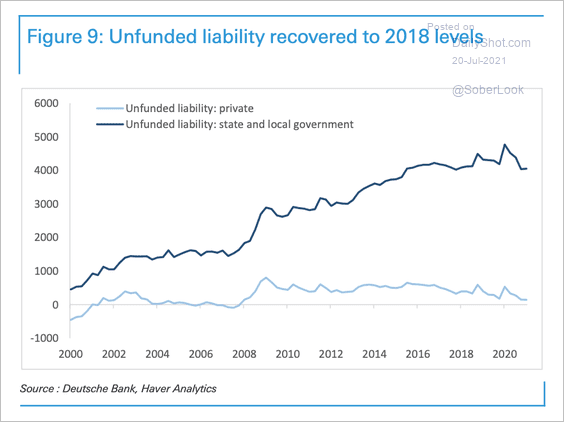
5. Pension data from Q1 revealed funds emerging from last year in a much better shape (2 charts).
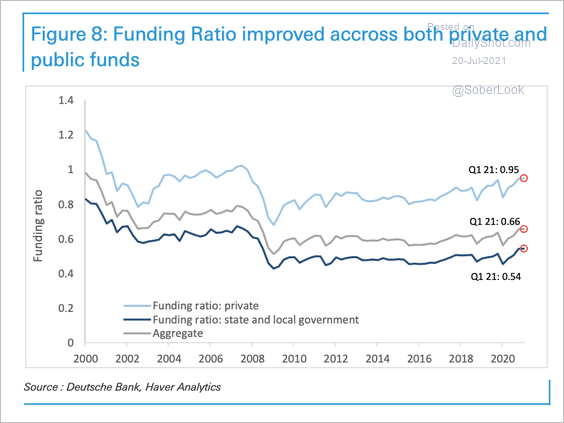 Source: Deutsche Bank Research
 Source: Deutsche Bank Research
——————–
6. The decline in fiscal policy impulse could detract from GDP growth into 2023.
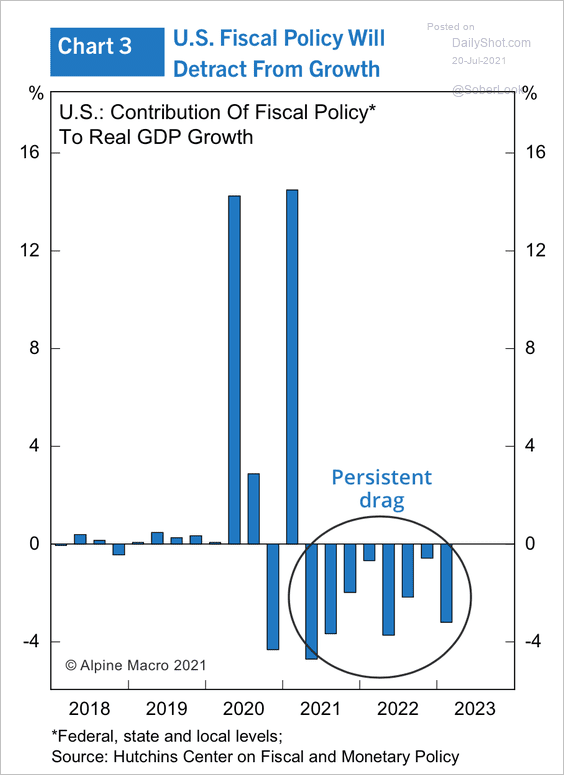 Source: Alpine Macro
The recent drop in the stock/bond ratio suggests peak US GDP growth.
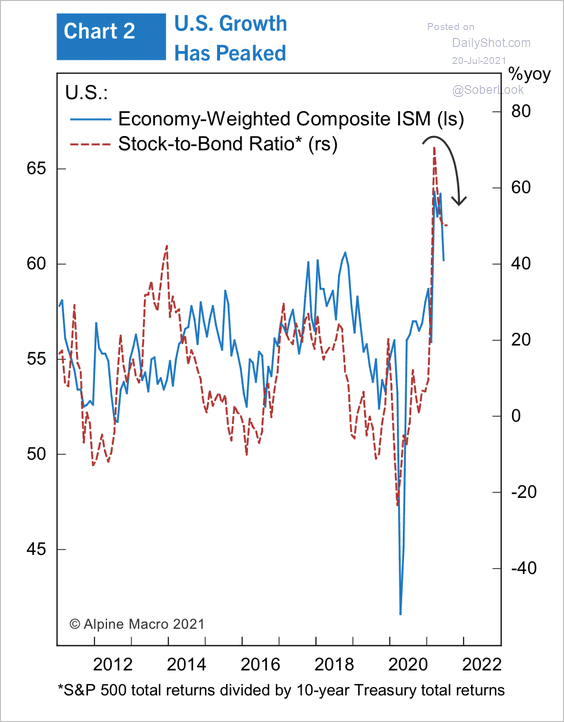 Source: Alpine Macro
——————–
7. US-China trade has been reduced by tariff increases, causing import substitution (2 charts).
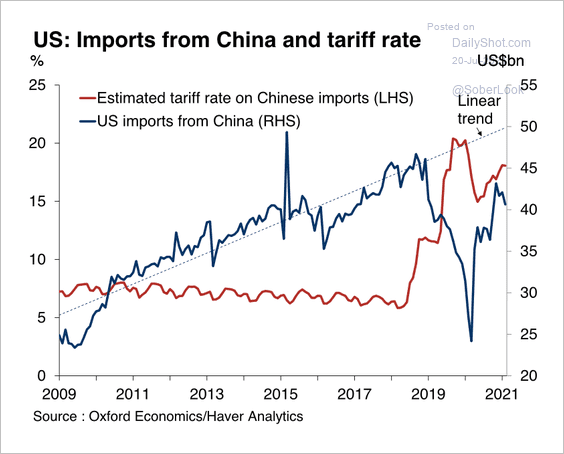 Source: Oxford Economics
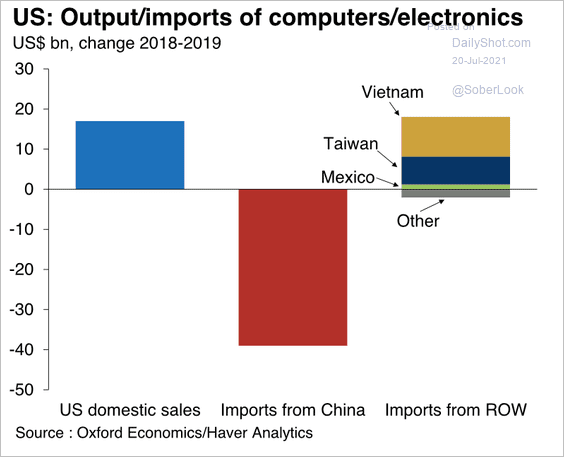 Source: Oxford Economics
Back to Index
The United Kingdom
1. Let’s begin with household credit.
• Debt service ratio:
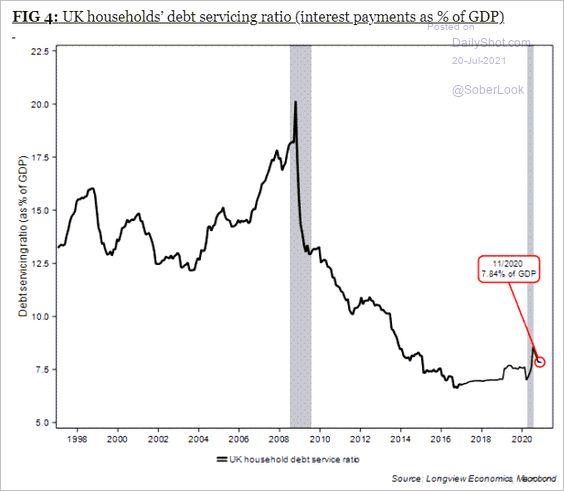 Source: Longview Economics
• Consumer credit growth:
 Source: @BBGVisualData, @bopinion, @ScouseView Read full article
• Consumer credit as a share of GDP:
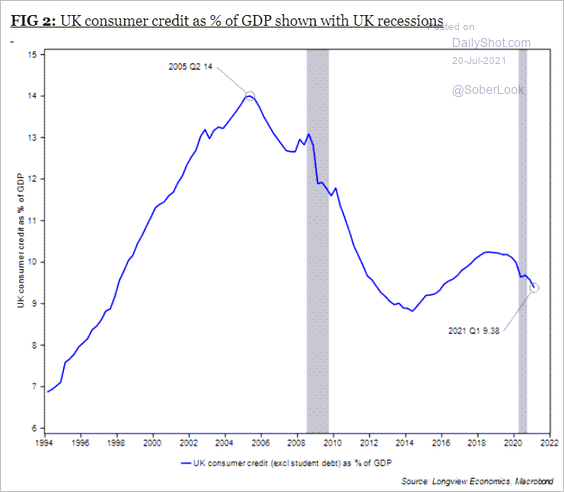 Source: Longview Economics
• Home equity net withdrawals:
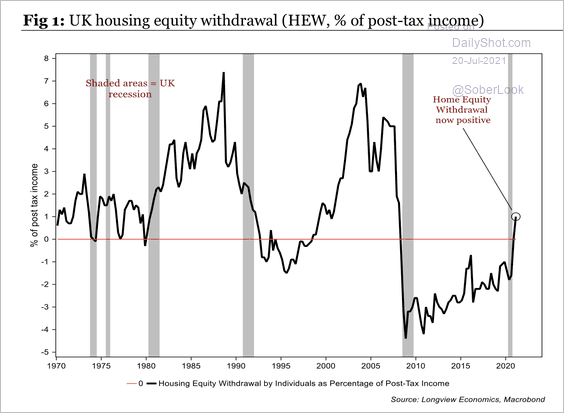 Source: Longview Economics
——————–
2. The third COVID wave is putting pressure on mobility.
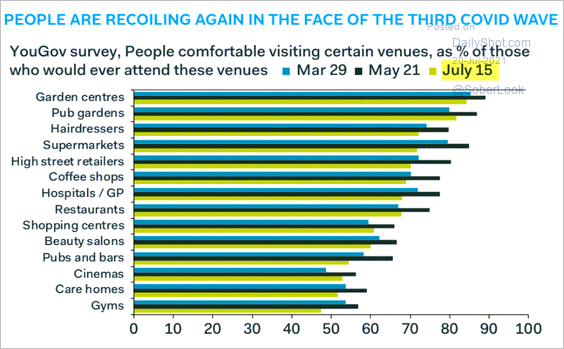 Source: Pantheon Macroeconomics
3. This chart shows the UK’s most valuable unicorns.
 Source: Statista
Back to Index
Europe
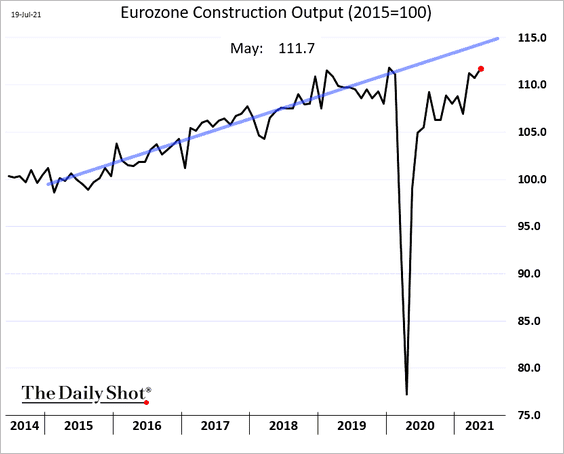
1. Euro-area construction output continues to climb but remains below the pre-COVID trend.
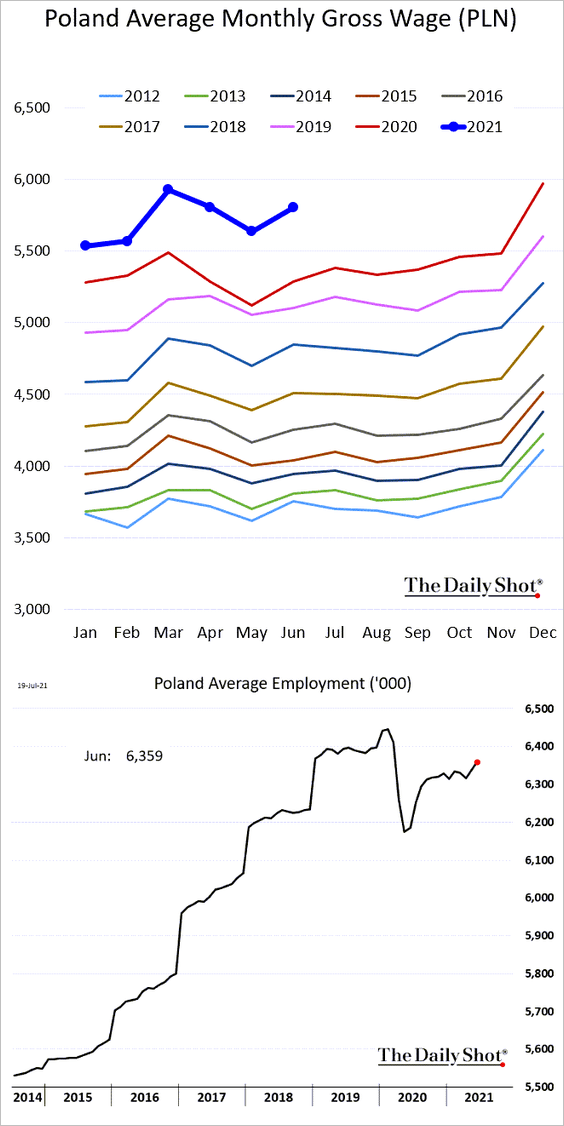
2. Poland’s wage growth topped expectations. Employment will take time to return to pre-COVID levels.
Back to Index
Asia – Pacific
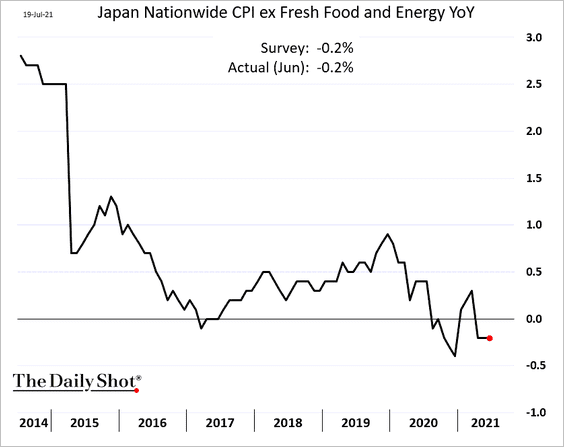
1. Japan’s core inflation remains negative.
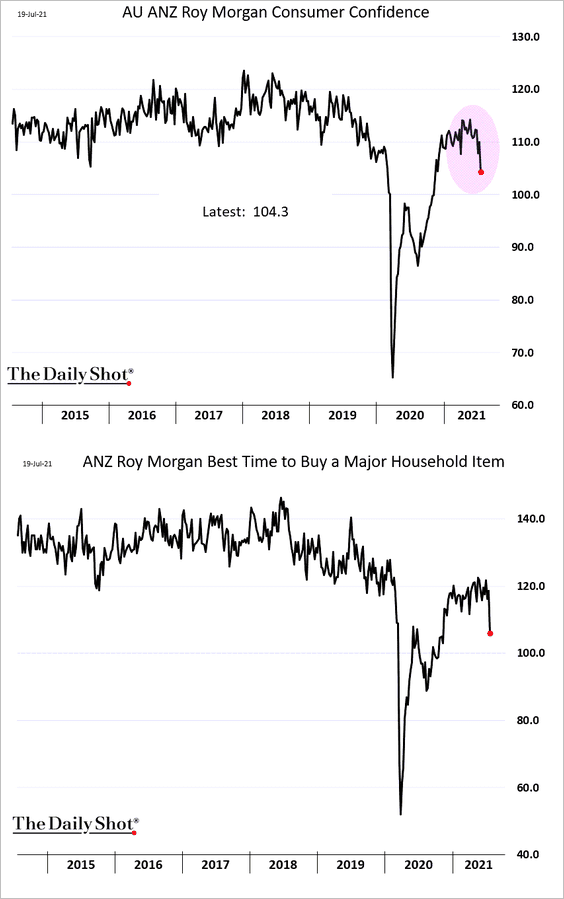
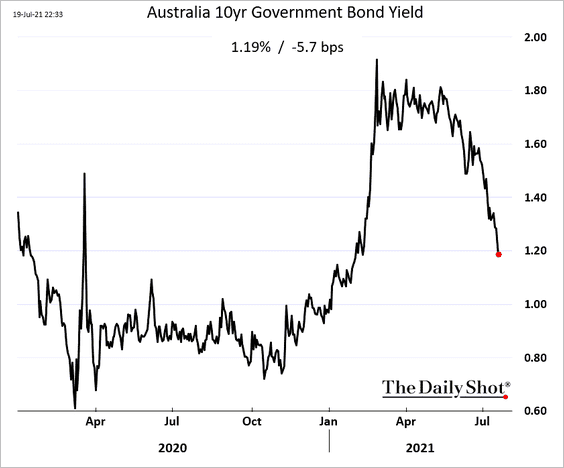
2. Australia’s consumer confidence deteriorated amid lockdowns.
 Source: Reuters Read full article
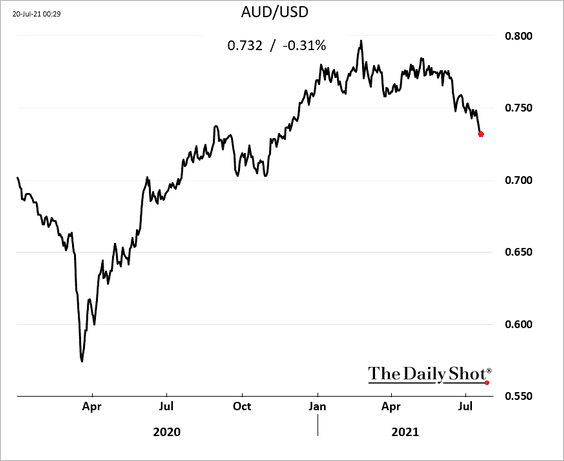
The Aussie dollar and bond yields continue to sink, with the 10yr dipping below 1.2%.
Back to Index
China
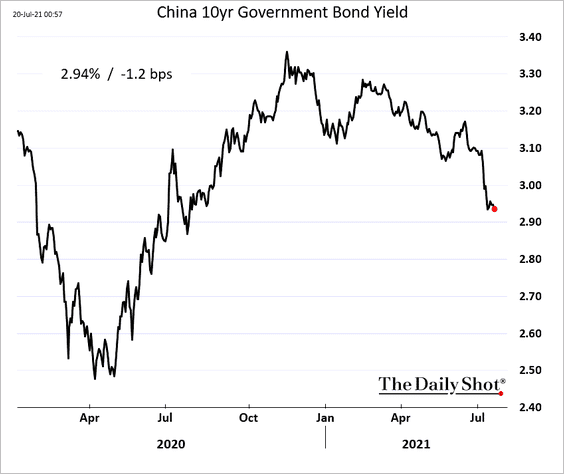
1. Bond yields have been moving lower.
2. Shares of property developers have been tumbling, with valuations hitting multi-year lows.
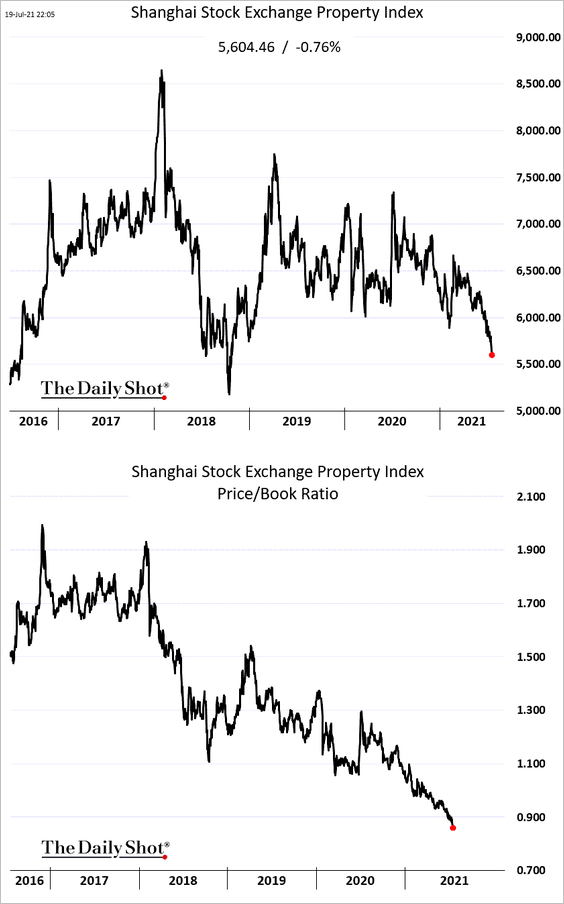 h/t April Ma
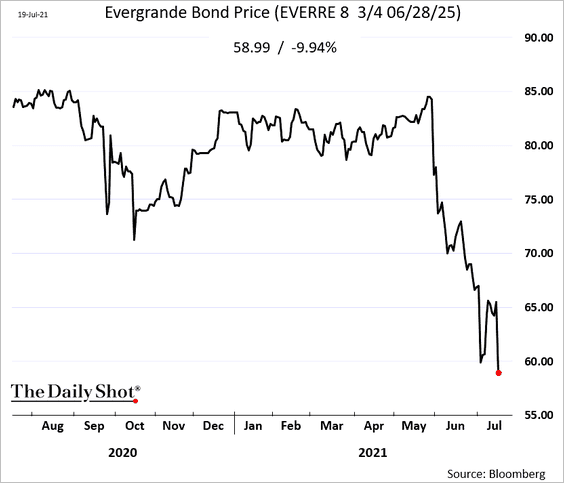
Investors are particularly nervous about leveraged names.
 Source: CNBC Read full article
• Evergrande stock price:
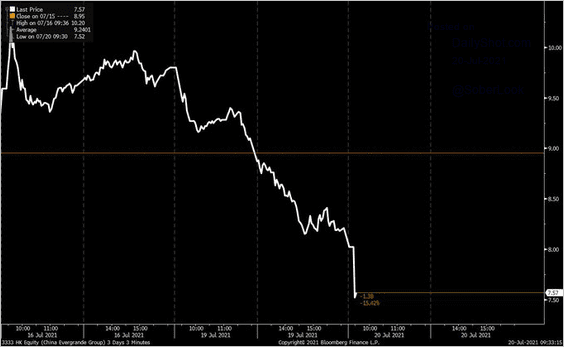 Source: @tracyalloway
• Evergrande bond price:
——————–
3. Non-performing loans as a percentage of total loans have stabilized over the past few years.
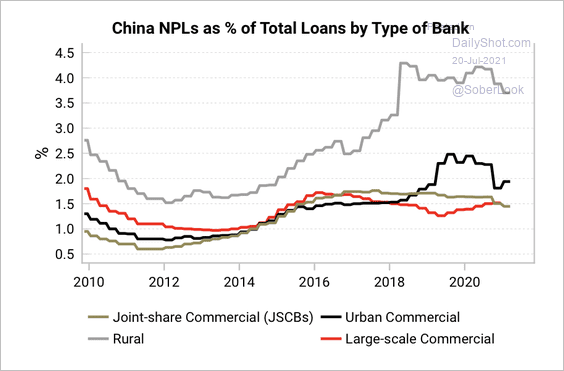 Source: Variant Perception
Shadow financing has fallen since the 2017 peak as a result of Beijing’s crackdown on leverage.
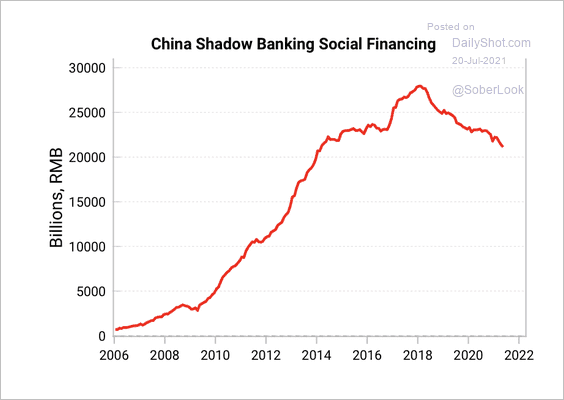 Source: Variant Perception
——————–
4. Historically, cuts in the reserve requirement ratio (RRR) have coincided with a bottom in the credit cycle.
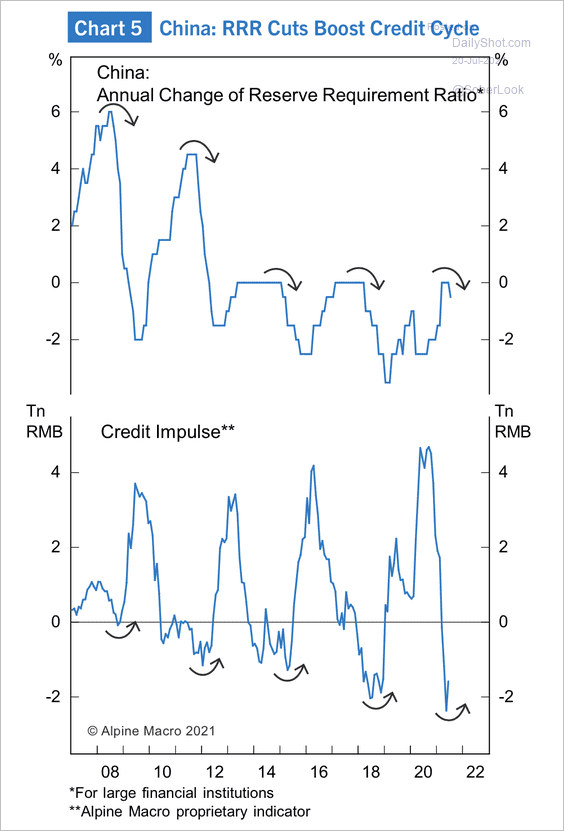 Source: Alpine Macro
And the credit cycle typically leads the broader business cycle.
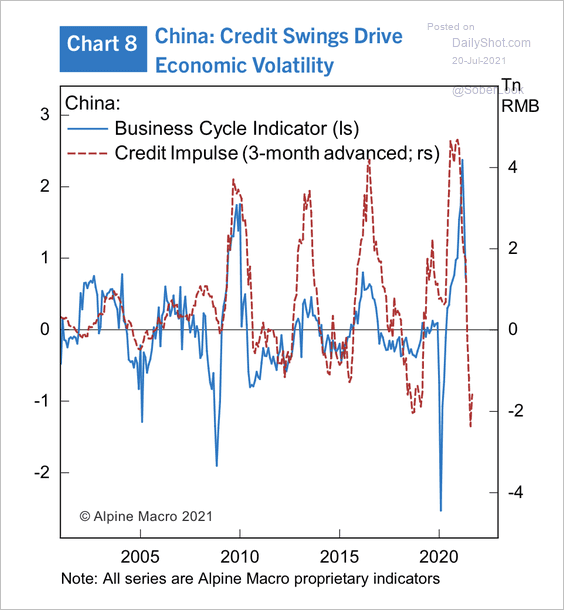 Source: Alpine Macro
Back to Index
Emerging Markets
1. Investors have been buying up Colombia’s local currency debt.
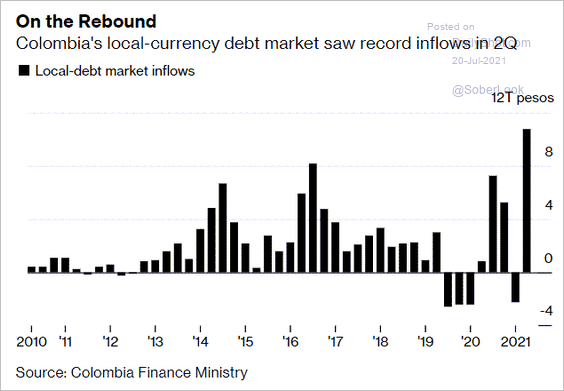 Source: @markets Read full article
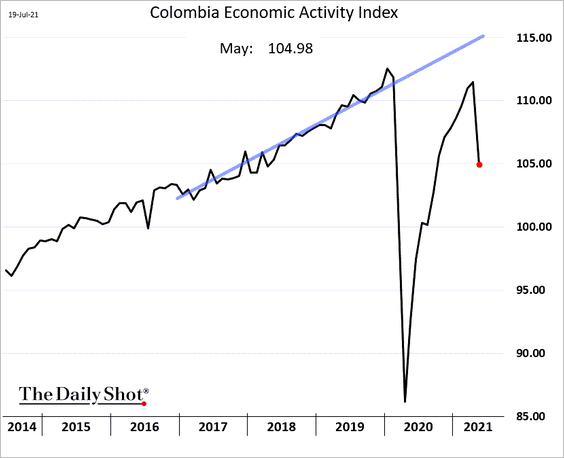
The nation’s economic activity deteriorated in May.
——————–
2. LatAm GDP growth has been recovering, with Peru leading the way.
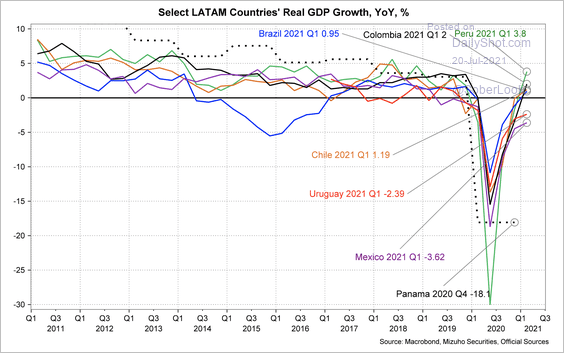 Source: Mizuho Securities USA
• The region’s current account deficit narrowed sharply over the past year.
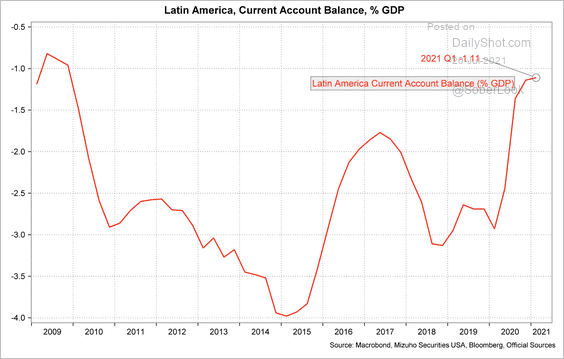 Source: Mizuho Securities USA
• This chart shows the rate hikes currently priced into the market.
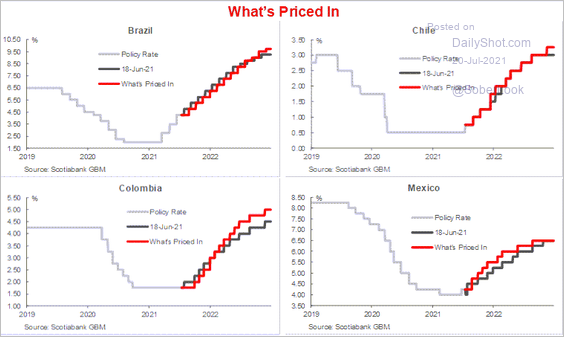 Source: Scotiabank Economics
——————–
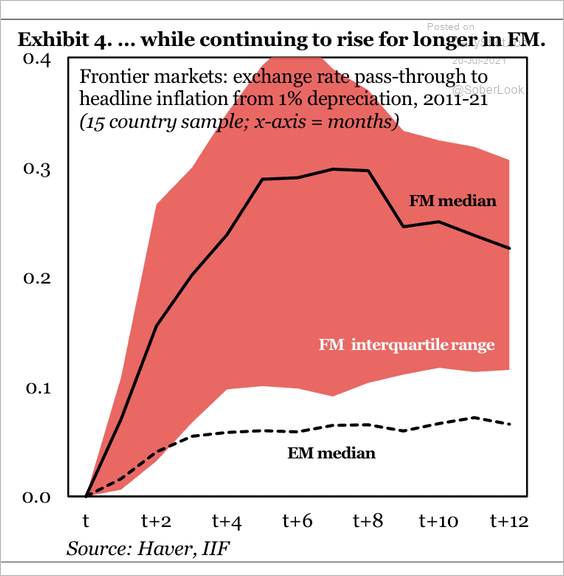
3. The pass-through of a 1% currency depreciation to inflation over a 6-month period has marginally declined in EM but increased substantially in frontier markets.
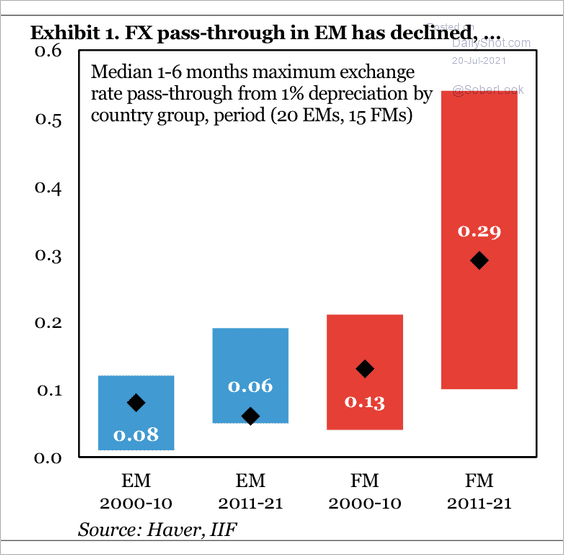 Source: IIF
The exchange rate pass-through to inflation stabilizes quickly for EM countries but rises in frontier markets for a longer period (2 charts).
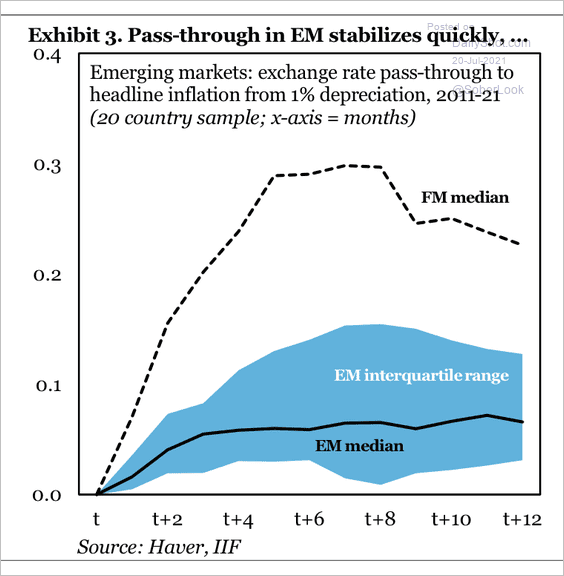 Source: IIF
 Source: IIF
Back to Index
Cryptocurrency
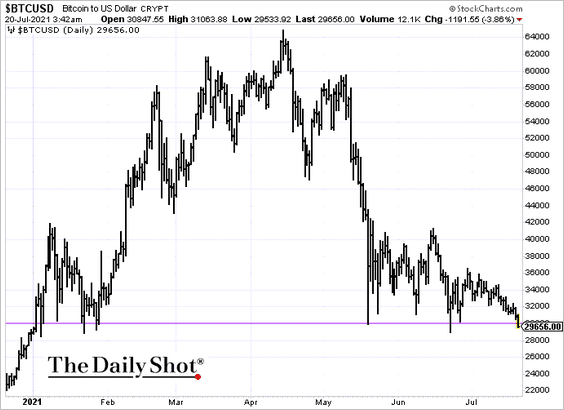
1. Bitcoin dipped below $30k.
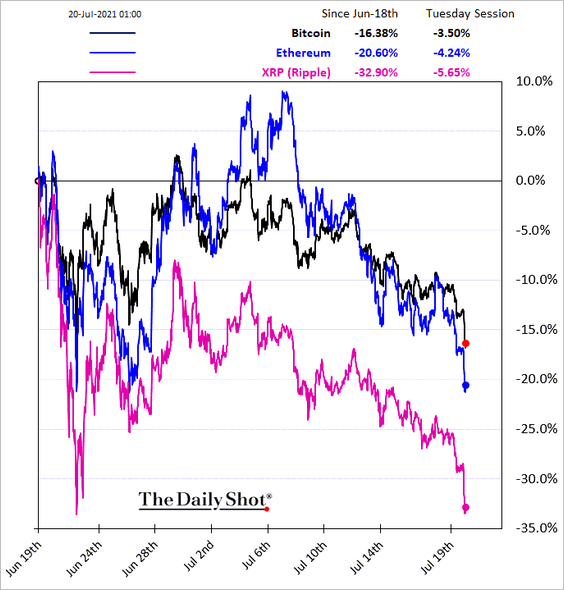
Here is the relative performance over the past month, …
… and past week.
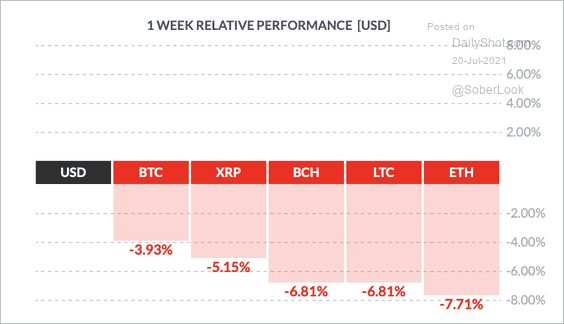 Source: FinViz
——————–
2. Bitcoin options term structure is normalizing as volatility remains subdued.
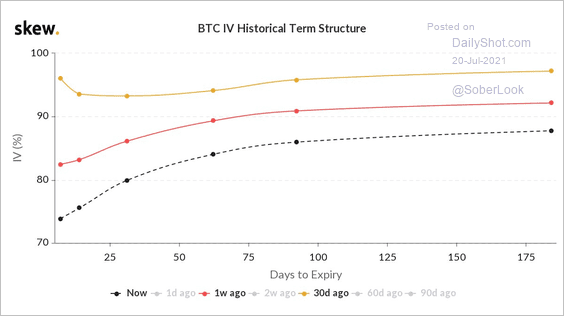 Source: @skewdotcom
However, Bitcoin’s short-term volatility is starting to rise.
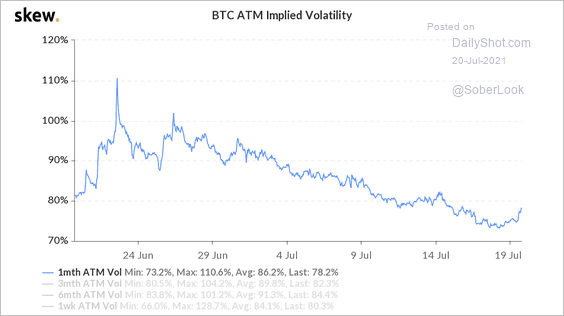 Source: Skew Read full article
——————–
3. Stablecoin DeFi borrowing rates found support at 3%.
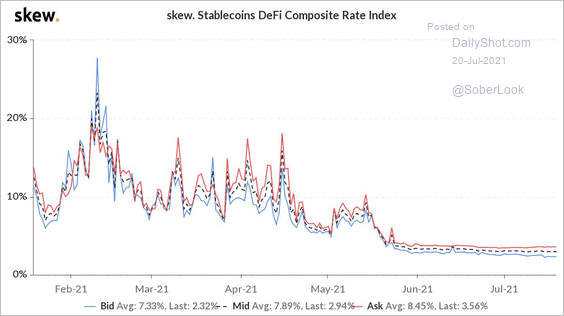 Source: @skewdotcom
4. DeFi tokens remain under pressure.
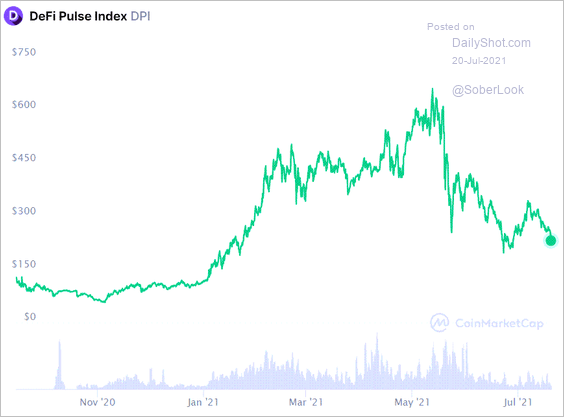 Source: CoinMarketCap
Back to Index
Energy
1. Brent crude breached support at the 50-day moving average and just kept going. By the way, despite the anticipated OPEC production increase, global crude oil markets are expected to remain in deficit.
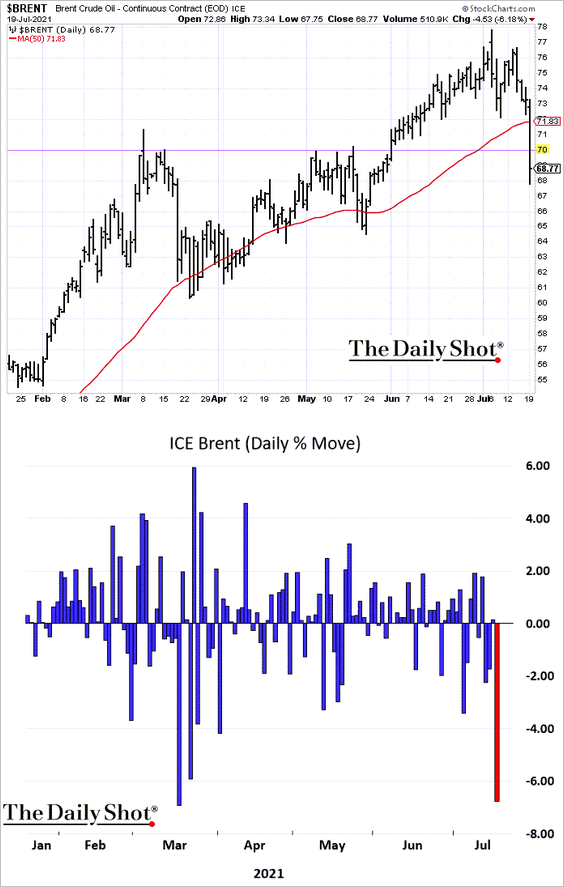
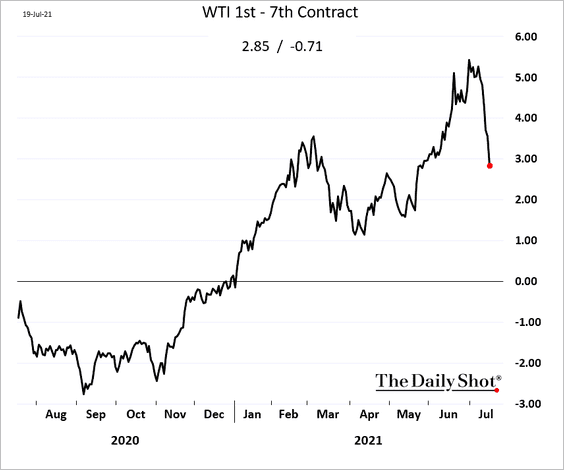
2. Crude oil backwardation has declined sharply.
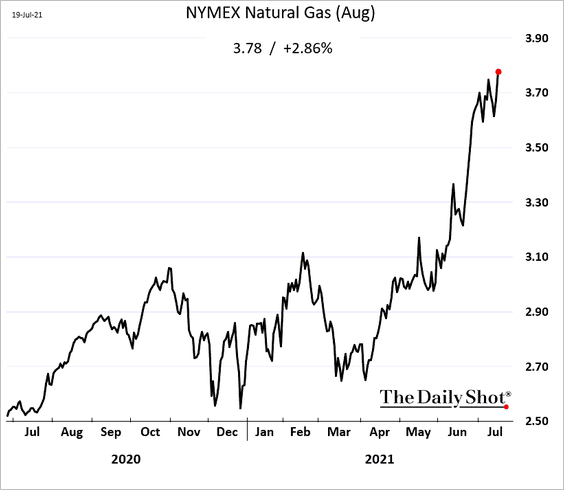
3. US natural gas futures remain well bid.
Back to Index
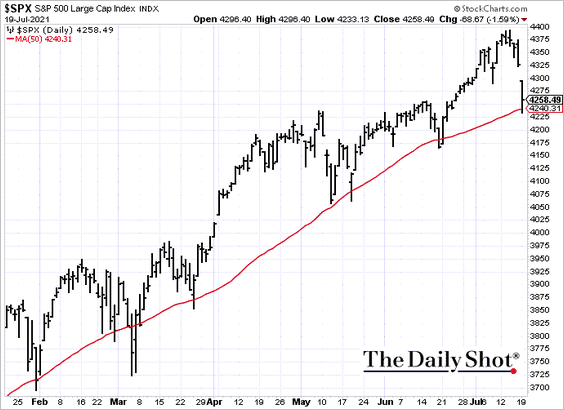
Equities
1. The stock market saw a healthy pullback from the highs. The S&P 500 held support at the 50-day moving average. Dip buyers are circling, with futures higher this morning.
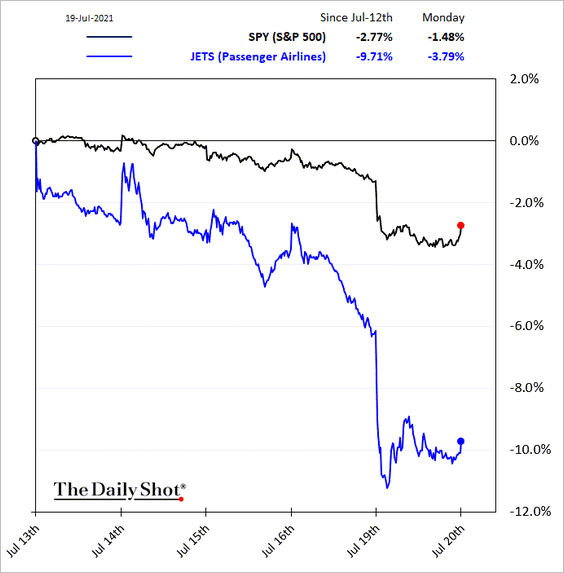
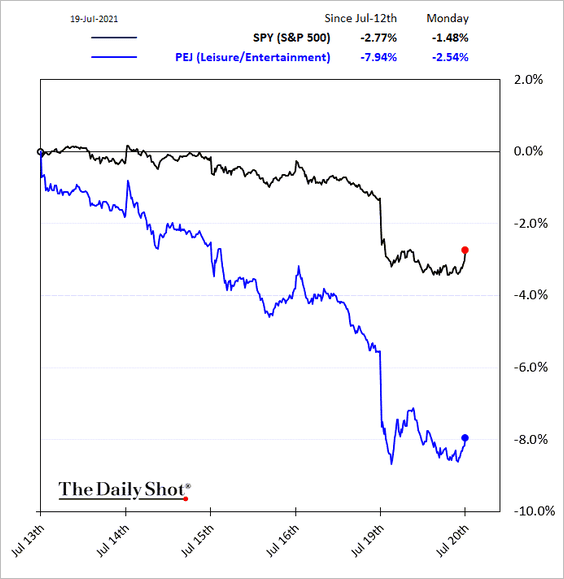
2. The reopening trade took a hit.
• Airlines:
• Leisure and entertainment:
——————–
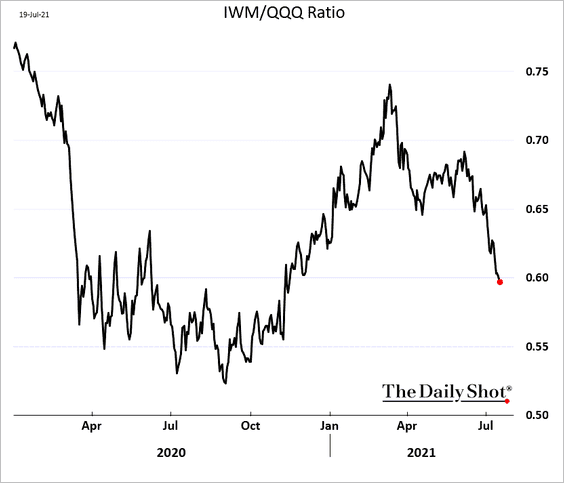
3. Small caps continue to struggle (chart shows the Russell 2000 ETF vs. the Nasdaq 100 ETF).
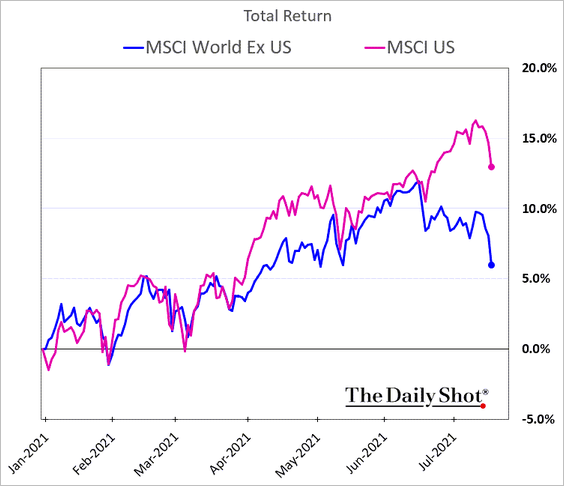
4. US stocks have sharply outperformed the rest of the world year-to-date.
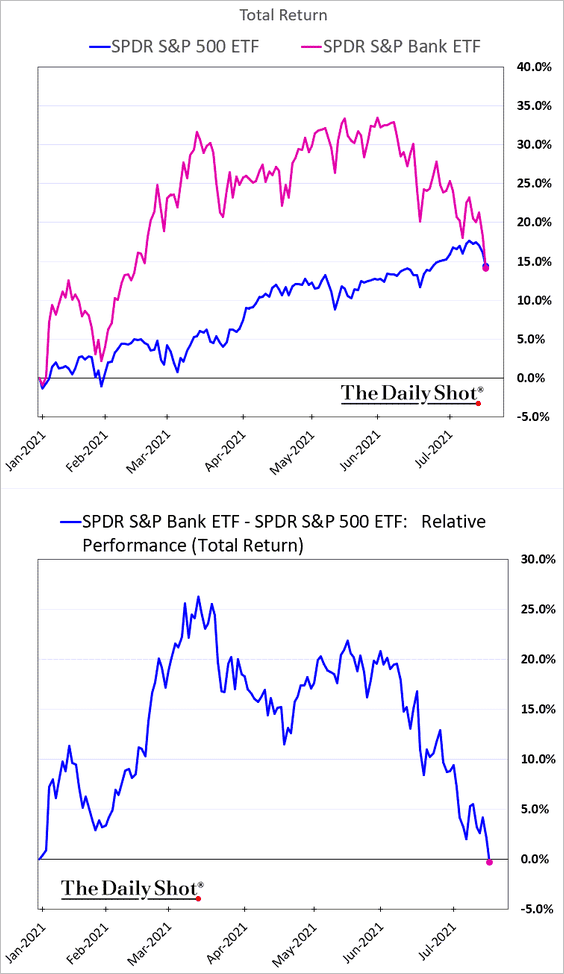
5. Banks (2 charts below) and transportation shares (next 2 charts) have given up their year-to-date outperformance.
![]()
——————–
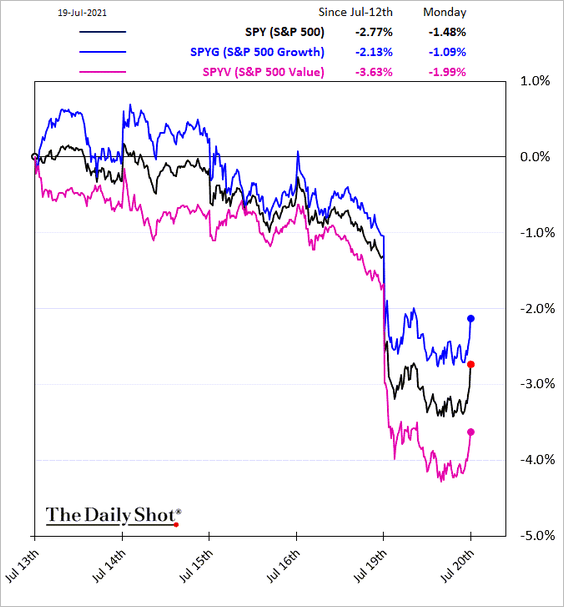
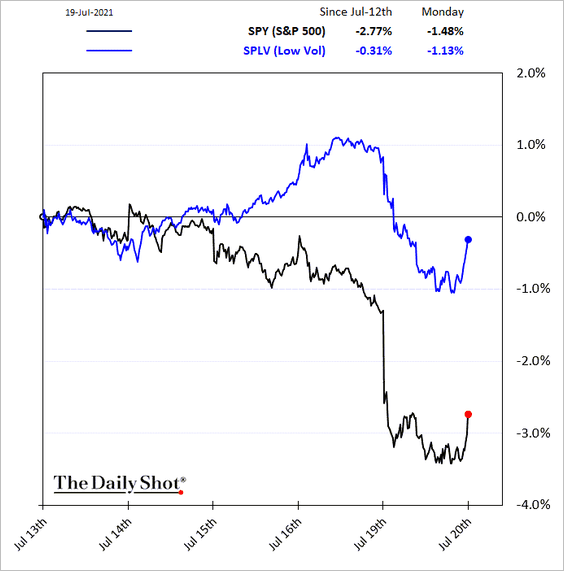
6. Next, we have some equity factor trends.
• Value vs. growth:
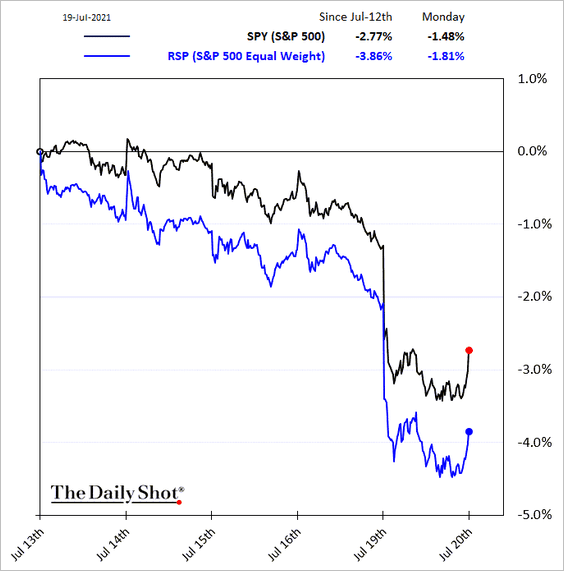
• Equal-weight S&P 500:
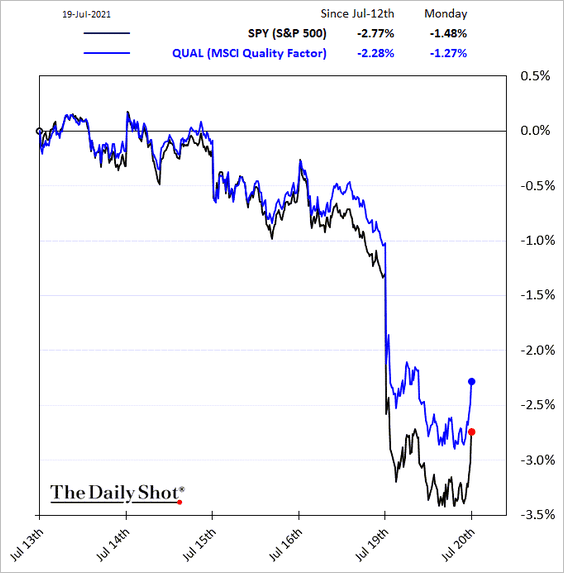
• Quality:
• Dividend Aristocrats:
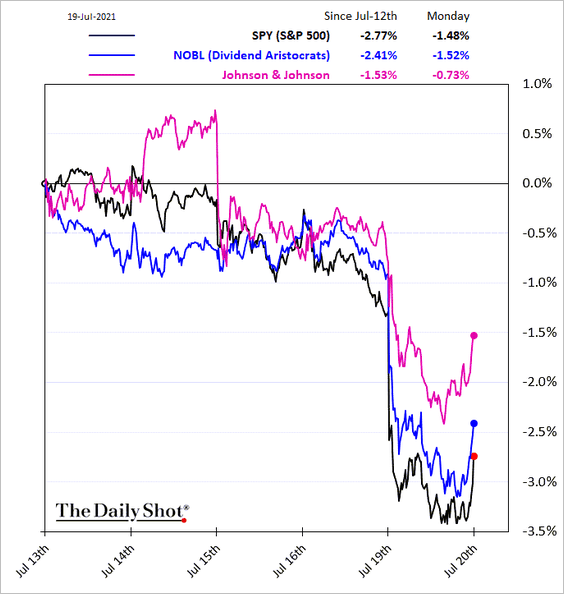
• Low vol:
——————–
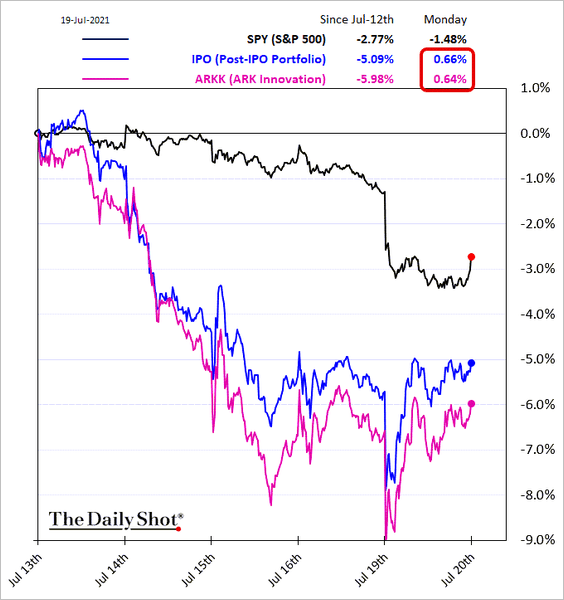
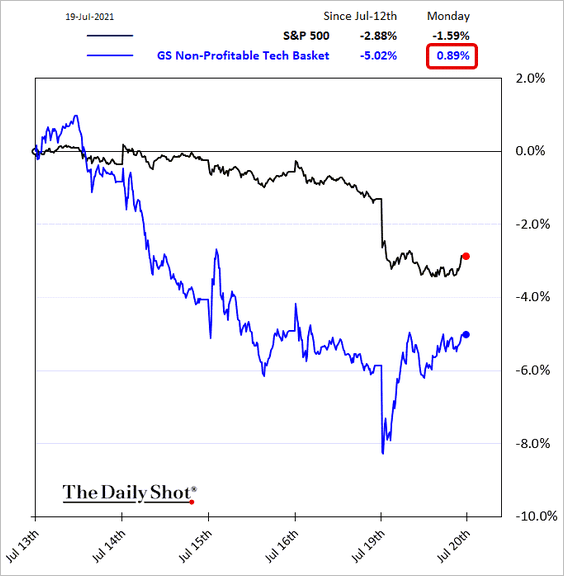
7. Speculative growth companies were up on Monday.
• Post-IPO shares and ARK Innovation:
• Non-profitable tech:
——————–
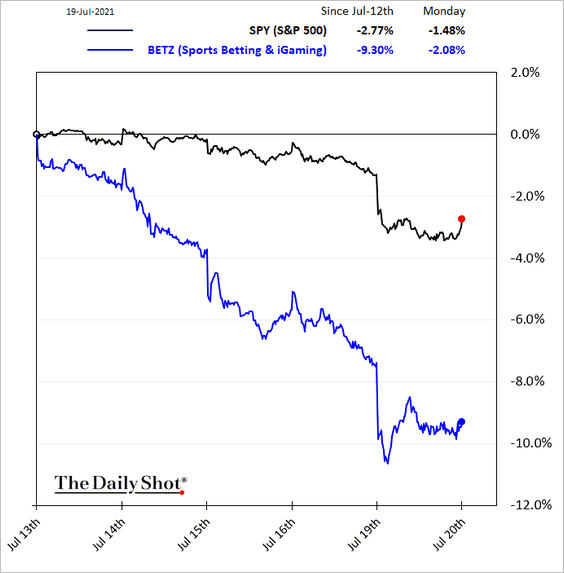
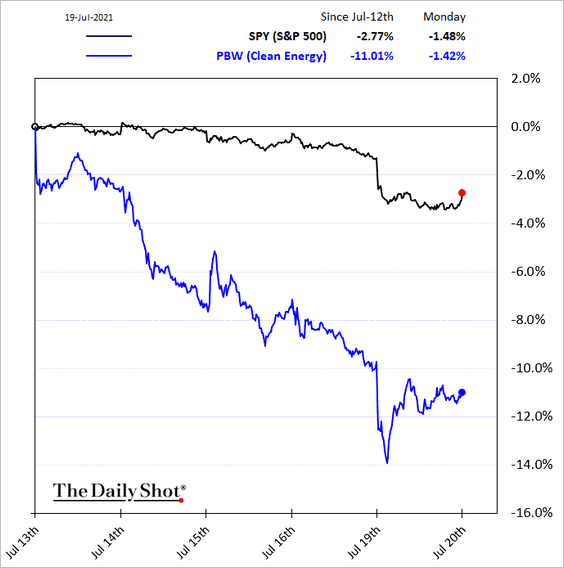
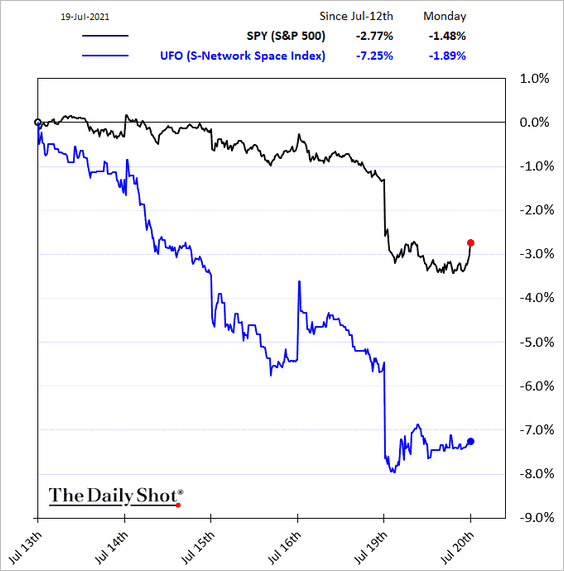
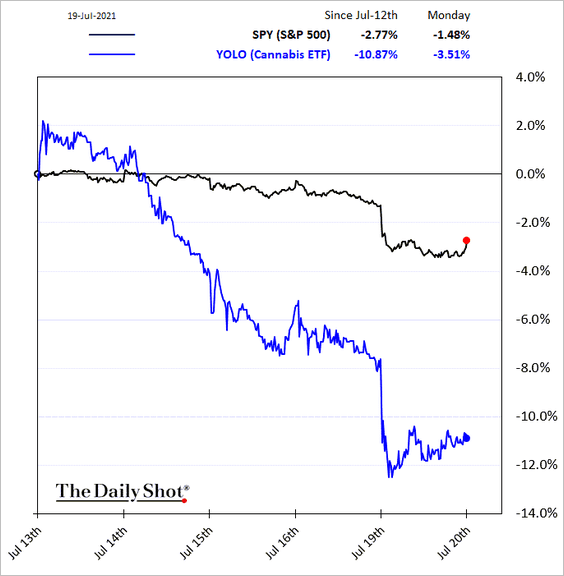
8. Below are some additional thematic portfolios popular with retail investors.
• Sports betting:
• Clean energy:
• Space:
• Cannabis:
Back to Index
Alternatives
1. Other than the distressed category, interest in credit funds increased this year.
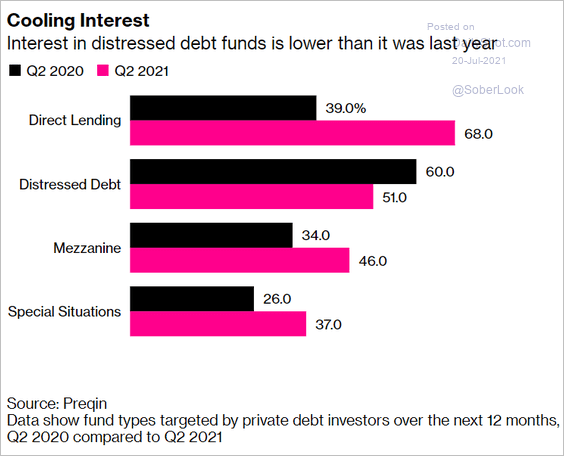 Source: @business Read full article
2. Mega-round VC deals surged globally.
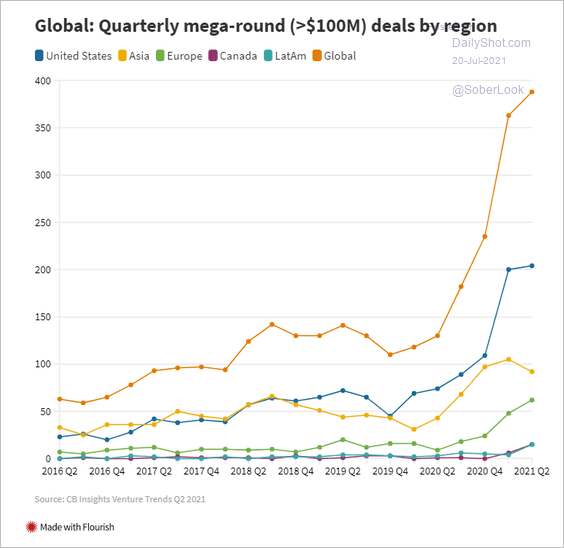 Source: CNBC Read full article
3. Climate-tech firms are attracting more VC capital.
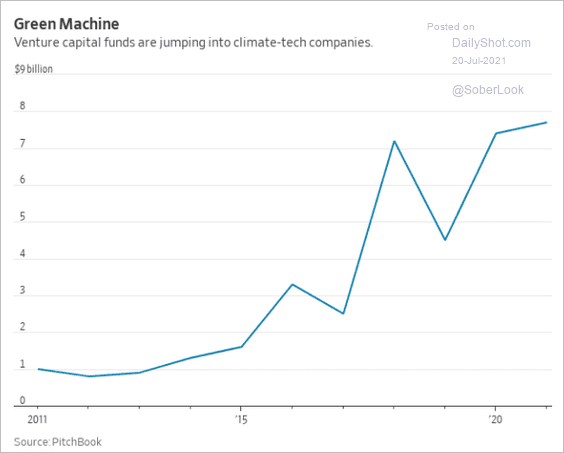 Source: @WSJ Read full article
4. Wine has outperformed stocks in recent decades.
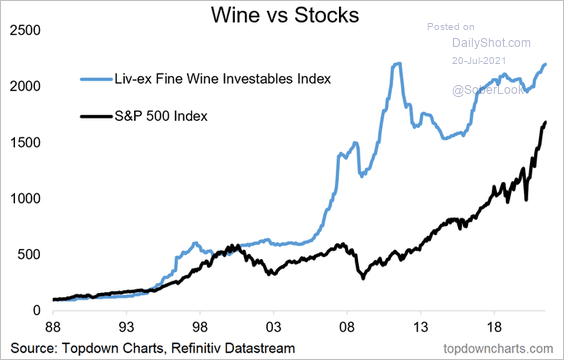 Source: @topdowncharts Read full article
5. US multi-family buyer demand has been driven by private equity, …
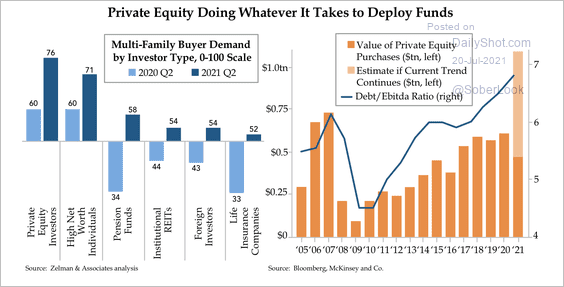 Source: Quill Intelligence
… but returns haven’t been so great.
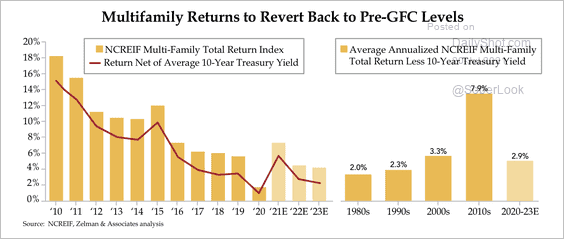 Source: Quill Intelligence
——————–
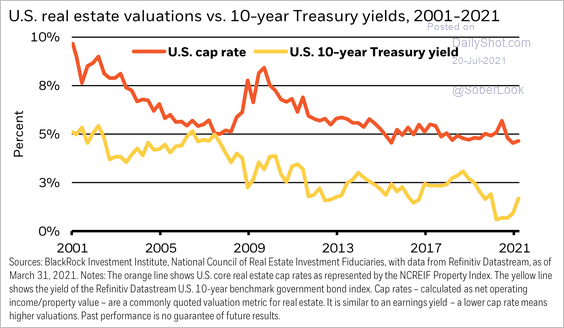
6. Commercial real estate cap rate has trended lower since the financial crisis, indicating higher valuations. The average cap rate is about three percentage points above the 10-year Treasury yield, in line with the 20-year average, according to BlackRock.
 Source: BlackRock
Back to Index
Credit
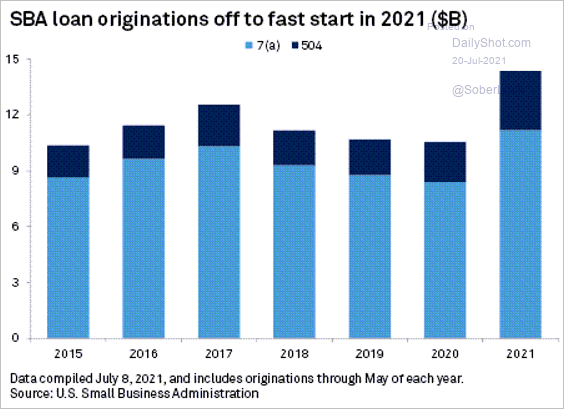
1. According to S&P Global Market Intelligence, …
U.S. banks, mired in anemic loan growth, are finding new opportunities in Small Business Administration programs as they capitalize on systems put in place to support the pandemic Paycheck Protection Program.
 Source: S&P Global Market Intelligence
2. These charts show loans and securities at US banks vs. pre-pandemic trends.
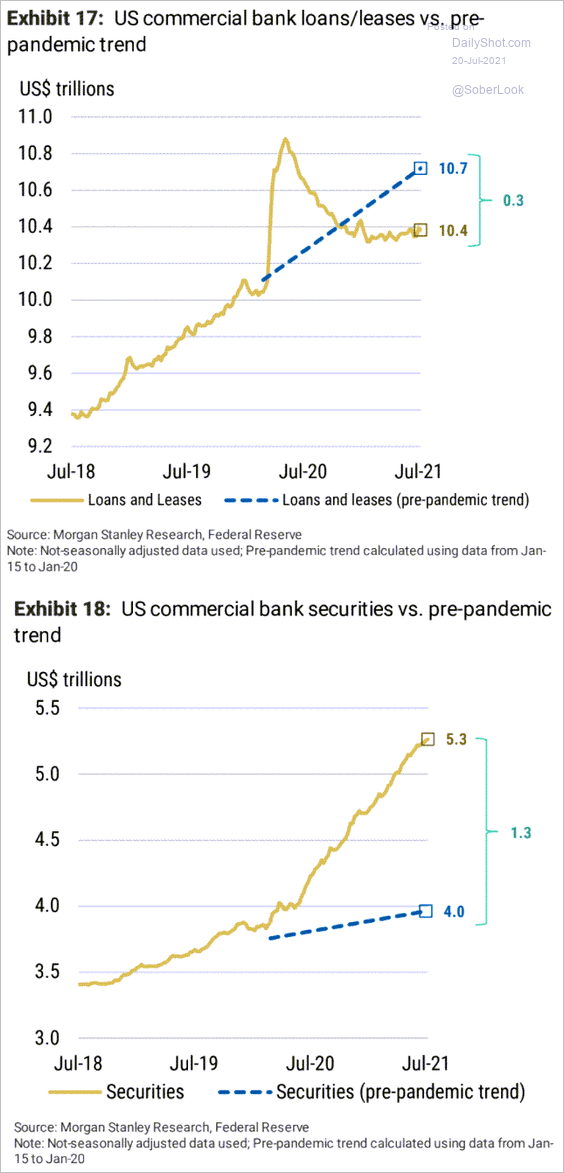 Source: Morgan Stanley Research
3. MBS spreads remain near multi-year lows.
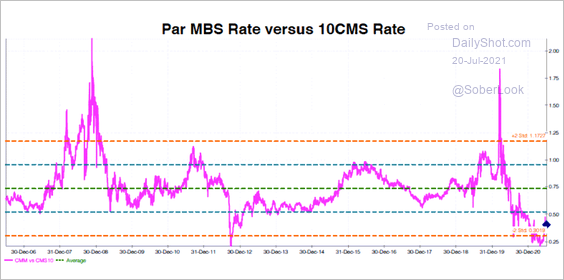 Source: Convexity Maven
4. Finally, we have a couple of charts on money markets.
• Assets under management:
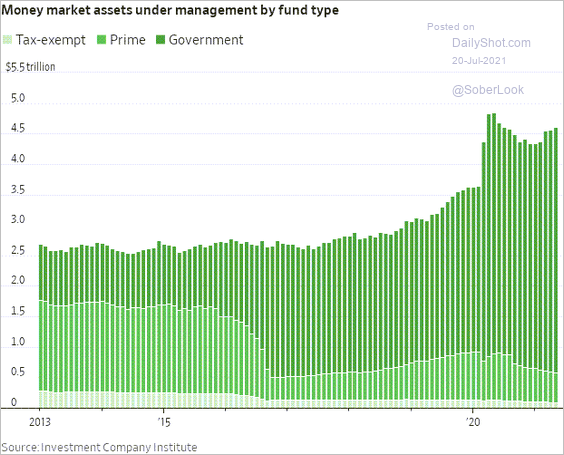 Source: @WSJ Read full article
• Prime money market funds’ holdings of commercial paper:
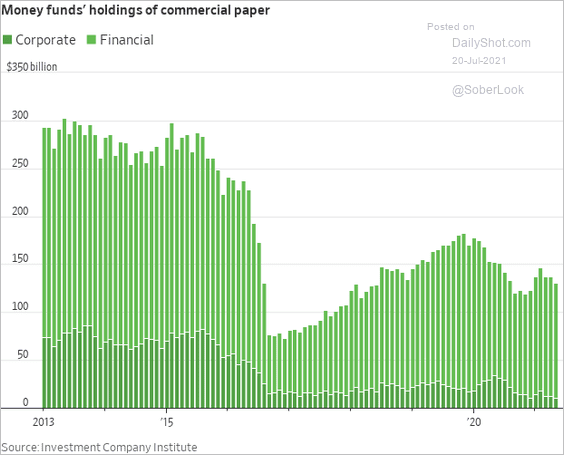 Source: @WSJ Read full article
Back to Index
Rates
1. Numerous indicators tell us that Treasury yields have been moving in the “wrong” direction.
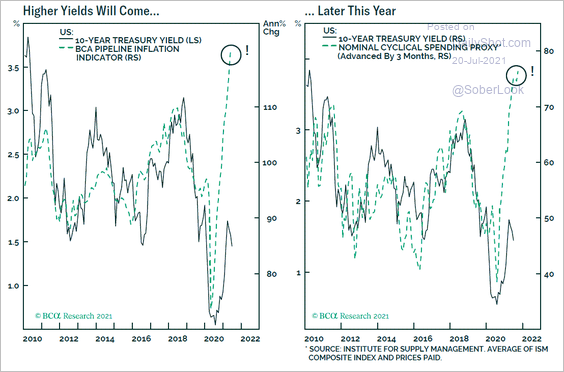 Source: BCA Research
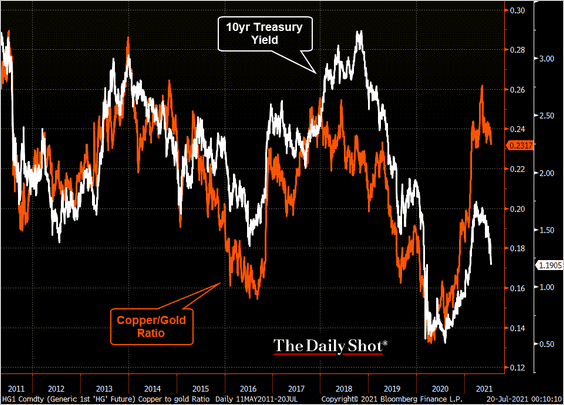 Source: @TheTerminal, Bloomberg Finance L.P.
——————–
2. Leveraged funds have been increasing bets against Treasuries but were forced to cover in recent days.
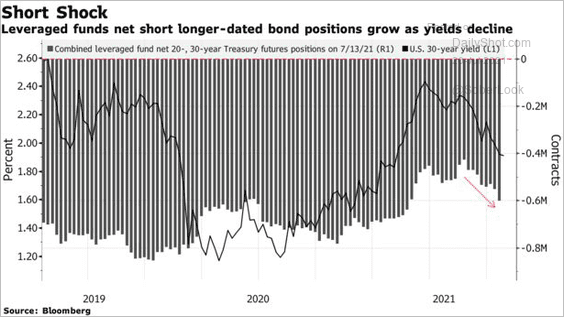 Source: Bloomberg Read full article
3. The 10-year Treasury yield tends to decline during the summer months.
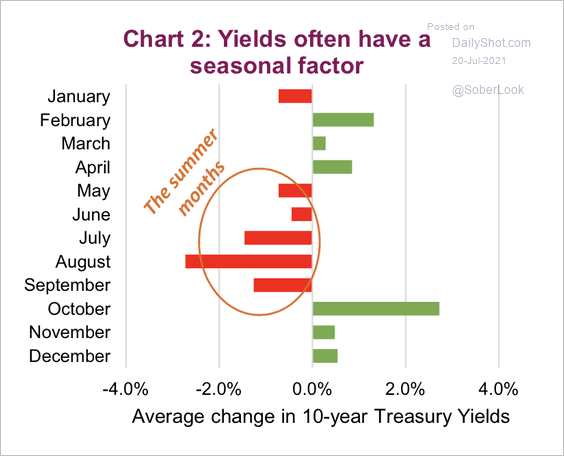 Source: Market Ethos, Richardson GMP
4. The 10-year Treasury yield typically rises within the next 6-months following a 20% drop.
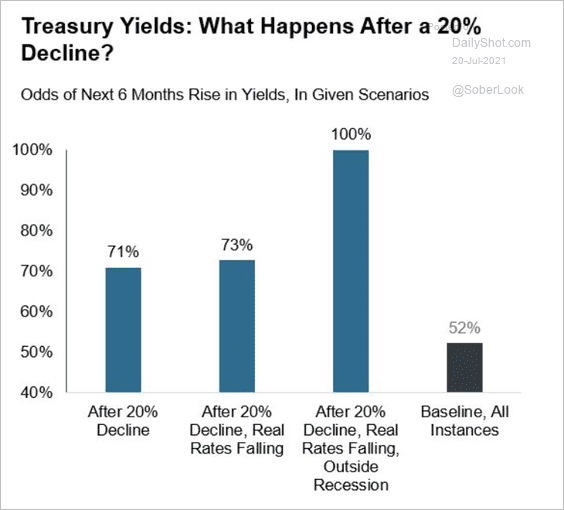 Source: Denise Chisholm
5. Many investors expect the first Fed rate hike in the second half of next year.
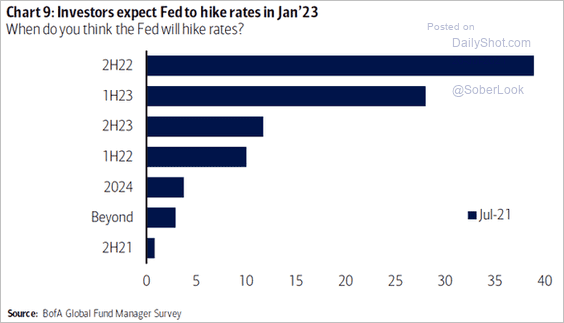 Source: @ISABELNET_SA, @BofAML
Back to Index
Global Developments
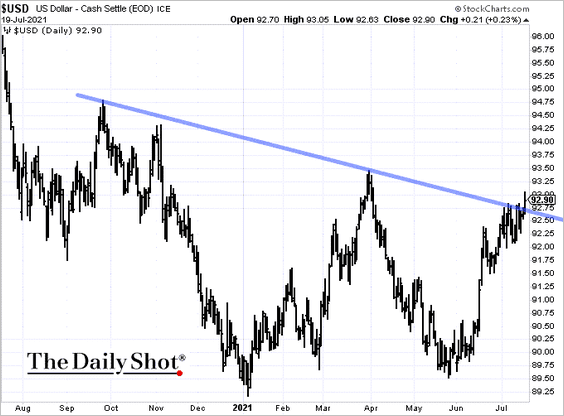
1. The US dollar index (DXY) is testing short-term resistance.
2. Speculative accounts have been covering their dollar shorts.
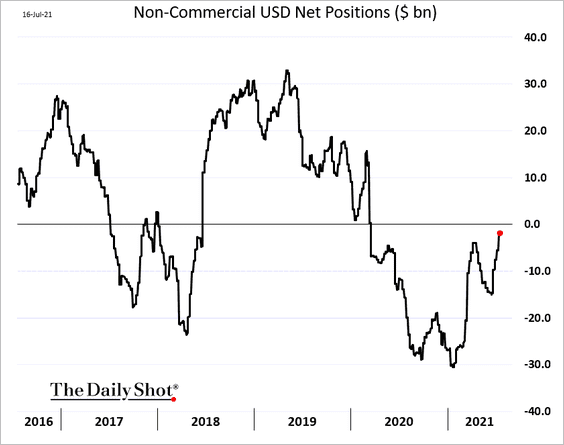 h/t Cormac Mullen
3. This chart shows vaccination progress around the world.
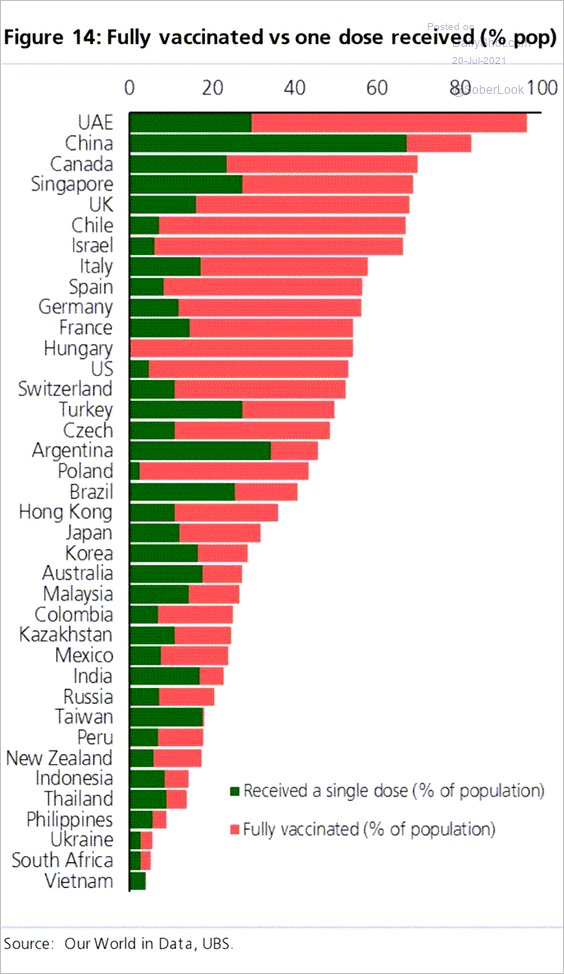 Source: @Scutty
4. Container rates have surged this year. Are they peaking?
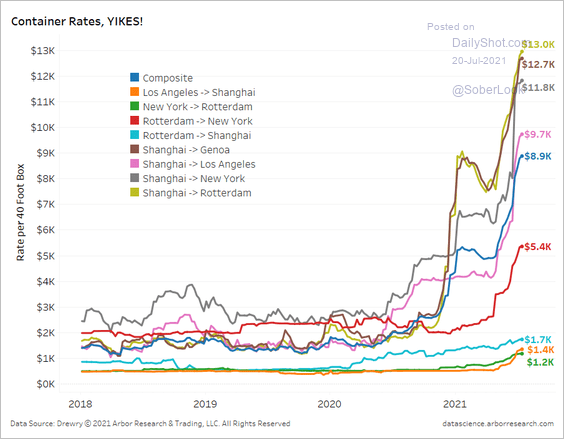 Source: Arbor Research & Trading
5. Google search activity for ‘housing crash’ has spiked this year.
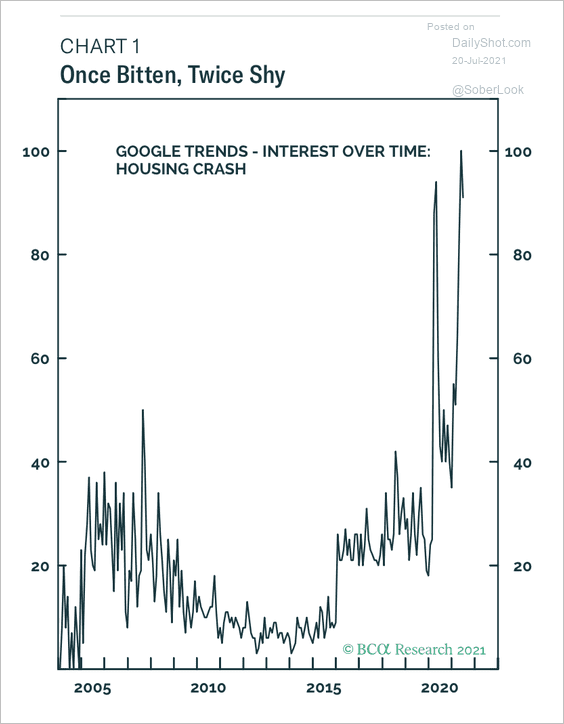 Source: BCA Research
6. Here is a sketch of money flow as a result of quantitative easing/tightening.
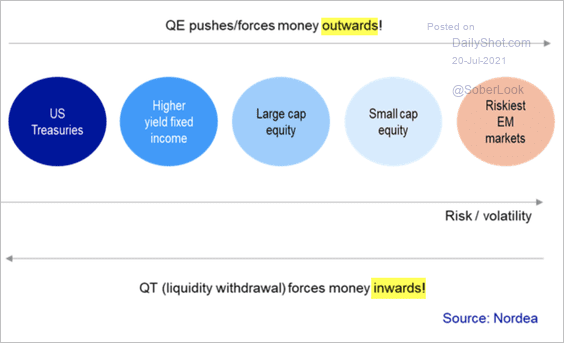 Source: Nordea Markets
——————–
Food for Thought
1. US homicide clearance rate:
![]() Source: The Economist Read full article
Source: The Economist Read full article
2. Inflation and homicide rates:
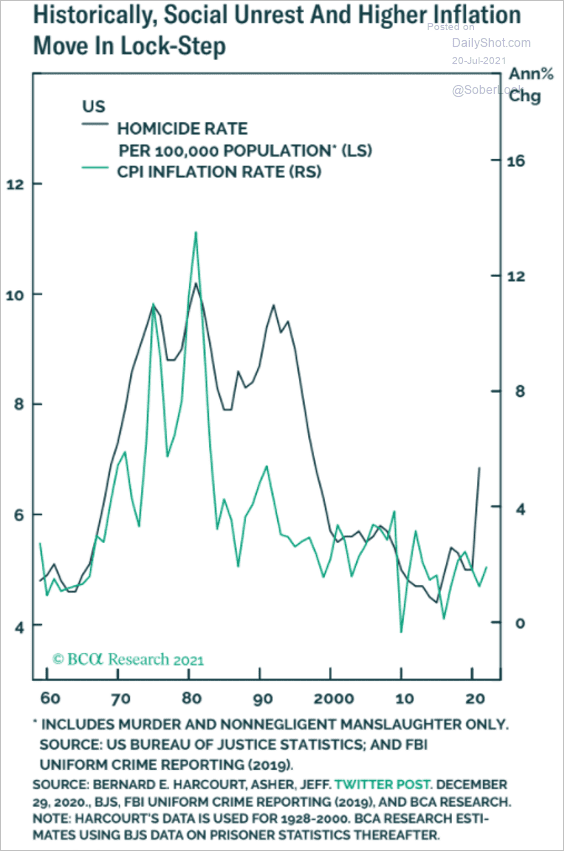 Source: BCA Research
3. Interest in women’s and men’s sports:
 Source: Morning Consult Read full article
4. Chances of getting a college degree by income group:
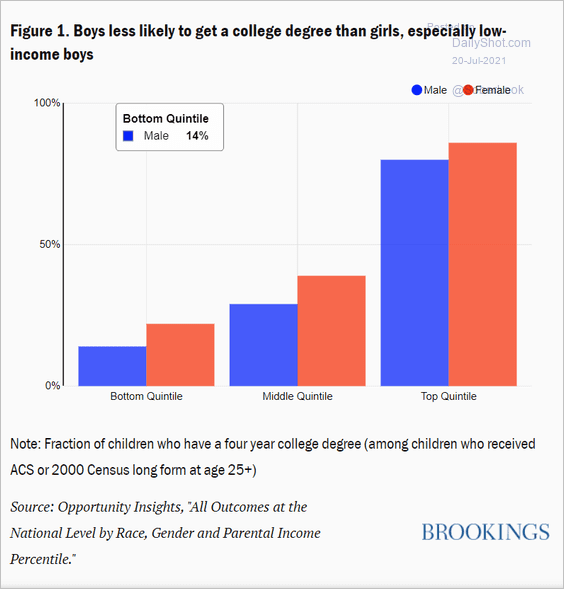 Source: Brookings Read full article
5. Outlook for US moral values, by party affiliation:
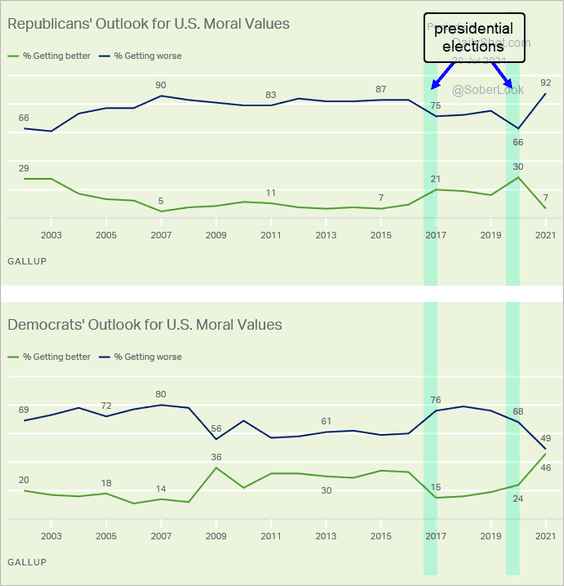 Source: Gallup Read full article
6. Moral acceptability of issues:
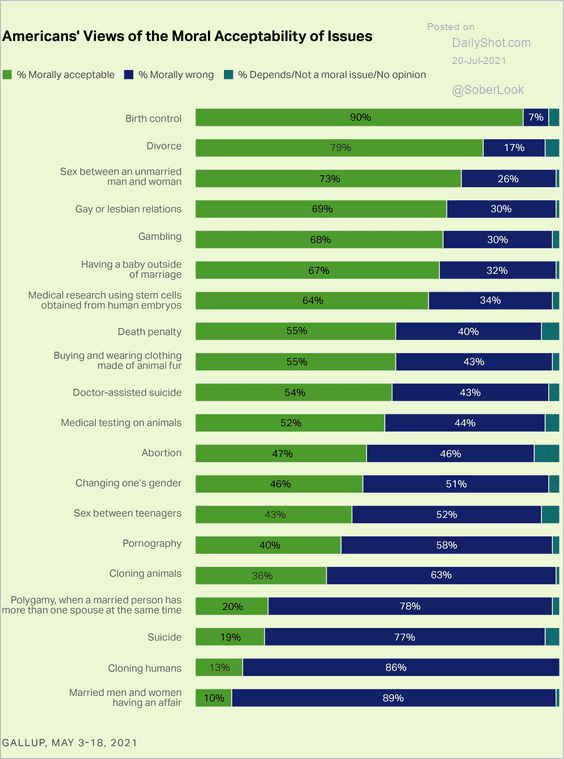 Source: Gallup Read full article
7. Donations to US congressional campaigns in 2020:
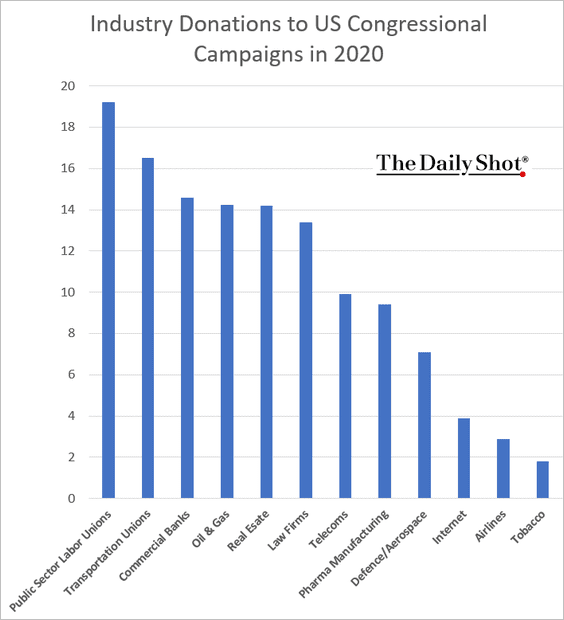 Source: STAT Read full article
8. Passenger incidents on airlines:
 Source: @chartrdaily
9. Single-use plastics data (3 charts):
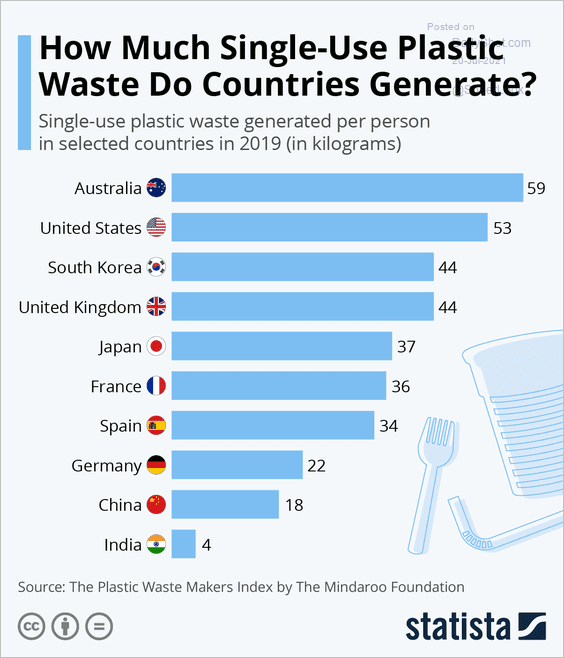 Source: Statista
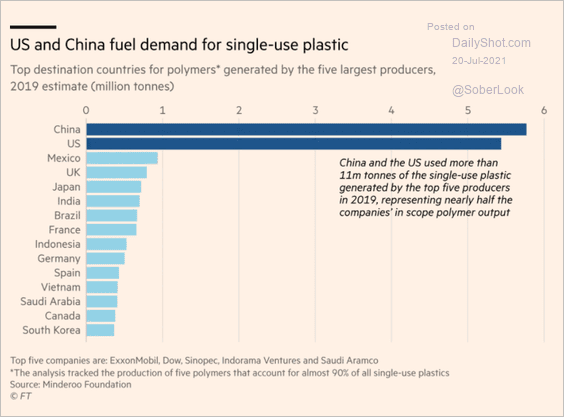 Source: @financialtimes Read full article
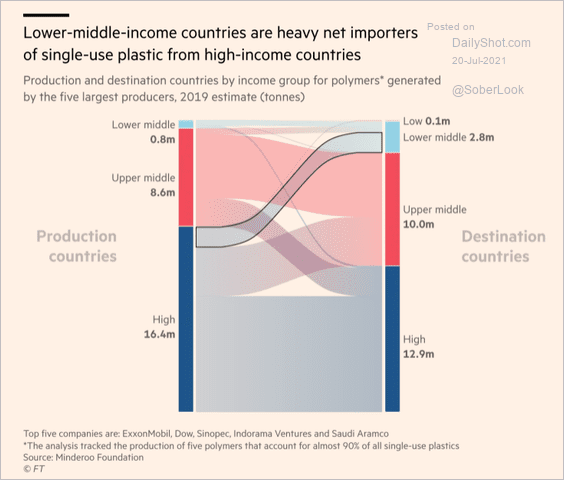 Source: @financialtimes Read full article
——————–
10. Share of young people living with parents:
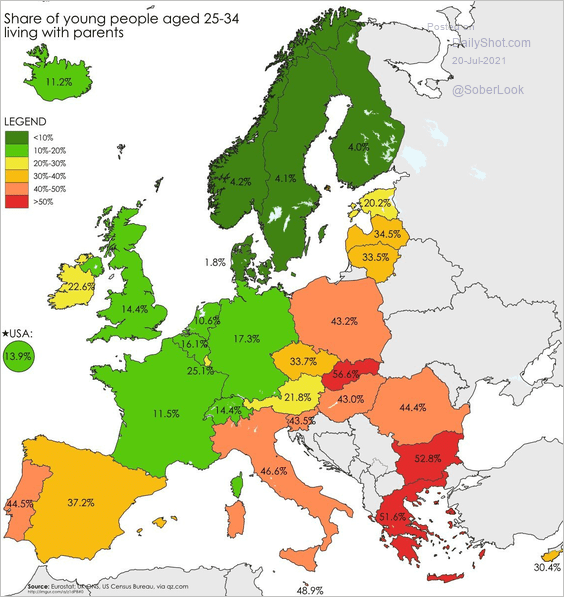 Source: Quartz
——————–
Back to Index