
The Daily Shot: 27-Jul-21
• The United States
• Canada
• The United Kingdom
• The Eurozone
• Europe
• Japan
• Asia – Pacific
• China
• Emerging Markets
• Cryptocurrency
• Commodities
• Equities
• Credit
• Rates
• Global Developments
• Food for Thought
The United States
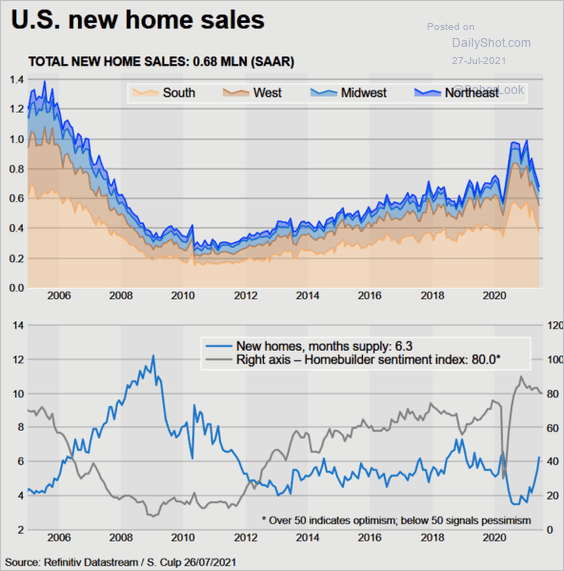
1. Let’s begin with the housing market.
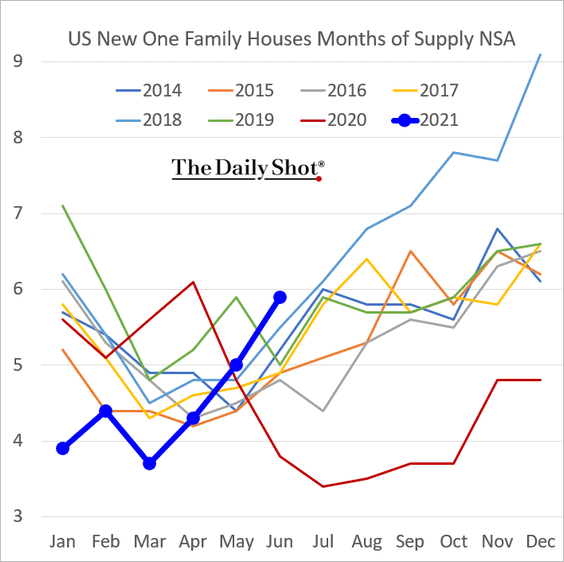
• New home sales missed expectations, dipping below 2019 levels in June.
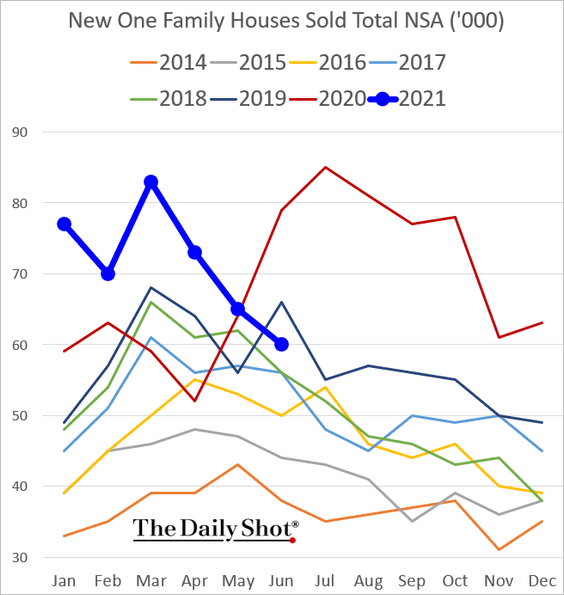
Inventories, measured in months of supply, climbed.
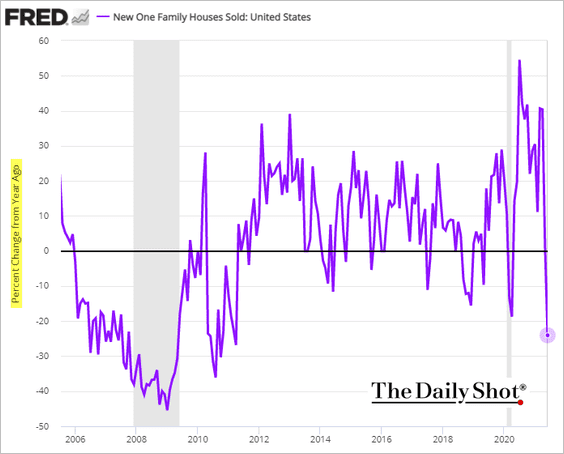
Here are some additional charts on new home sales.
– Year-over-year changes:
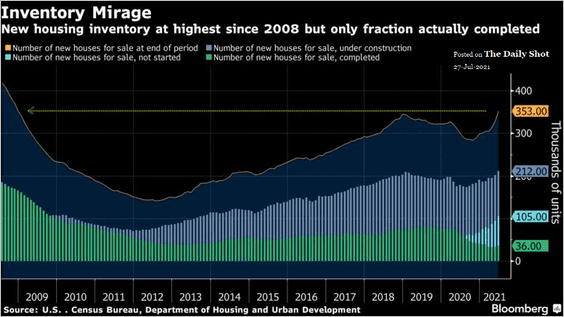
– Absolute levels of housing inventories:
 Source: @wealth Read full article
– Regional sales (seasonally adjusted):
 Source: Reuters Read full article
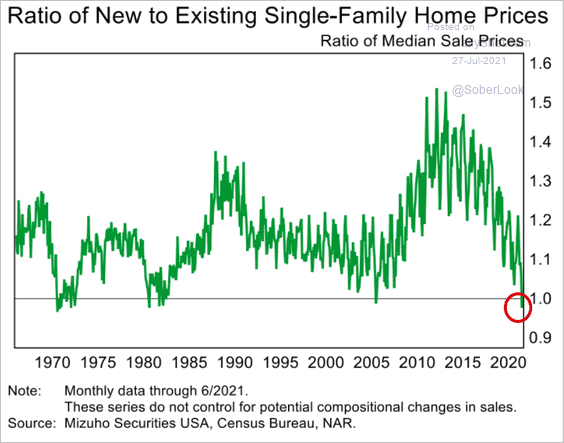
• The ratio of new to existing home prices is below one. This trend doesn’t bode well for existing-home price appreciation.
 Source: Mizuho Securities USA
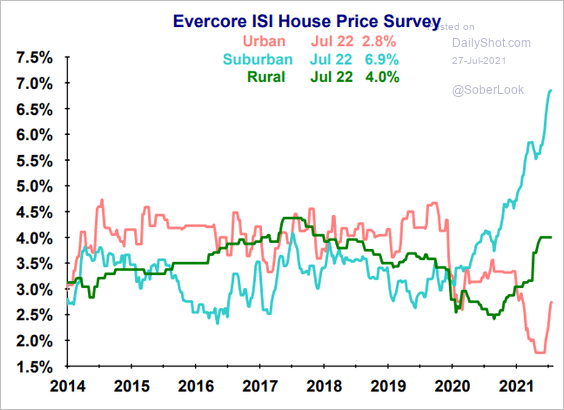
• Suburban homes experienced the fastest appreciation since the start of the pandemic.
 Source: Evercore ISI
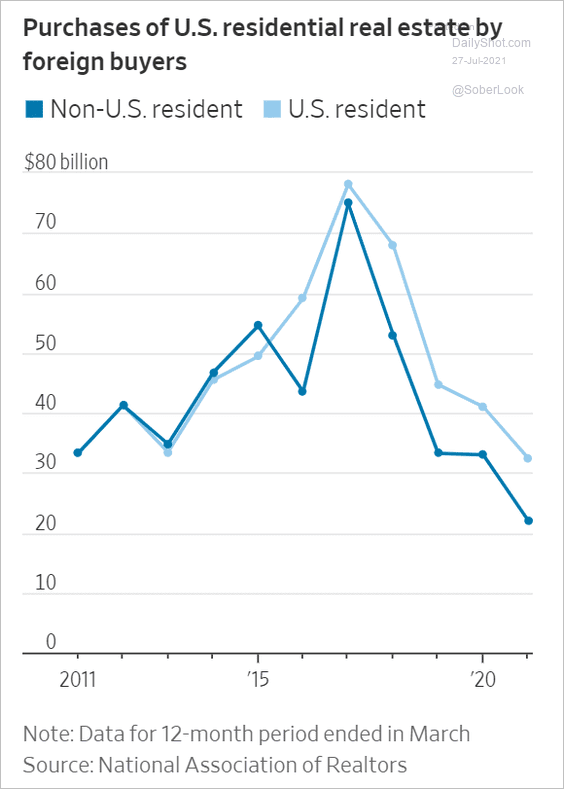
• Foreigners have been reducing purchases of US homes.
 Source: @WSJ Read full article
• The nation’s apartment market has become extremely tight.
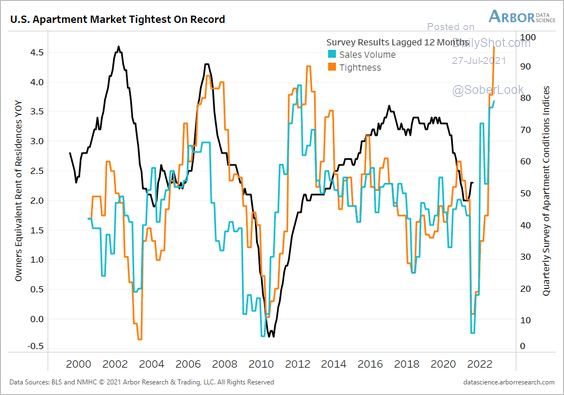 Source: Arbor Research & Trading
——————–
2. Deutsche Bank expects consumer spending to rise above its pre-pandemic trend this year.
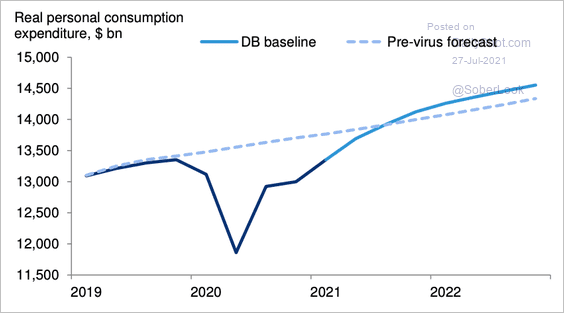 Source: Deutsche Bank Research
3. Credit card usage surged in the second quarter, but households are paying off their balances.
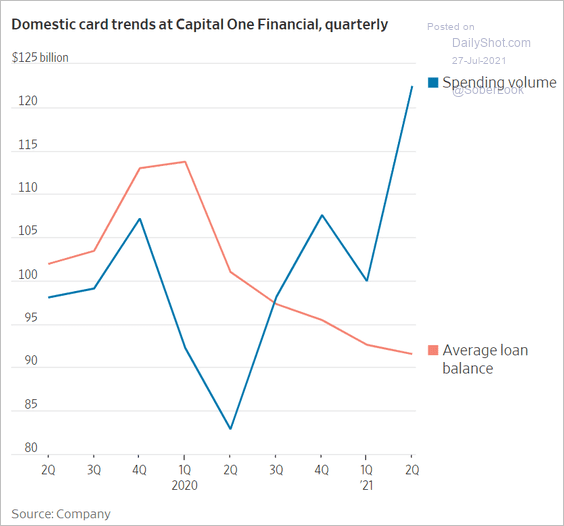 Source: @WSJ Read full article
4. This chart shows US retail mobility by region.
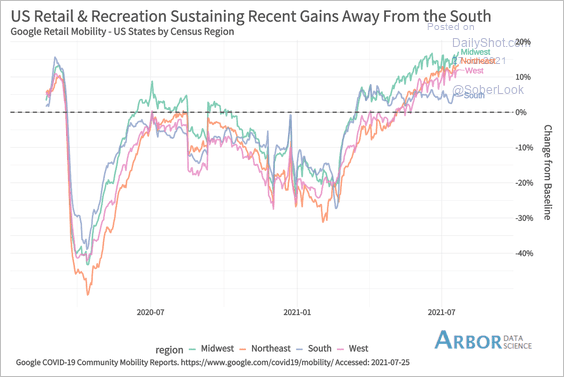 Source: Arbor Research & Trading
5. There has been a substantial increase in new retail businesses this year.
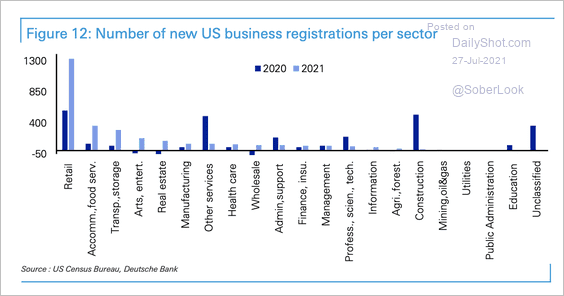 Source: Deutsche Bank Research
The Evercore ISI retailers’ survey shows sales surging.
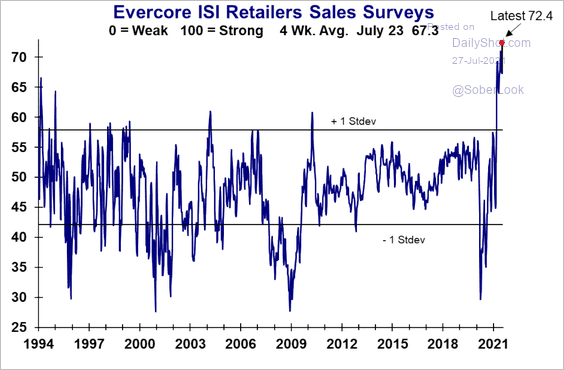 Source: Evercore ISI
——————–
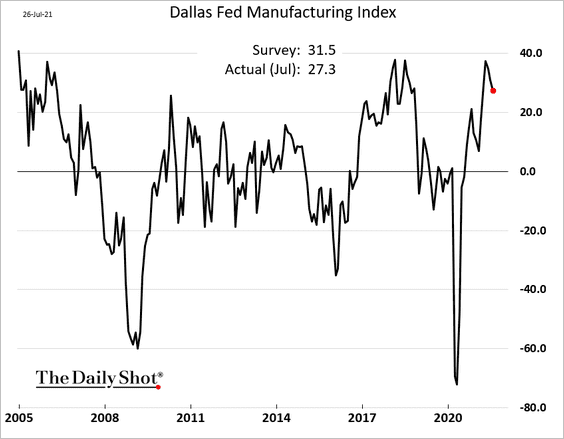
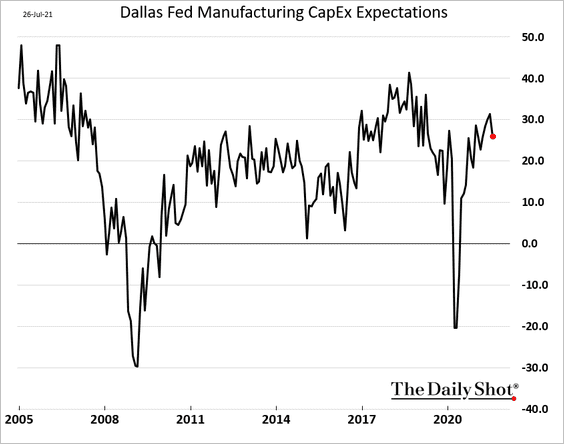
6. The Dallas Fed’s regional manufacturing index pulled back from the recent high.
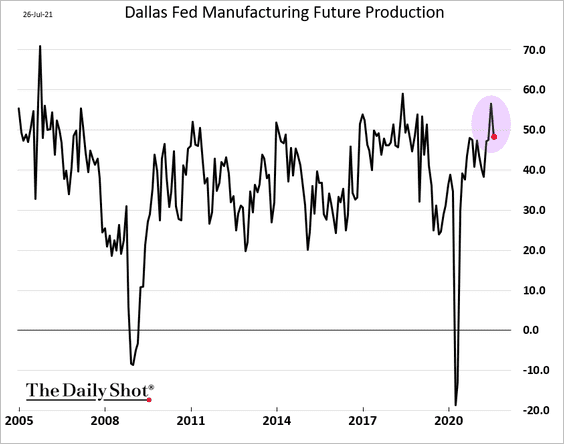
• Factories are somewhat less upbeat about the future.
• CapEx expectations moderated.
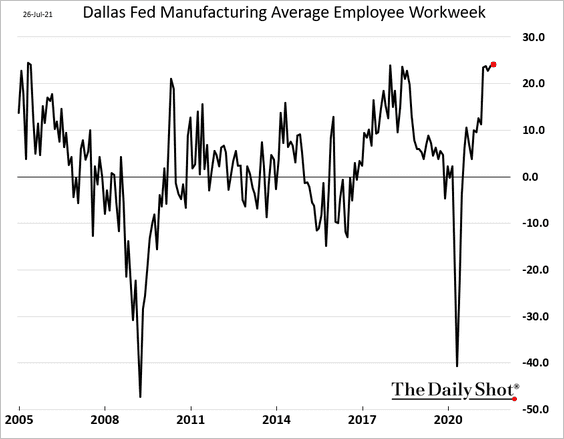
• Employees are working long hours.
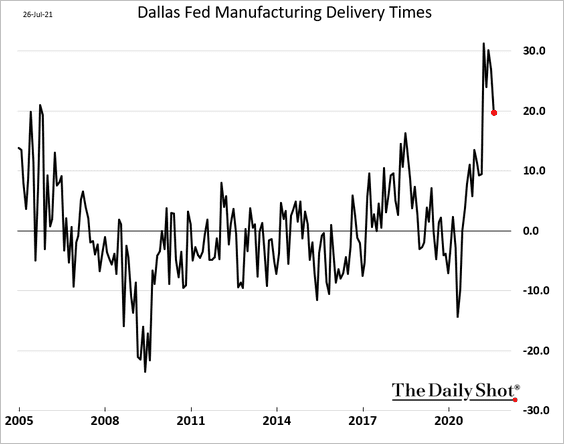
• Supplier bottlenecks appear to be easing.
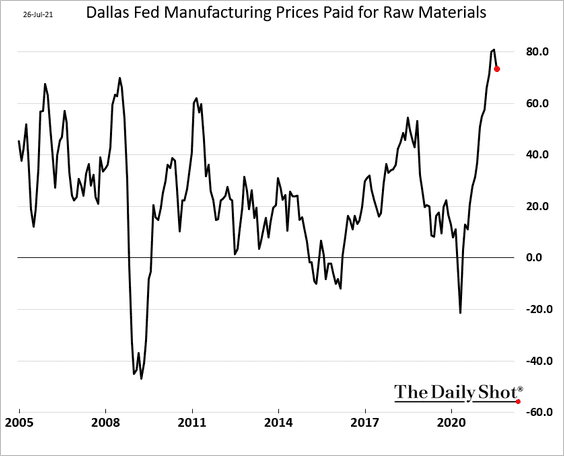
And the “prices paid” index has peaked.
Back to Index
Canada
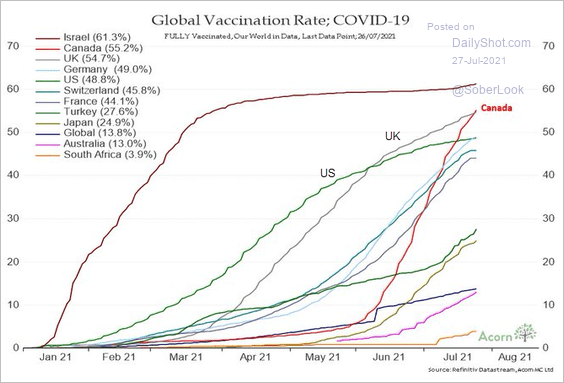
1. Canada’s vaccination rate is now higher than the levels we see in the UK.
 Source: @RichardDias_CFA
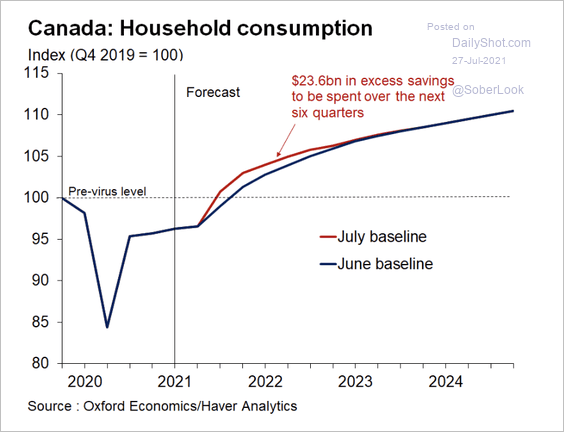
2. Oxford Economics expects household consumption to rise, driven by the large buildup in excess savings.
 Source: Oxford Economics
Back to Index
The United Kingdom
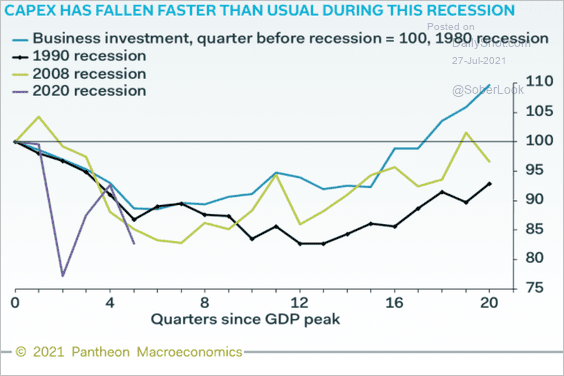
1. CapEx has been lagging previous recessions.
 Source: Pantheon Macroeconomics
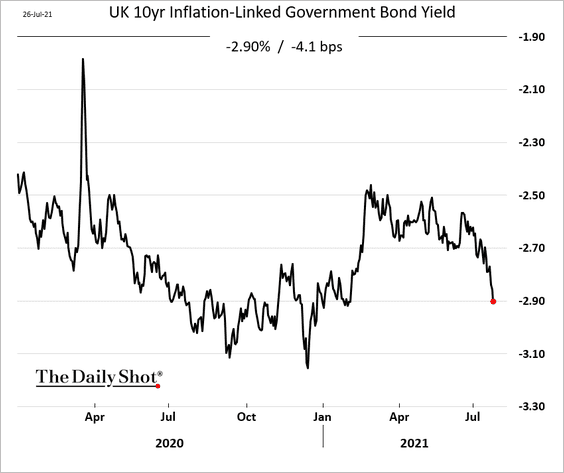
2. Real rates are tumbling (similar to the US and the Eurozone).
 Source: Tradeweb
3. These charts show comfort levels with different activities by age.
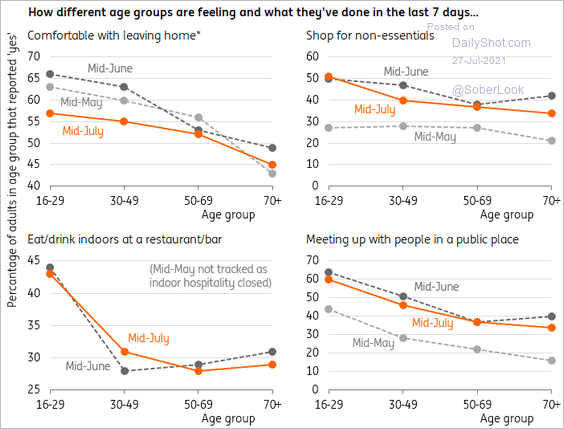 Source: ING
4. “Delayable” spending has been decreasing.
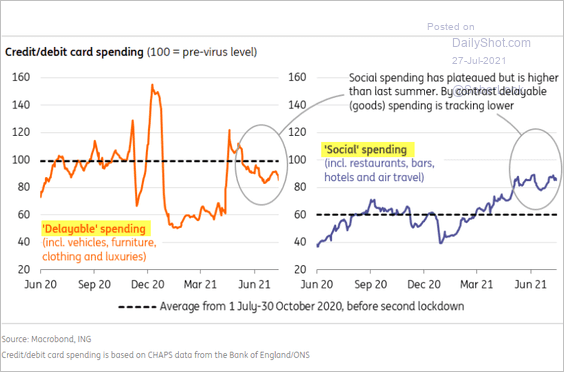 Source: ING
5. Support for Boris Johnson is trending lower.
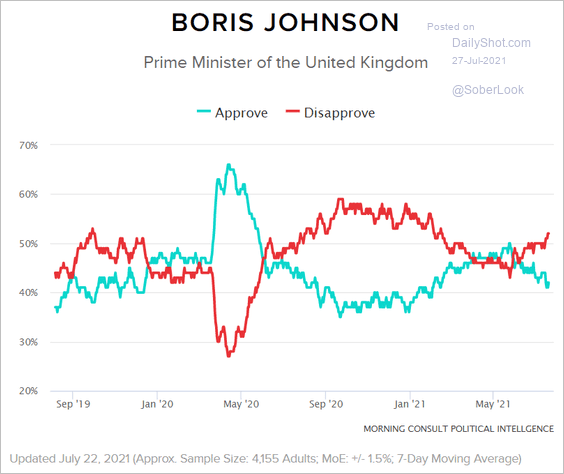 Source: Morning Consult
Back to Index
The Eurozone
1. Let’s begin with Germany.
• The Ifo expectations index surprised to the downside.
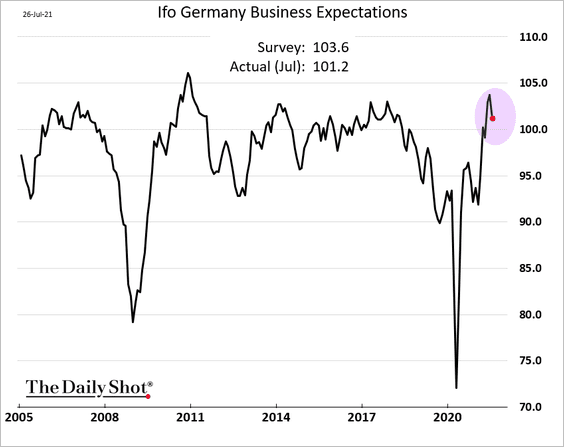
Here is the sector breakdown.
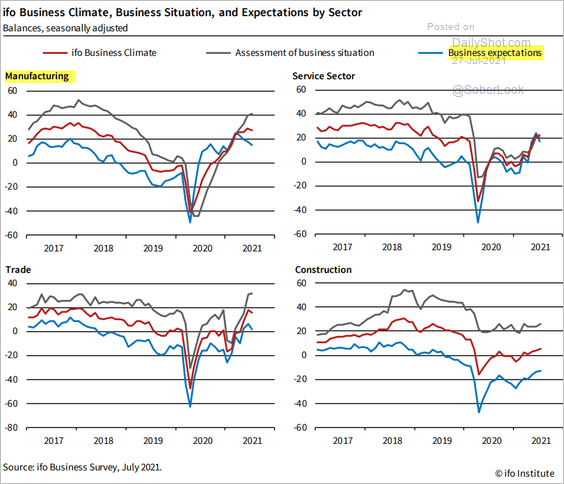 Source: ifo Institute
• Real rates continue to fall.
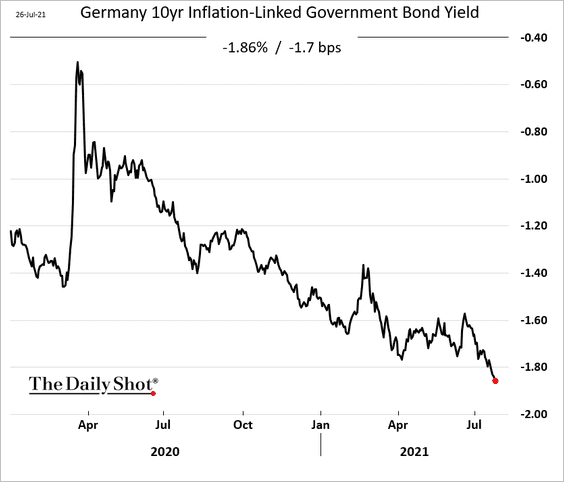 Source: Tradeweb
• This chart shows Germany’s job growth since 1995.
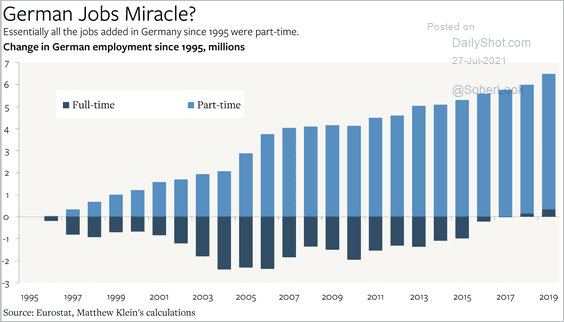 Source: @heimbergecon, @M_C_Klein Read full article
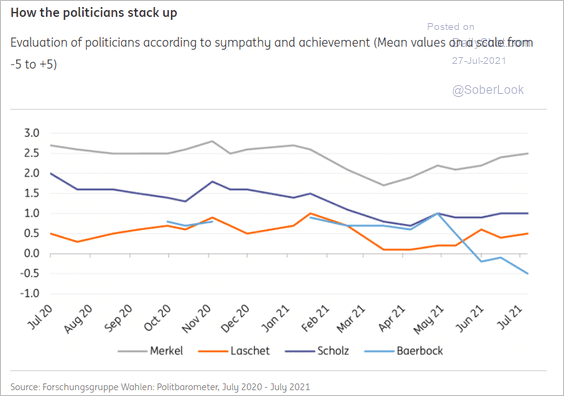
• Next, we have the latest poll figures.
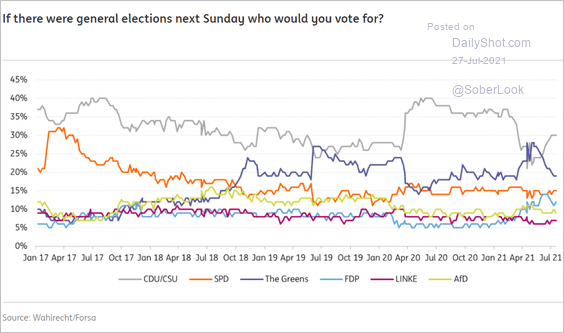 Source: ING
Support for Angela Merkel remains robust (2 charts)
 Source: ING
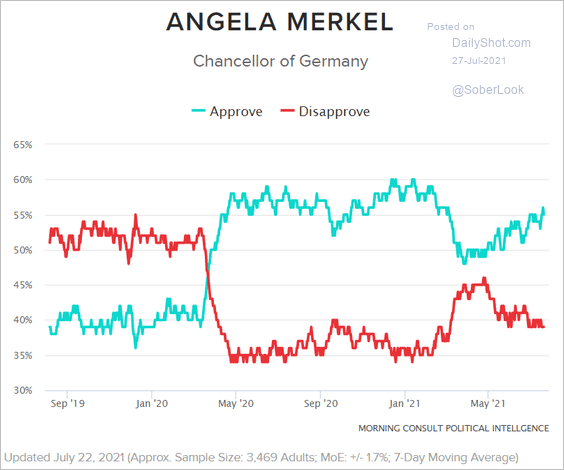 Source: Morning Consult
——————–
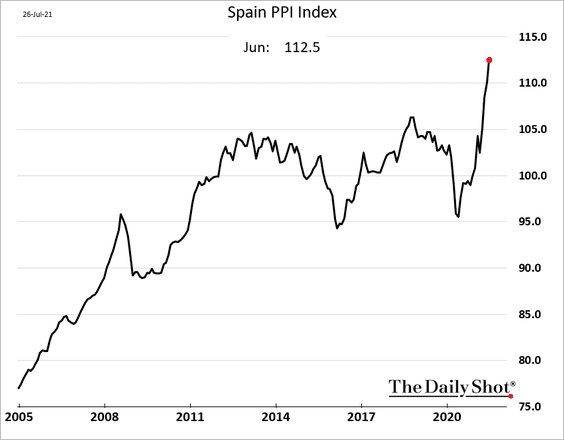
2. Spain’s producer prices are surging.
3. Will the slowdown in the money supply expansion put downward pressure on economic growth?
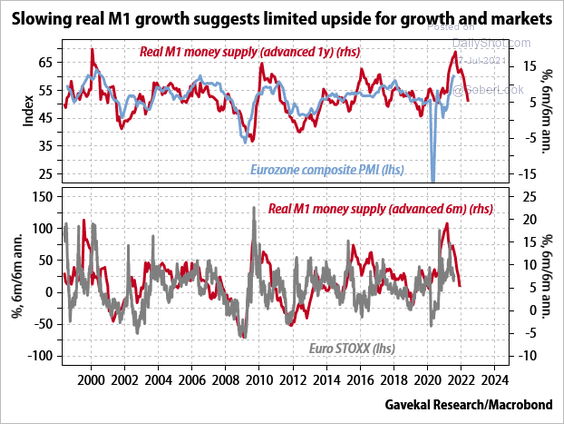 Source: Gavekal Research
Back to Index
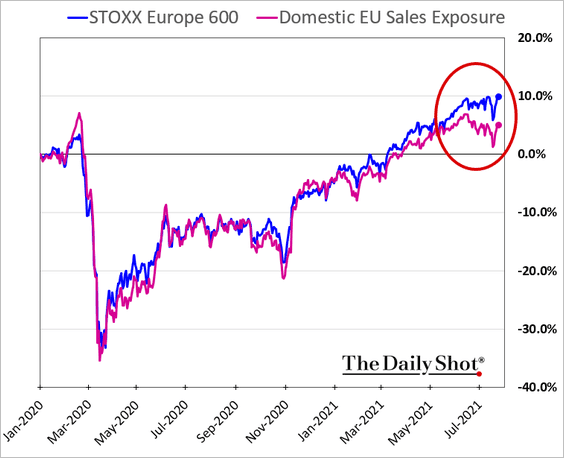
Europe
1. Shares of companies with domestic sales exposure have underperformed.
2. Traffic congestion shows declining mobility in Europe.
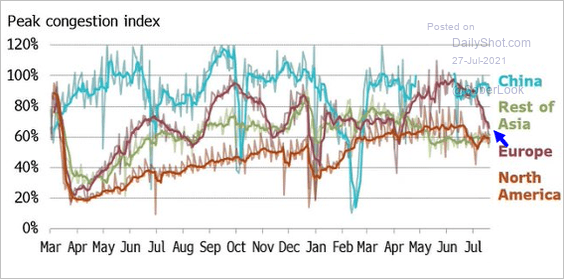 Source: @Sino_Market, @business Read full article
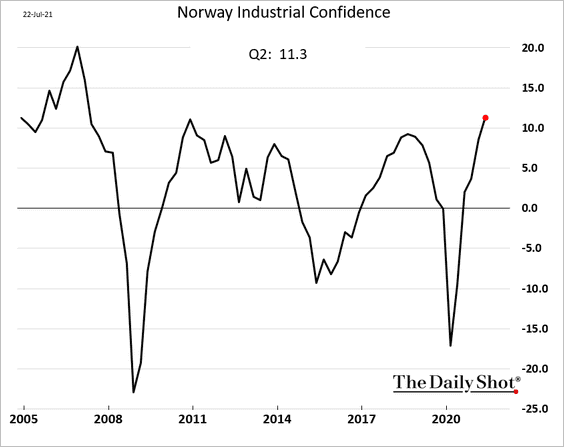
3. Norway’s industrial confidence is at multi-year highs.
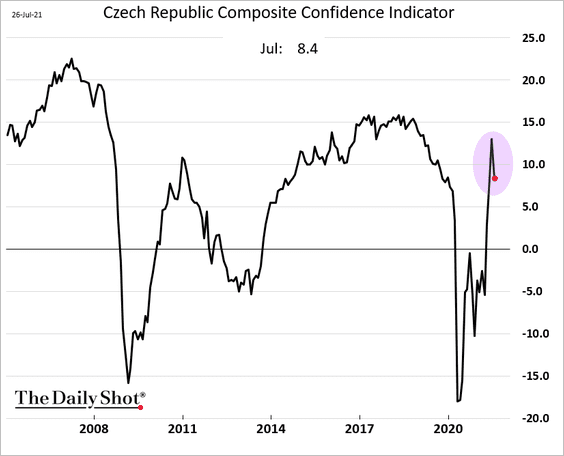
4. The Czech Republic’s composite confidence indicator dropped this month.
5. Poland’s consumer confidence continues to recover but remains well below pre-COVID levels.
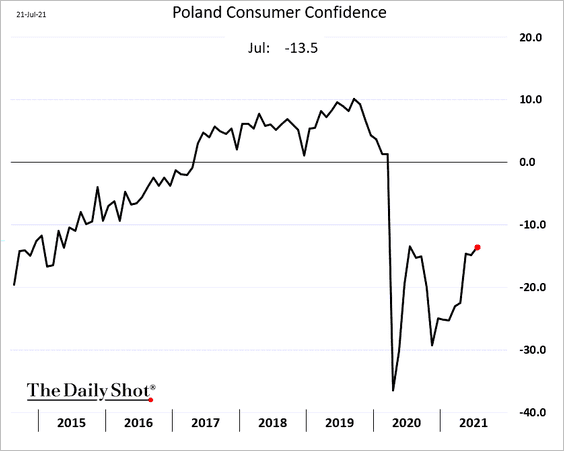
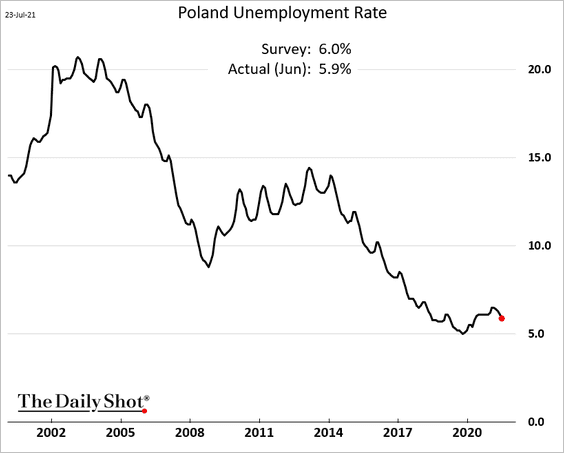
The unemployment rate is trending lower.
——————–
6. Finally, we have broadband connection speeds across Europe.
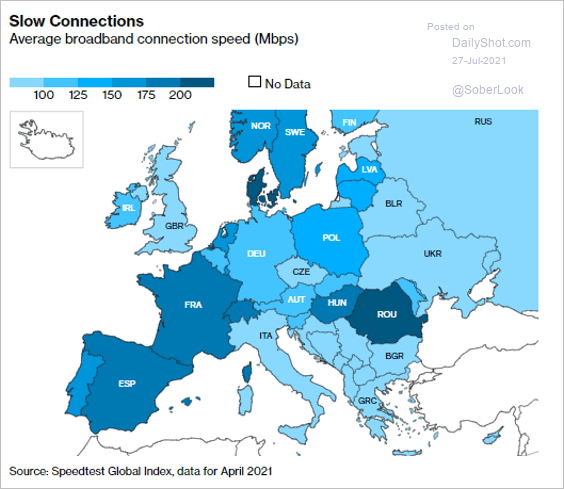 Source: Bloomberg Read full article
Back to Index
Japan
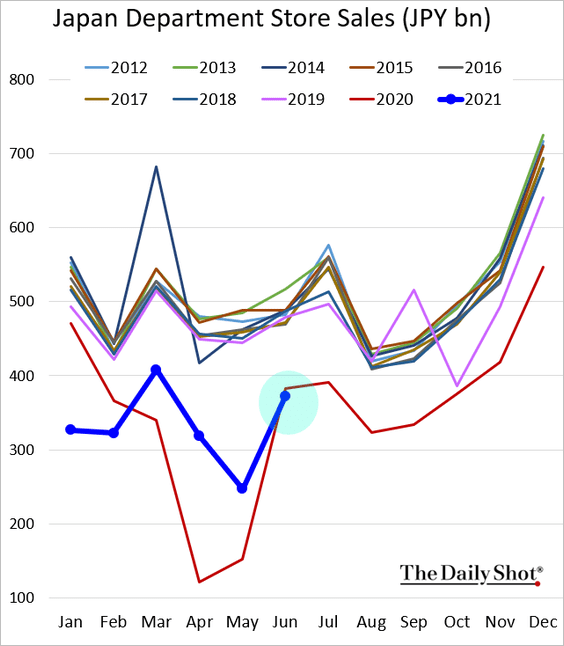
1. Department store sales are running below 2020 levels.
2. These charts show the BoJ’s forecasts for GDP growth and the core CPI.
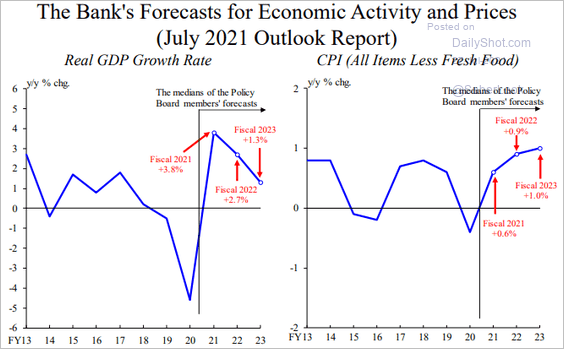 Source: BoJ Read full article
3. Support for Yoshihide Suga continues to decline (see story).
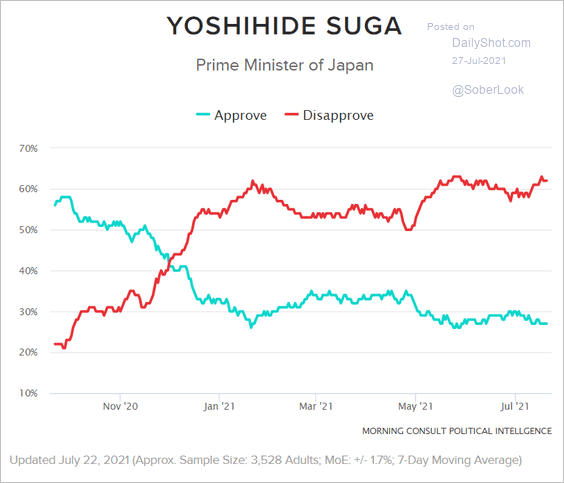 Source: Morning Consult
Back to Index
Asia – Pacific
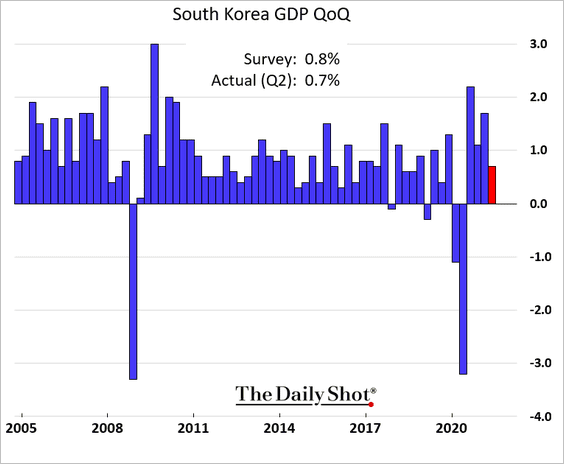
1. South Korea’s GDP growth slowed.
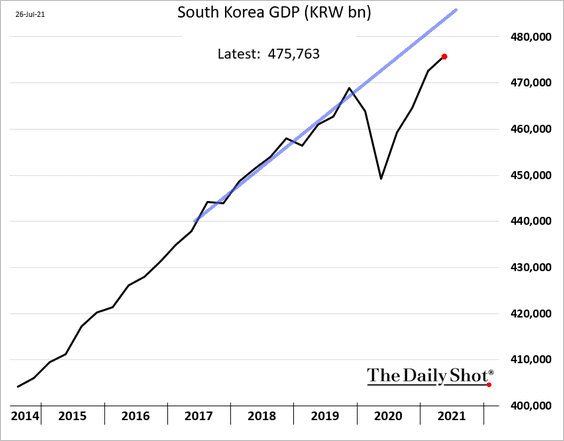
Here is the absolute GDP level.
——————–
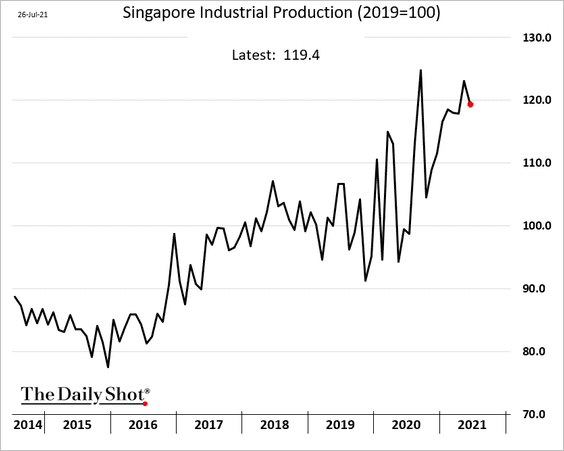
2. Singapore’s industrial production eased in June but remained robust.
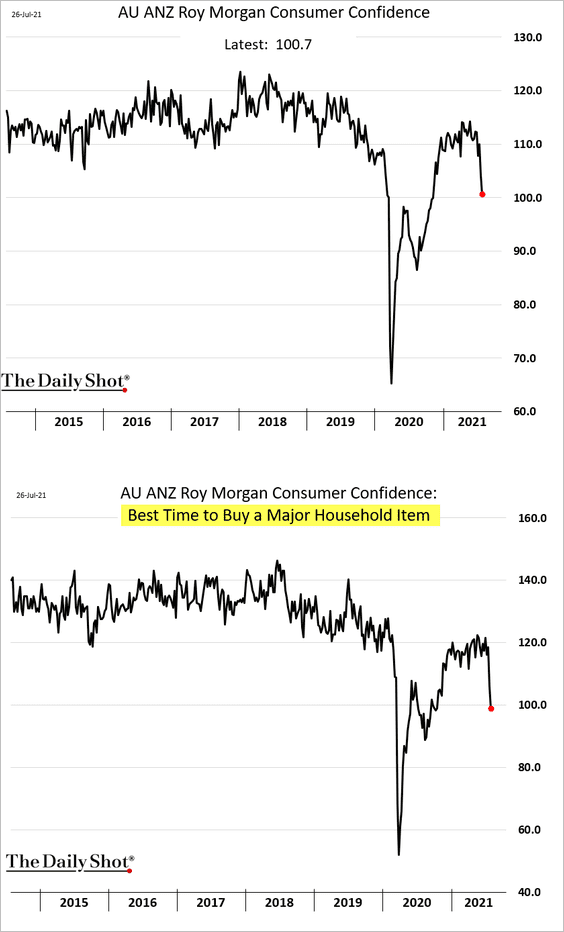
3. Australia’s consumer confidence tumbled amid lockdowns.
Business activity, especially services, is now underperforming.
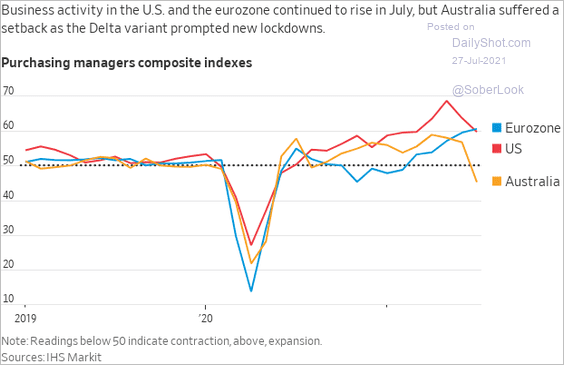 Source: @jeffsparshott
Back to Index
China
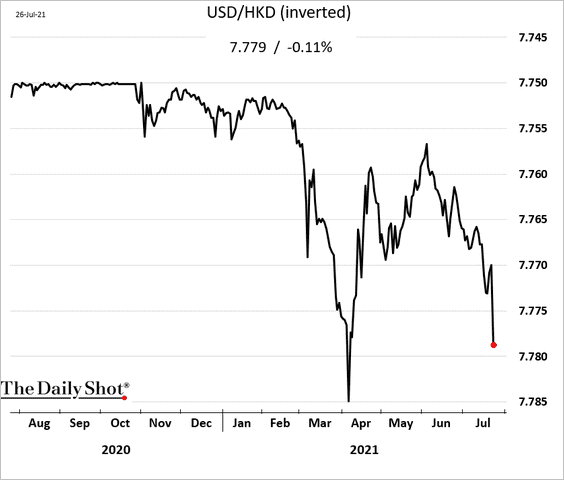
1. Shares in Hong Kong remain under pressure.
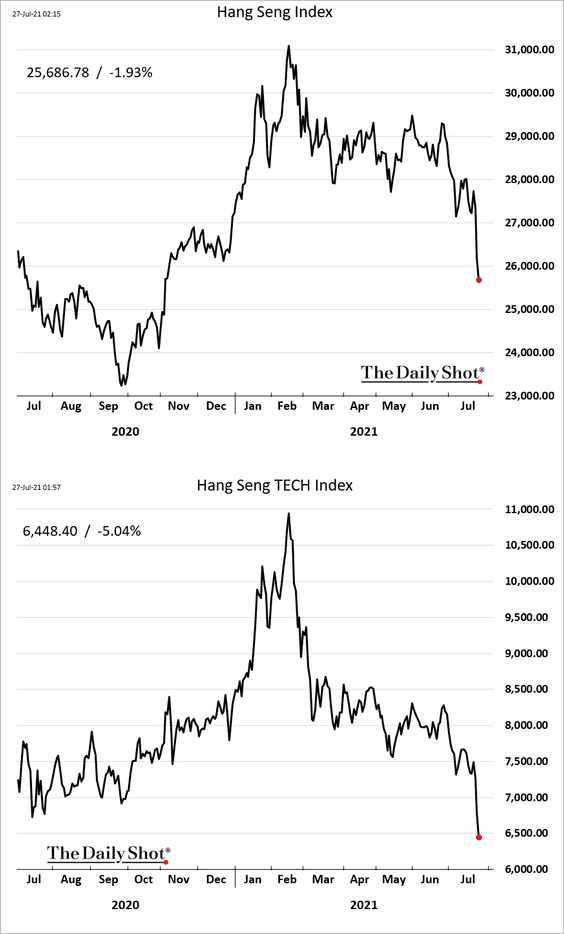
The Hong Kong dollar weakened.
——————–
2. US ADRs of Chinese shares tumbled on Monday.
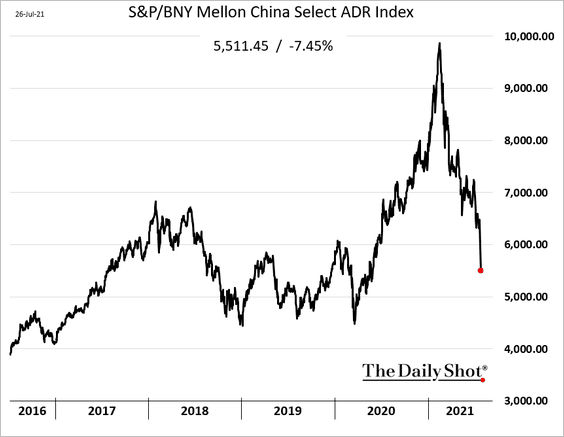 h/t David Wilson
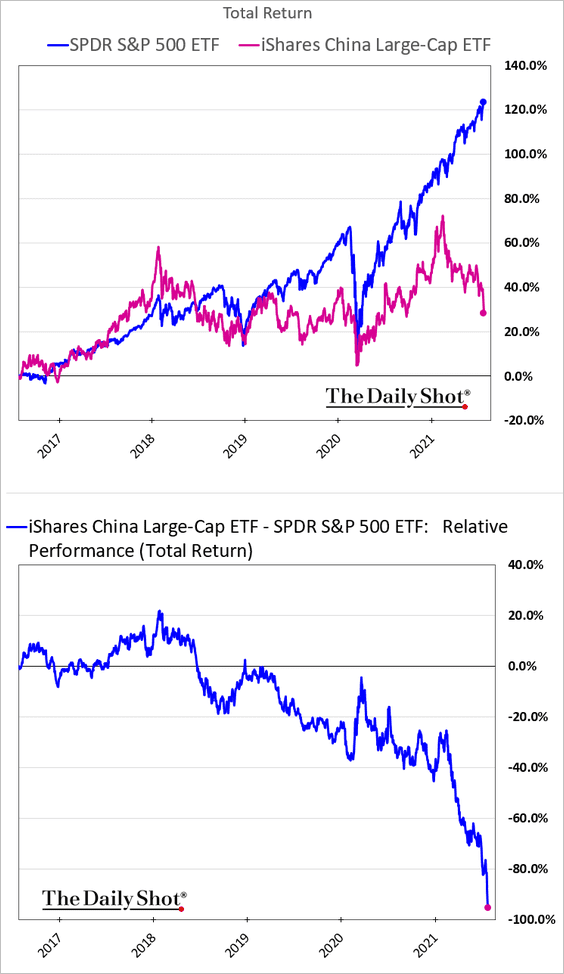
3. In dollar terms, China’s large-cap stocks have massively underperformed the S&P 500 this year.
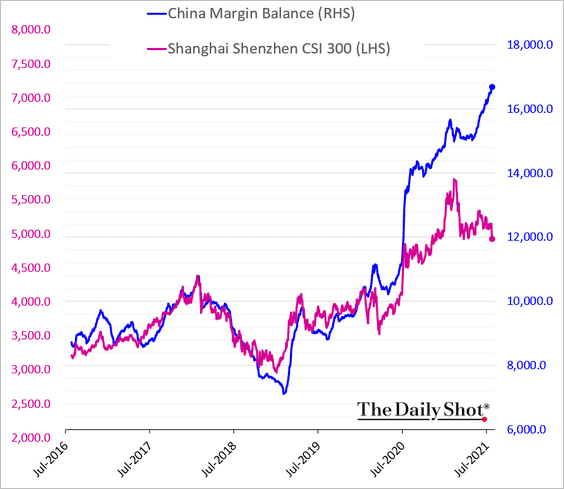
4. China’s margin debt has been climbing, even as the stock market rally stalls.
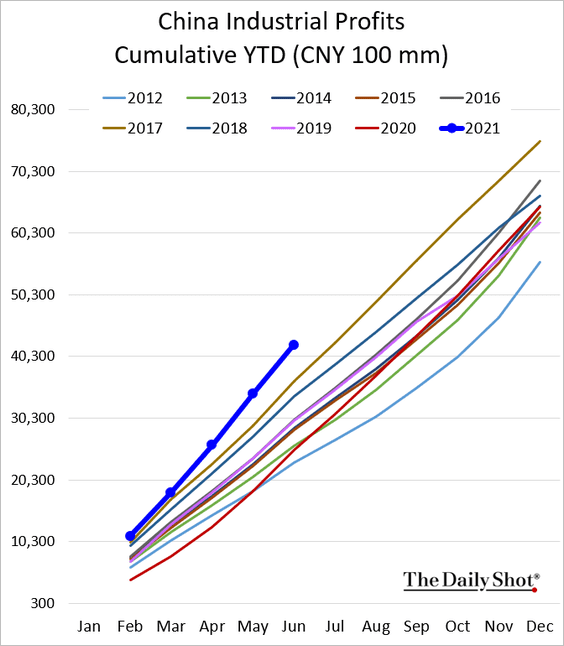
5. China’s industrial profits remain robust.
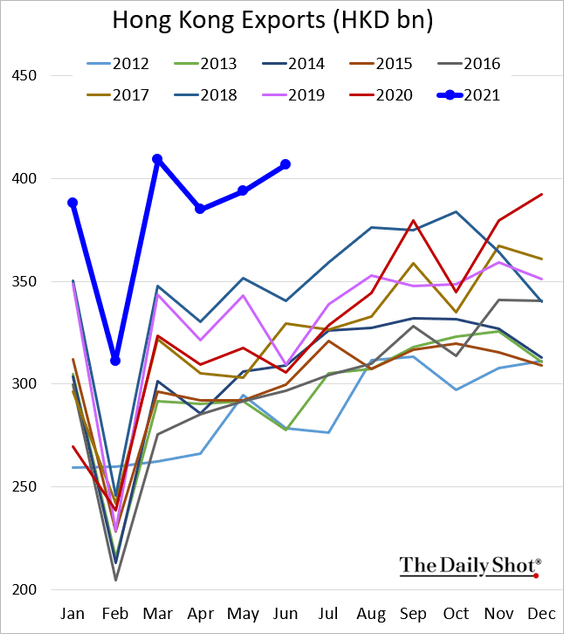
6. Hong Kong’s exports have been exceptionally strong.
7. Should the renminbi be weaker?
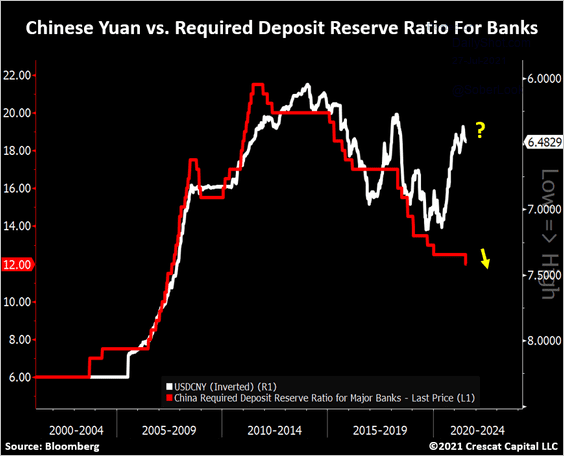 Source: @TaviCosta
Back to Index
Emerging Markets
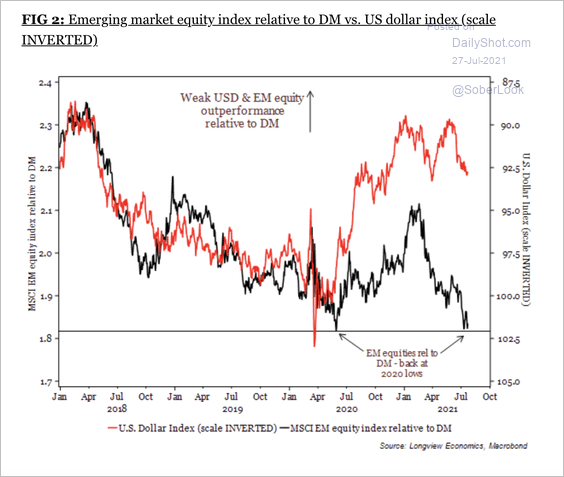
1. The MSCI EM equity index is now down year-to-date due to the selloff in China.
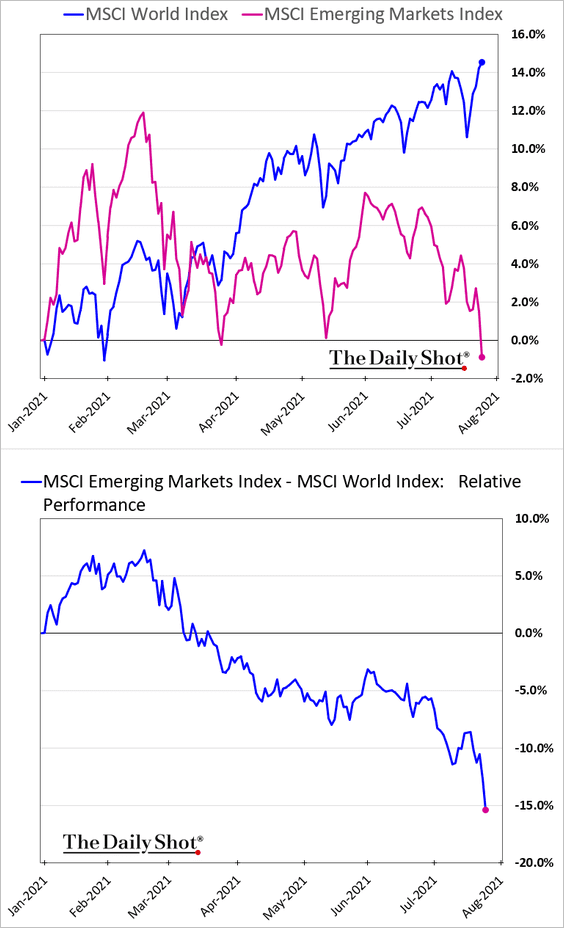
Also, the recent decline in EM equities coincided with a bounce in the dollar (2 charts).
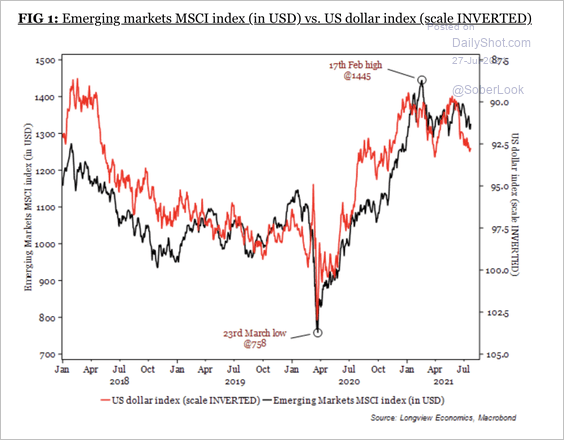 Source: Longview Economics
 Source: Longview Economics
——————–
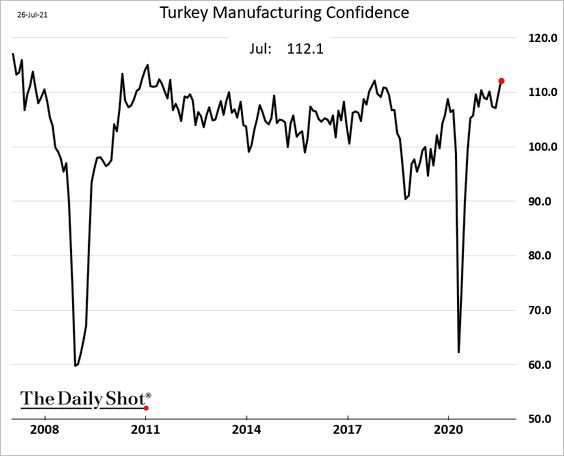
2. Turkey’s manufacturing confidence is surging.
3. Indonesia’s inflation is well below the central bank’s target band.
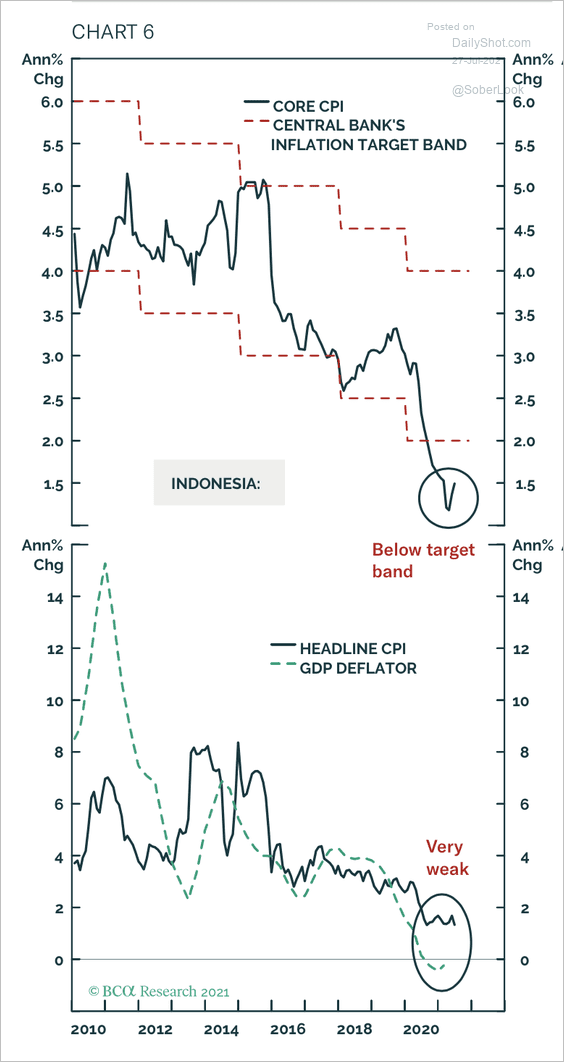 Source: BCA Research
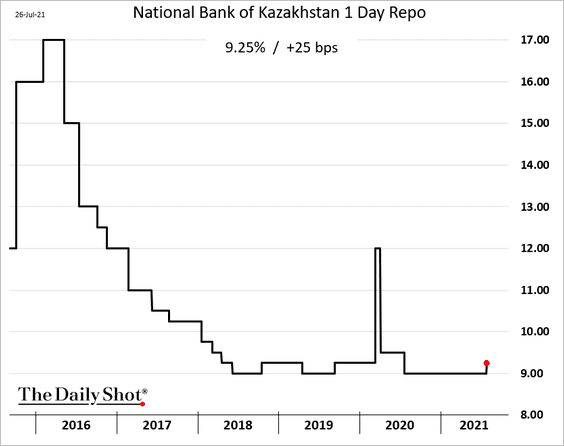
4. Kazakhstan’s central bank hiked rates.
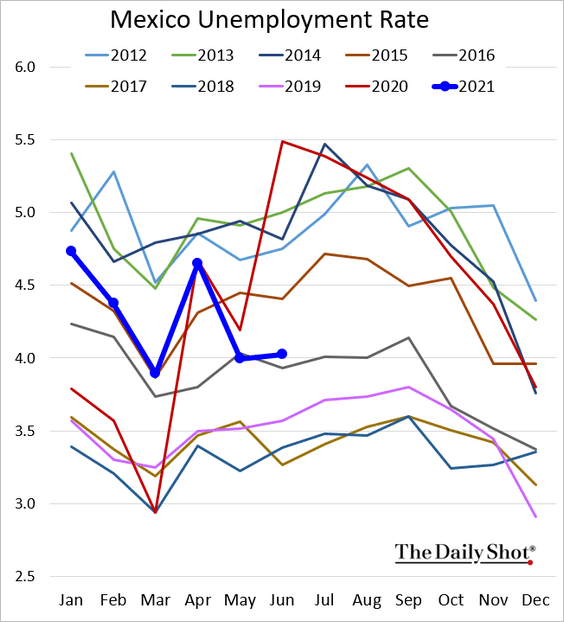
5. Mexico’s unemployment rate remains well above 2019 levels.
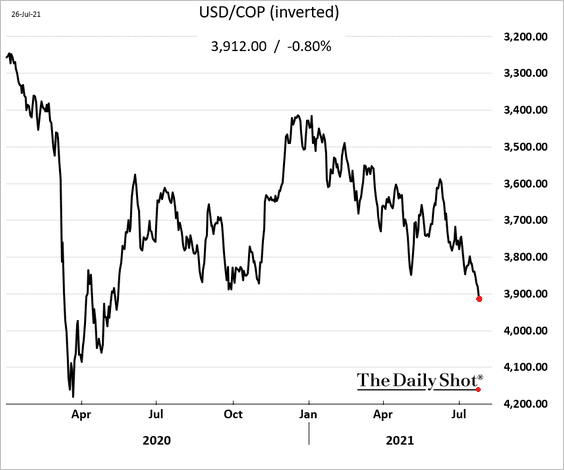
6. The Colombian peso continues to slide.
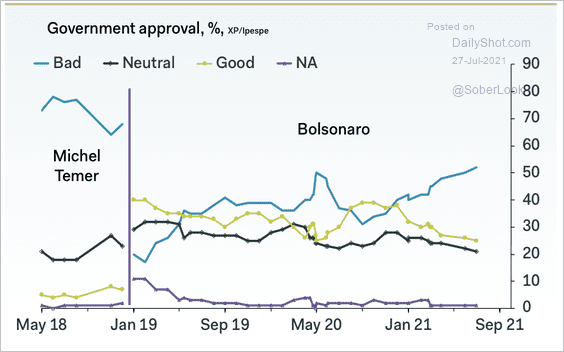
7. Brazil’s consumer confidence is recovering.
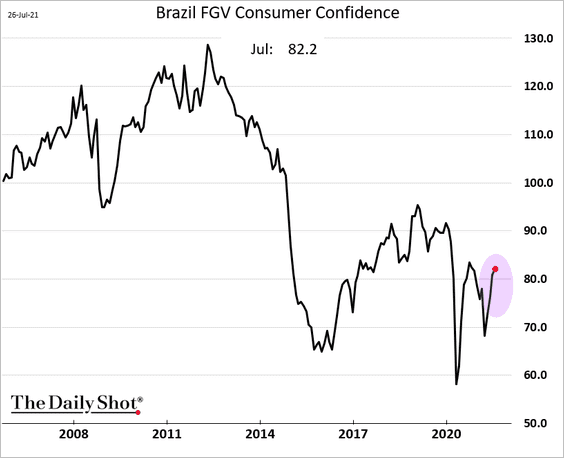
Bolsanaro’s disapproval rating continues to rise.
 Source: Pantheon Macroeconomics
Back to Index
Cryptocurrency
1. Bitcoin briefly breached $40k amid Amazon rumors …
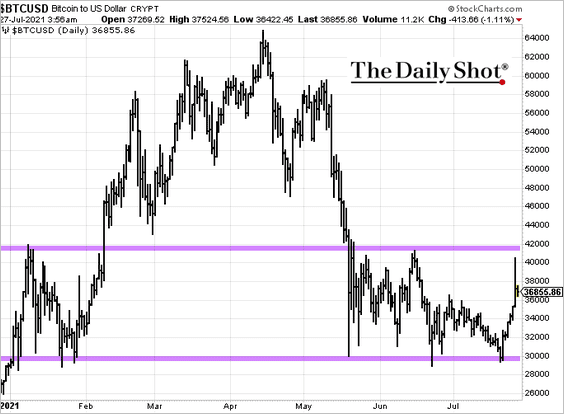
But Amazon has no plans to accept Bitcoin. Someone profited handsomely after spreading this rumor.
 Source: CoinDesk Read full article
——————–
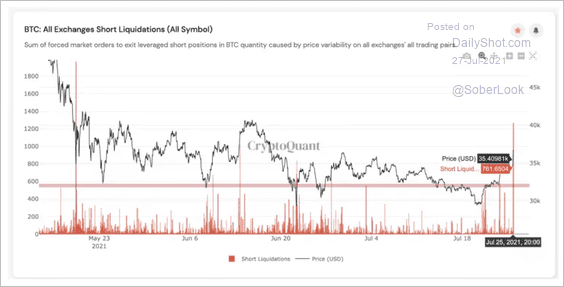
2. Roughly 2,000 short Bitcoin positions were liquidated over a 2 hour period fueling a near 20% price rally.
 Source: CryptoQuant
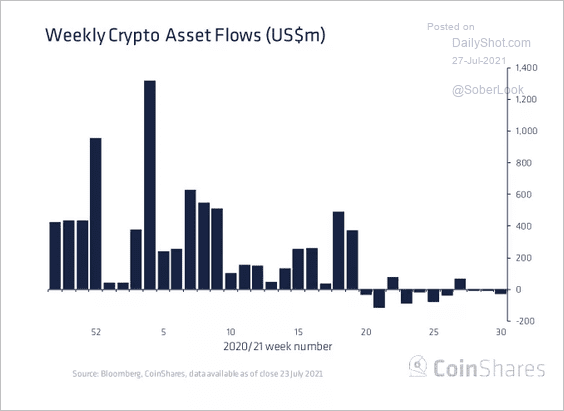
3. Investors pulled money out of digital asset funds as Bitcoin dipped below $30K last week.
 Source: CoinShares
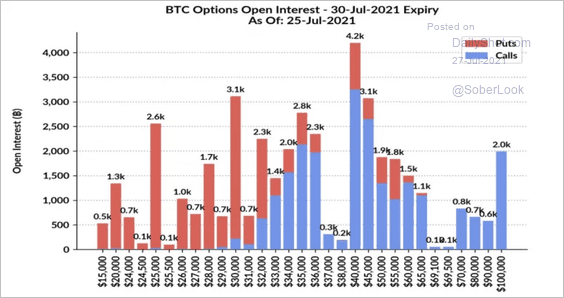
4. A Bitcoin strike price of $40K represents the largest open interest for the upcoming option expiry this Friday, which could be a source of volatility.
 Source: Skew Read full article
Back to Index
Commodities
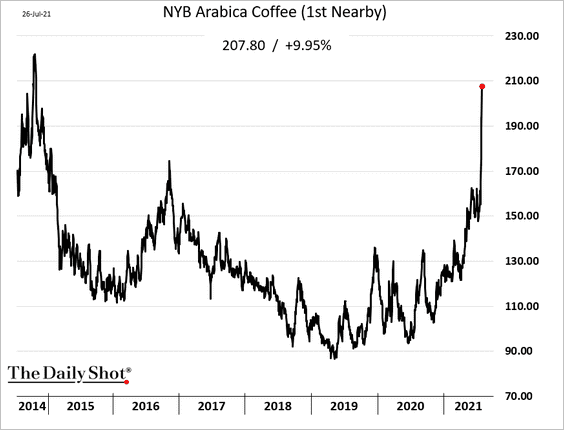
1. Coffee prices continue to surge
 Source: Reuters Read full article
——————–
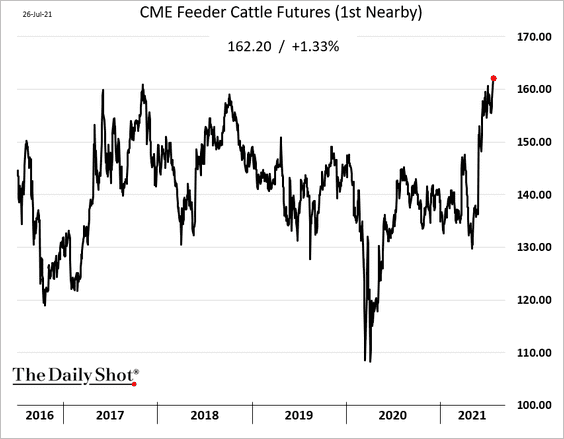
2. CME feeder cattle future hit a multi-year high amid tight supplies.
 Source: Reuters Read full article
——————–
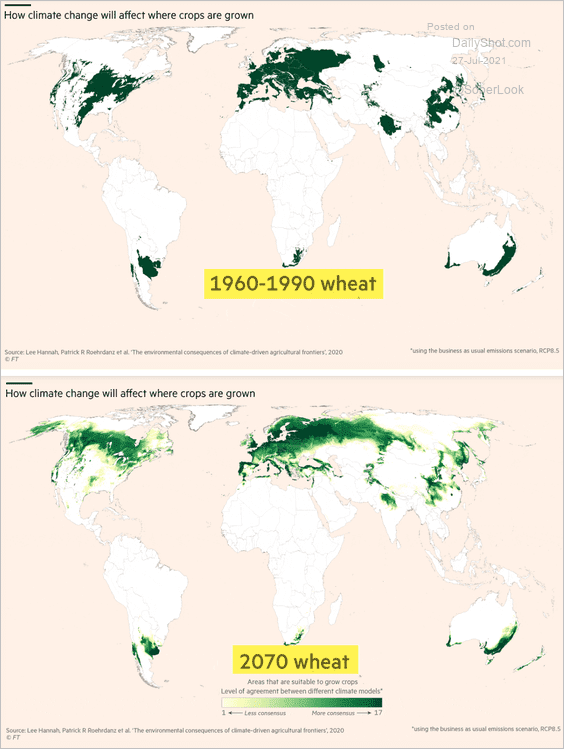
3. How will climate change impact where wheat crops are grown?
 Source: @financialtimes Read full article
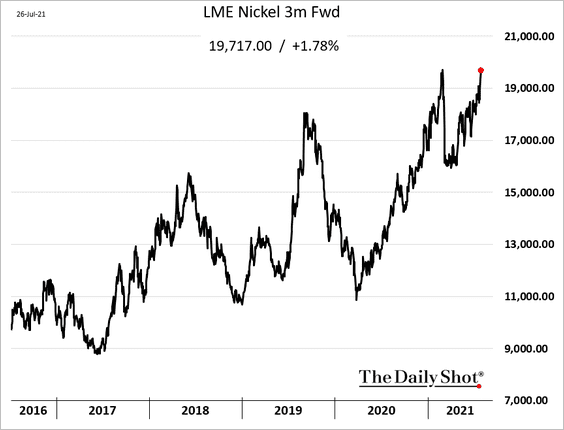
4. Nickel prices are nearing multi-year highs.
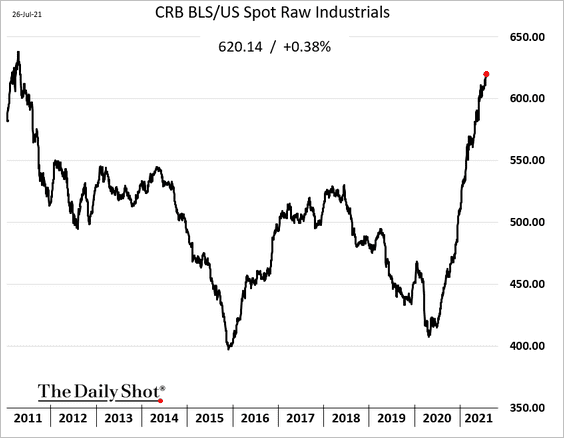
5. Here is the CRB raw industrial commodities index.
6. China’s steel production is moderating.
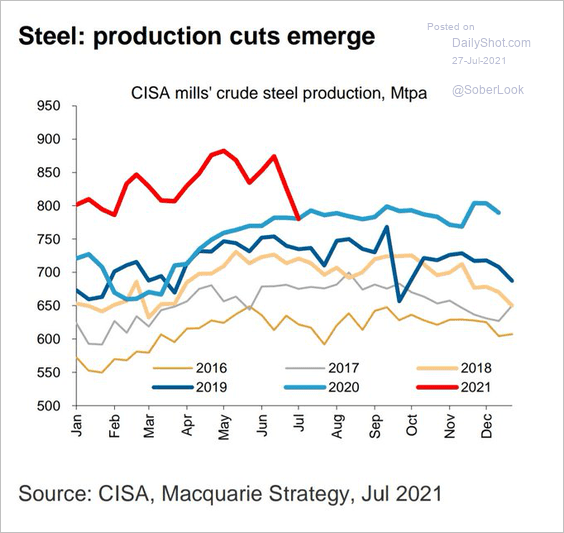 Source: Macquarie; @Scutty
Back to Index
Equities
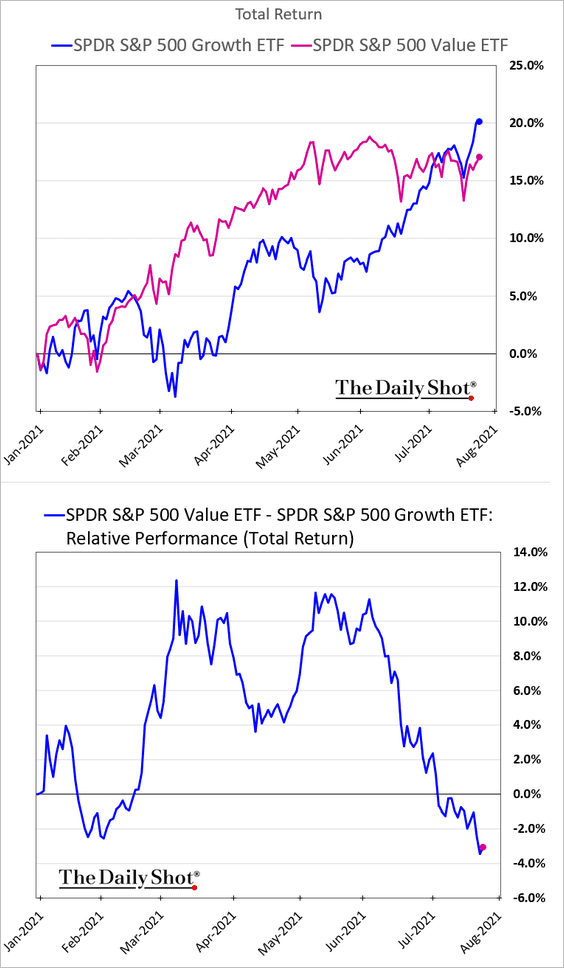
1. Growth stocks continue to outperform value.
2. This uninterrupted bull market stands out relative to other rallies.
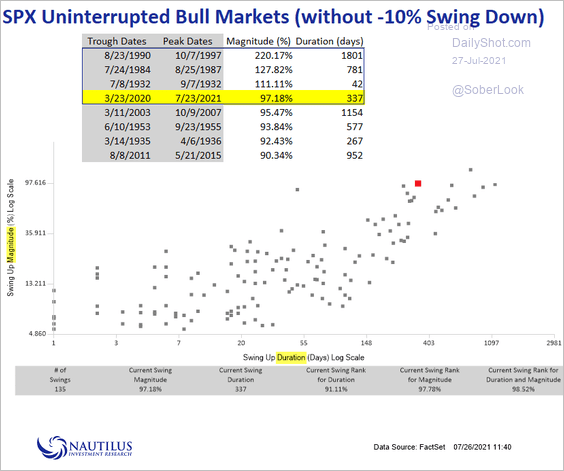 Source: @NautilusCap
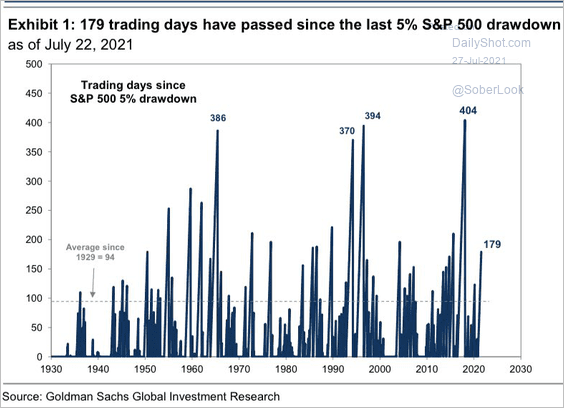 Source: Goldman Sachs; @Schuldensuehner
——————–
3. How do the current forward earnings compare to the dot-com rally?
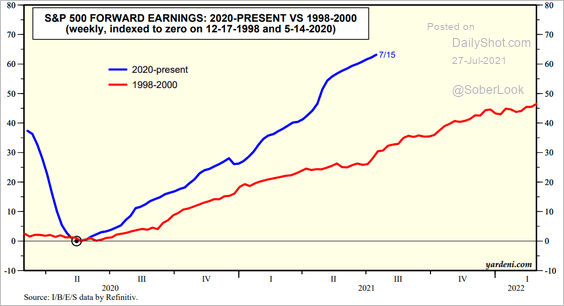 Source: Yardeni Research
4. The price-to-sales (expectations) ratio continues to climb.
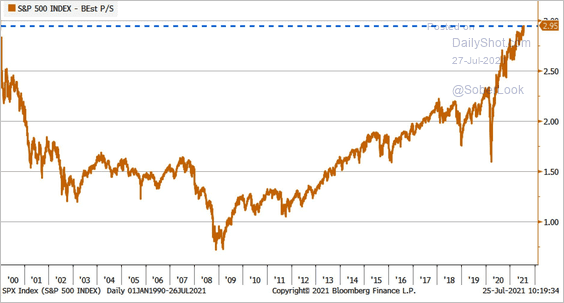 Source: @LizAnnSonders
5. This chart shows forward earnings per share for large-, mid-, and small-cap stocks since 2009.
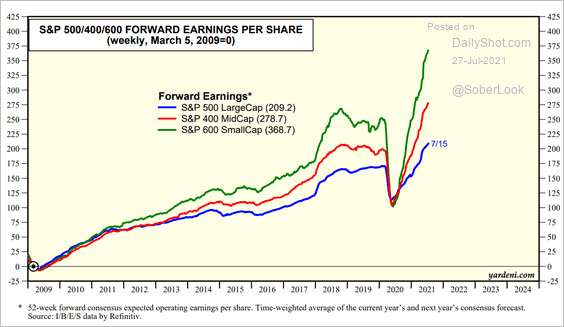 Source: Yardeni Research
6. Tech valuations relative to the S&P 500 have risen, while earnings momentum has weakened.
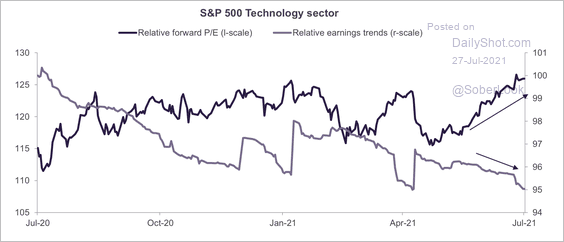 Source: Truist Advisory Services
The tech mega-caps’ market value is now above $10 trillion.
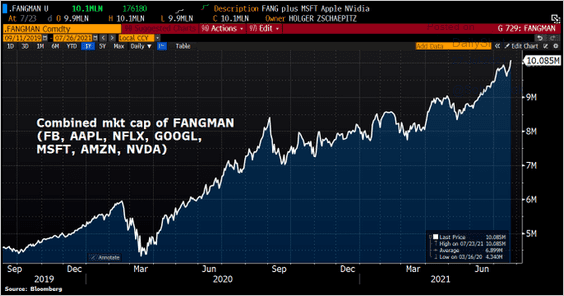 Source: @Schuldensuehner
——————–
7. The large-cap valuation premium hasn’t been this high in two decades.
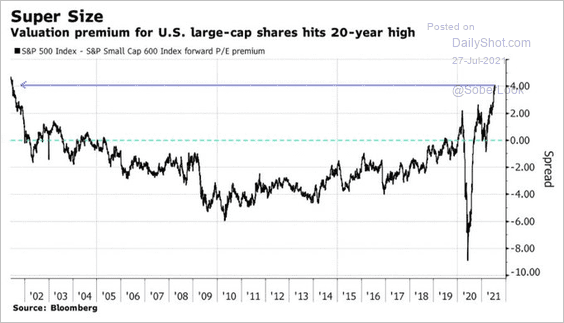 Source: @C_Barraud
8. Short interest in the Russell 2000 ETF has risen in recent months.
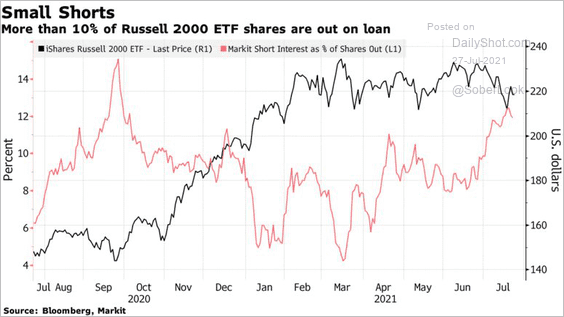 Source: @markets Read full article
Small-cap ETF outflows are at an extreme.
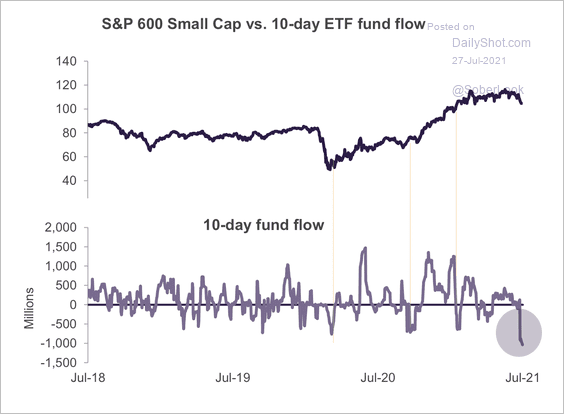 Source: Truist Advisory Services
——————–
9. Q2 earnings have been beating expectations across all sectors.
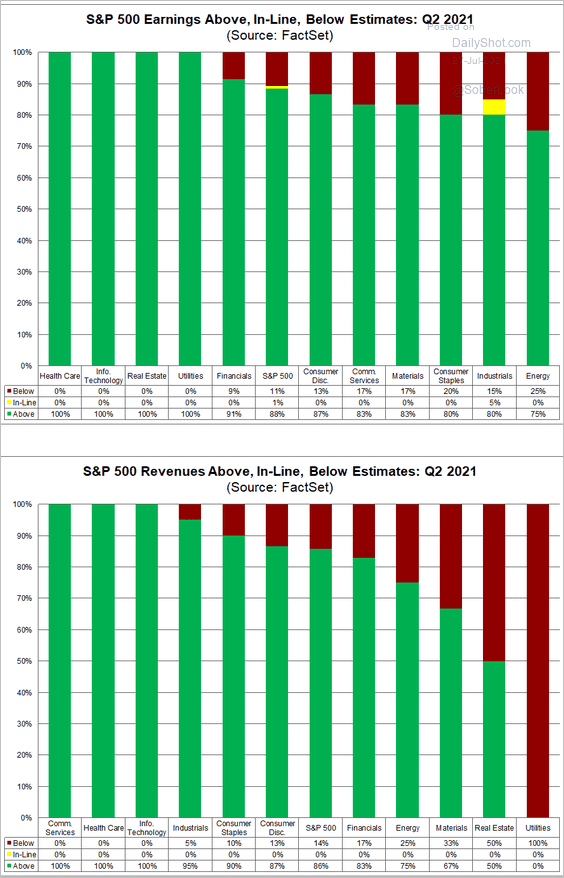 Source: @FactSet Read full article
Back to Index
Credit
1. Let’s start with US bond returns by rating.
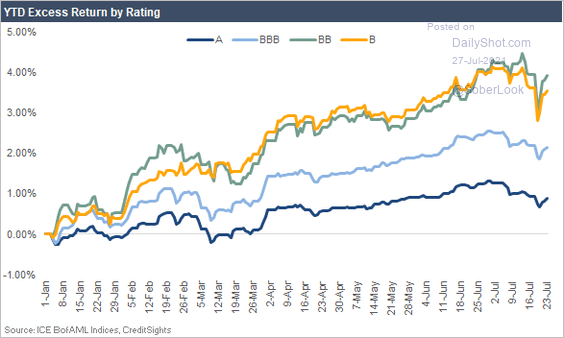 Source: CreditSights
2. The average spread on the US investment-grade corporate bond index is only slightly below the 1973 median but is at the tightest level since the mid-1990s.
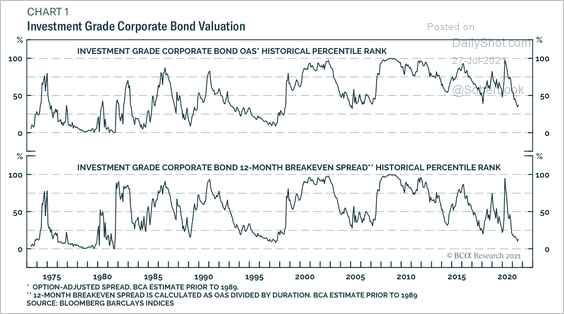 Source: BCA Research
Here is a look at investment-grade sector valuations.
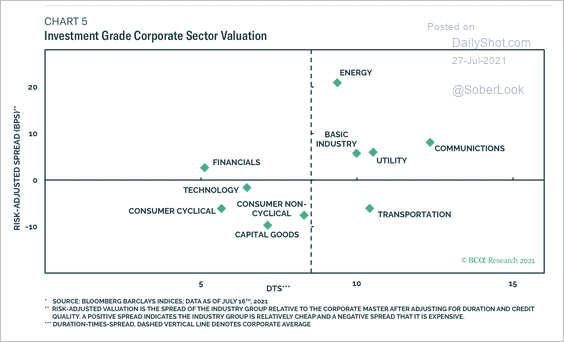 Source: BCA Research
——————–
3. Covenant-lite leverage loans continue to dominate the market.
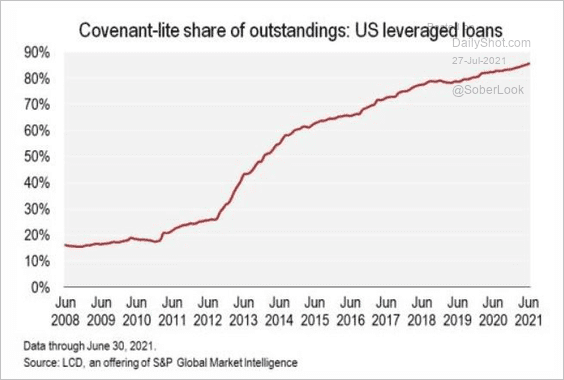 Source: @lcdnews Read full article
4. Investors are still willing to pay for actively managed bond funds.
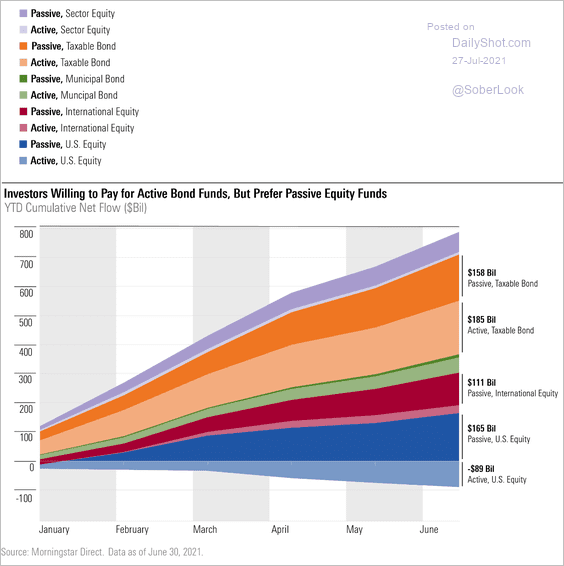 Source: Morningstar Read full article
Back to Index
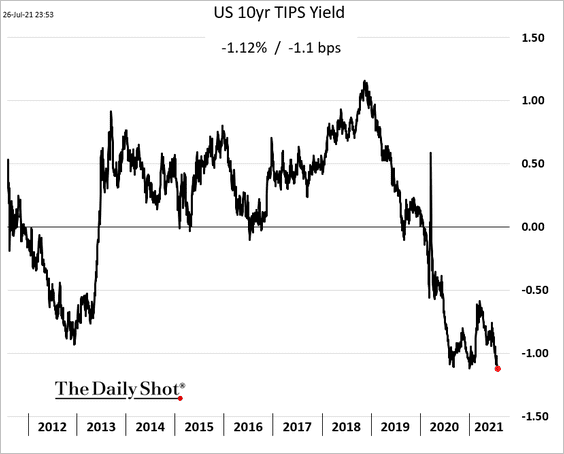
Rates
The 10yr TIPS yield (US real rates) hit a record low.
Back to Index
Global Developments
1. Chip lead times continue to climb.
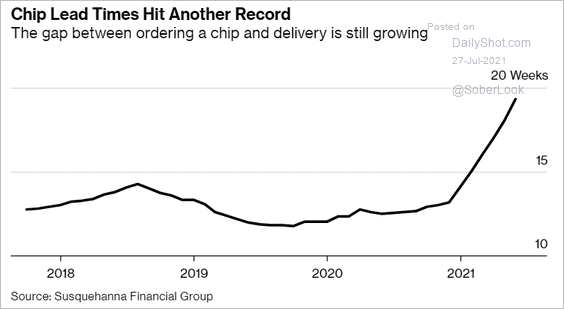 Source: Bloomberg Read full article
2. Corporate cash balances surged last year.
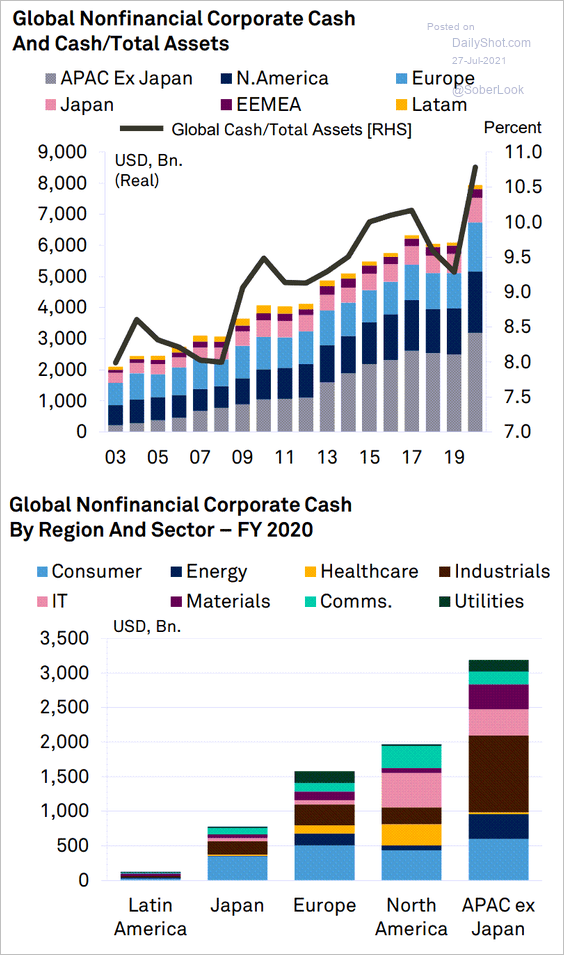 Source: S&P Global Ratings
3. Here is a look at the COVID situation.
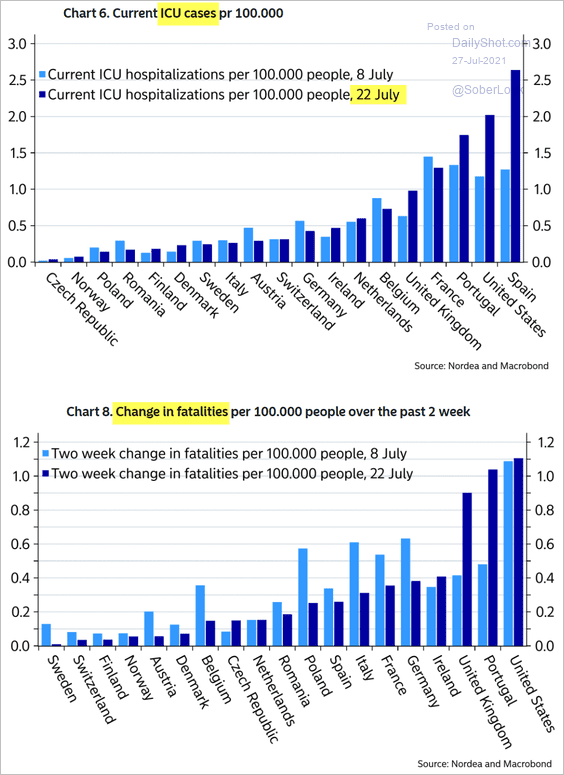 Source: Nordea Markets
Back to Index
Food for Thought
1. Tesla’s net income:
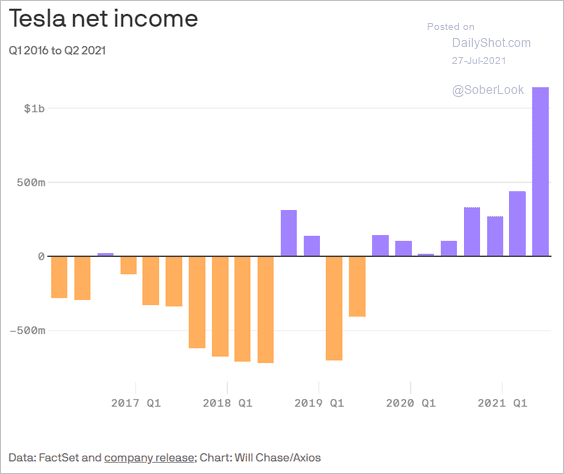 Source: @axios Read full article
2. The “periodic table” of investment asset classes:
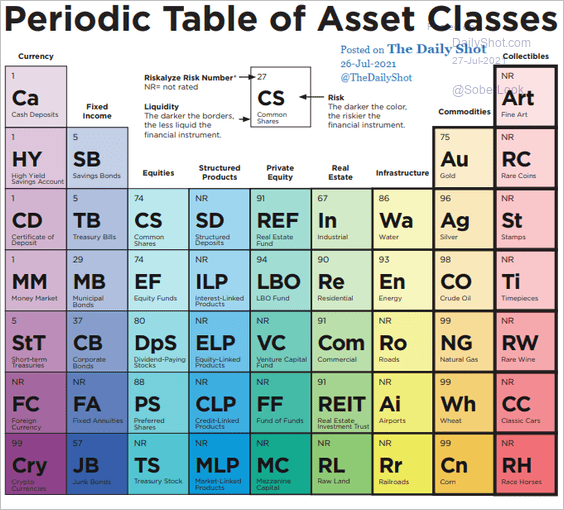 Source: Wealthmanagement.com, h/t Atchuthan Srirangan Read full article
3. US concerns about paying for housing:
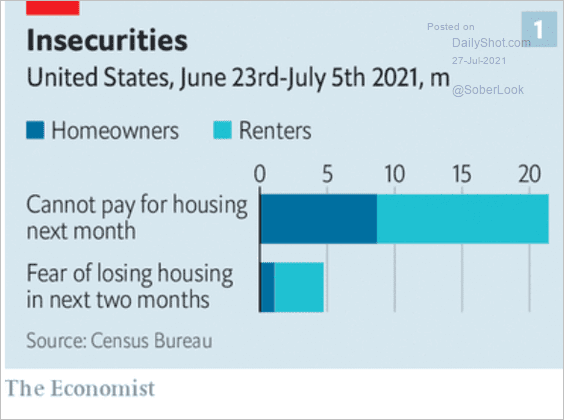 Source: @adam_tooze; The Economist Read full article
4. Declining US business investment (part of the reason for supply-chain bottlenecks):
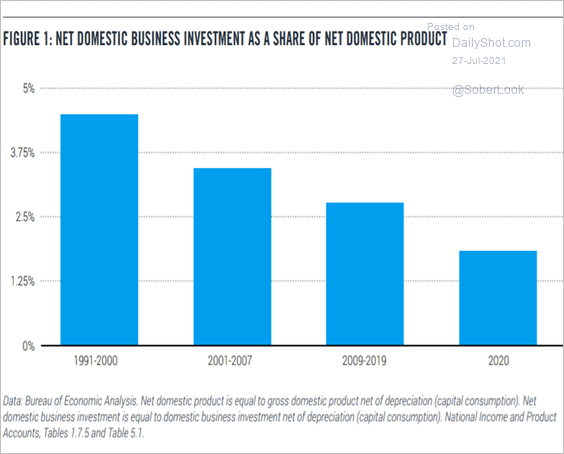 Source: PPI Read full article
5. Territorial control of Afghanistan:
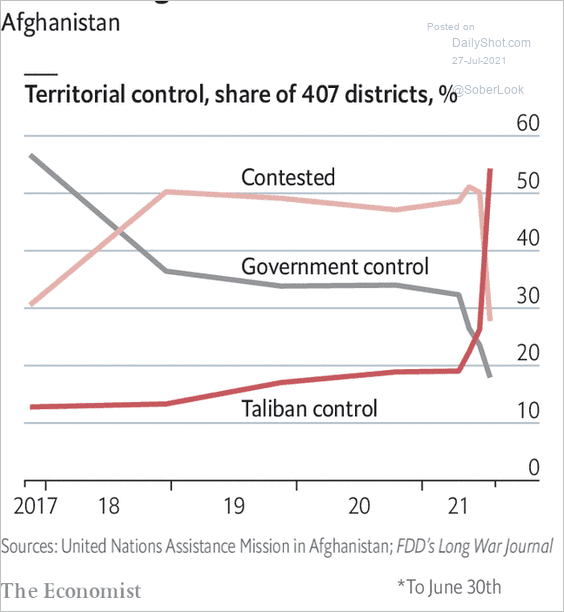 Source: The Economist Read full article
6. COVID hot spots:
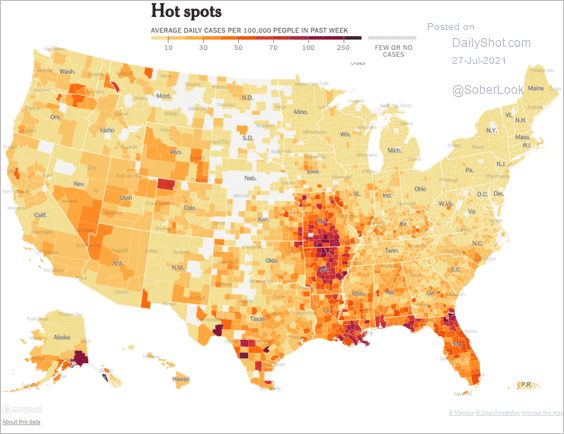 Source: The New York Times; h/t @HTLasVegas, @rcgeconomics Read full article
7. High vaccination rates among US seniors:
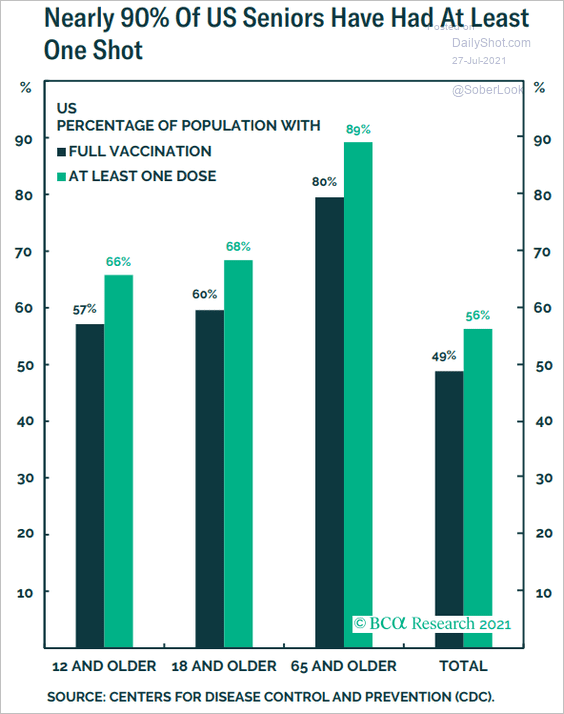 Source: BCA Research
8. Vaccine recognition for cross-border travel:
 Source: The Economist Read full article
9. Medicaid enrollment during COVID:
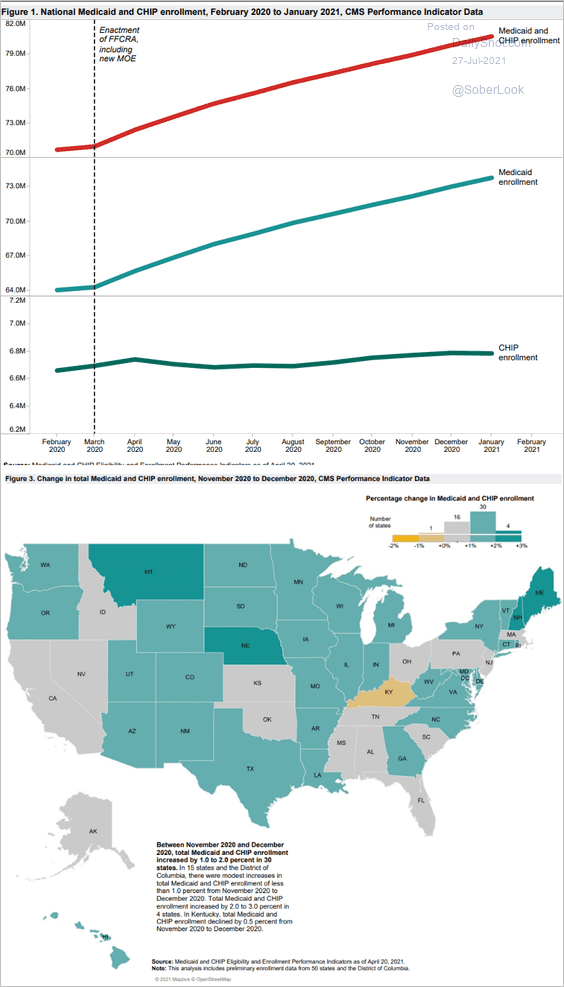 Source: Center for Medicaid and CHIP Services Read full article
10. The number of US athletes in the Tokyo Olympics per million of the population in their home states:
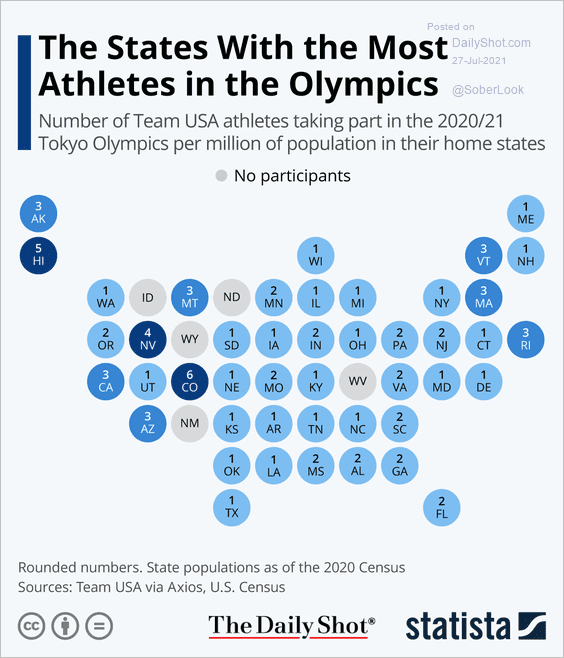 Source: Statista
——————–
Back to Index