
The Daily Shot: 28-Sep-21
• Energy
• Equities
• Credit
• Rates
• Commodities
• Cryptocurrency
• Emerging Markets
• China
• Asia – Pacific
• The Eurozone
• The United States
• Global Developments
• Food for Thought
Energy
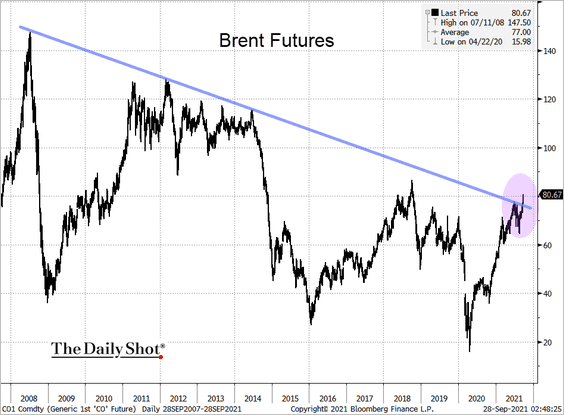
1. Brent crude broke through its long-term downtrend resistance and is trading above $80/bbl.
 Source: @TheTerminal, Bloomberg Finance L.P.
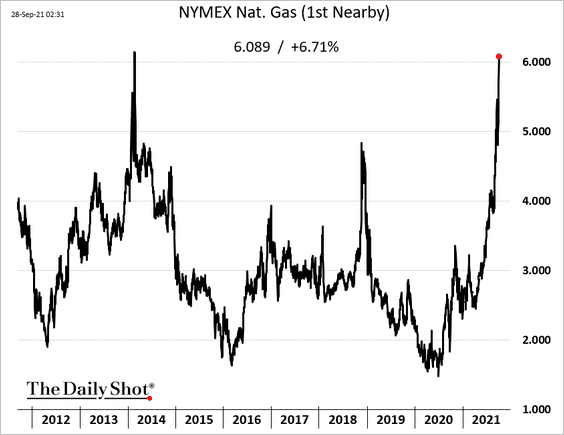
2. US natural gas futures are trading above $6/mmbtu and about to take out the 2014 peak.
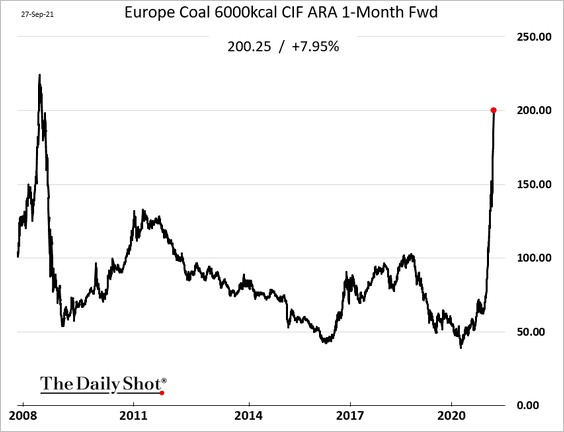
3. Natural gas prices keep surging in Europe, …
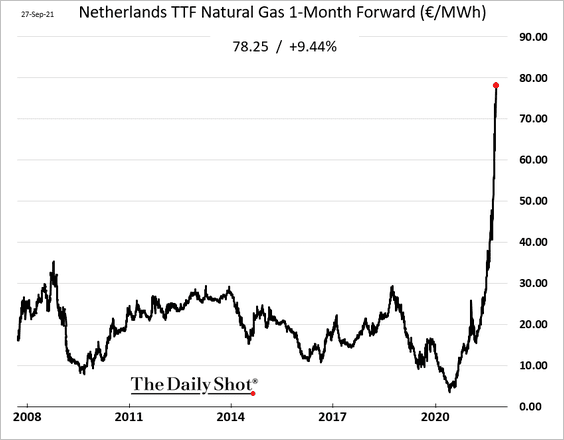
… driving up coal prices.
——————–
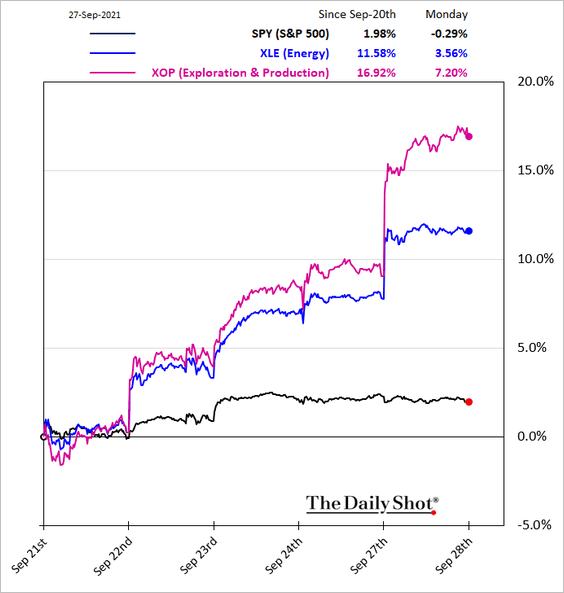
4. Energy shares continued to rally on Monday.
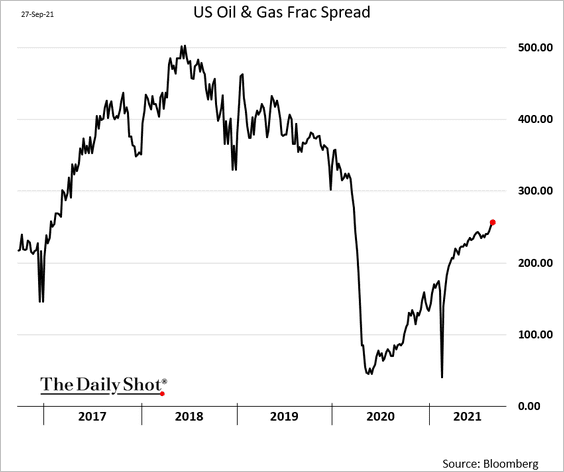
5. US frac spread count picked up momentum as prices surge.
6. The path to net-zero emissions may have severe adverse implications for energy security – more concentrated oil supply, dependence on critical minerals for renewable energy, and of course, a more variable energy supply.
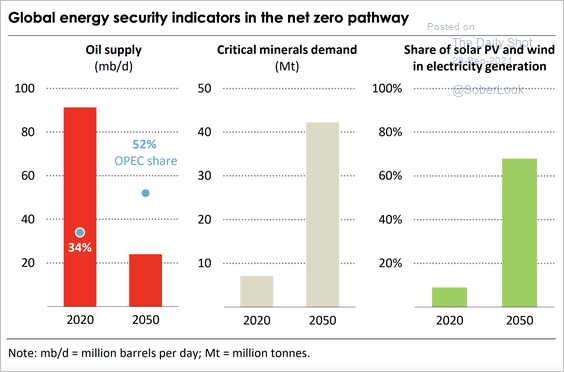 Source: IEA
IEA estimates that in a net-zero emissions scenario (NZE), we will see a decline in demand for oil, gas, and coal. Oil demand never returns to the 2019 peak.
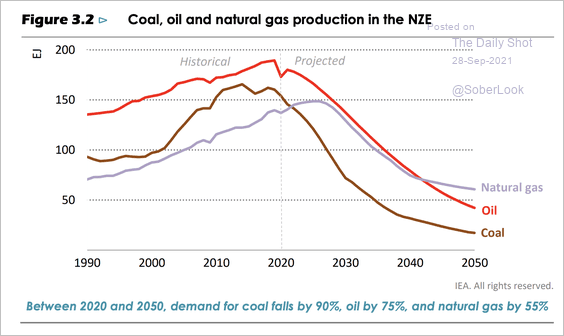 Source: IEA
Back to Index
Equities
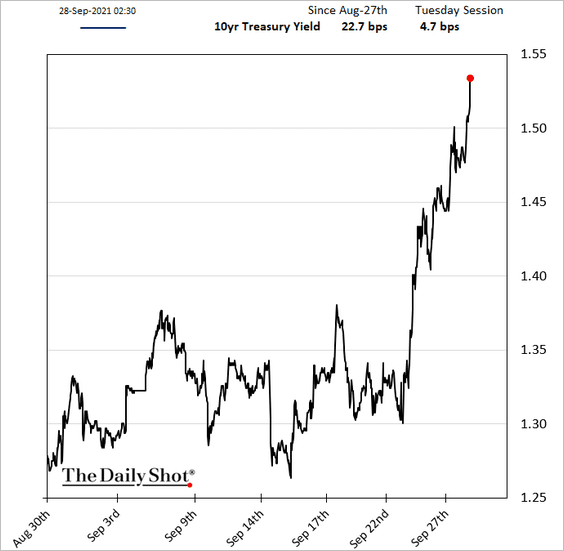
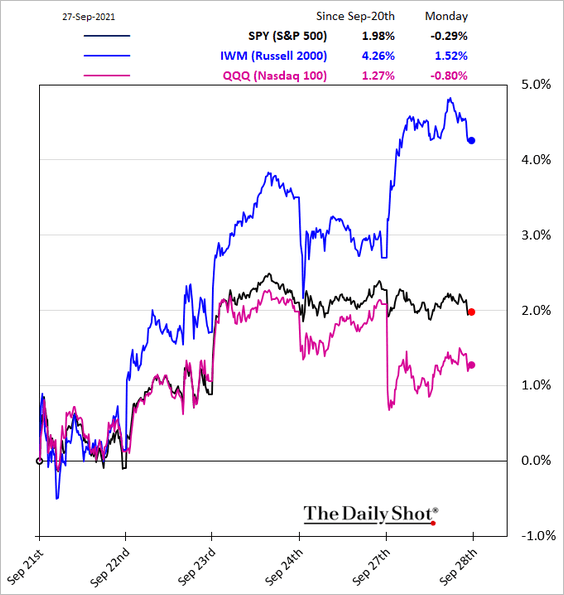
1. Bond yields are rising globally, which tends to put pressure on growth stocks.
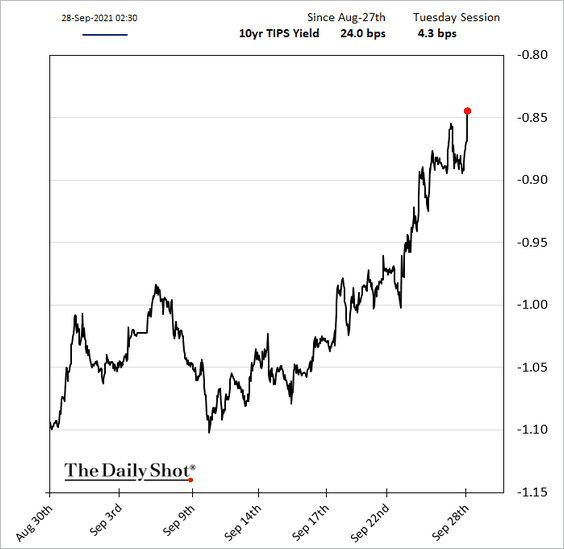
US real yields are also up sharply over the past couple of weeks.
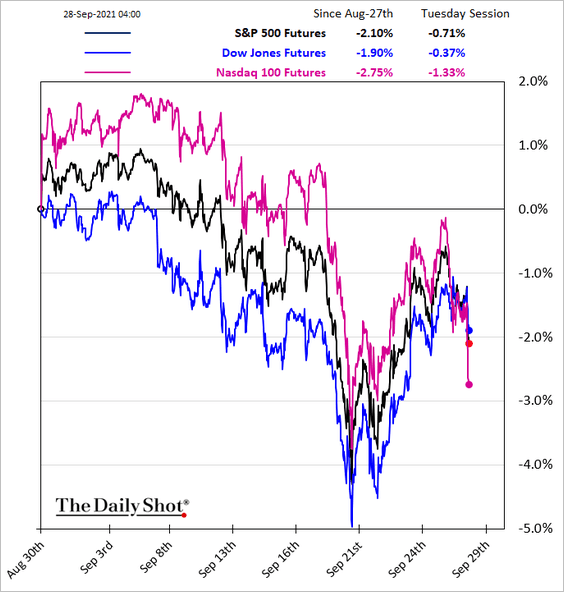
• With yields on the rise, the Nasdaq 100 futures slumped this morning, underperforming the S&P 500.
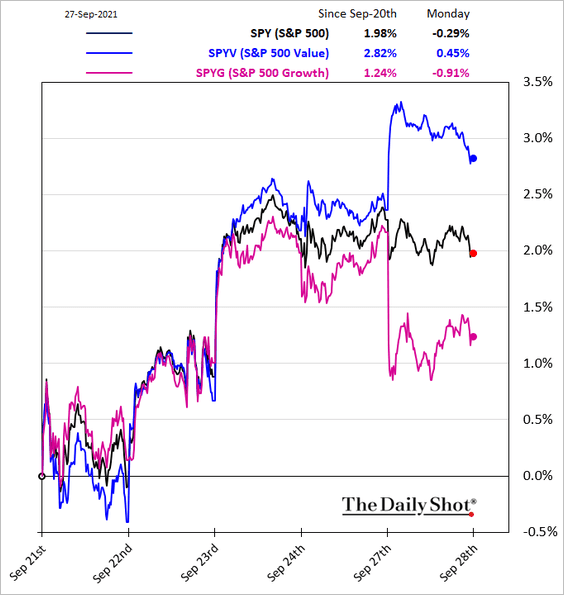
• Growth and value stocks diverged on Monday.
• Small caps outperformed.
——————–
2. Financials are benefitting from higher yields.
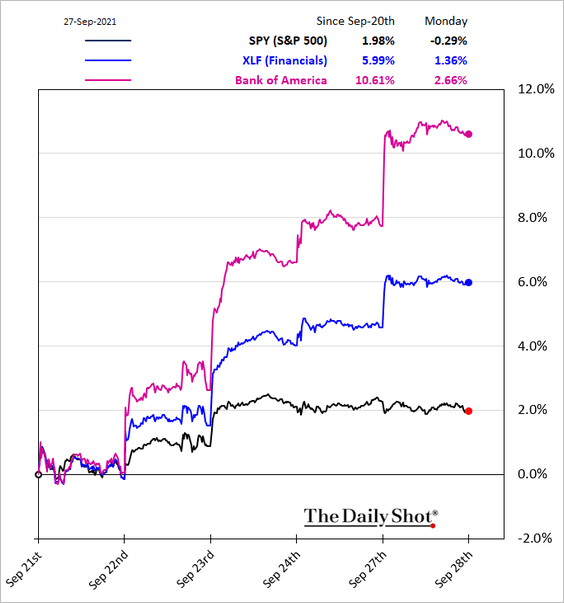
More outperformance ahead?
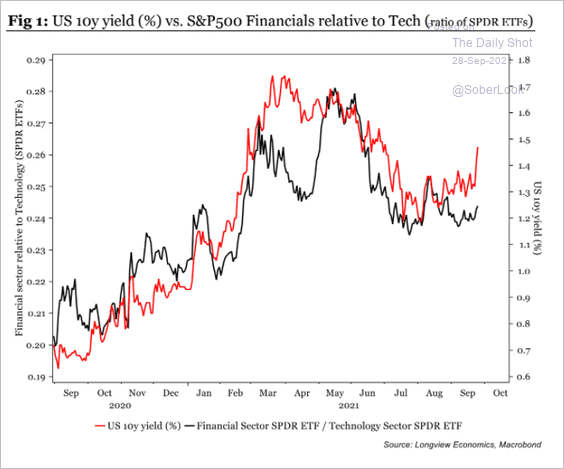 Source: Longview Economics
——————–
3. Rate-sensitive stocks such as utilities and REITs sold off.
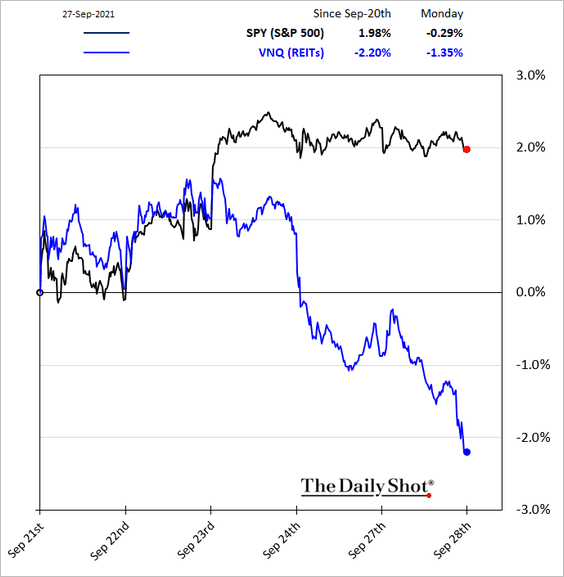
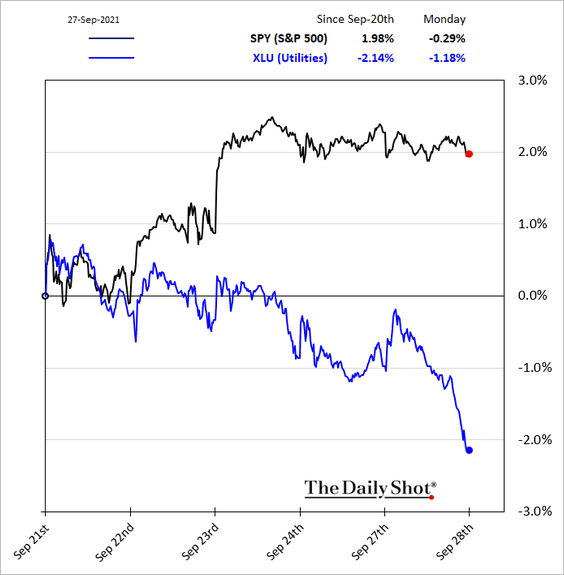
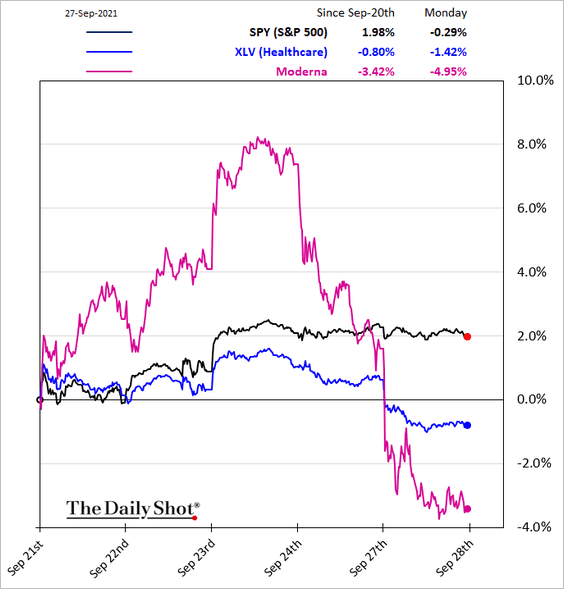
Here are a few other sector trends.
• Healthcare:
• Transportation:
![]()
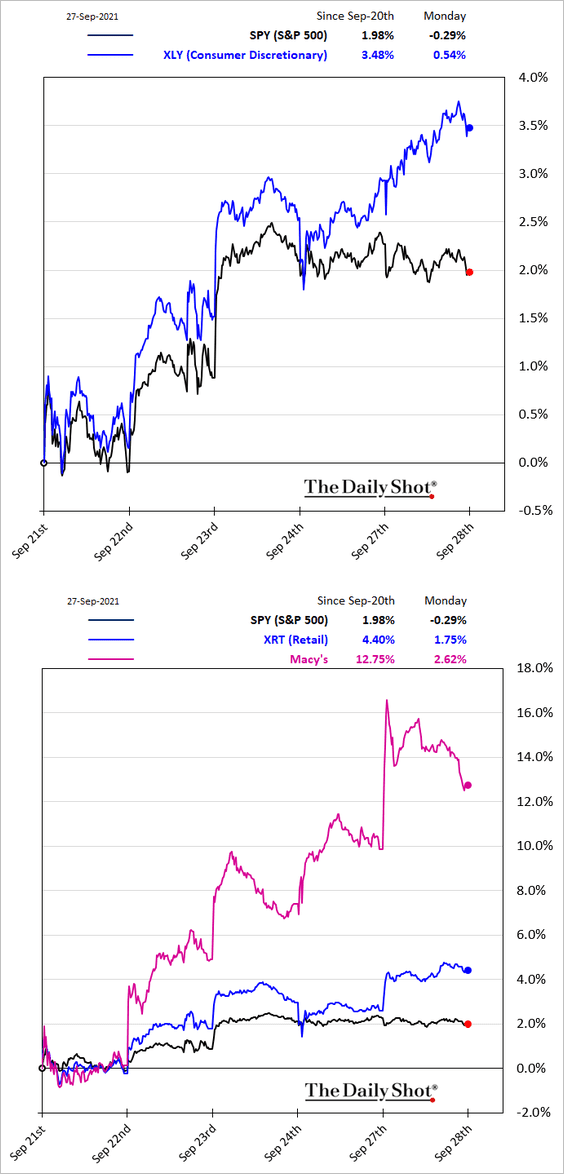
• Consumer discretionary:
——————–
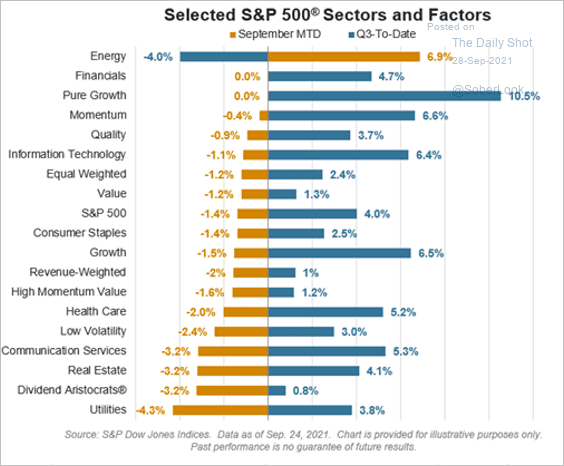
4. Here is the month-to-date and quarter-to-date performance of different sectors and equity factors.
 Source: S&P Global Market Intelligence
5. How do S&P 500 sales and profits compare to 2019?
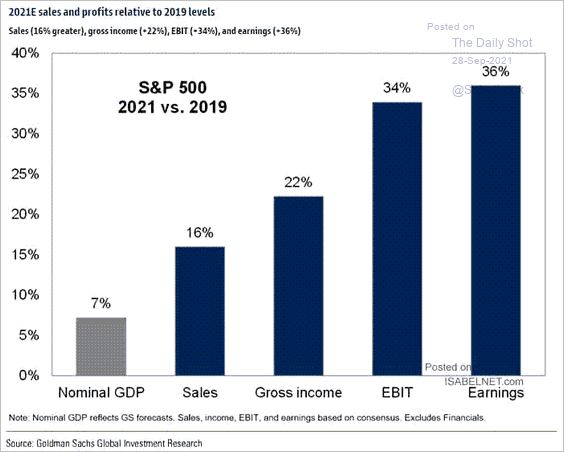 Source: @ISABELNET_SA, @GoldmanSachs
6. Historically, the S&P 500 returned 38x more in November-April versus May-October.
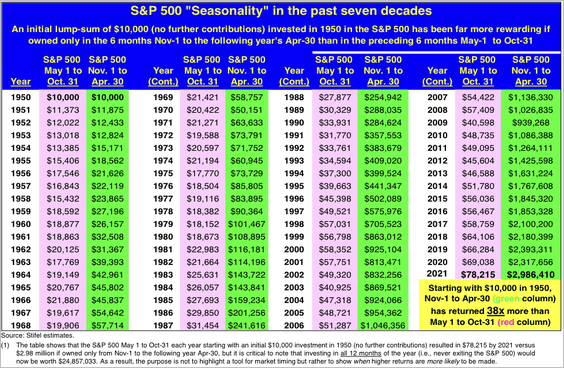 Source: Stifel
7. The S&P 500 appears stretched relative to commodities.
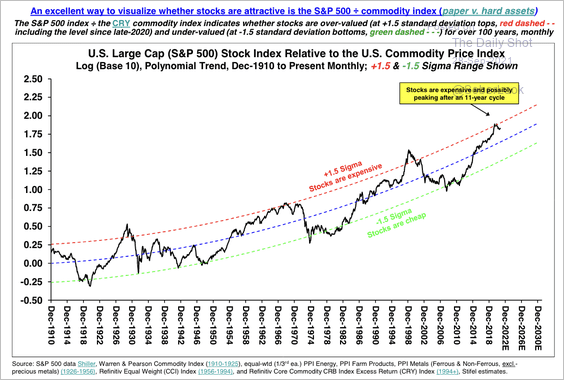 Source: Stifel
8. Most public listings these days use a four-letter ticker symbol.
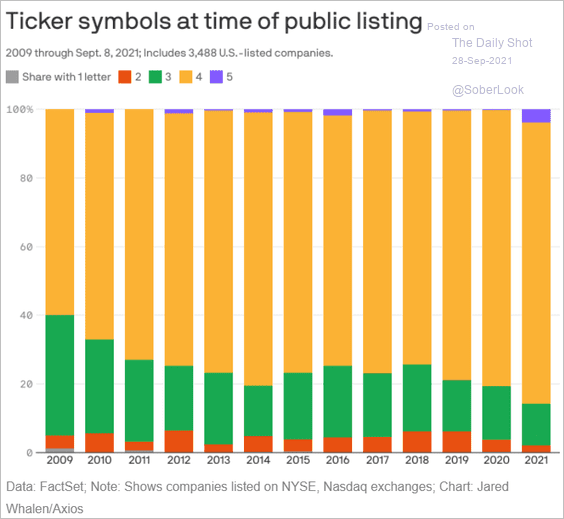 Source: @axios Read full article
Back to Index
Credit
1. It’s been a strong September for loan issuance.
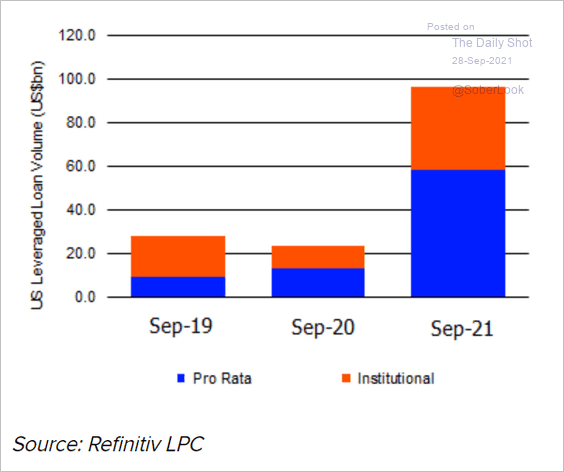 Source: @LPCLoans Read full article
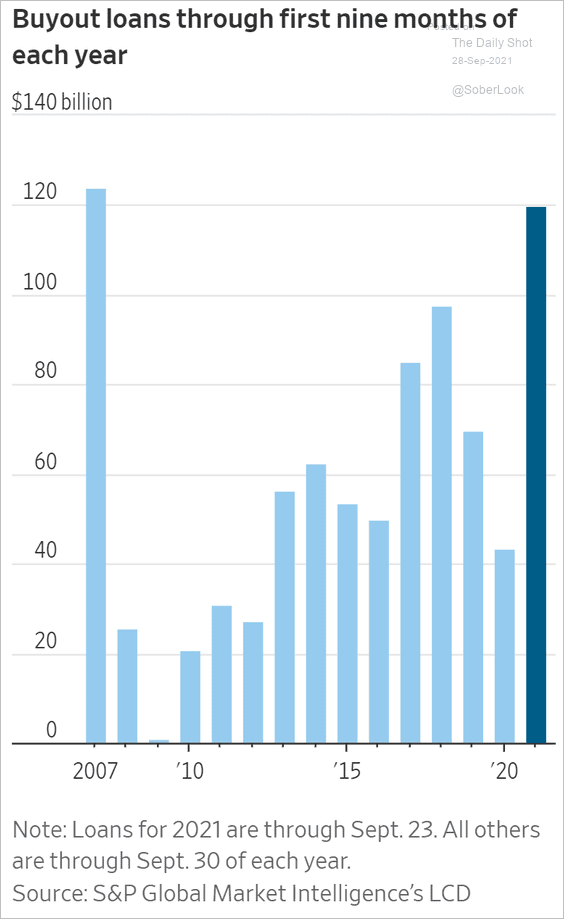
Loan sales for leveraged buyouts surged this year. The $6 billion Medline loan is one of the largest in history (CLO managers are happy).
 Source: @WSJ Read full article
 Source: @markets Read full article
——————–
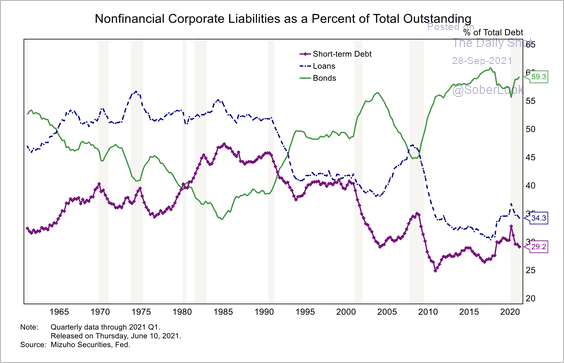
2. Longer-term bonds now account for a greater portion of US non-financial corporate liabilities.
 Source: Mizuho Securities USA
Back to Index
Rates
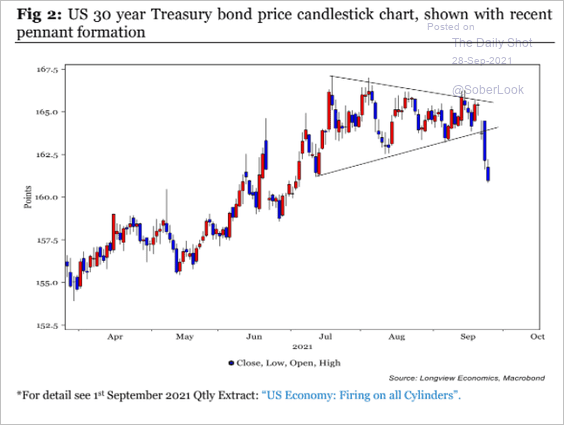
2. The 30yr Treasury price broke to the downside.
 Source: Longview Economics
2. Historic recoveries suggest that yields (10-Year and TIPS) will just trade sideways from here.
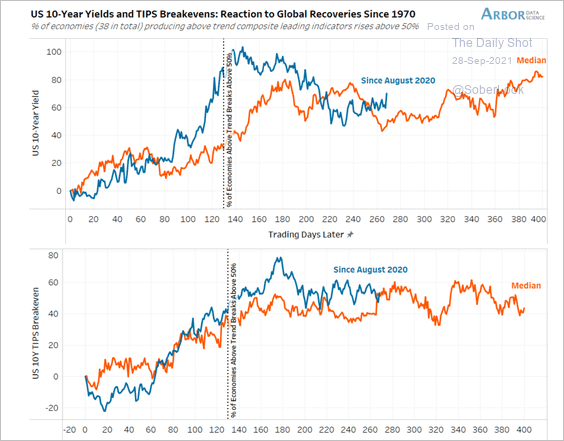 Source: Arbor Research & Trading
Back to Index
Commodities
1. Let’s start with month-to-date performance.
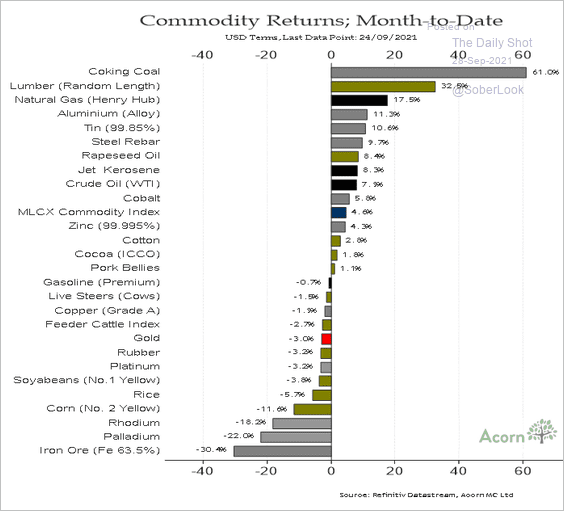 Source: @RichardDias_CFA
2. Commodity ETFs are seeing outflows after months of massive inflows.
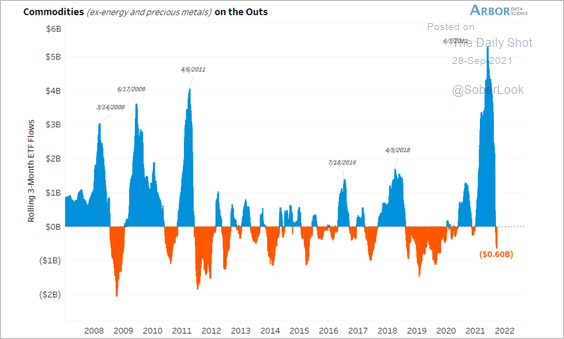 Source: Arbor Research & Trading
3. The grain inventories report from the USDA is expected to show multi-year low stocks for some commodities.
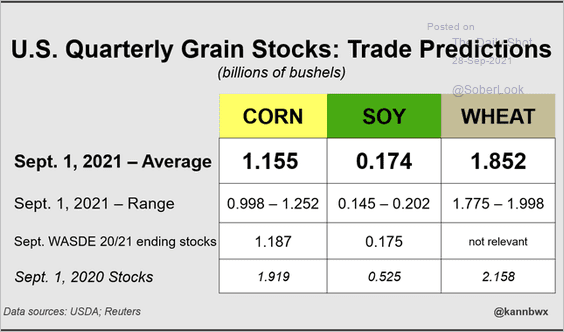 Source: @kannbwx
4. US farmland prices have jumped since the start of the pandemic.
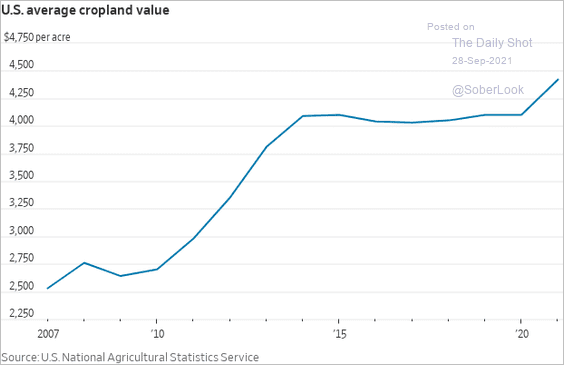 Source: @WSJ Read full article
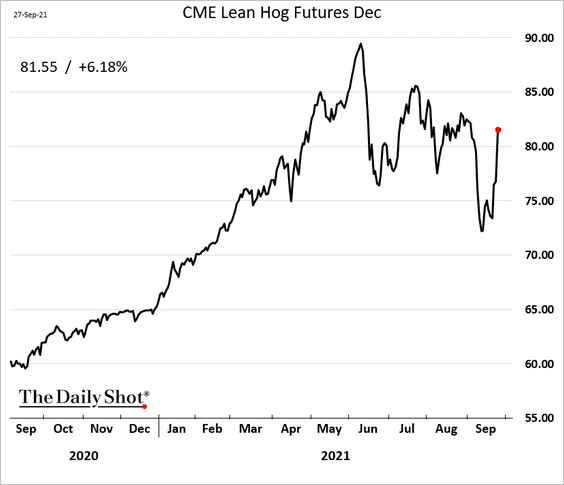
5. US hog prices are rebounding.
Back to Index
Cryptocurrency
1. Some traders have piled into DeFi tokens in the wake of China’s crypto ban.
 Source: CoinDesk Read full article
• DeFi assets continue to surge.
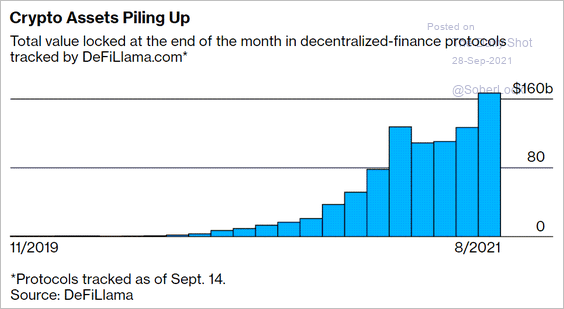 Source: Bloomberg Read full article
• Uniswap’s UNI token, which powers the automated DeFi exchange, had strong trading volumes on Coinbase yesterday.
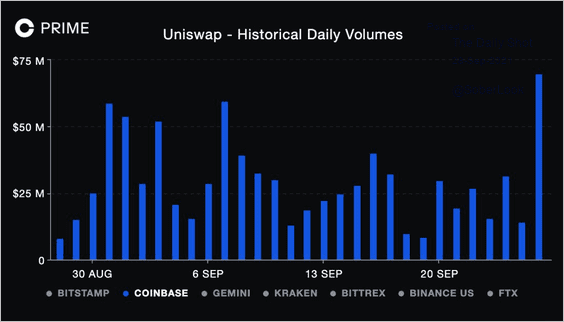 Source: @CoinbaseInsto
By the way, Uniswap is being investigated by the SEC. DeFi is not spared from regulatory crackdowns.
 Source: @WSJ Read full article
——————–
2. Investors pumped $95 million into digital asset products last week, more than double the prior week’s pace.
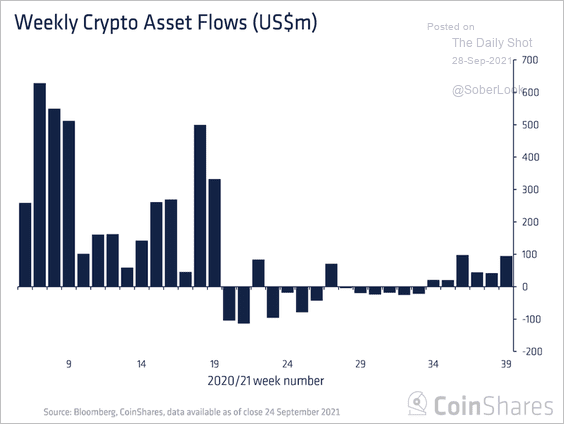 Source: CoinShares Read full article
3. The chart below shows BTC’s market-value-to-realized-value (MVRV) ratio, which suggests the cryptocurrency is trading roughly at its fair value after the May sell-off.
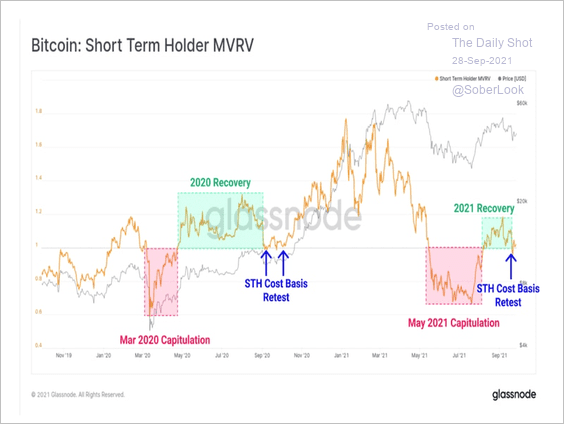 Source: Glassnode Read full article
4. A majority of countries are researching central bank digital currencies.
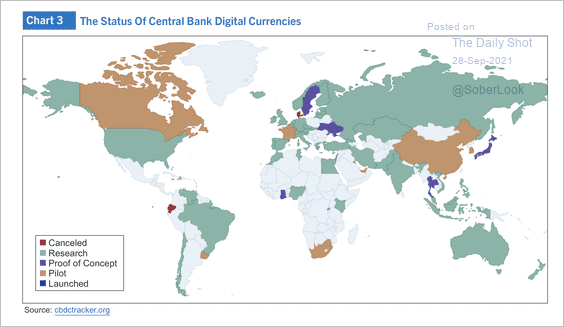 Source: Alpine Macro
 Source: Coinbase Read full article
Back to Index
Emerging Markets
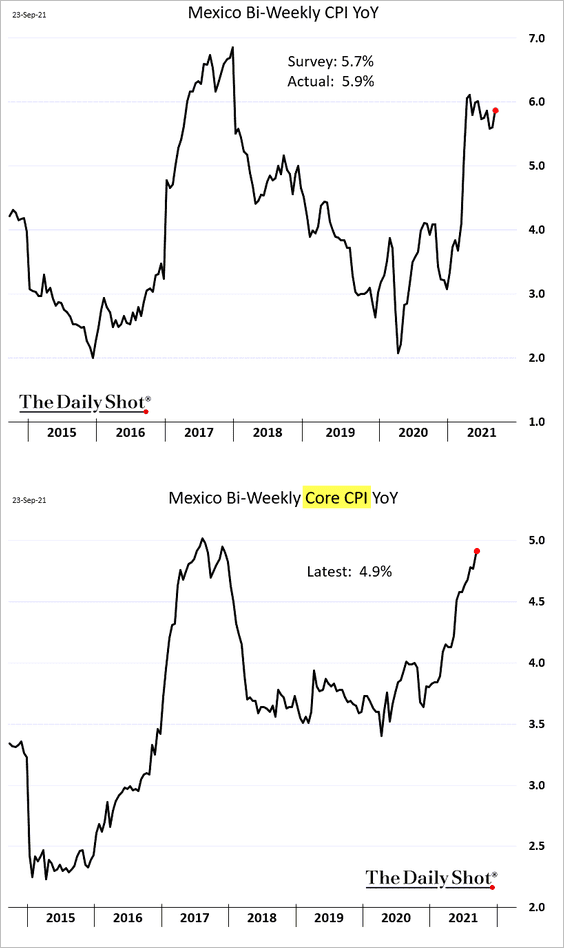
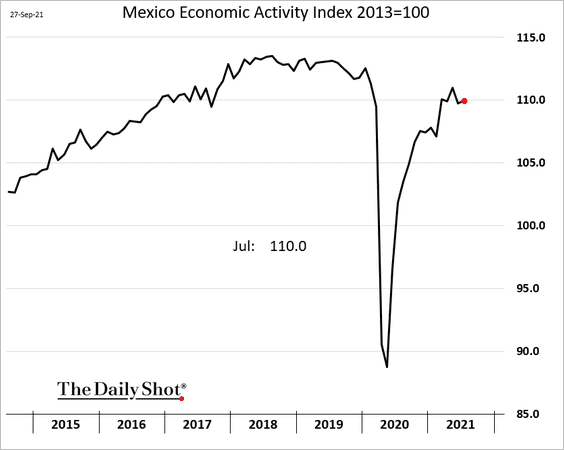
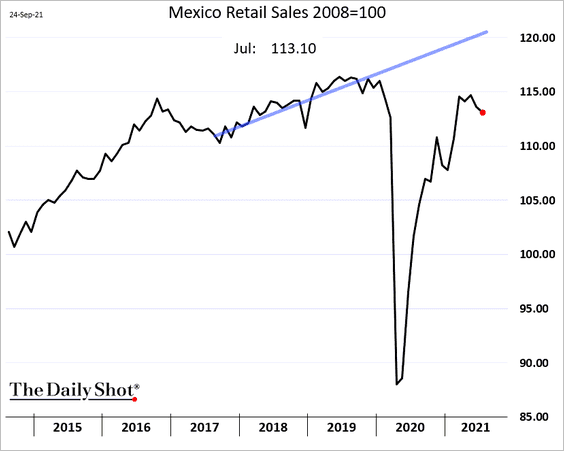
1. Below are some updates on Mexico.
• The core CPI is approaching 5%, with inflation topping forecasts.
• Mexico’s economic activity remains below pre-COVID levels.
• Retail sales declined again in July.
——————–
2. Vietnam’s growth of US import share has slowed.
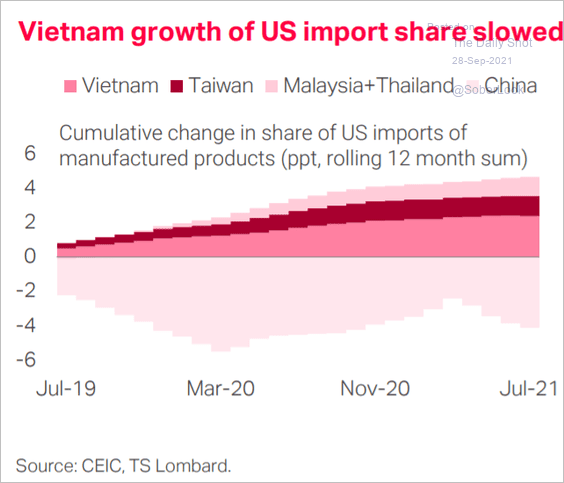 Source: TS Lombard
Back to Index
China
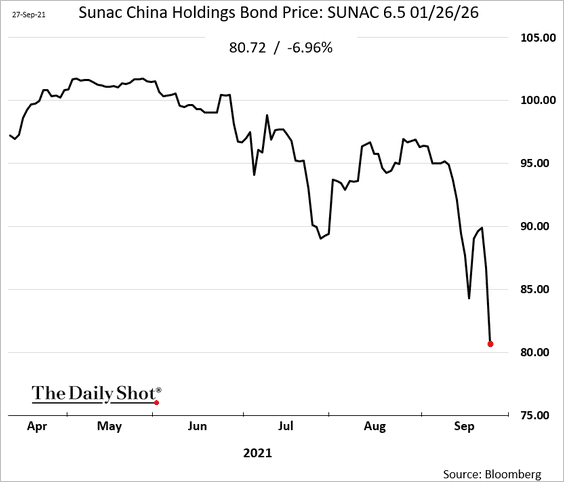
1. Credit risks in the property market are not limited to Evergrande.
 Source: @WSJ Read full article
• The nation’s property market is massive.
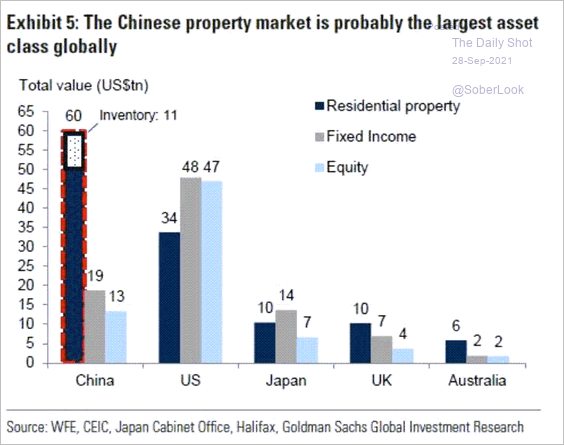 Source: Goldman Sachs; James W.
• Chinese households’ exposure to property is higher than in other economies.
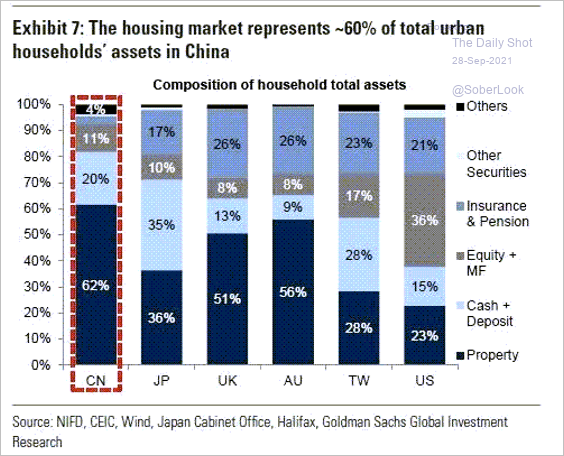 Source: Goldman Sachs; James W.
——————–
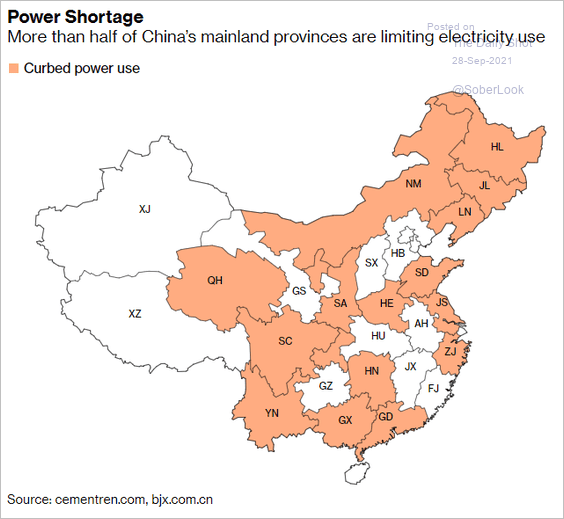
2. China is facing a power crunch, with Beijing pressuring businesses to cut back on electricity usage.
 Source: Reuters Read full article
 Source: @business Read full article
 Source: @markets Read full article
Power-sensitive sectors have underperformed.
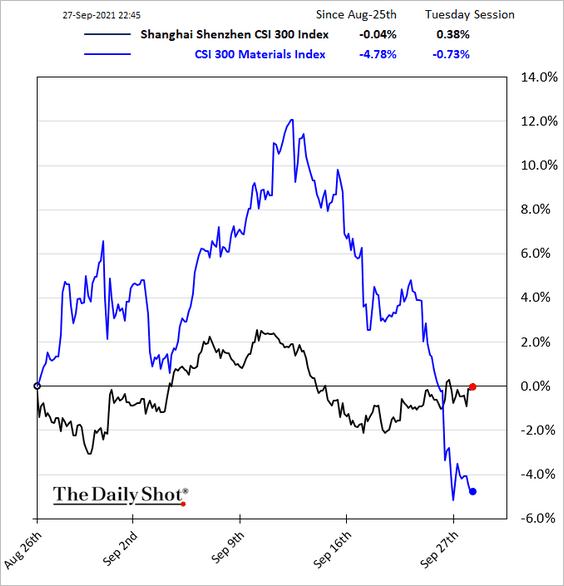 h/t @JeannyYu
——————–
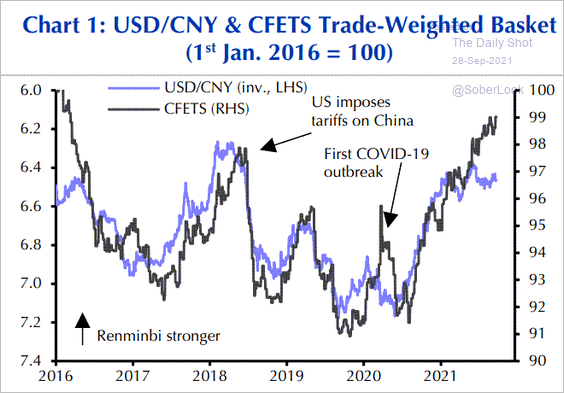
3. The renminbi continues to climb against a basket of currencies. This trend will become a drag on exports.
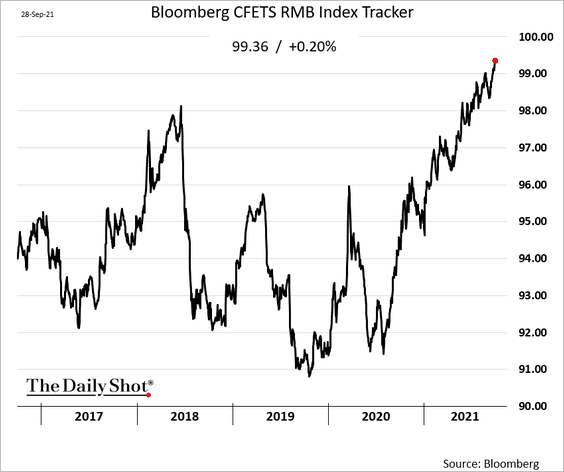
Yuan’s performance against the USD has been lagging since the recent dollar rally.
 Source: Capital Economics
——————–
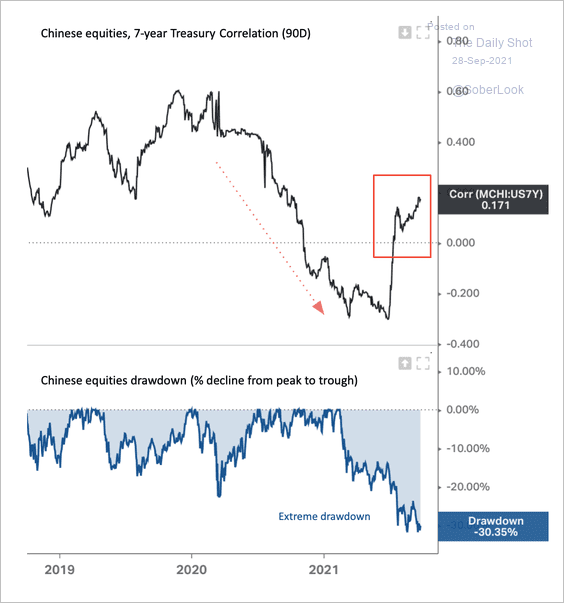
4. The correlation between the iShares MSCI China ETF (MCHI) and Treasury yields turned positive. Is the sell-off overdone given the recent breakout in yields?
 Source: Dantes Outlook; Koyfin
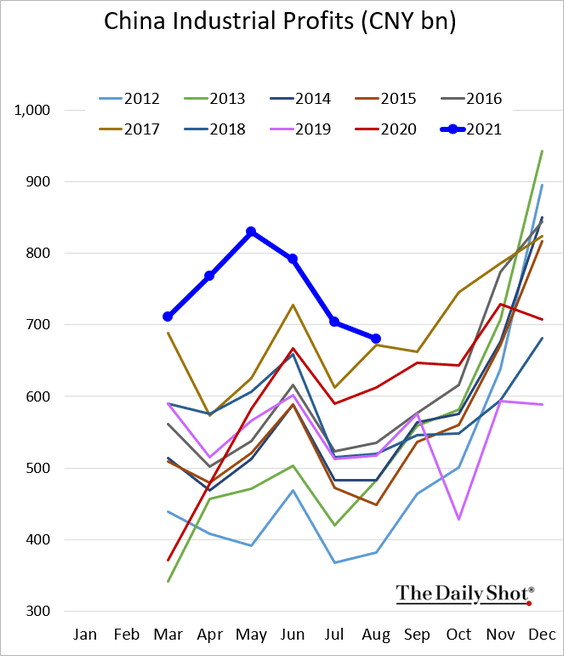
5. Industrial profits softened in August.
Back to Index
Asia – Pacific
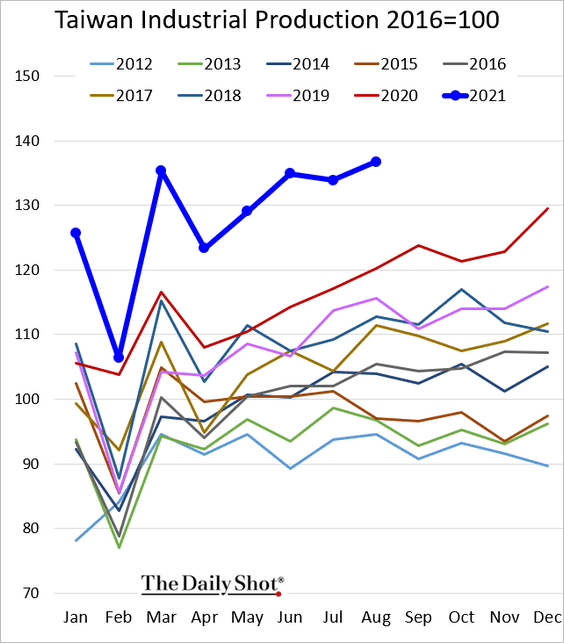
1. Taiwan’s industrial production hit a record high.
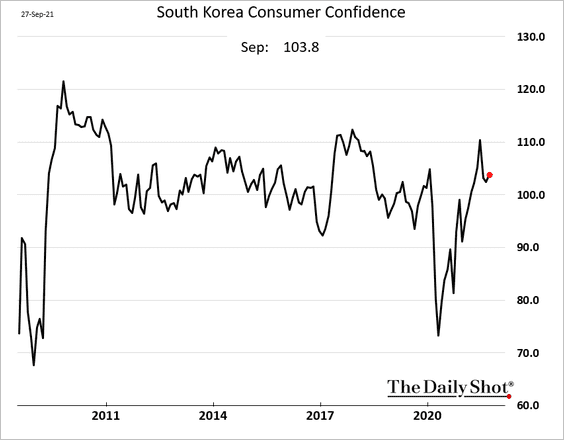
2. South Korea’s consumer confidence is holding up well.
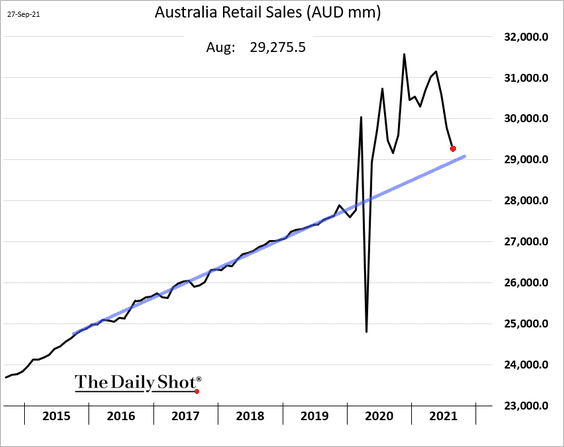
3. Australian retail sales slumped last month, although the decline was less severe than expected.
 Source: MarketWatch Read full article
We are back to the pre-COVID trend.
Back to Index
The Eurozone
1. Business loan growth continues to moderate.
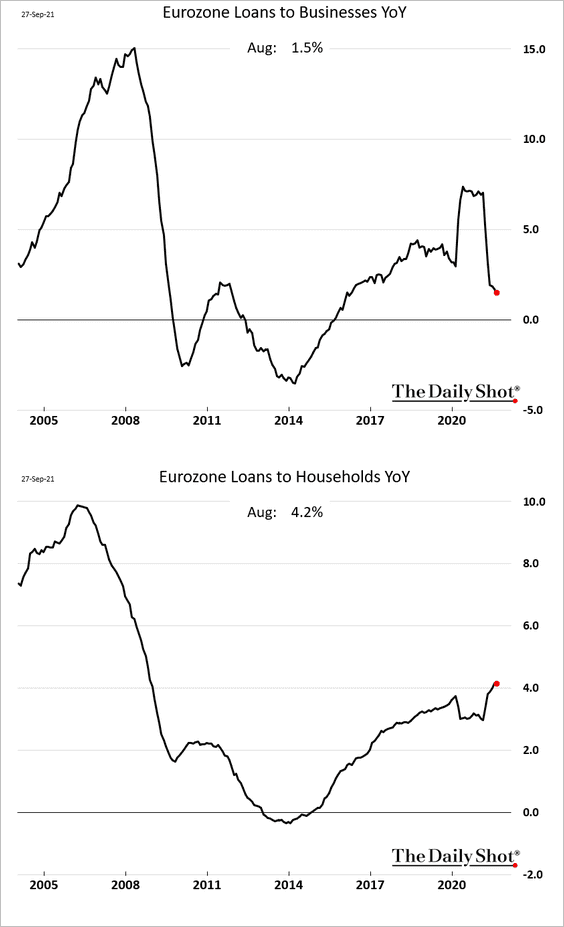
But the broad money supply expansion surprised to the upside.
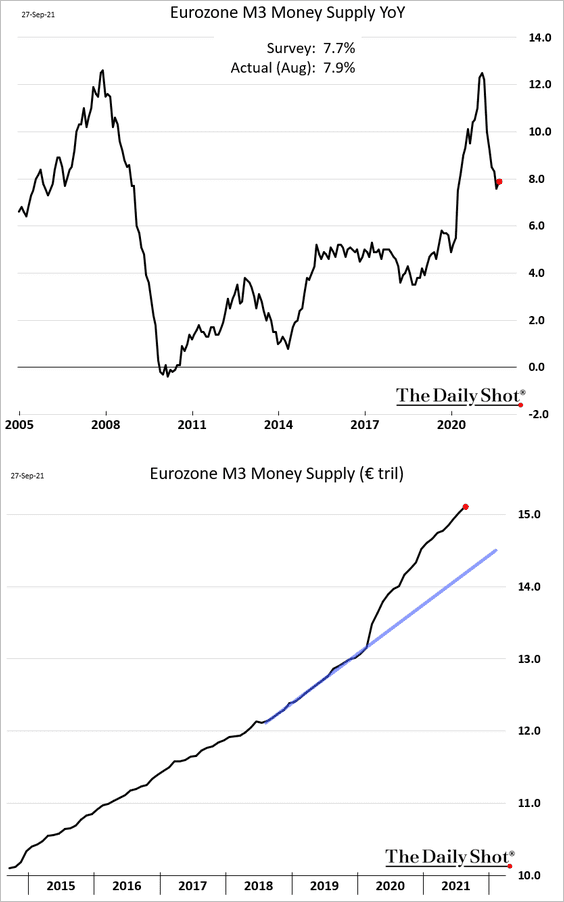
Households are sitting on substantial excess savings.
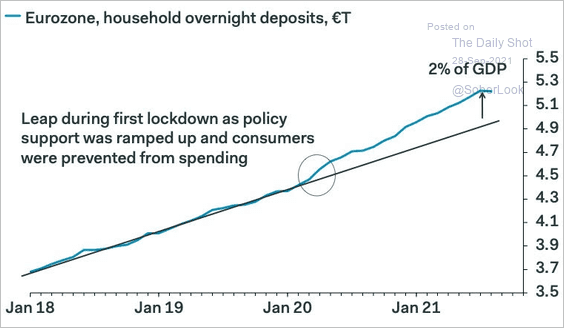 Source: Pantheon Macroeconomics
——————–
2. Inflation has been stronger in the US than in the Eurozone.
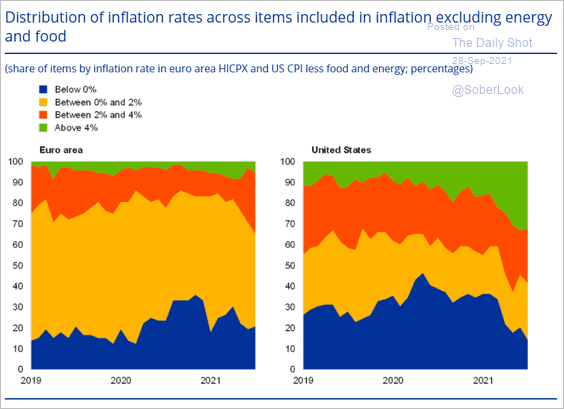 Source: ECB Read full article
But the ECB’s dovish stance in the face of stronger data has led to a rise in market-implied inflation expectations.
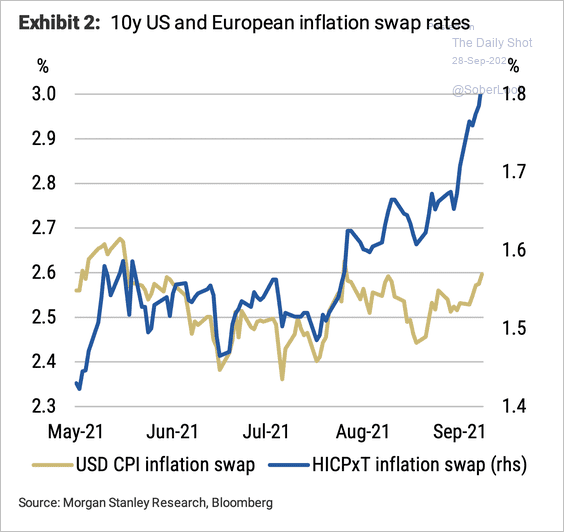 Source: Morgan Stanley Research
——————–
3. Accounting for QE, the level of supply of bonds in Europe will be manageable and well below 2019 levels.
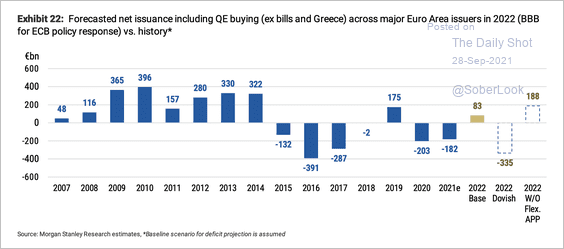 Source: Morgan Stanley Research
4. The TLTRO financing allowed European banks to reduce their funding costs substantially.
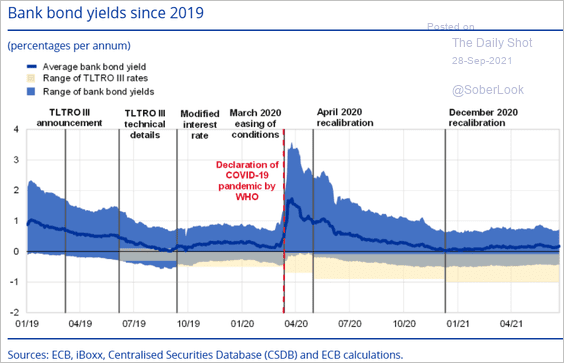 Source: ECB Read full article
Here is the evolution of the ECB’s bank lending operations.
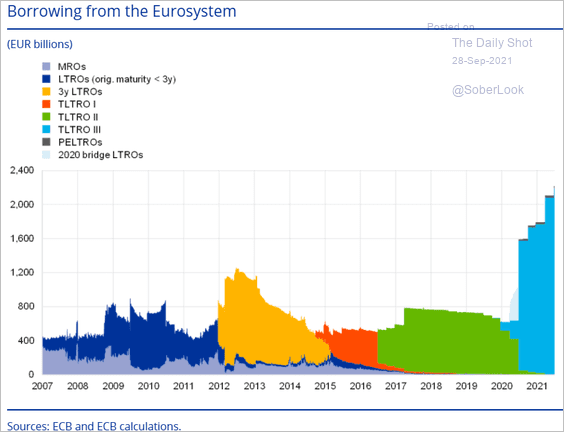 Source: ECB Read full article
——————–
5. Finally we have a couple of charts on German politics.
• Confidence in the national government has been strong.
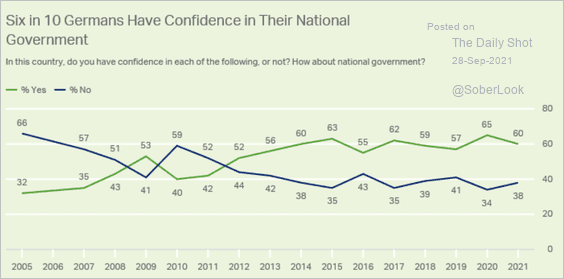 Source: Gallup Read full article
• The biggest SPD gains were among older Germans.
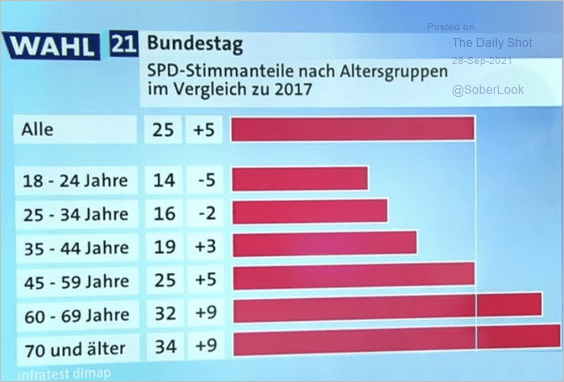 Source: @adam_tooze, @RikeFranke
Back to Index
The United States
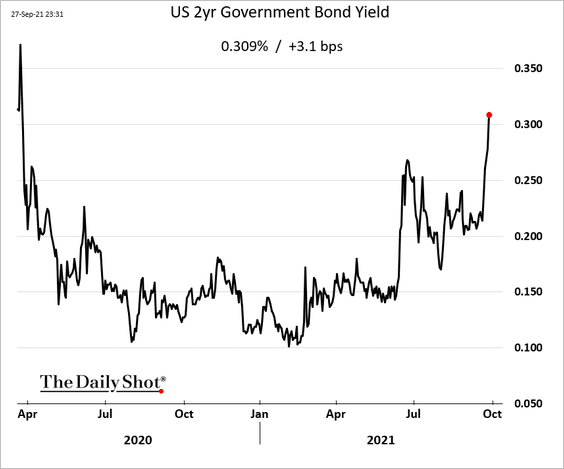
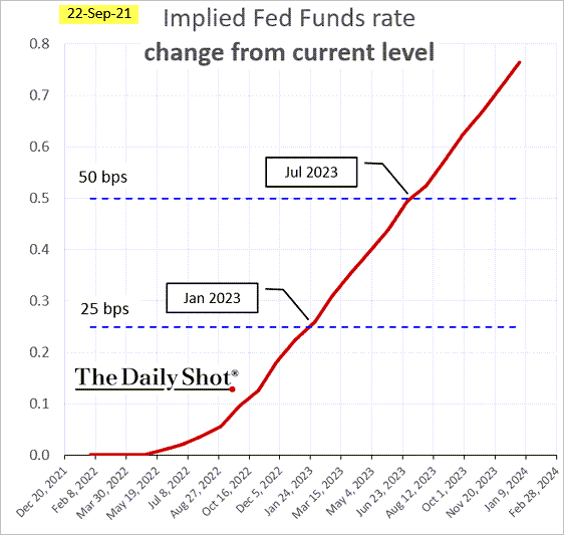
1. The 2yr Treasury yield is up sharply.
Rate hike expectations in 2022 have risen.
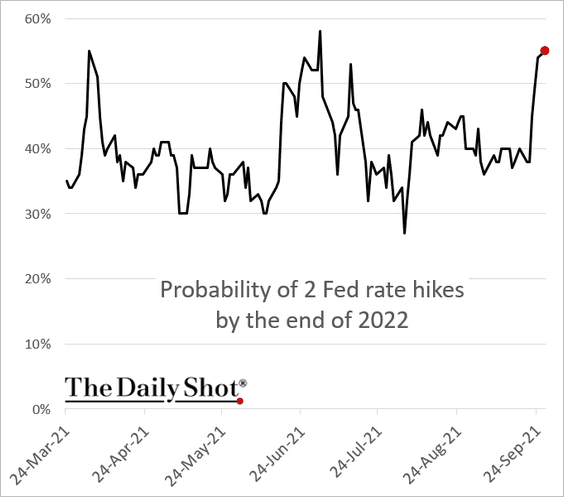
The first hike is now fully priced in for 2022.
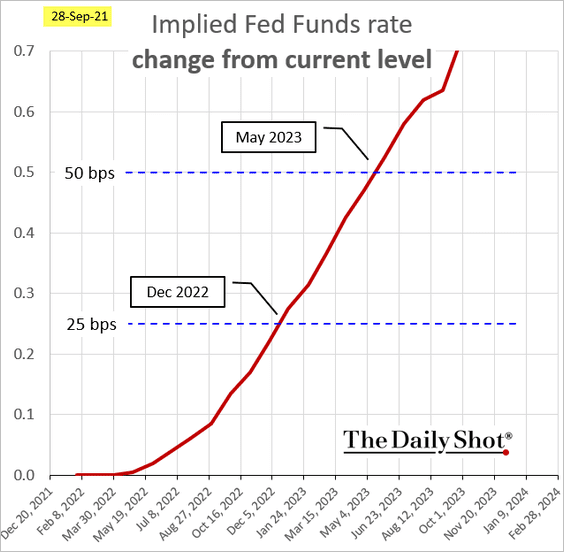
As a comparison, here is the same chart after the FOMC meeting last week.
——————–
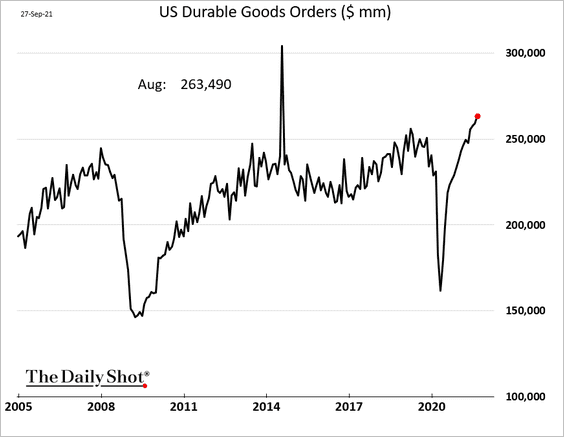
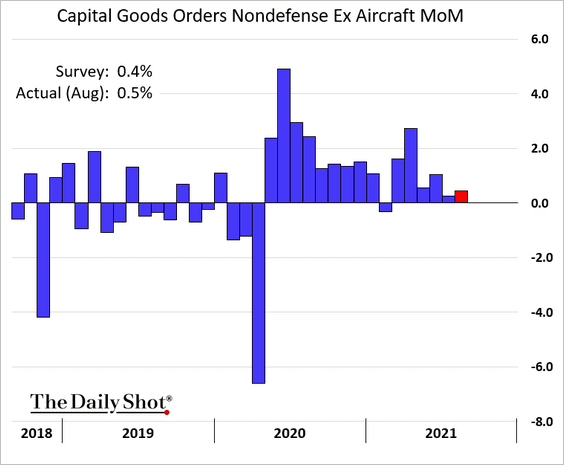
2. The durable goods orders report showed further strength in August.
• Below is a comparison to the post-2008 recovery.
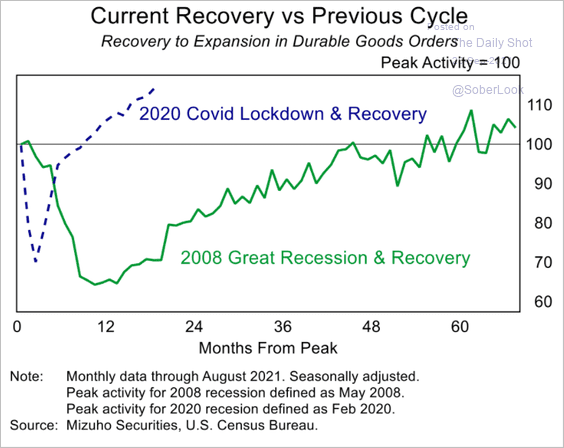 Source: Mizuho Securities USA
• And here is the breakdown by sector.
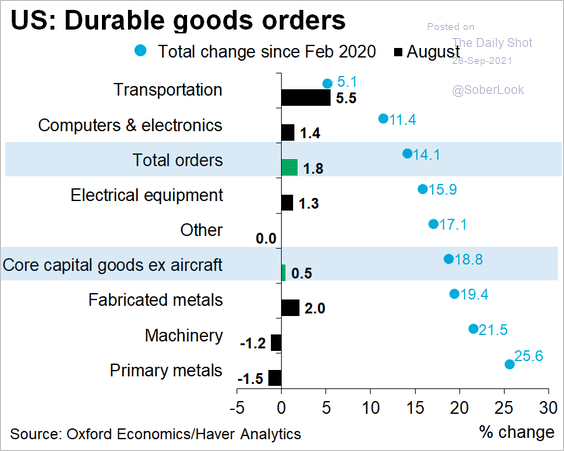 Source: @GregDaco
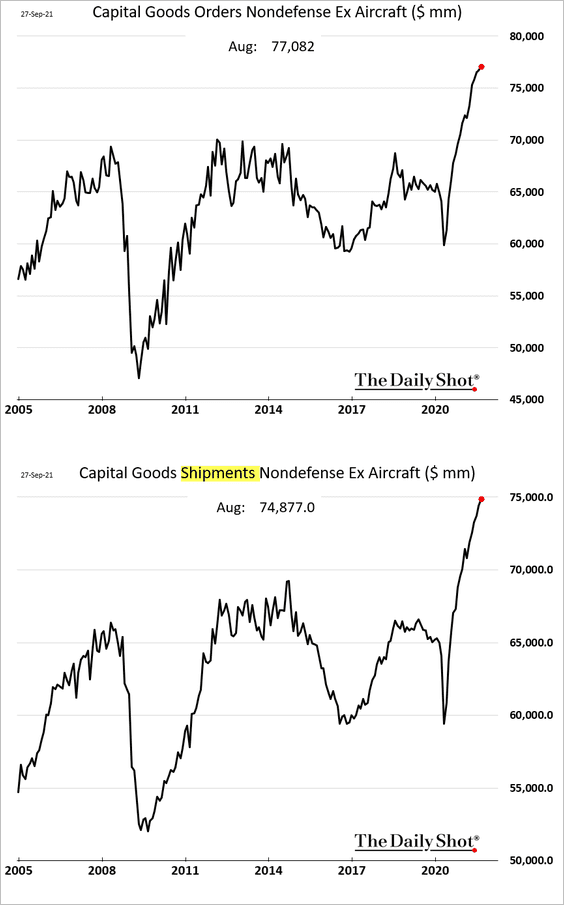
• Capital goods orders saw only one decline over the past 12 months, pointing to robust CapEx.
Shipments have been especially strong.
——————–
3. The Dallas Fed’s regional manufacturing report showed a further loss of momentum.
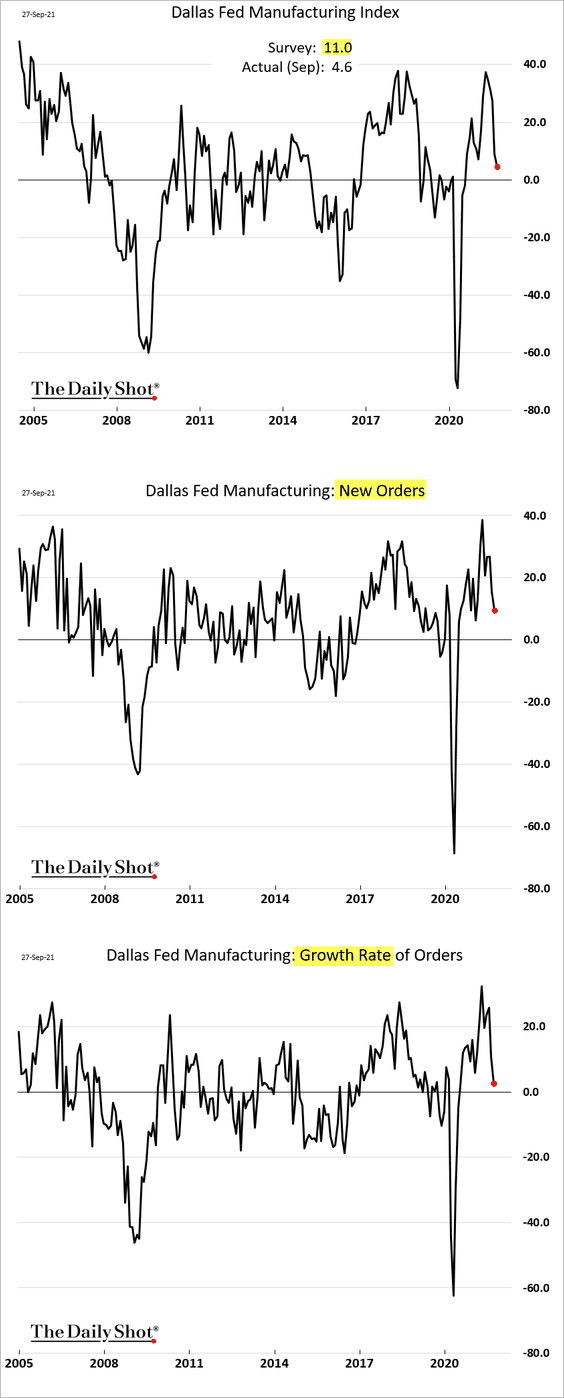
Price pressures are becoming more acute.
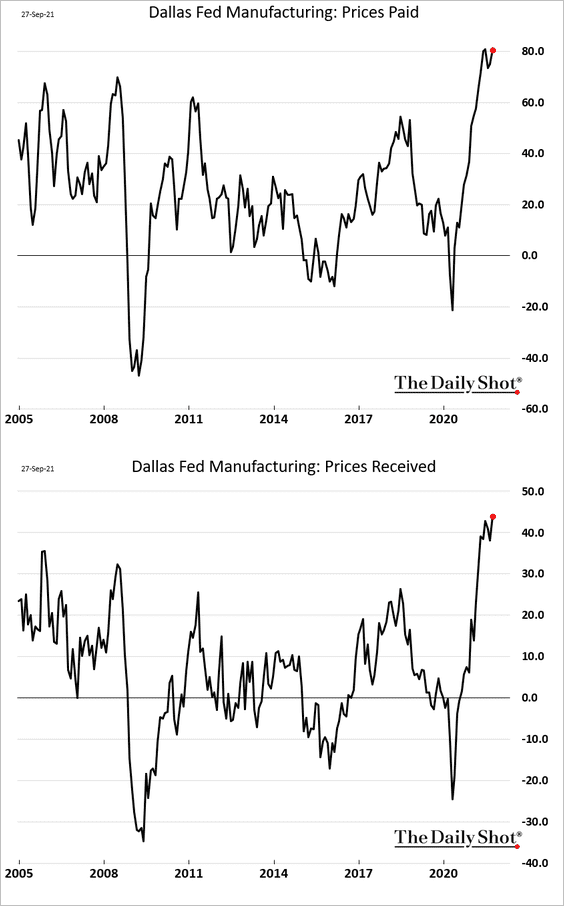
The word “stagflation” comes to mind when looking at this chart.
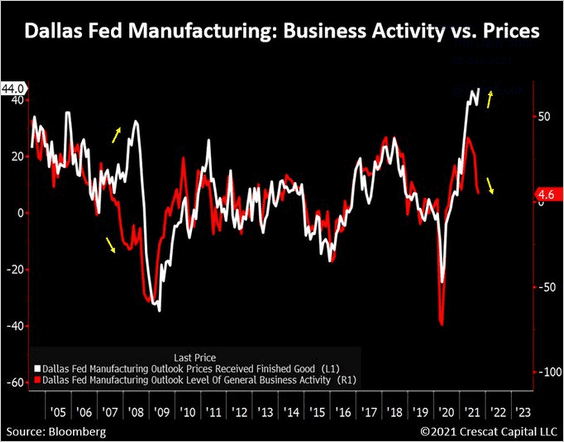 Source: @TaviCosta
By the way, this divergence between business activity and price indices is a global phenomenon.
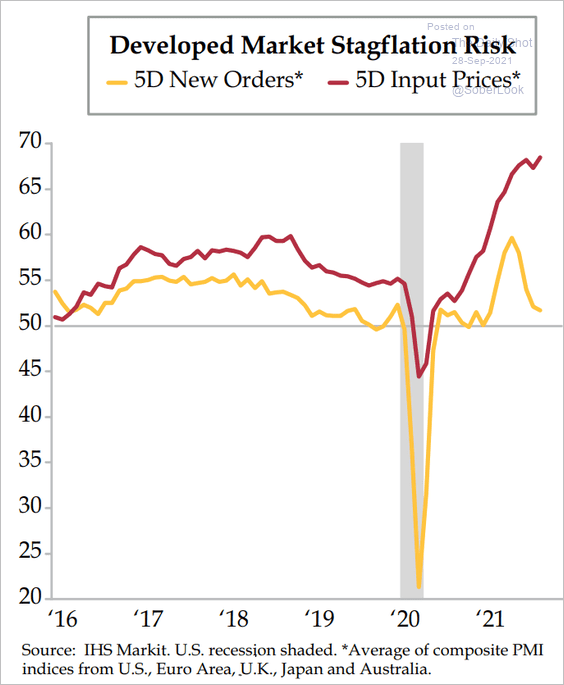 Source: The Daily Feather
——————–
4. Morgan Stanley’s business conditions indicator also shows a loss of momentum.
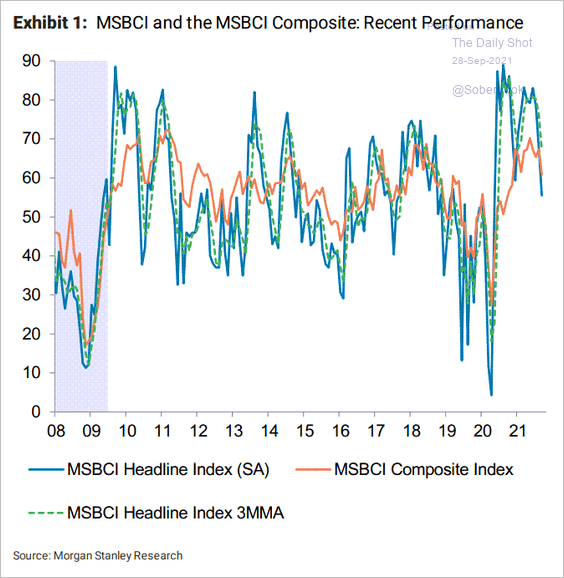 Source: Morgan Stanley Research
5. Households’ financial obligations as a share of disposable income are at multi-decade lows.
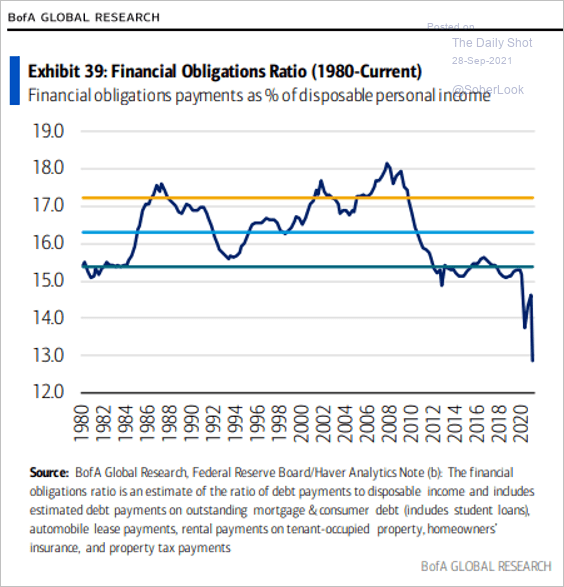 Source: BofA Global Research; @MikeZaccardi
6. Next, we have a couple of updates on the labor market.
• Main reason for not working:
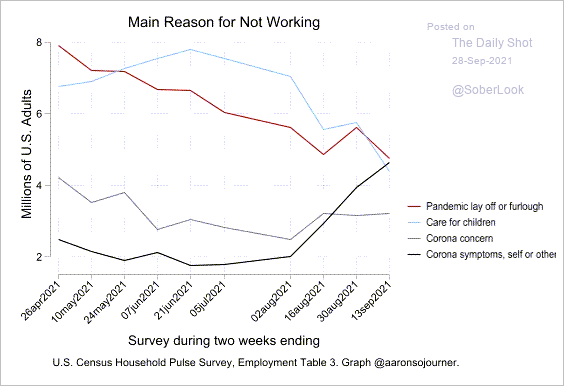 Source: @aaronsojourner
• Online searches for “sign-on bonus”:
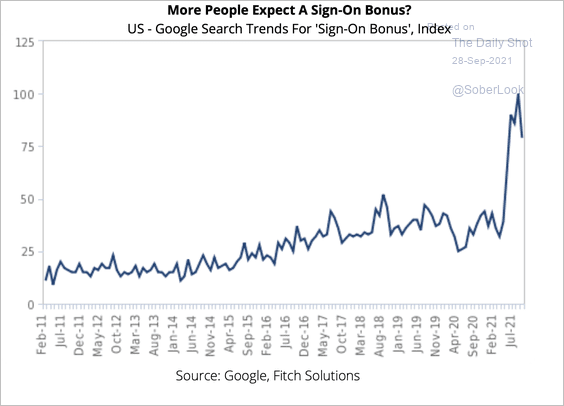 Source: Fitch Solutions Macro Research
——————–
7. Traffic to COVID “beneficiaries” (think grocery stores) is near the highs, while covid-recovery traffic (think gyms) has stalled below pre-covid levels.
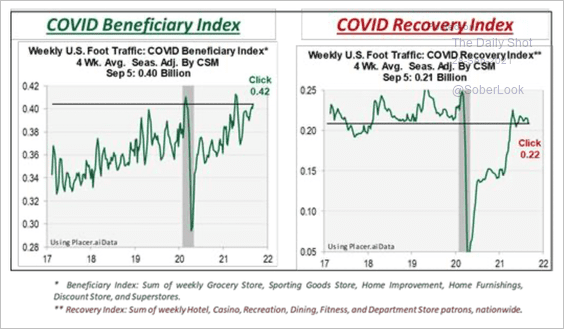 Source: Cornerstone Macro
8. However, the COVID situation continues to improve.
• New cases and hospitalizations:
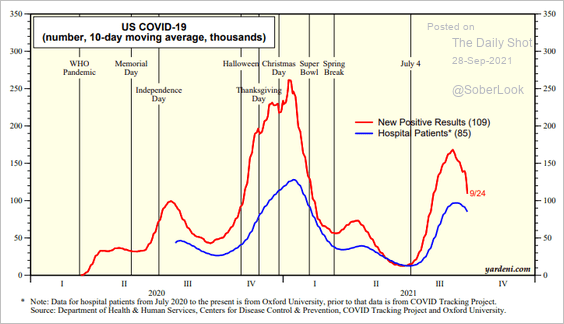 Source: Yardeni Research
• The positivity rate:
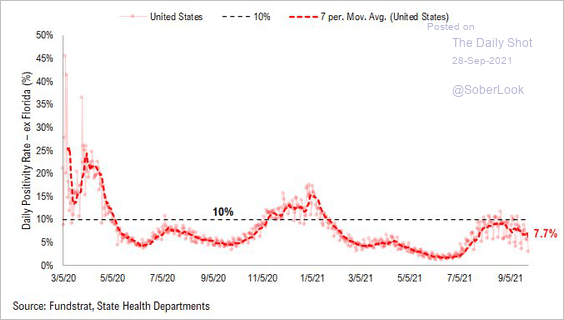 Source: @carlquintanilla, @fundstrat
Back to Index
Global Developments
1. What is the most crowded trade?
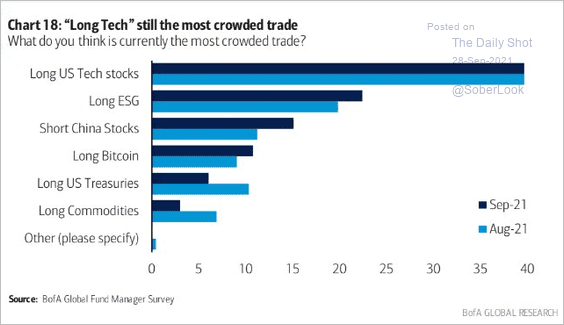 Source: BofA Global Research
2. Interest rate differentials have moved sharply against the dollar.
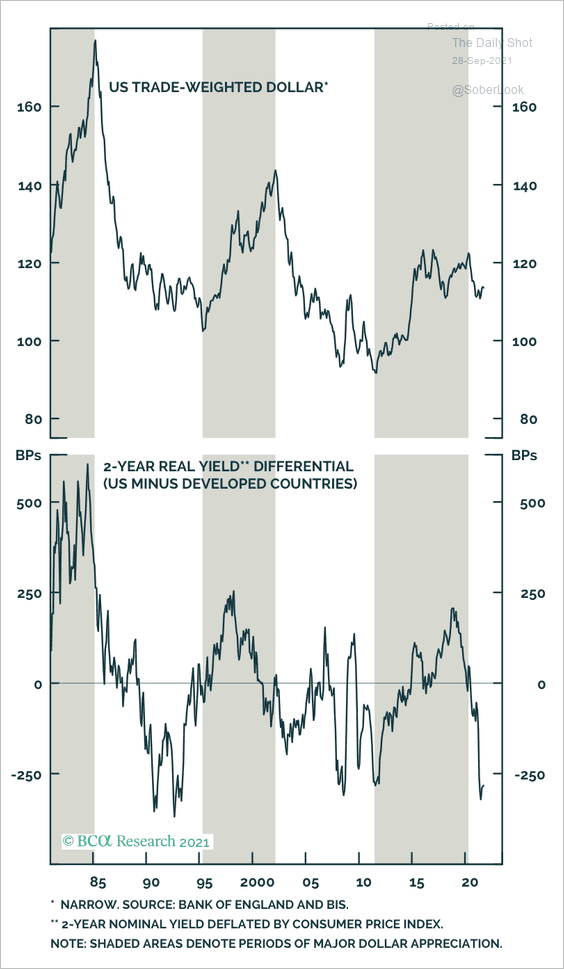 Source: BCA Research
3. This chart shows the deviation of output from pre-pandemic projections.
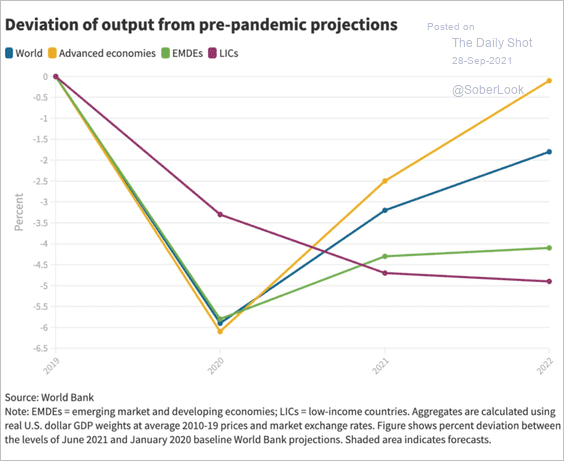 Source: @adam_tooze Read full article
4. Global growth momentum has largely blown off the froth of early 2021.
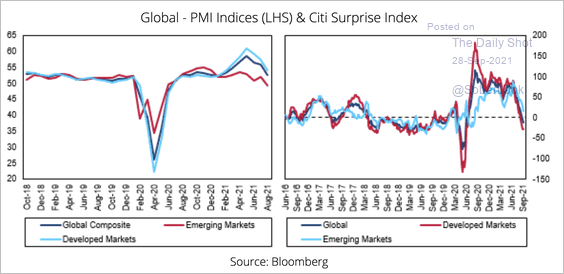 Source: Fitch Solutions Macro Research
5. Finally, we have the OECD’s inflation forecasts.
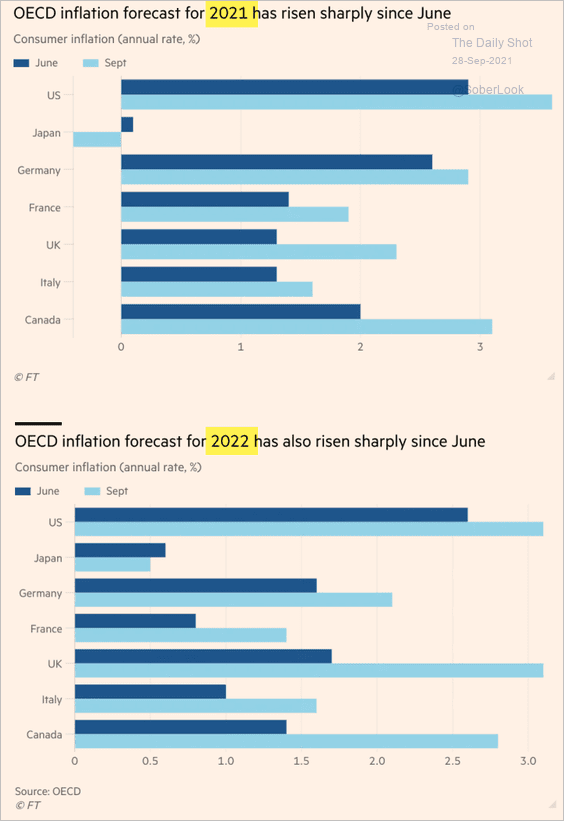 Source: @financialtimes Read full article
——————–
Food for Thought
1. The number of global disasters, disaster-related deaths, and resulting economic loss:
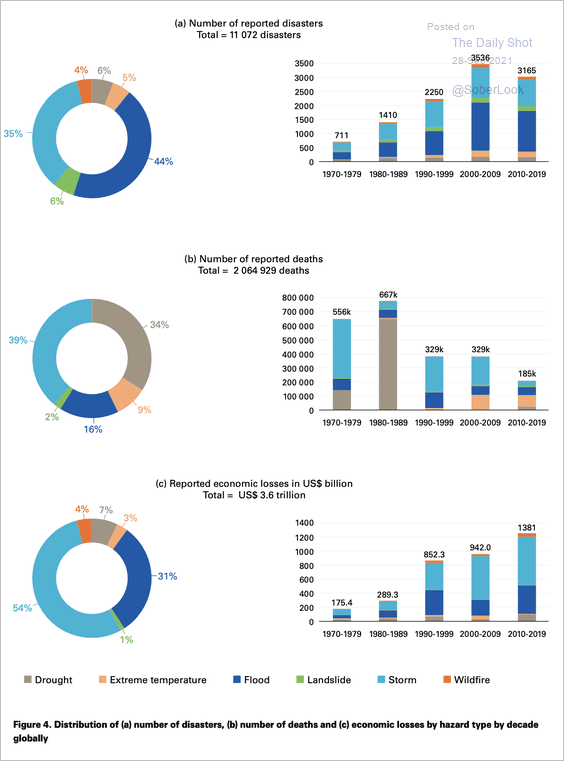 Source: World Meteorological Organization Read full article
2. Sea levels over time:
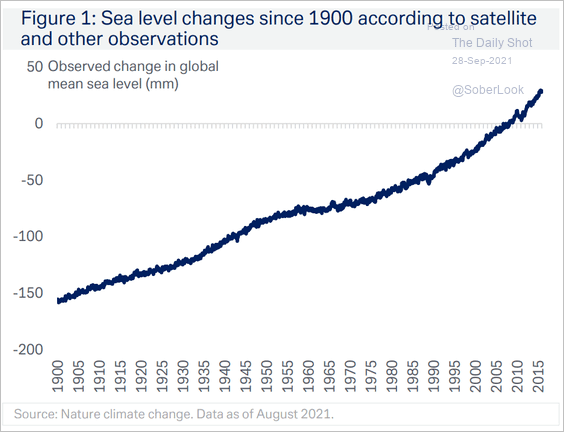 Source: Deutsche Bank Research
3. Support for vaccine mandates:
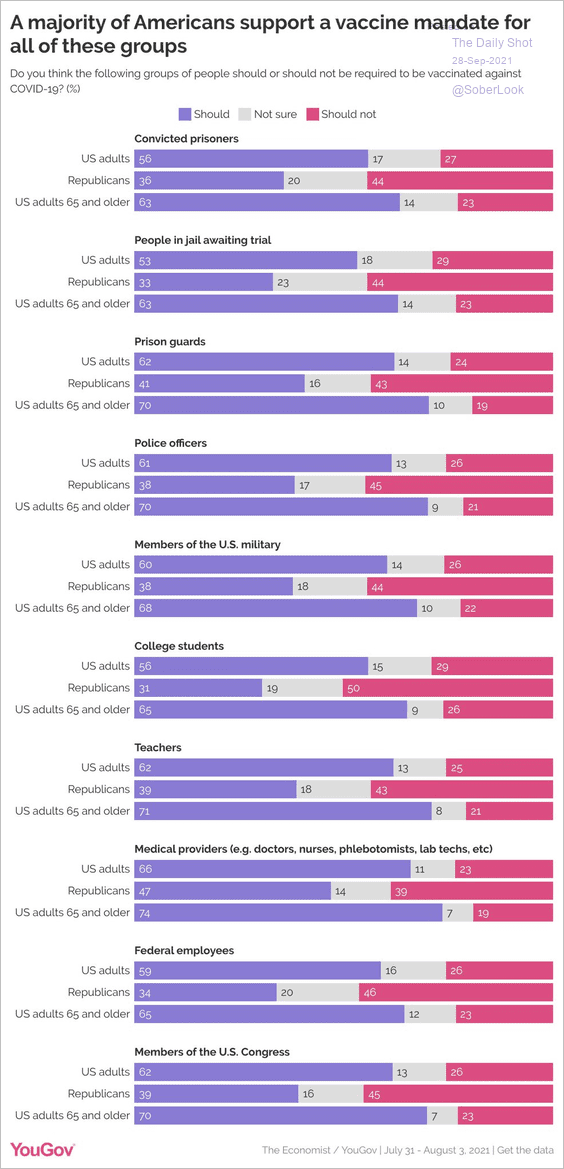 Source: @YouGovAmerica Read full article
4. Soccer defenders facing higher dementia risk:
 Source: Statista
5. Milk fat usage:
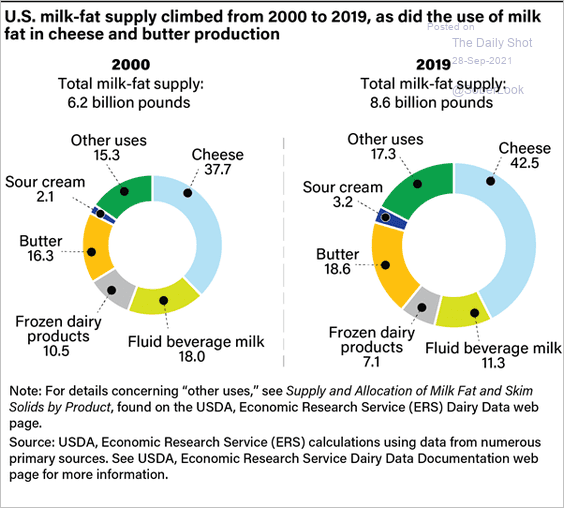 Source: @USDA_ERS Read full article
6. White population in the US:
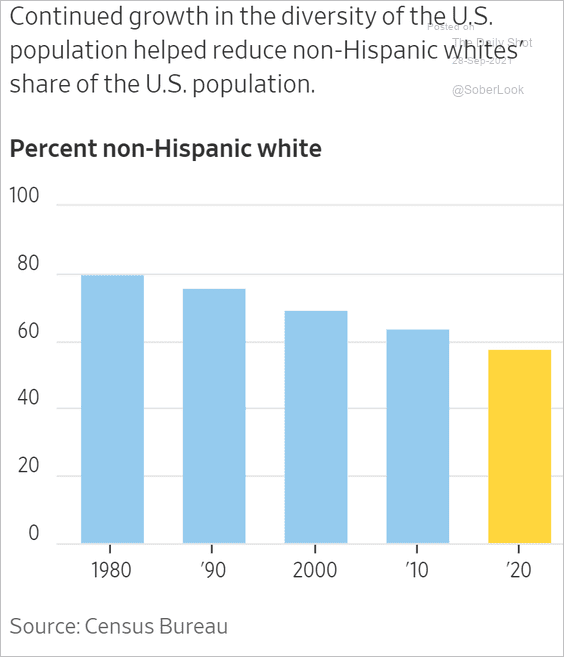 Source: @WSJ Read full article
7. US regional population share:
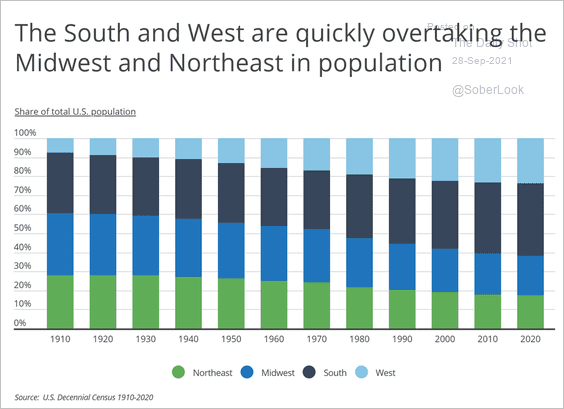 Source: Inspection Support Network, h/t Hightower Las Vegas, RCG Economics Read full article
8. R&D financing:
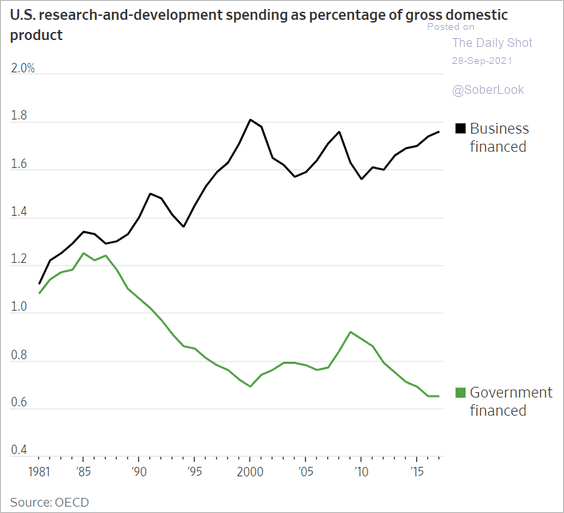 Source: @WSJ Read full article
9. Less than 13 years before Social Security becomes insolvent:
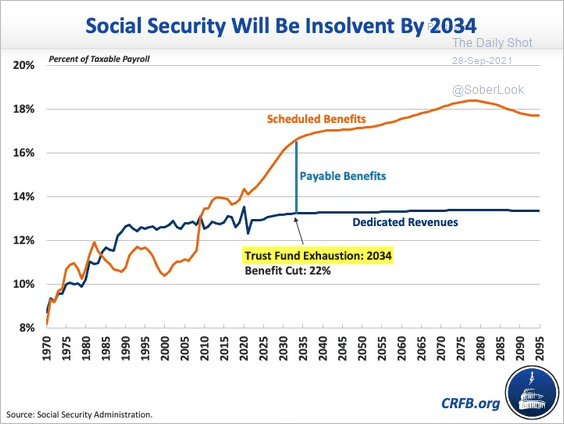 Source: CRFB
10. Most popular sports team in each state:
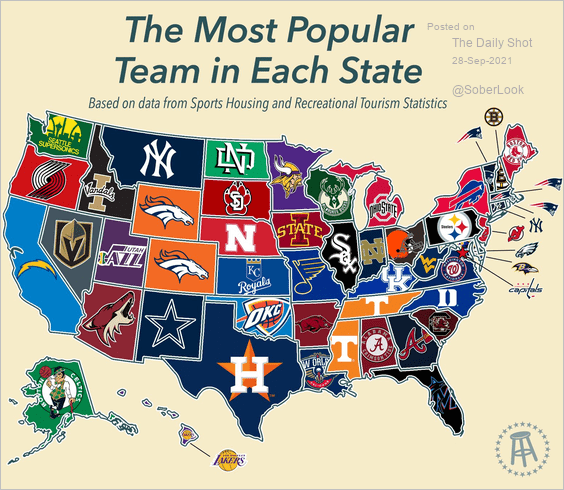 Source: Ozark Radio News Read full article
——————–
Back to Index