The Daily Shot: 08-Oct-21
• The United States
• Canada
• The United Kingdom
• The Eurozone
• Asia – Pacific
• China
• Emerging Markets
• Cryptocurrency
• Commodities
• Energy
• Equities
• Credit
• Global Developments
• Food for Thought
The United States
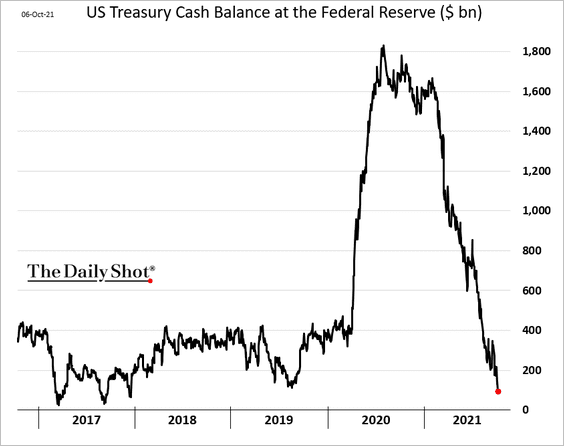
1. The US Senate approved a short-term increase in the debt ceiling, raising the level by $480 billion. The timing was critical because the US Treasury’s cash balances hit the lowest level since 2017.
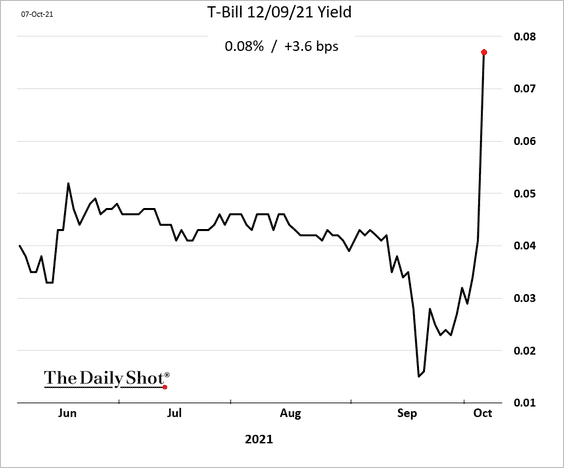
But the 480-billion boost will not last long, and the markets will face the same predicament in early December. Here is the T-bill maturing on December 9th.
——————–
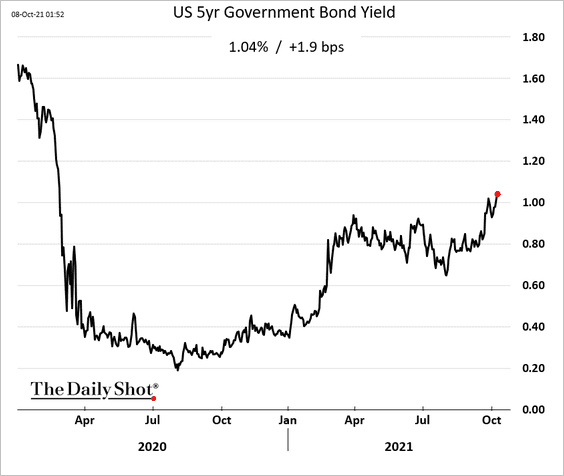
2. Treasury yields keep grinding higher ahead of the employment report.
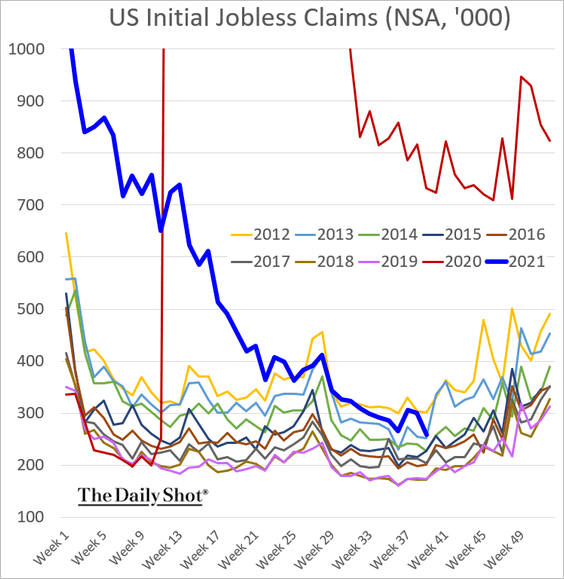
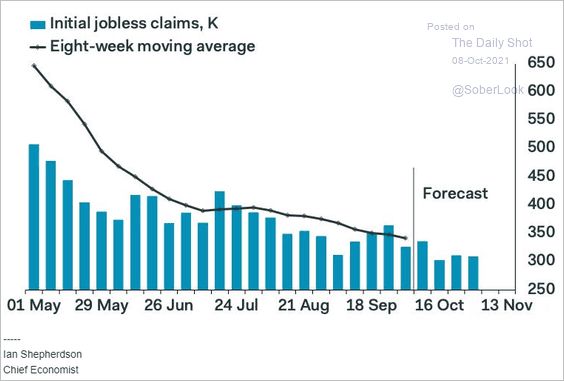
3. Initial jobless claims continue to show improvement in the labor market, with further declines expected (2nd chart).
 Source: Pantheon Macroeconomics
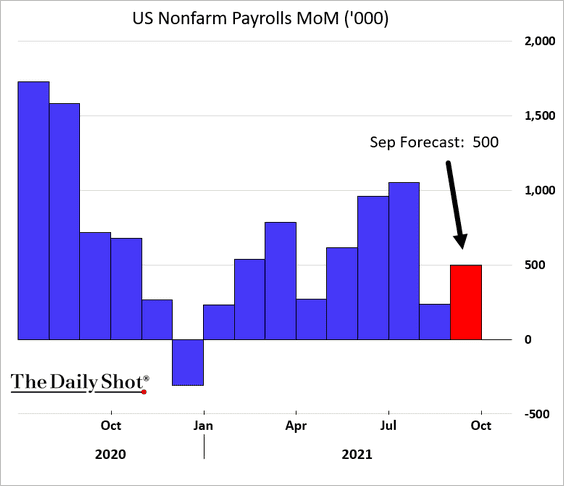
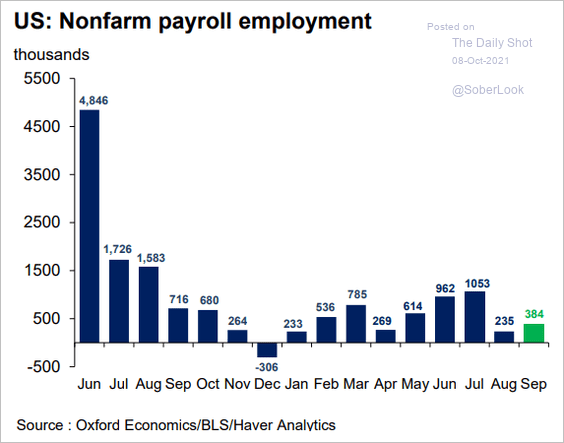
Economists are estimating a 500k increase in employment last month (consensus).
Below is a forecast from Oxford Economics.
 Source: @GregDaco
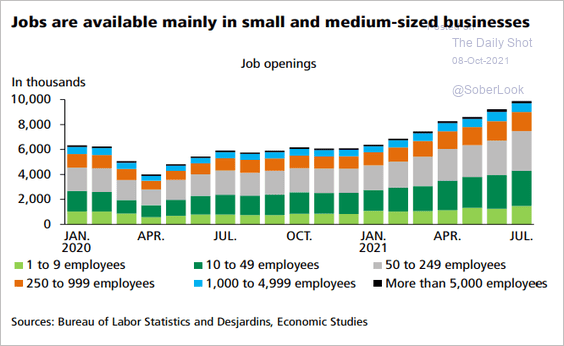
Separately, the bulk of the recent job openings have been in small and medium-sized businesses.
 Source: Desjardins
——————–
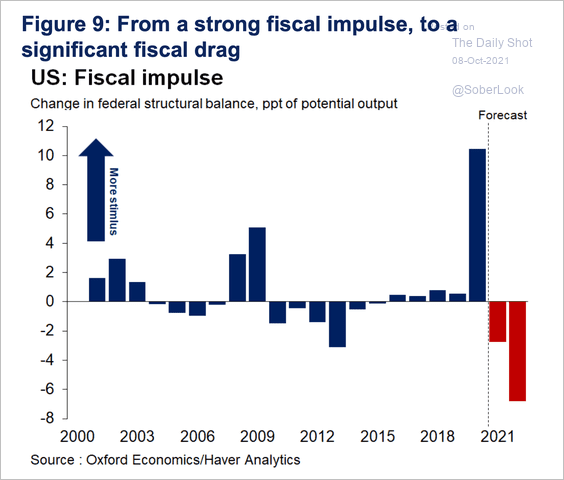
4. The reversal of the pandemic fiscal impulse will be a drag on the GDP next year.
 Source: Oxford Economics
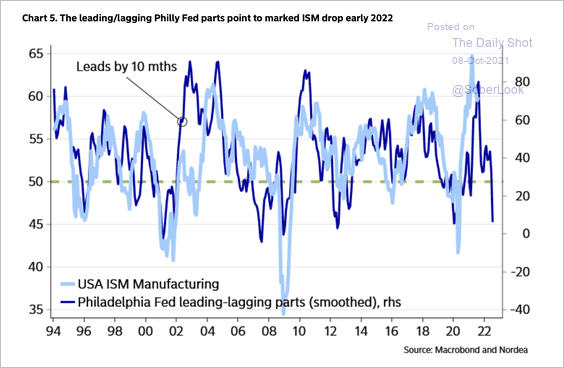
5. The Philly Fed’s regional manufacturing survey (leading vs. lagging components) leads the broader ISM index. And right now, it is flashing a significant drop in early 2022.
 Source: Nordea Markets
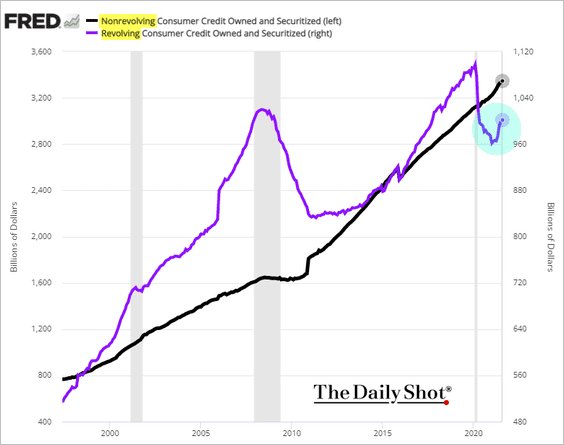
6. Next, we have some updates on consumer credit.
• Credit card debt remains well below pre-COVID levels.
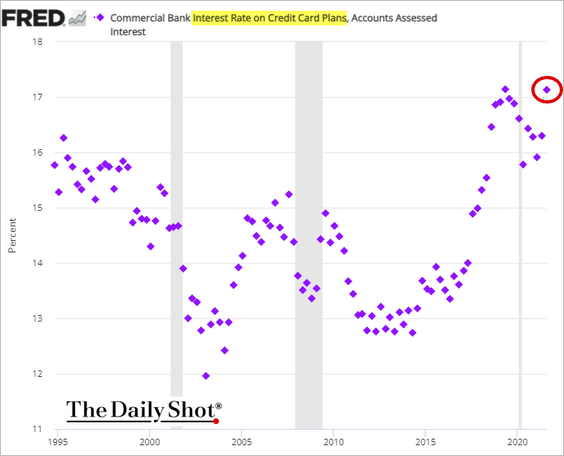
• Credit card rates are back above 17% – near the highs.
• Here is the status of the US government’s student debt portfolio.
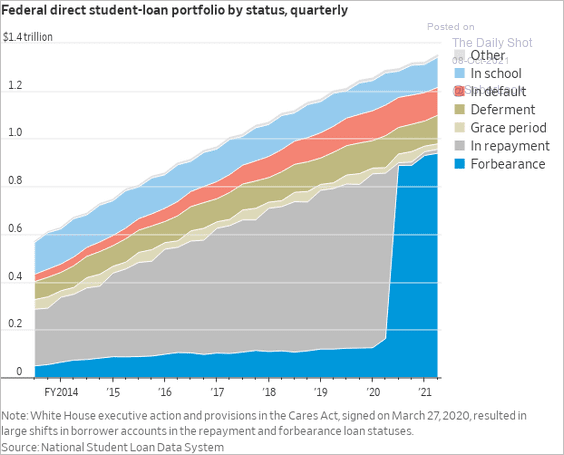 Source: @WSJ Read full article
• This chart shows households’ excess savings by income category.
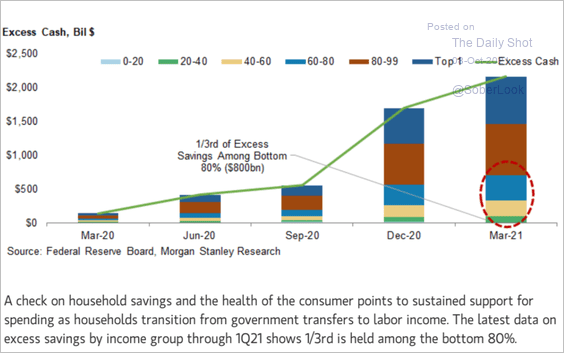 Source: Morgan Stanley Research
——————–
7. Finally, we have some data on inflation.
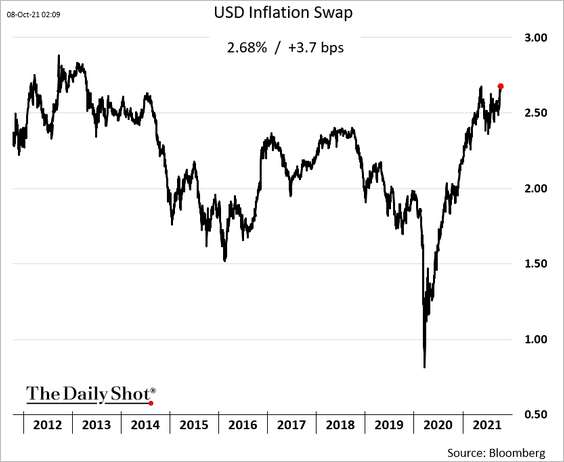
• Long-term market-based inflation expectations (highest since 2013):
• Businesses experiencing inflation (CFO survey):
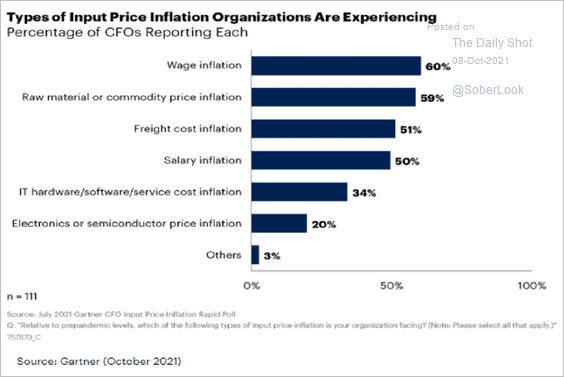 Source: Gartner; @JeffWeniger
• Inflation in 12 months (a survey of credit investors) :
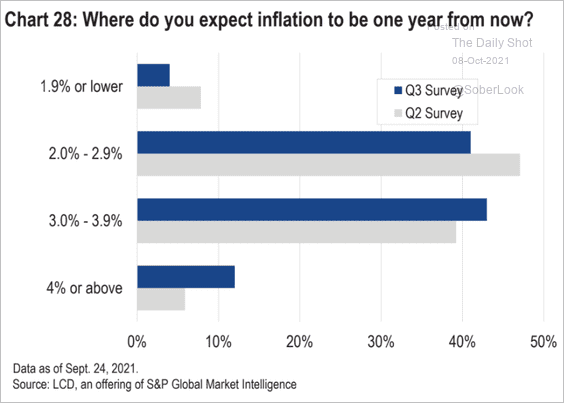 Source: S&P Global Market Intelligence
• The Dallas Fed’s trimmed mean PCE inflation (closely watched by the Fed):
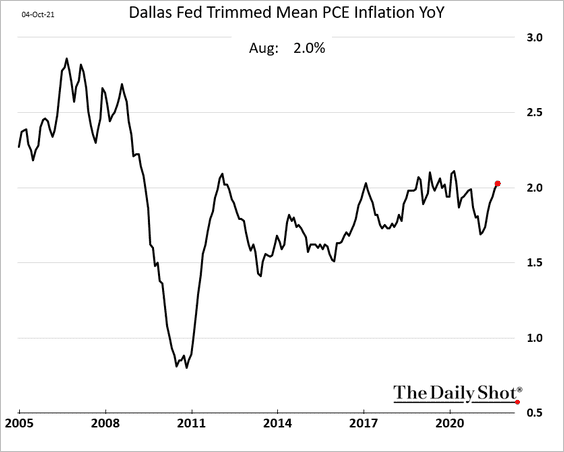
• Small business plans to boost prices vs. the median CPI:
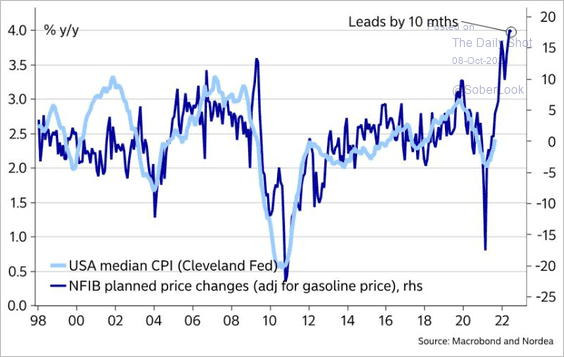 Source: Nordea Markets
• Incomes feeding into the CPI:
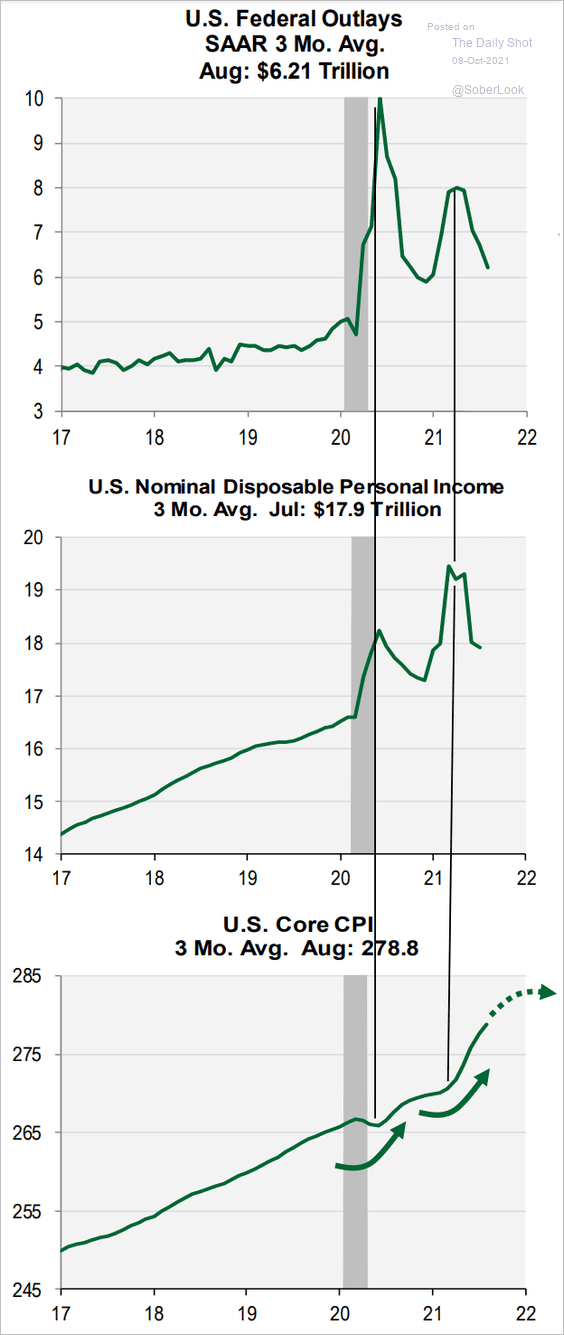 Source: Cornerstone Macro
• Low automobile inventories boosting prices:
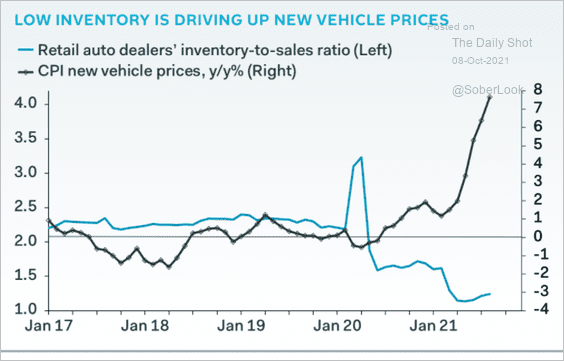 Source: Pantheon Macroeconomics
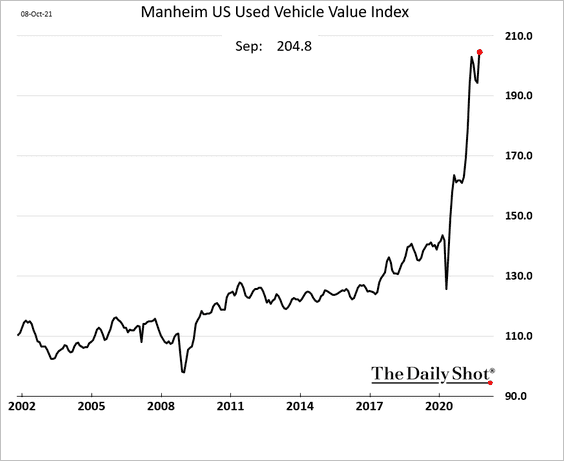
• Wholesale used car prices (updated):
• The 2% price target (as opposed to a rate target) depends on the starting point.
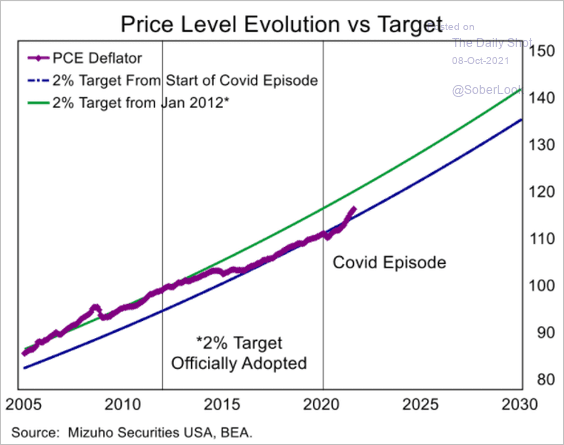 Source: Mizuho Securities USA
Back to Index
Canada
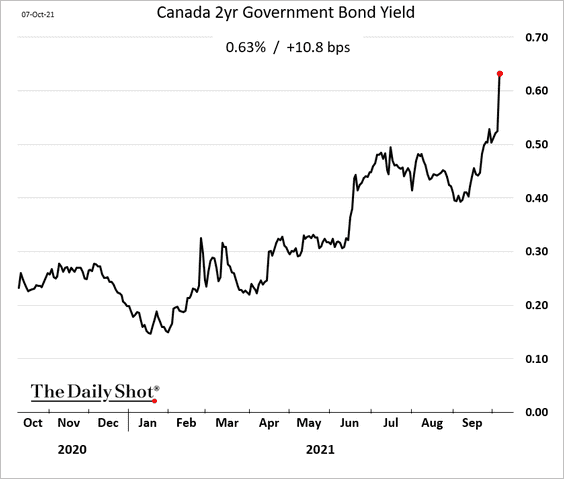
1. Short-term bond yields are surging as more rate hikes get priced in.
 Source: @WSJ Read full article
——————–
2. Real rates have been exceptionally low.
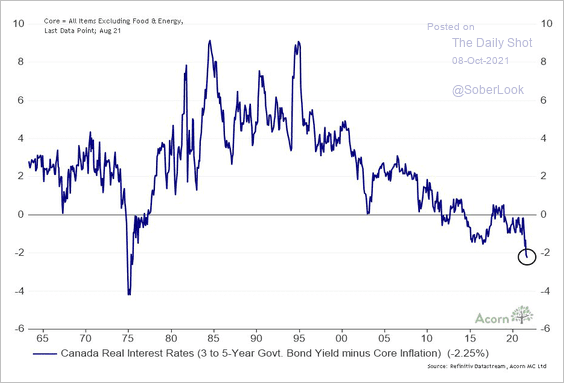 Source: @RichardDias_CFA
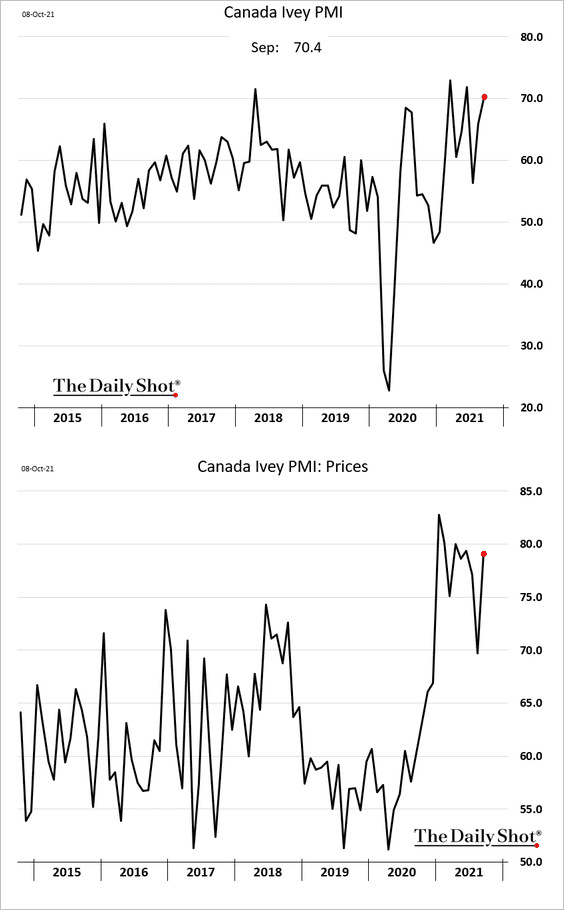
3. The Ivey PMI index showed robust business activity in September, with prices surging.
4. Here are the GDP changes by sector since the start of the pandemic.
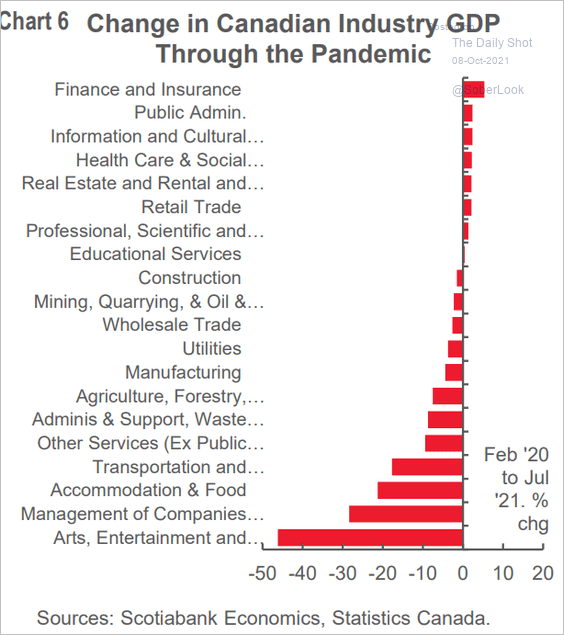 Source: Scotiabank Economics
5. The energy sector’s strength offset the softness in autos, boosting Canada’s trade surplus with the US.
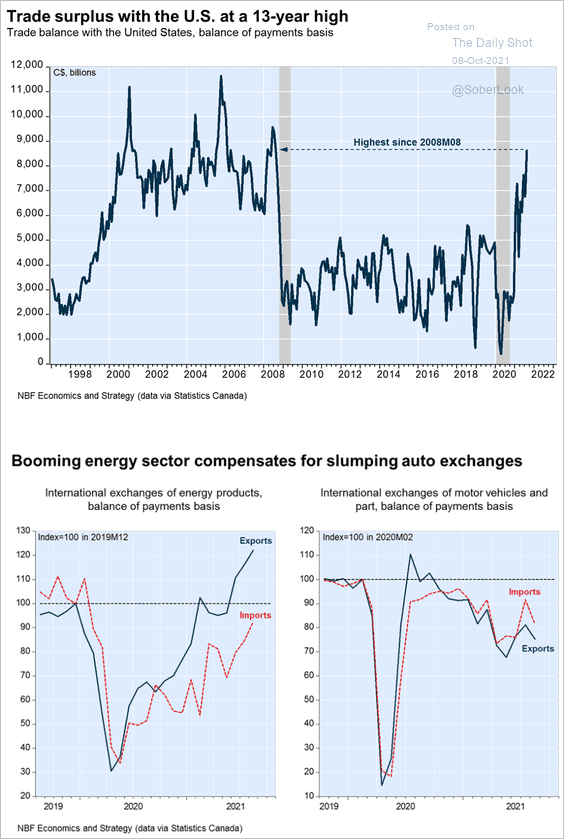 Source: Economics and Strategy Group, National Bank of Canada
Back to Index
The United Kingdom
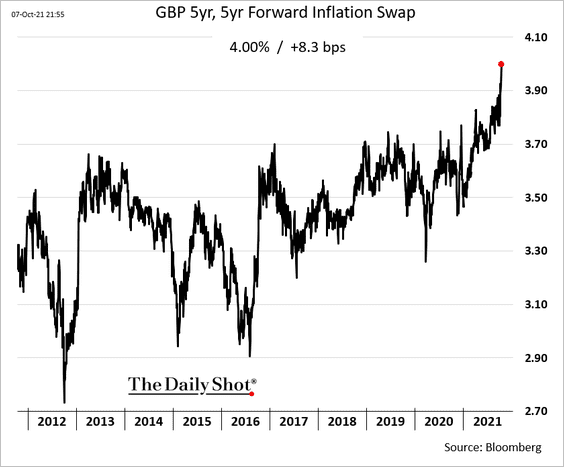
1. Market-based inflation expectations continue to surge.
2. This chart shows the UK’s stock-bond correlation since 1875.
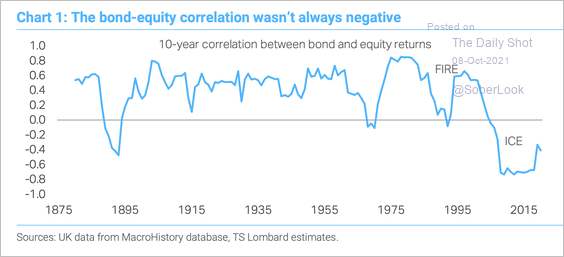 Source: TS Lombard
3. UK savings are returning to pre-COVID levels.
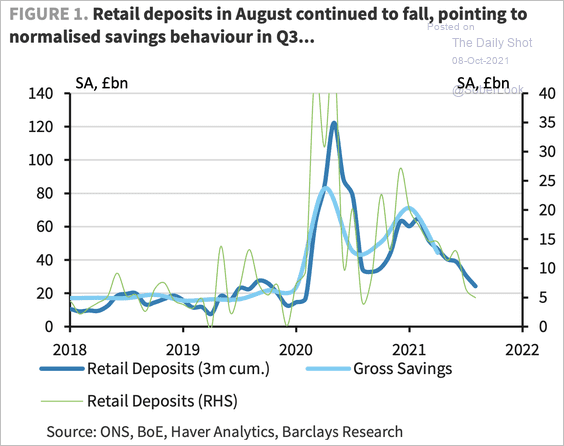 Source: Barclays Research
4. As we mentioned earlier, the UK weather has not cooperated this year. Weaker renewables production exacerbated the energy crisis.
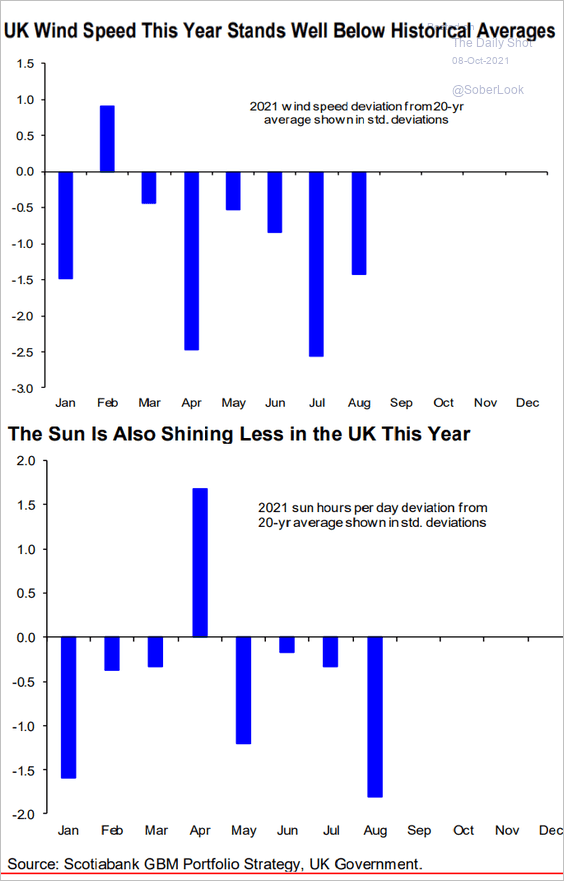 Source: Hugo Ste-Marie, Portfolio & Quantitative Strategy Global Equity Research, Scotia Capital
Back to Index
The Eurozone
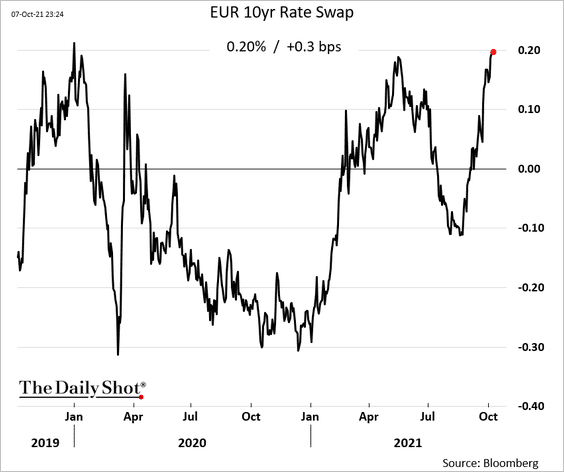
1. Longer-term rates are climbing.
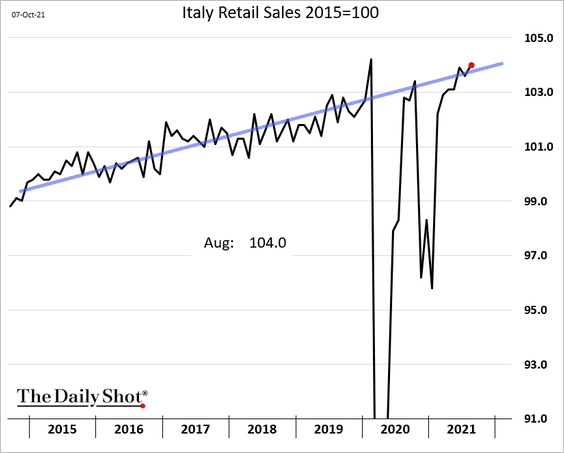
2. Italian retail sales improved in August, continuing on the pre-COVID trend.
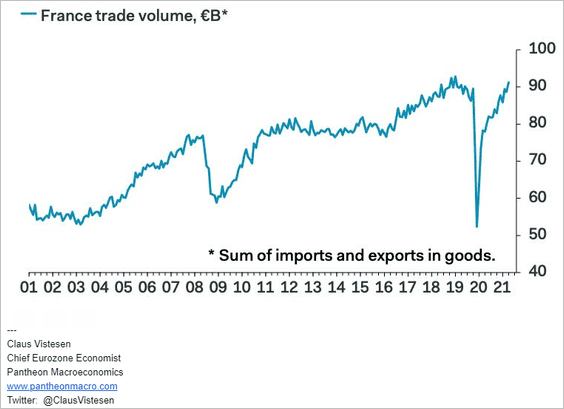
3. France’s trade volume keeps climbing.
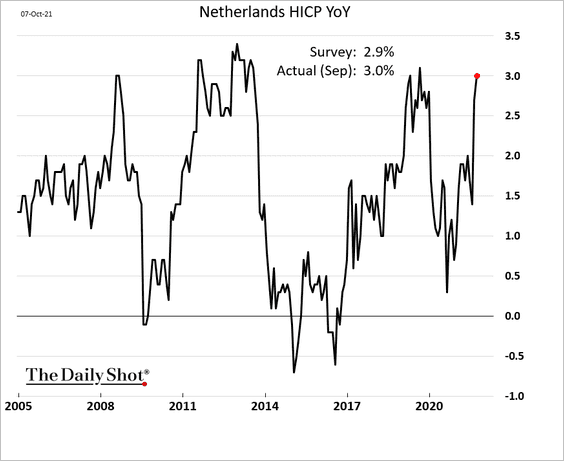
4. The Dutch CPI is back at 3%.
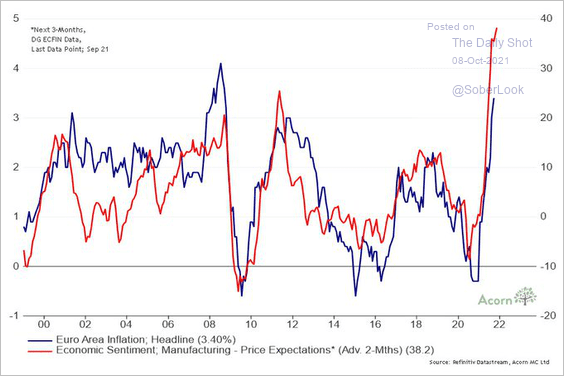
5. Manufacturing price expectations point to higher Eurozone inflation ahead.
 Source: @RichardDias_CFA
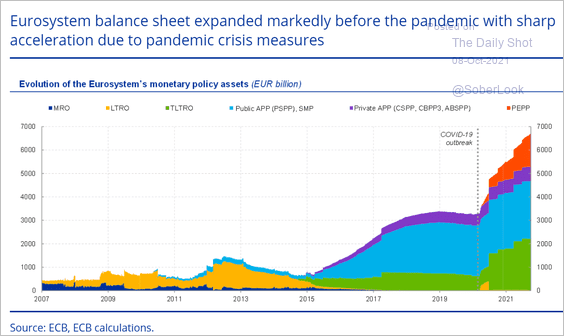
6. Here is the composition of the ECB’s (Eurosystem) balance sheet.
 Source: ECB Read full article
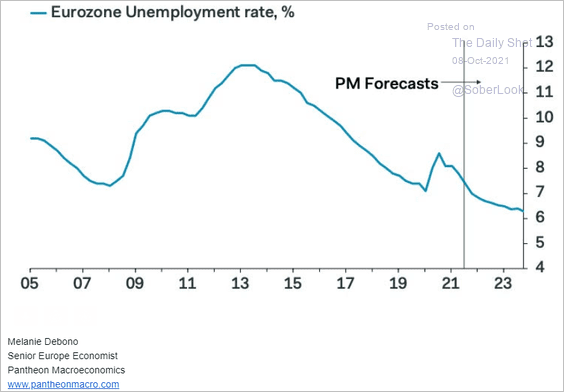
7. Pantheon Macroeconomics expects the unemployment rate to continue on a downward path.
 Source: Pantheon Macroeconomics
Back to Index
Asia – Pacific
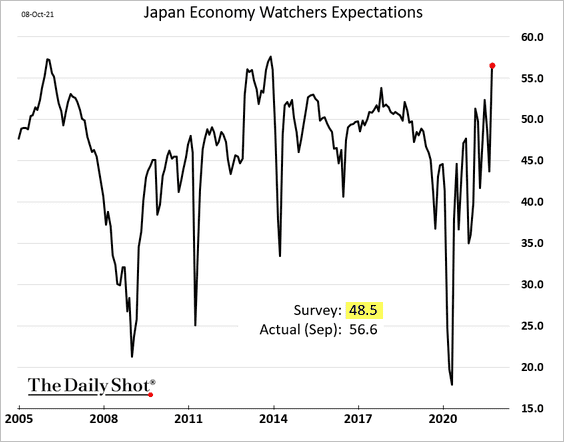
1. Japan’s Economy Watchers Expectations Index surged last month, pointing to a rebound in economic activity.
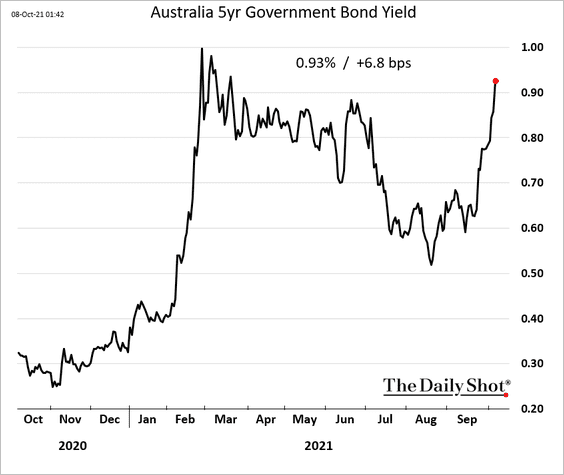
2. Australia’s bond yields continue to climb.
Back to Index
China
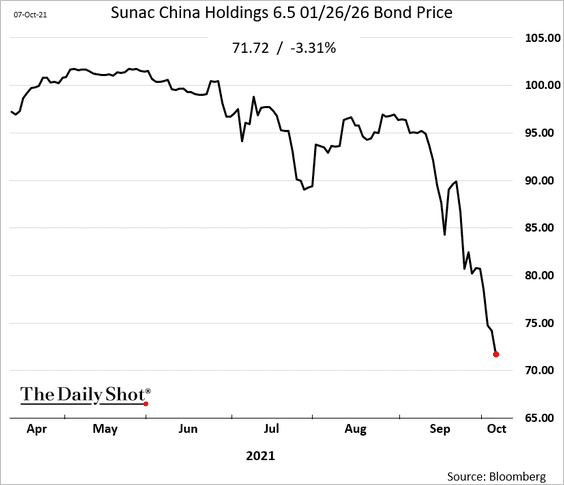
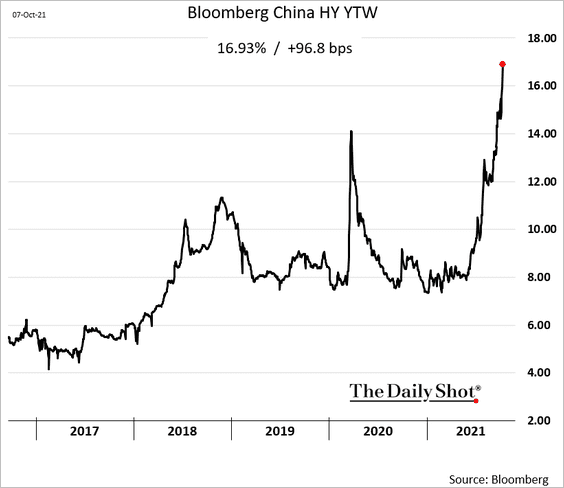
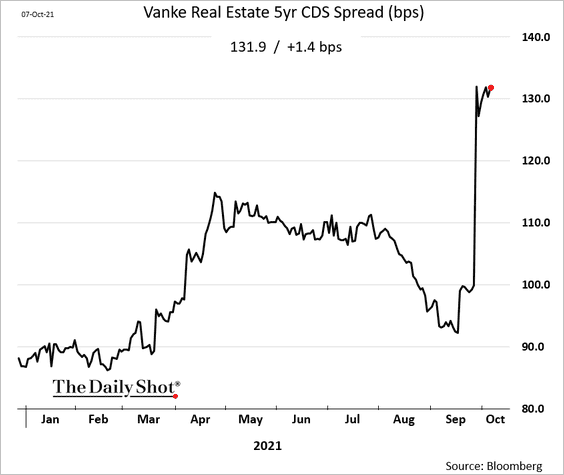
1. The credit crisis in the property sector shows no signs of letting up.
• Sunac’s bond price continues to sink.
• Bloomberg’s leveraged dollar-denominated corporate bond index yield is nearing 17%.
• Venke Real Estate is not highly leveraged, but investors are using its credit default swaps to hedge risks in the sector.
• Many developers already defaulted this year.
 Source: Gavekal Research
• By the way, the developers’ credit crunch is not about lack of demand.
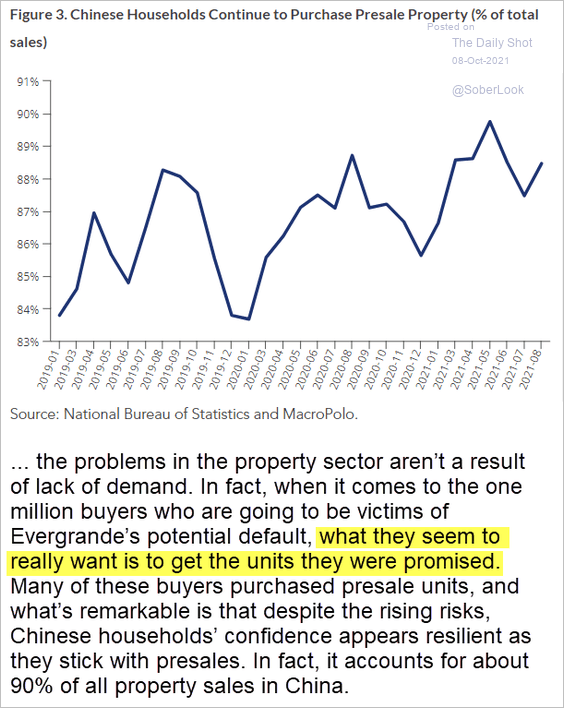 Source: MacroPolo
——————–
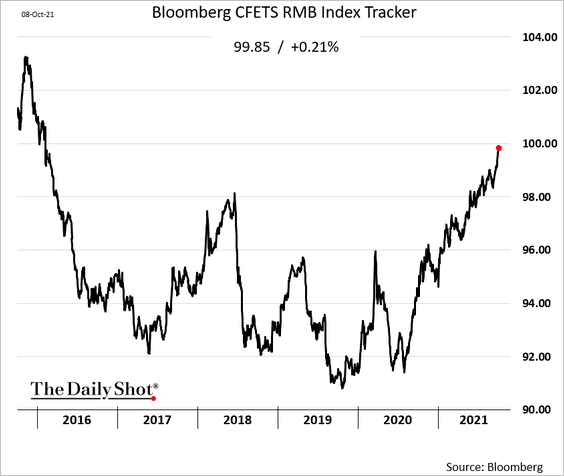
2. The renminbi continues to climb against a basket of currencies, which will further tighten China’s financial conditions and put pressure on exporters.
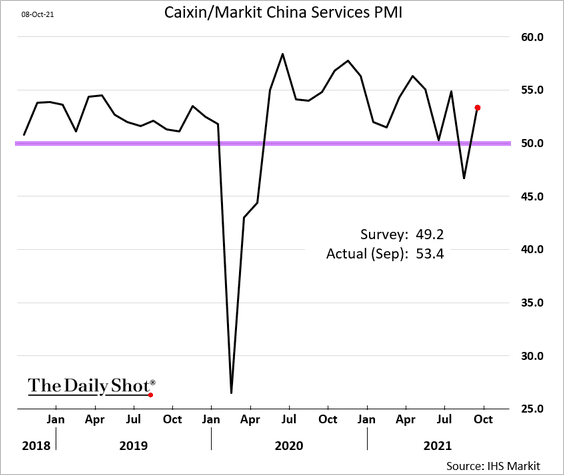
3. Service-sector activity grew last month, with the Markit PMI surprising to the upside.
Back to Index
Emerging Markets
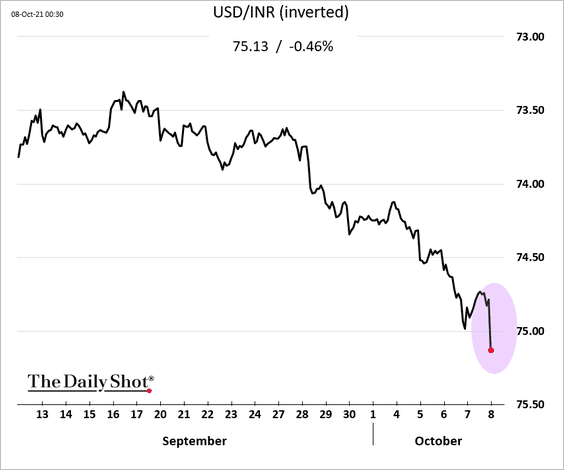
1. The Indian rupee tumbled further after the RBI left rates unchanged.
Separately, here is a summary of India’s energy crisis.
 Source: Statista
——————–
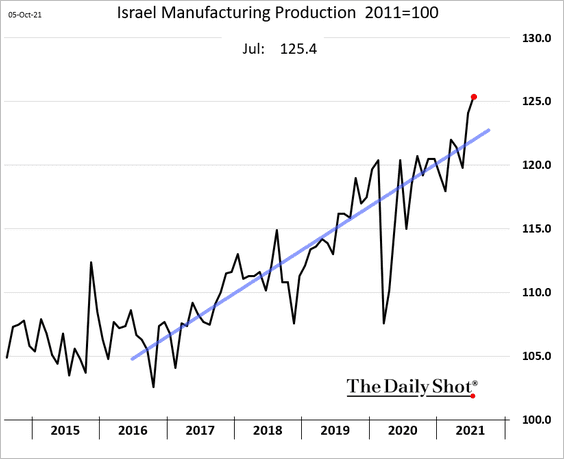
2. Israel’s manufacturing output continues to surge.
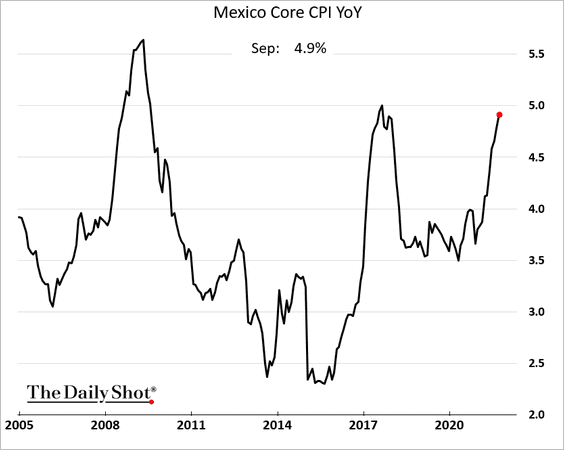
3. Mexican core CPI is approaching 5%.
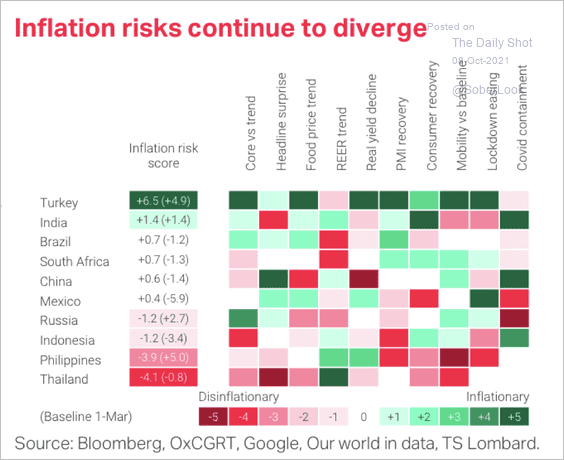
4. Inflation risks have diverged across EM economies.
 Source: TS Lombard
Back to Index
Cryptocurrency
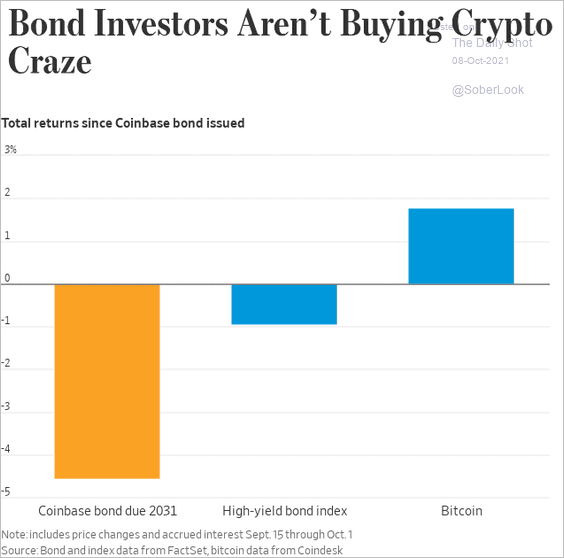
1. Bond investors haven’t been happy in the crypto space.
 Source: @WSJ Read full article
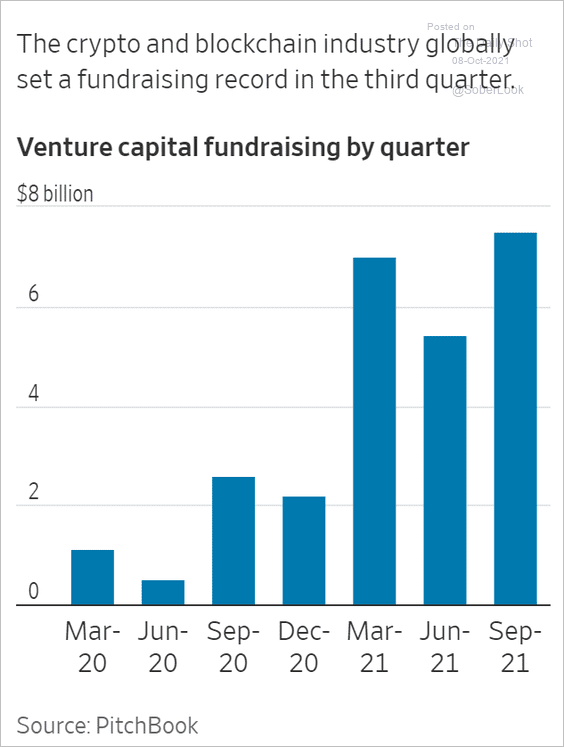
2. Crypto and blockchain VC funding hit a record high last quarter.
 Source: @WSJ Read full article
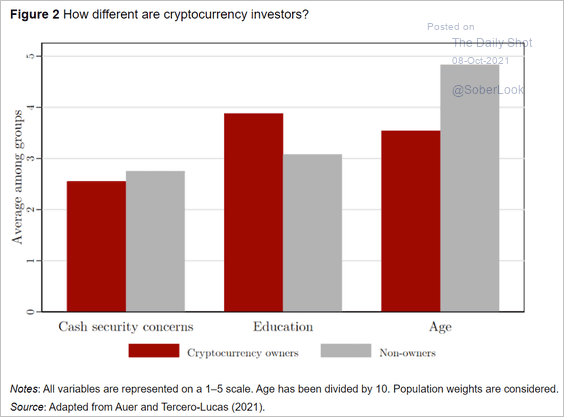
3. How different are crypto investors from the broader population?
 Source: VOX EU Read full article
Back to Index
Commodities
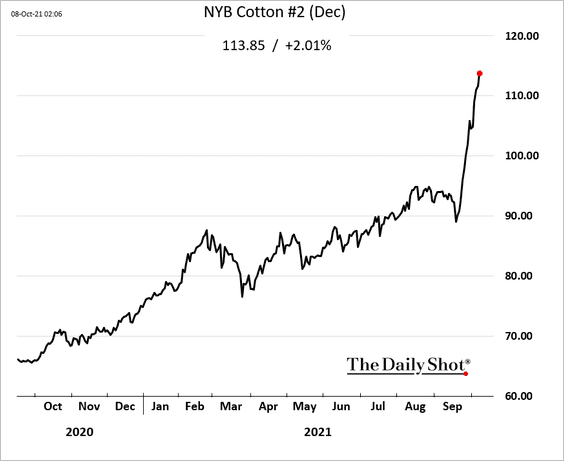
1. Cotton futures continue to surge.
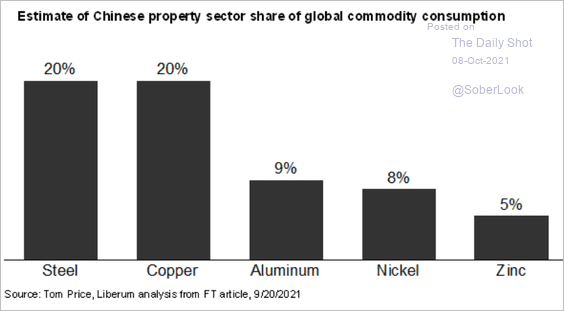
2. China’s property developer credit crisis poses a risk for industrial metals.
 Source: Macro Trends Group, Bain Read full article
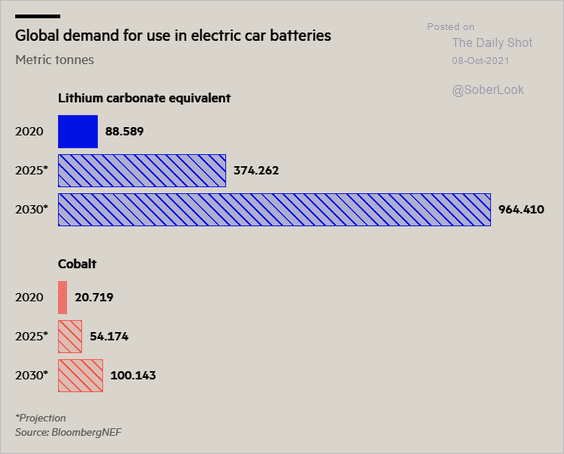
3. Next, we have lithium and cobalt expected demand growth from EV battery production.
 Source: @financialtimes Read full article
Back to Index
Energy
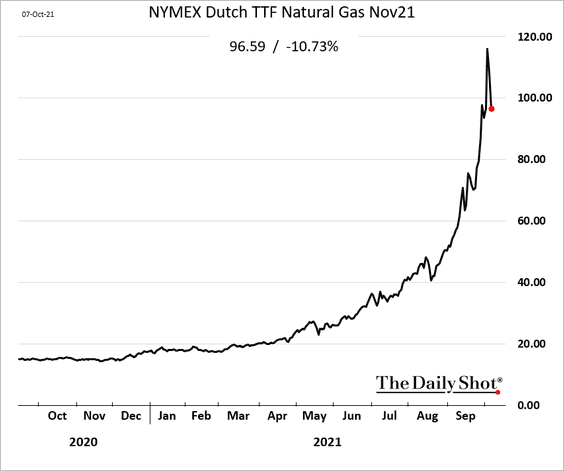
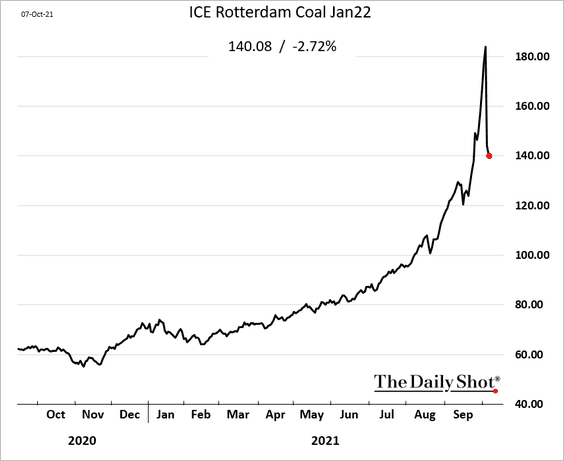
1. European energy prices are off the highs.
• Gas:
• Coal:
——————–
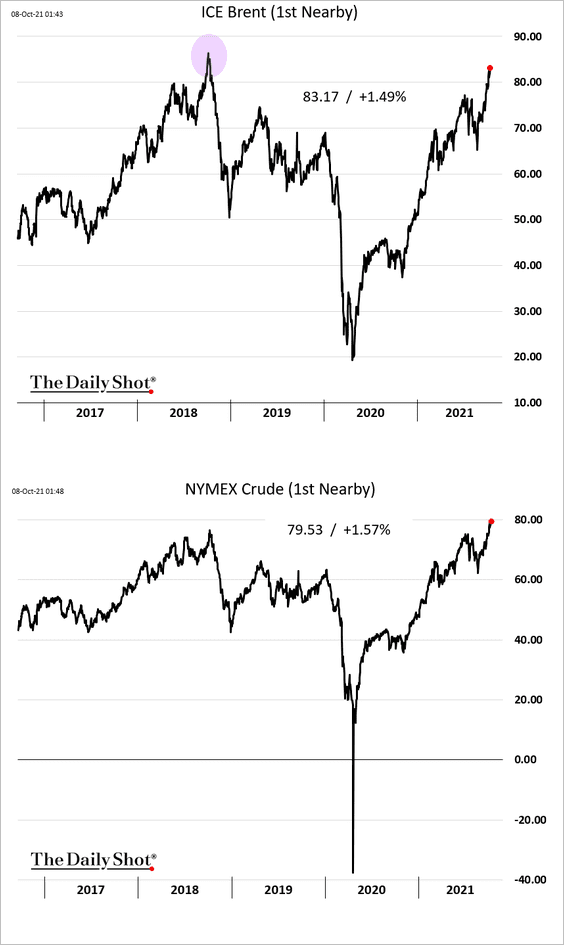
2. Brent crude is nearing the 2018 high. US oil is approaching $80/bbl.
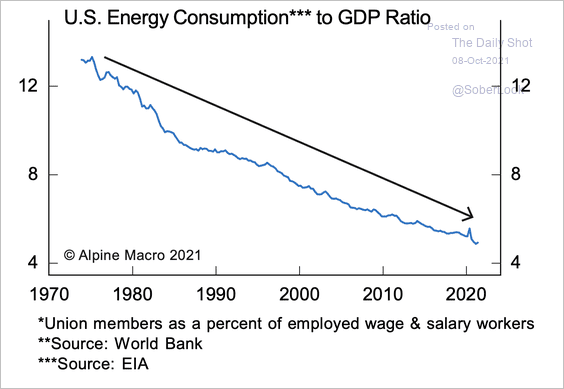
3. US energy consumption, as a share of the GDP, is far lower now than it was in the 1970s. As a result, the spike in prices is not expected to have a substantial impact on growth.
 Source: Alpine Macro
Back to Index
Equities
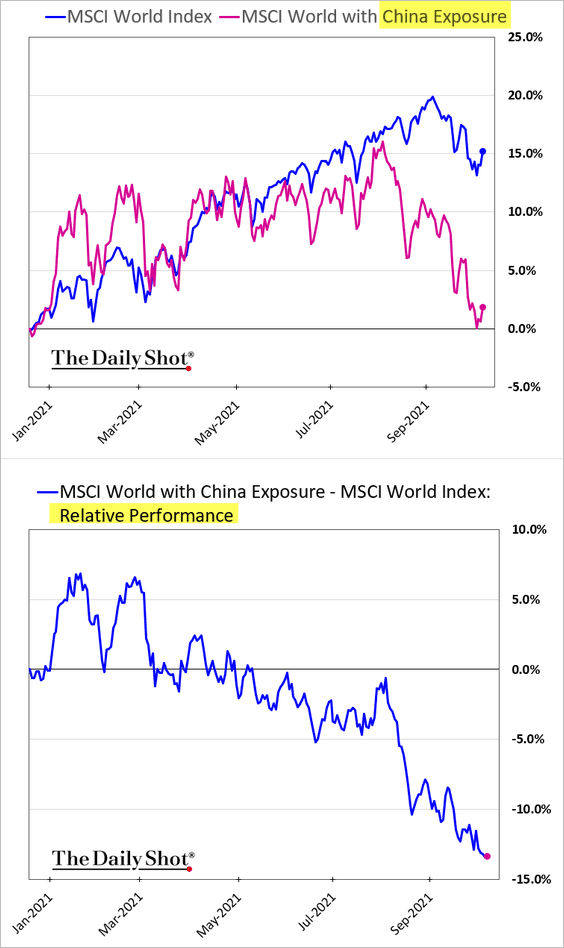
1. Companies with substantial sales in China are widening their underperformance.
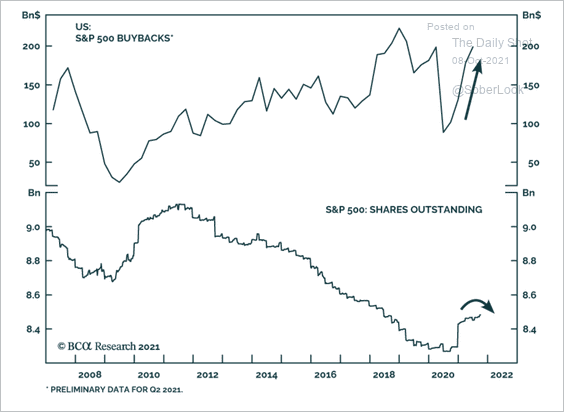
2. Buybacks are making a strong comeback, becoming a tailwind for stocks.
 Source: BCA Research
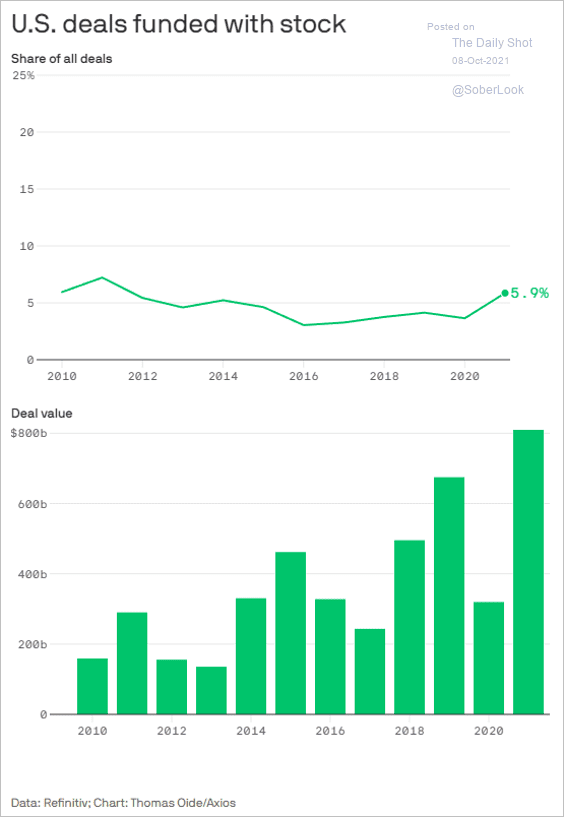
3. Many M&A deals have been funded with stock.
 Source: @axios Read full article
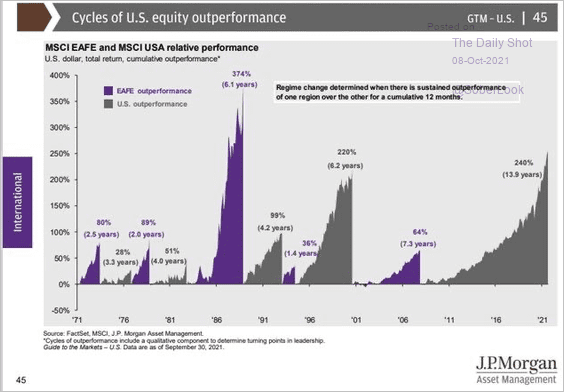
4. US equities have been outperforming EAFE for the longest time since the 1990s.
 Source: J.P. Morgan Asset Management
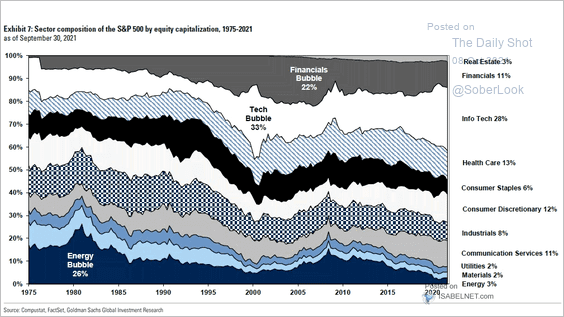
5. This chart shows the S&P 500 sector composition over time.
 Source: @ISABELNET_SA, @GoldmanSachs
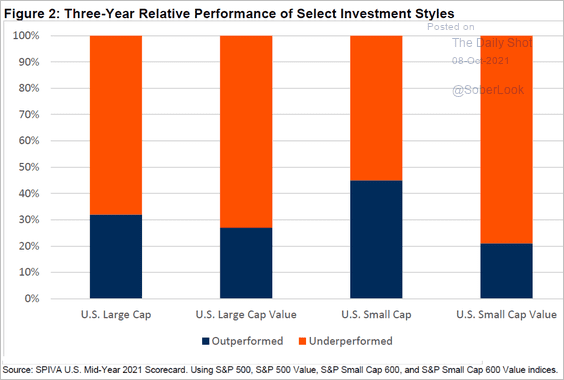
6. What percentage of active funds outperformed their benchmark over the past three years?
 Source: @ToddCFRA
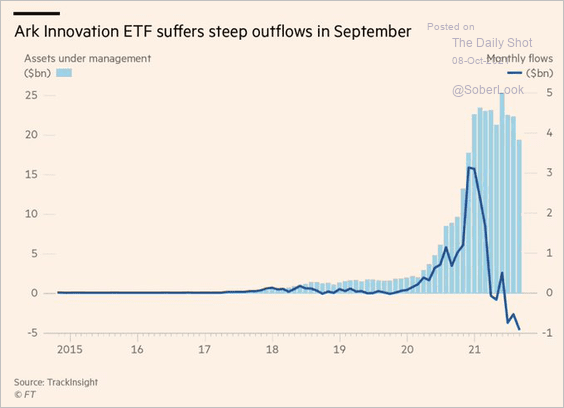
7. ARK Innovation saw some outflows last month.
 Source: @jessefelder, @FT Read full article
Back to Index
Credit
1. Let’s start with some data on CLOs.
• CLO activity:
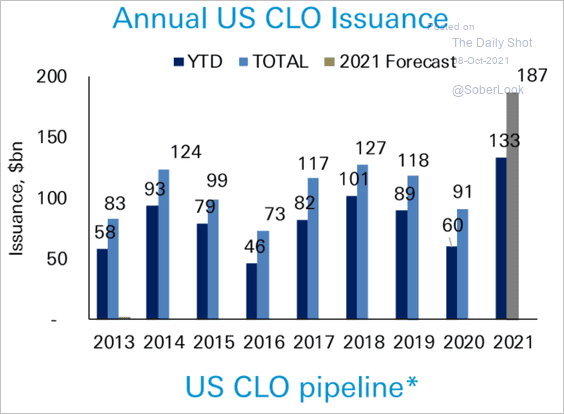 Source: Deutsche Bank Research
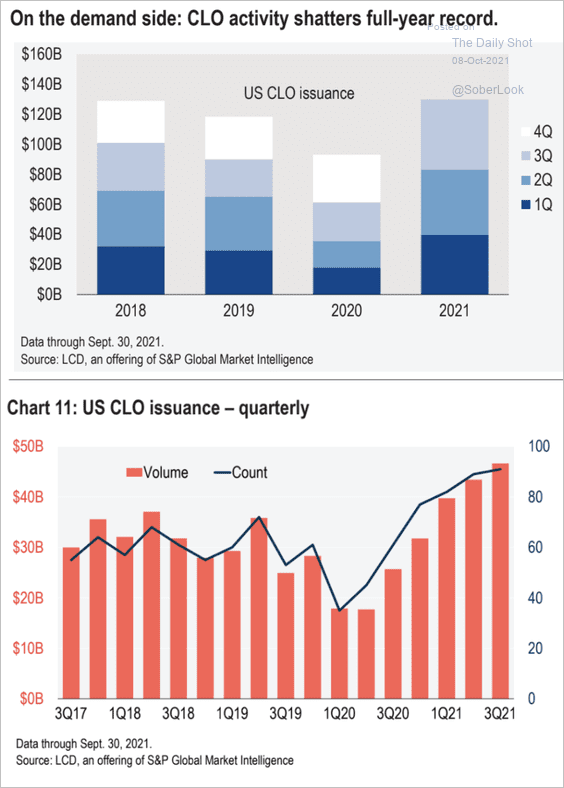 Source: S&P Global Market Intelligence
• Investment period of new deals:
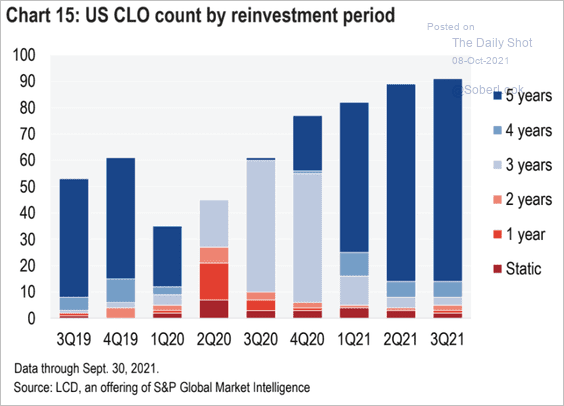 Source: S&P Global Market Intelligence
——————–
2. Loan defaults continue to decline.
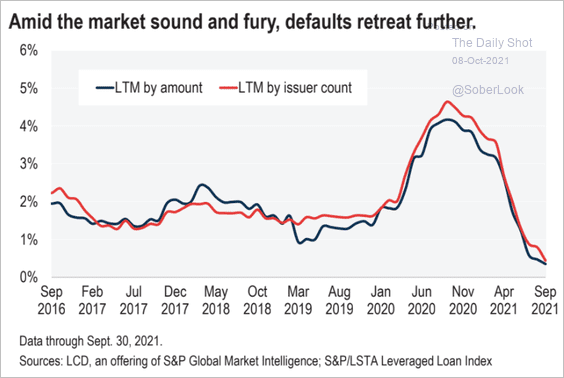 Source: S&P Global Market Intelligence
3. There has been a great deal of borrowing to fund dividend payouts.
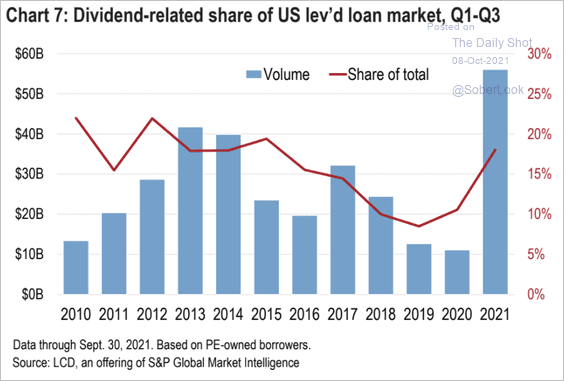 Source: S&P Global Market Intelligence
Back to Index
Global Developments
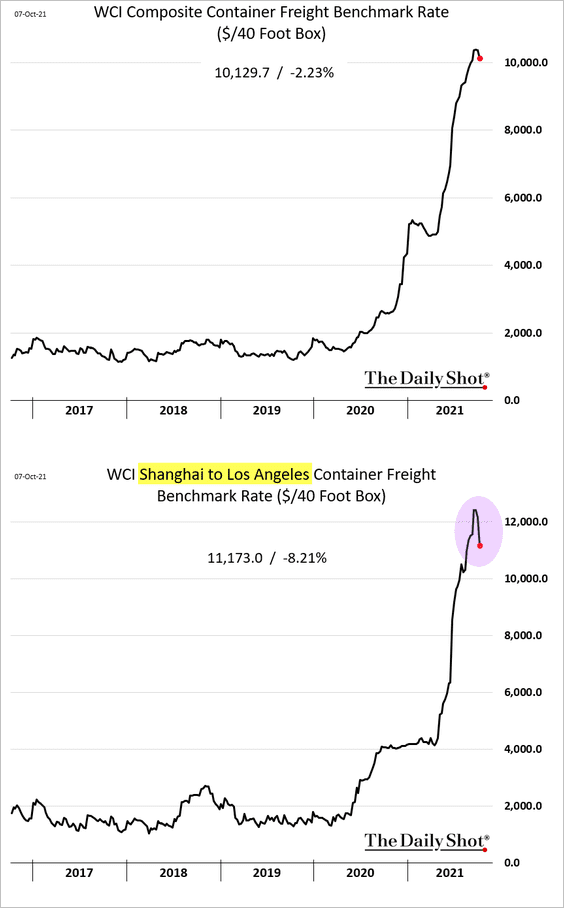
1. Container rates declined from the highs (especially China-US).
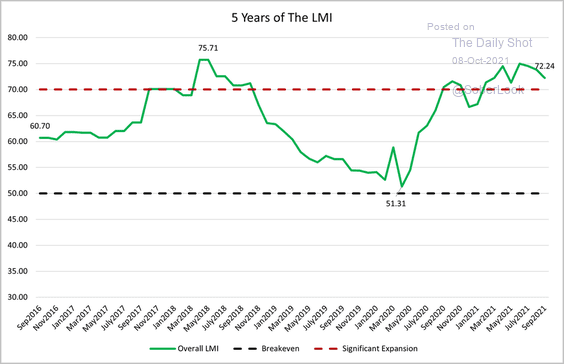
• The logistics managers’ index has recorded its longest stretch above 70, i.e. significant growth. Has the index peaked?
 Source: Logistics Managers’ Index Further reading
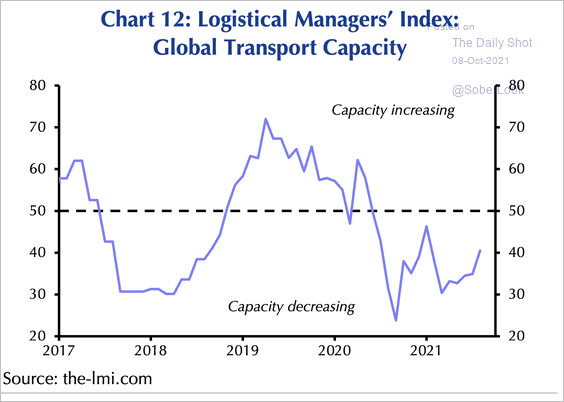
• Transportation capacity is struggling, but the declines have been moderating (a reading above 50 would indicate capacity is expanding again).
 Source: Capital Economics
——————–
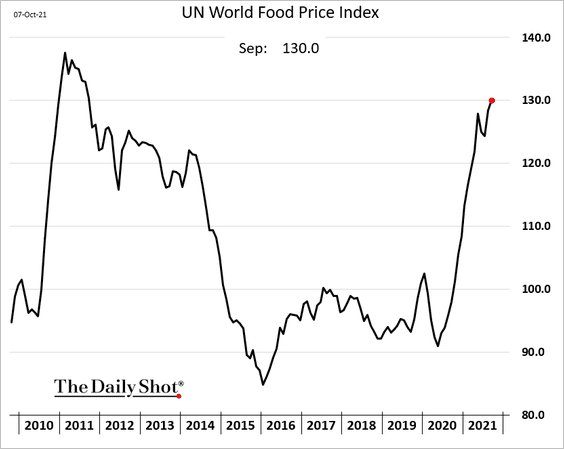
2. The global food price index continues to surge.
3. The rise in the stock/bond correlation points to greater sensitivity of the dollar to nominal yields.
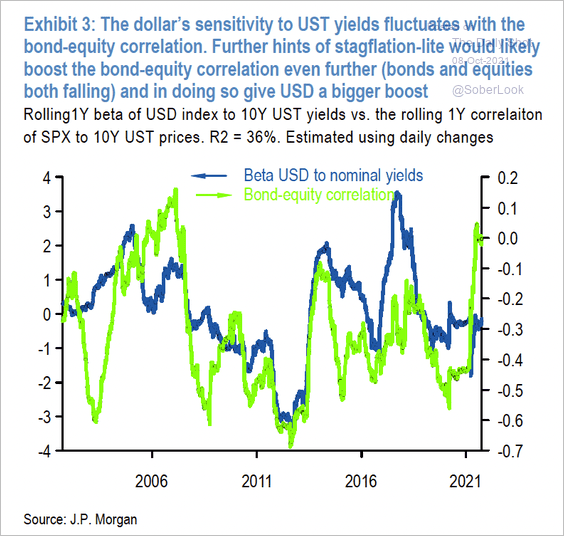 Source: JPMorgan
——————–
Food for Thought
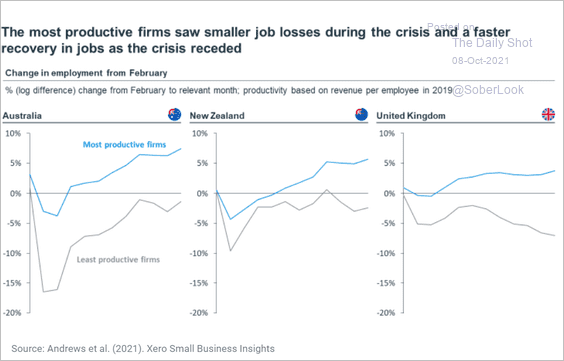
1. Job losses and gains at the most productive firms:
 Source: OECD Read full article
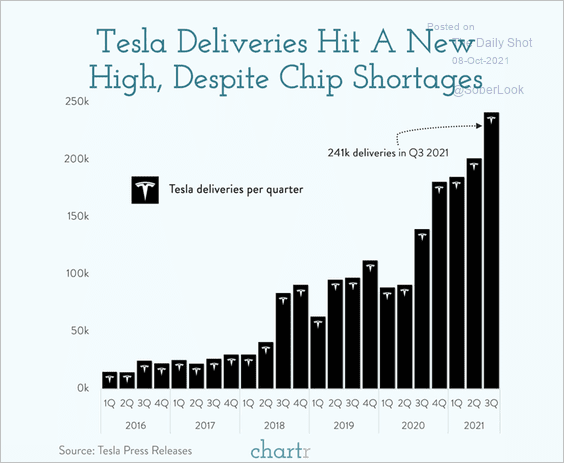
2. Tesla deliveries:
 Source: @chartrdaily
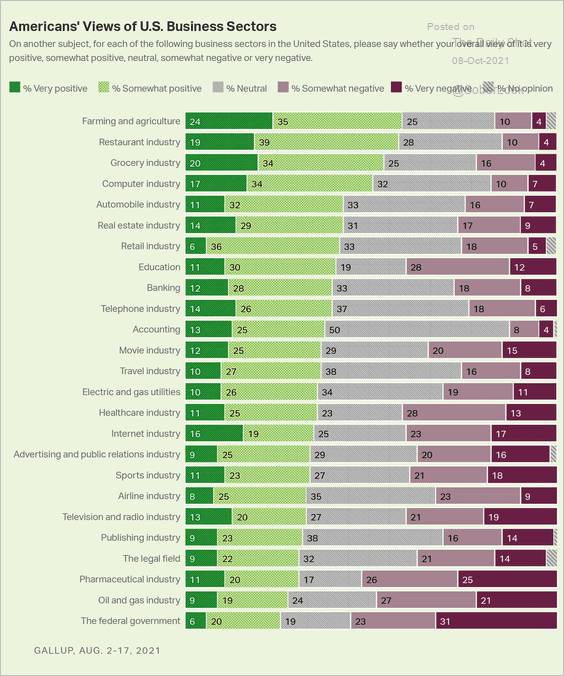
3. Americans’ views of business sectors:
 Source: Gallup Read full article
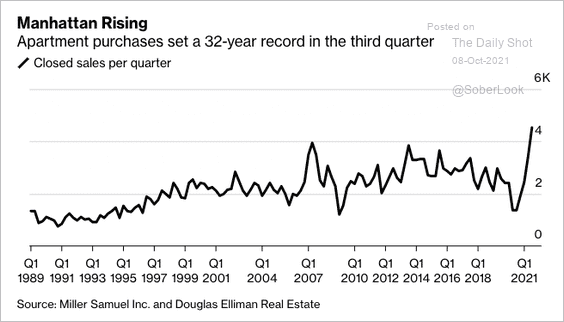
4. Manhattan apartment sales:
 Source: Bloomberg Read full article
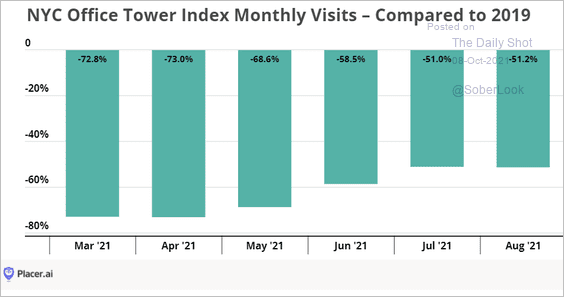
• New York City office visits (vs. 2019):
 Source: Placer.ai
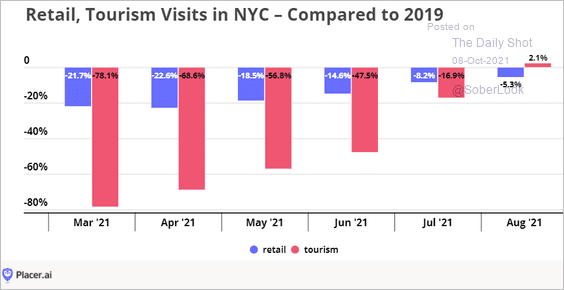
• New York City retail and tourism visits:
 Source: Placer.ai
——————–
5. The global semiconductor sector:
![]() Source: The Economist Read full article
Source: The Economist Read full article
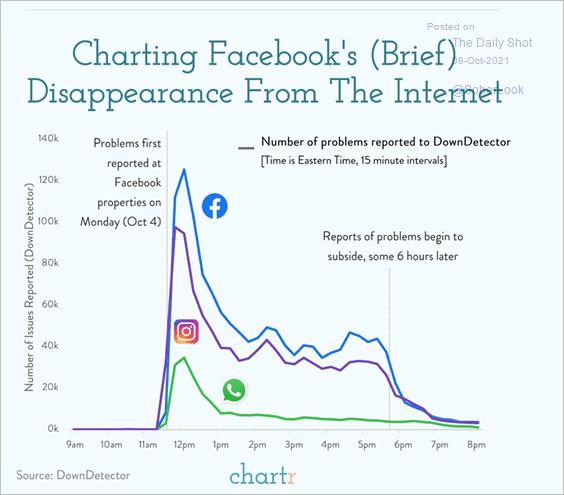
6. Facebook’s outage:
 Source: @chartrdaily
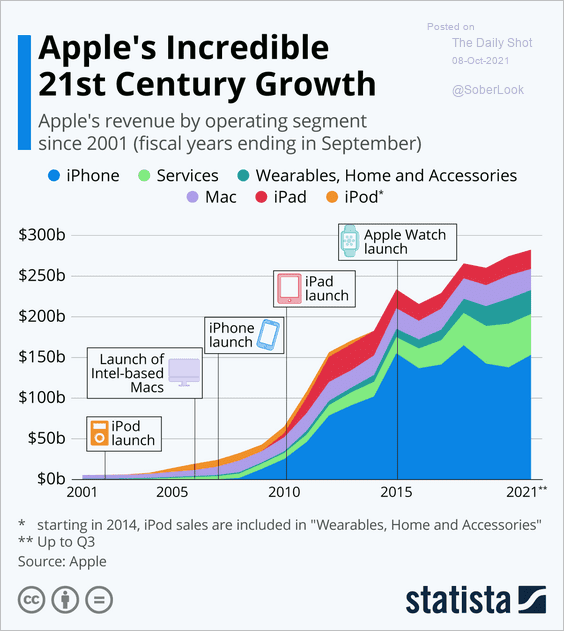
7. Apple’s growth:
 Source: Statista
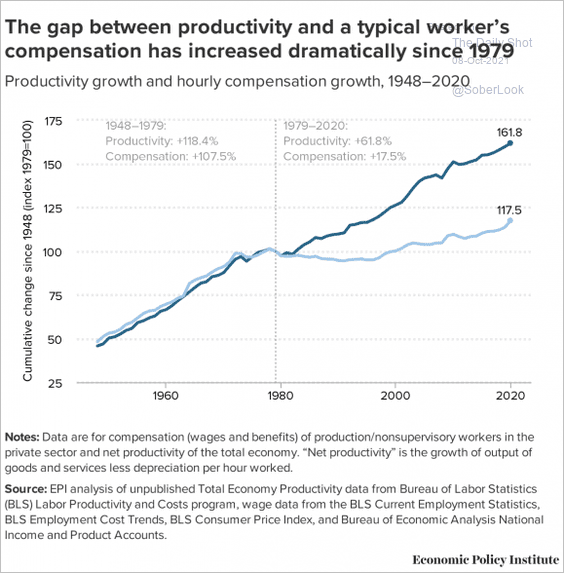
8. Productivity vs. compensation:
 Source: EPI
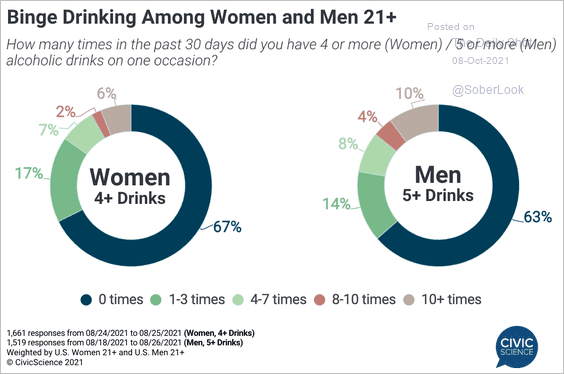
9. Binge drinking:
 Source: @CivicScience
——————–
Have a great weekend!
Back to Index
