
The Daily Shot: 08-Dec-21
• The United States
• Canada
• The United Kingdom
• The Eurozone
• Japan
• Asia – Pacific
• China
• Emerging Markets
• Energy
• Equities
• Credit
• Rates
• Global Developments
• Food for Thought
The United States
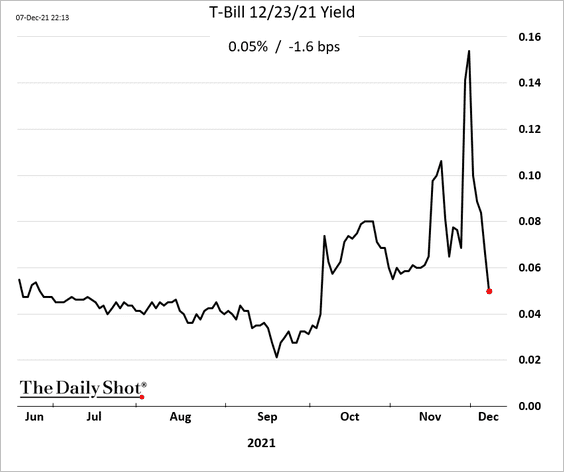
1. It appears that the debt ceiling showdown has been averted for now.
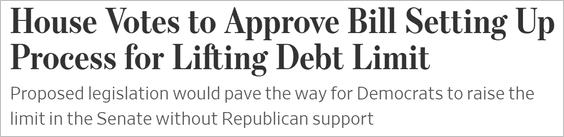 Source: @WSJ Read full article
Yields on short-term Treasury bills declined.
By the way, this article provides a hypothetical timeline of what would happen if the federal government went over the precipice.
 Source: Reuters Read full article
——————–
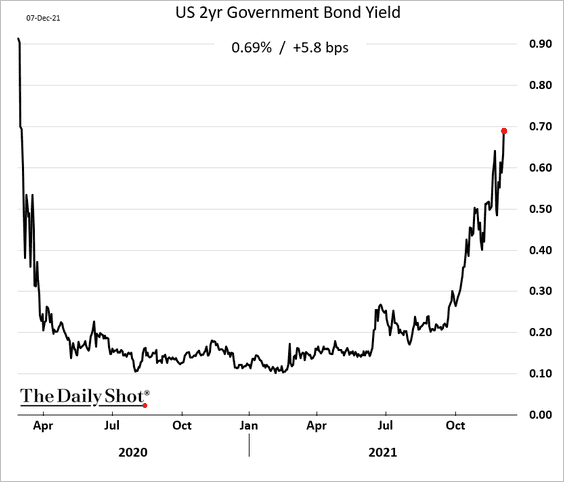
2. The two-year Treasury yield hit the highest level of the cycle on expectations for faster rate hikes ahead.
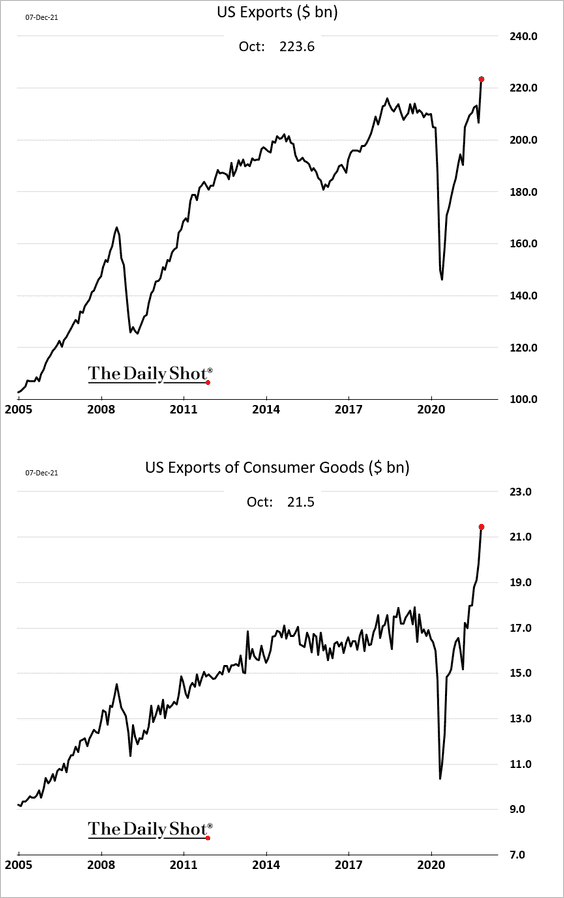
3. The trade deficit declined sharply in October, …
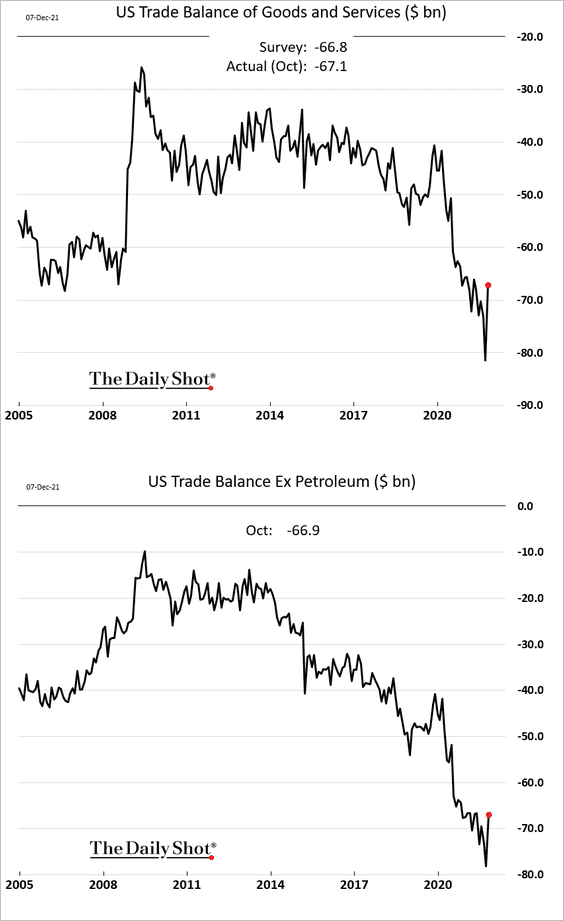
… as US exports hit a record high. Maintaining this trend may be challenging if the US dollar strengthens further.
 Source: Reuters Read full article
——————–
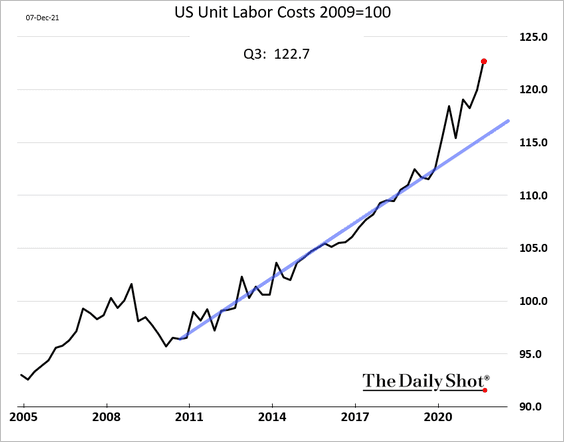
4. Unit labor costs surged since the start of the pandemic.
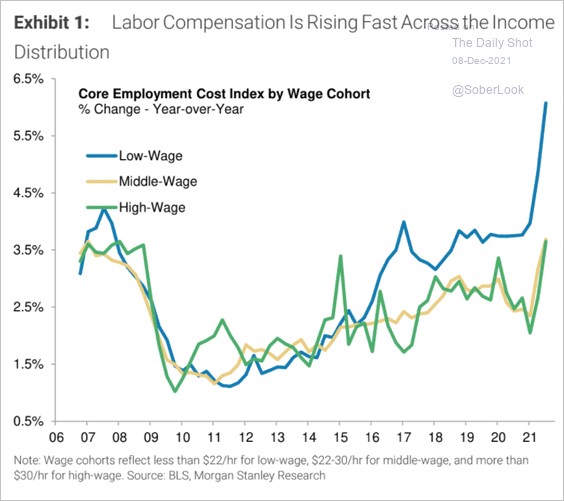
Labor costs for low-wage workers accelerated.
 Source: Morgan Stanley Research
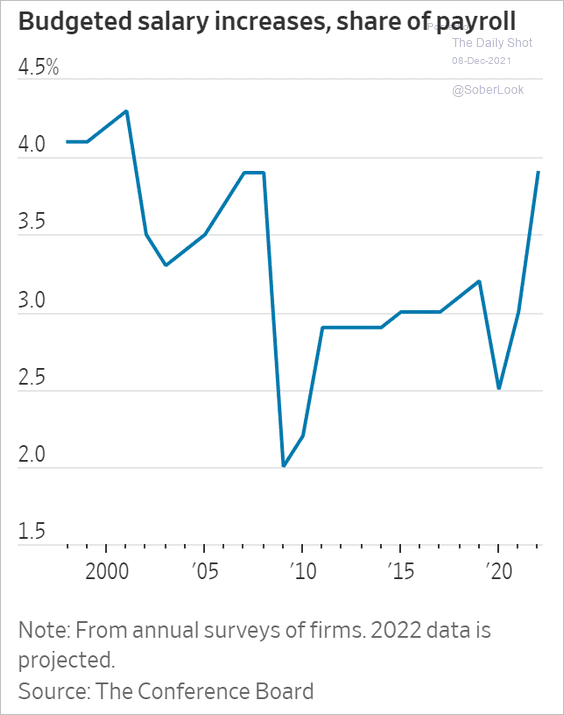
And companies expect to spend more on wages next year.
 Source: @WSJ Read full article
5. Labor productivity declined sharply in Q3 as more Americans returned to work.
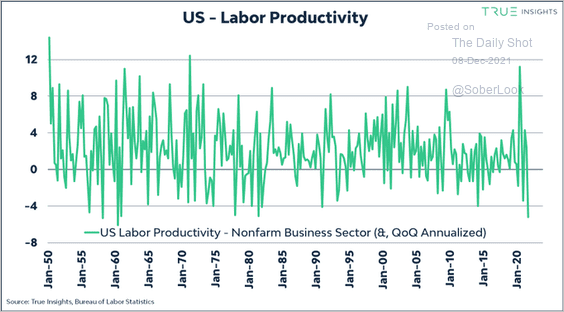 Source: @true_insights_
——————–
6. Next, we have some updates on inflation.
• Longer-term inflation expectations remain stable.
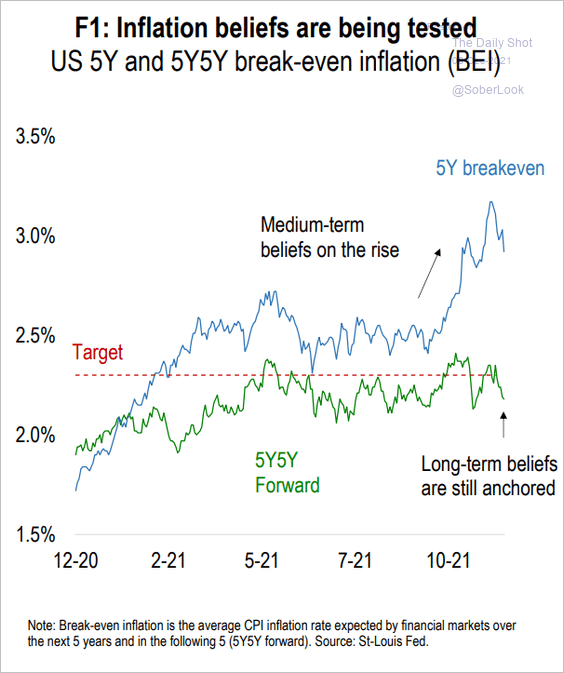 Source: Numera Analytics
• Deutsche Bank expects the GDP deflator to rise by 6% this year.
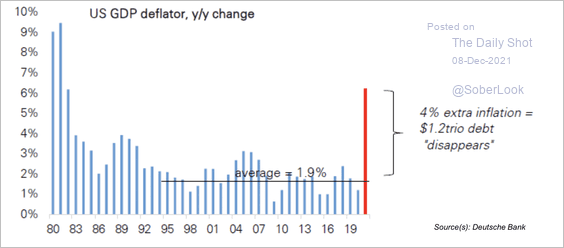 Source: Deutsche Bank Research
• The ISM Services PMI price index points to CPI remaining elevated over the next few months.
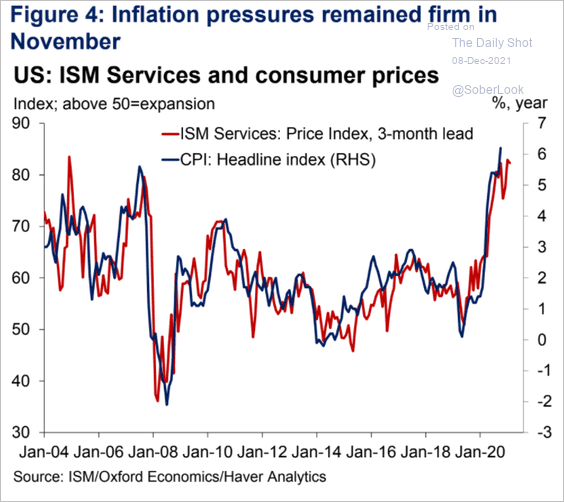 Source: Oxford Economics
• The November CPI print is expected to hit 6.8% (year-over-year).
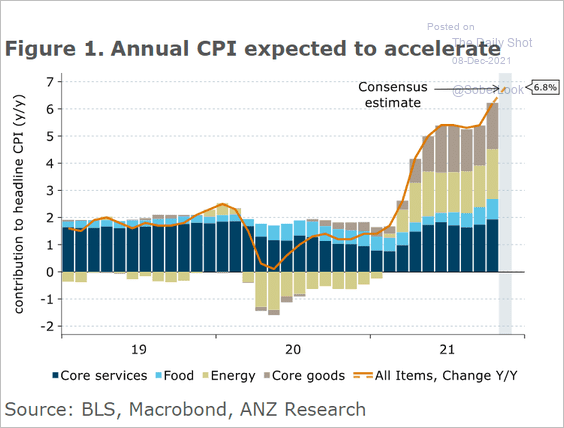 Source: ANZ Research
• The output gap is closing quickly, and some economists believe that it’s already closed (which tends to be inflationary).
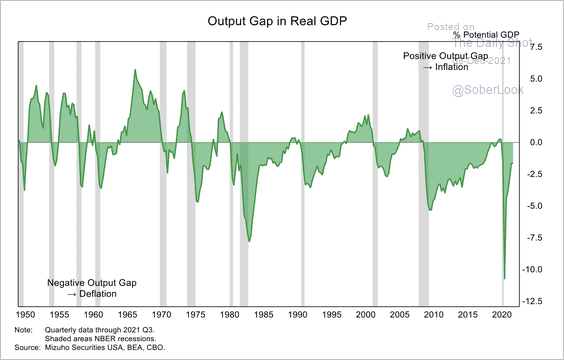 Source: Mizuho Securities USA
——————–
7. Next, let’s take a look at supply-chain bottlenecks.
• The Fed’s Beige Book survey points to easing concerns about supply issues.
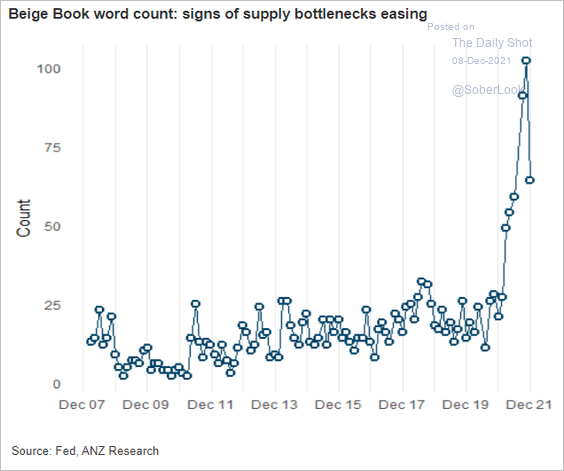 Source: ANZ Research
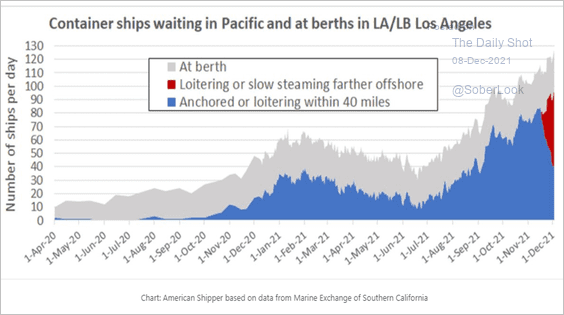
• We continue to see lower numbers of container vessels waiting to unload at US West Coast ports.
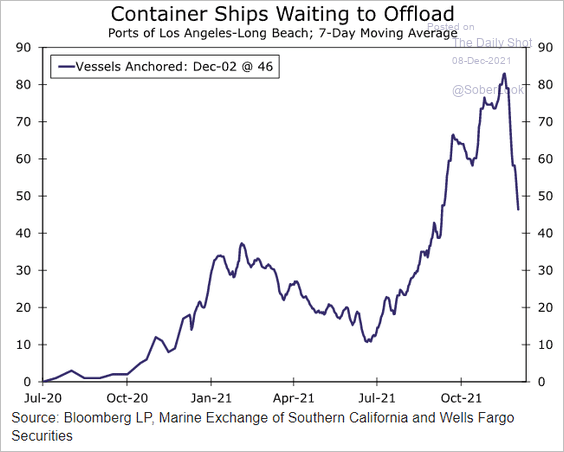 Source: Wells Fargo Securities
However, it’s all about how ships are counted. A broader count suggests that the logjam remains acute.
 Source: American Shipper Read full article
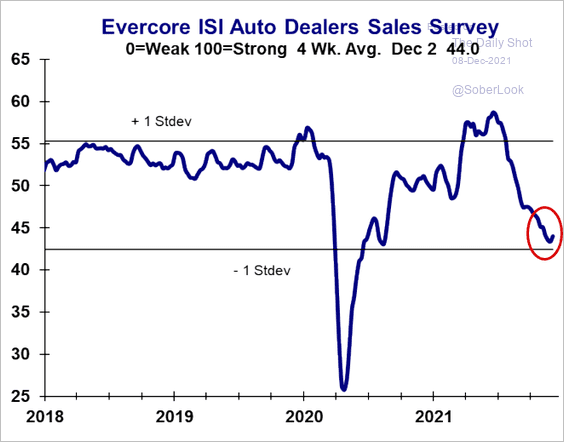
• The Evercore ISI auto dealers sales index appears to have bottomed.
 Source: Evercore ISI
• The Oxford Economics supply chain stress tracker remains near the highs.
![]() Source: @GregDaco
Source: @GregDaco
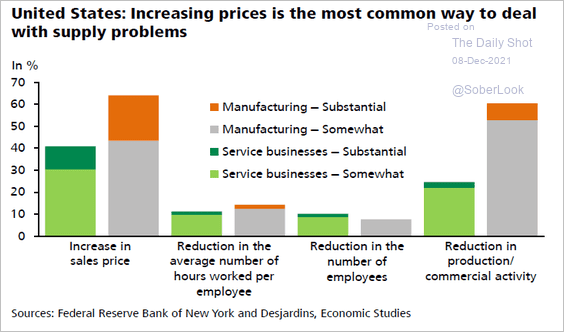
• How does your company deal with supply problems?
 Source: Desjardins
——————–
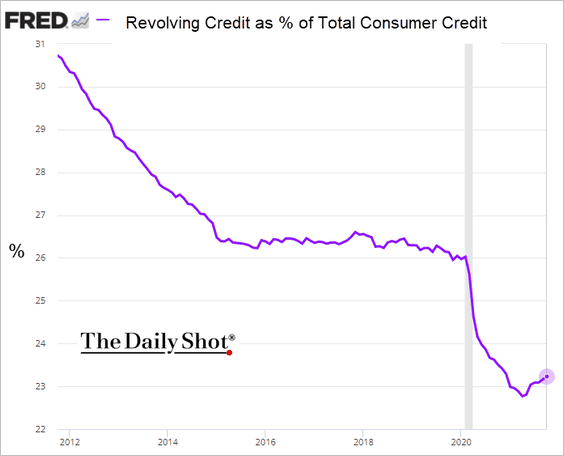
6. US credit card debt is recovering but remains well below pre-COVID levels (as a share of total consumer credit).
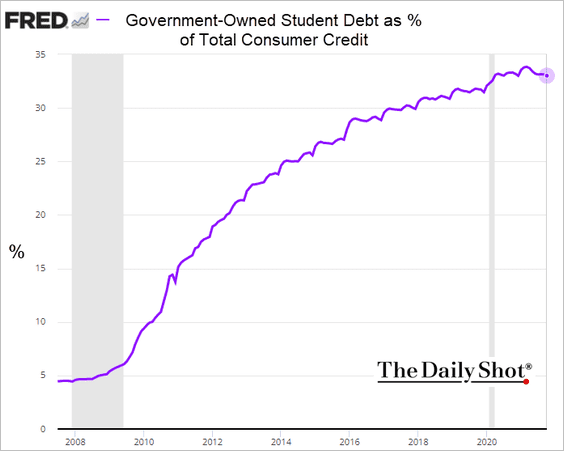
Student debt as a share of total consumer credit seems to have peaked.
Back to Index
Canada
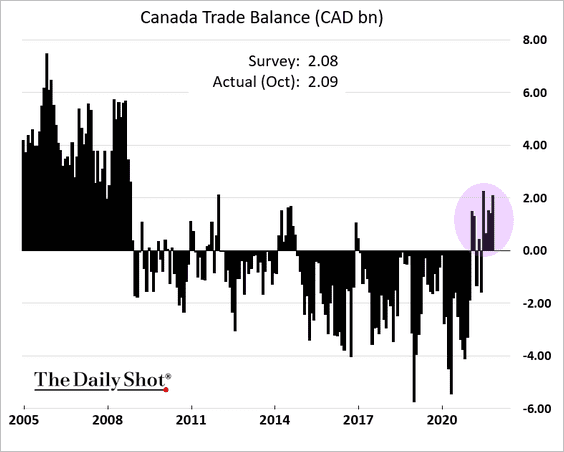
1. The trade balance remains in surplus amid robust demand from the US.
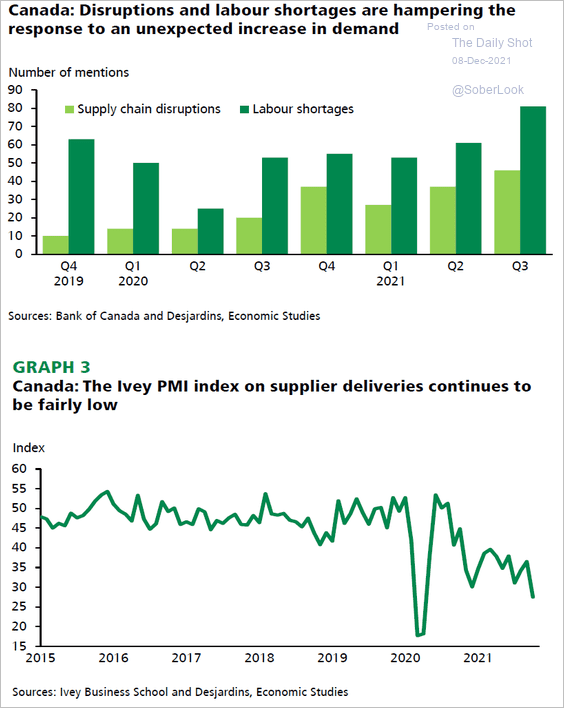
2. Supply disruptions and labor shortages have been a drag on output.
 Source: Desjardins
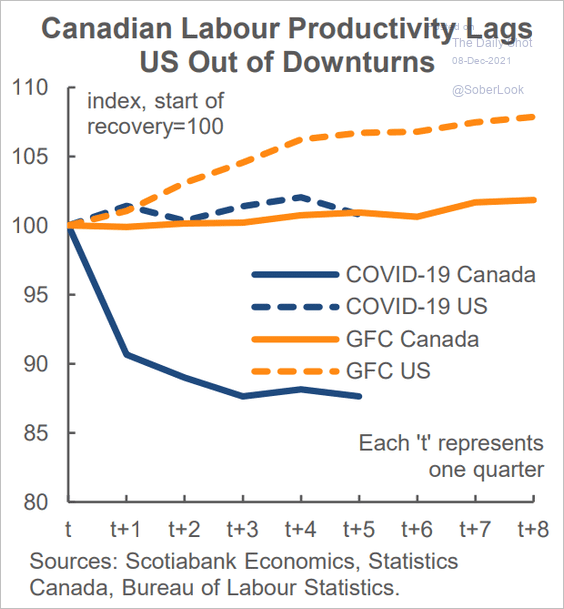
3. Labor productivity during recoveries has lagged the US.
 Source: Scotiabank Economics
4. Inflation expectations have been surging.
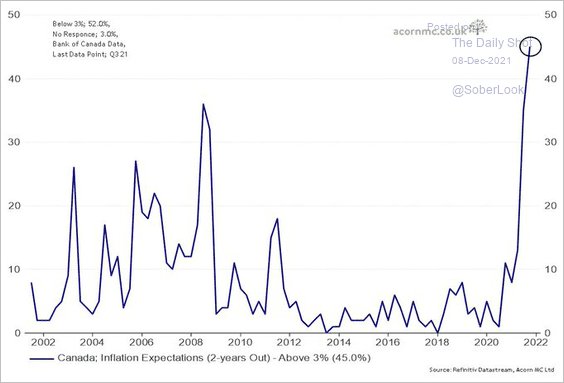 Source: @RichardDias_CFA
5. Can households withstand an aggressive rate hiking cycle from the BoC?
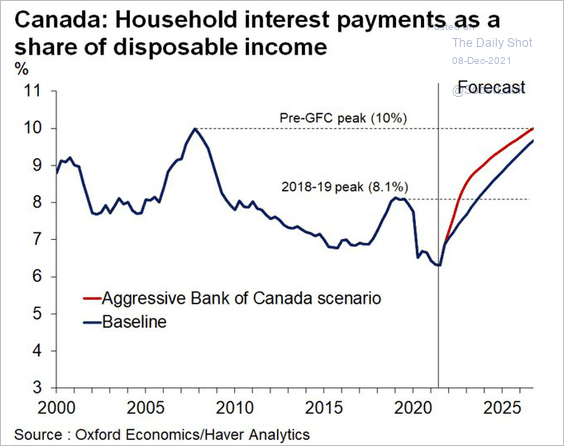 Source: @GregDaco Read full article
Back to Index
The United Kingdom
1. The pound has been following real rate differentials with the US.
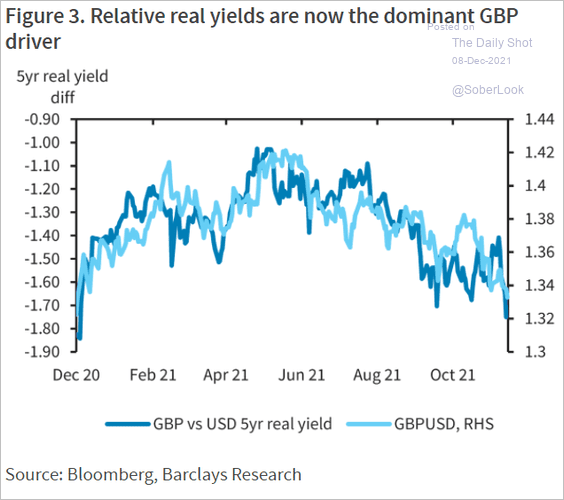 Source: Barclays Research
2. Speculative accounts have been very bearish on the pound.
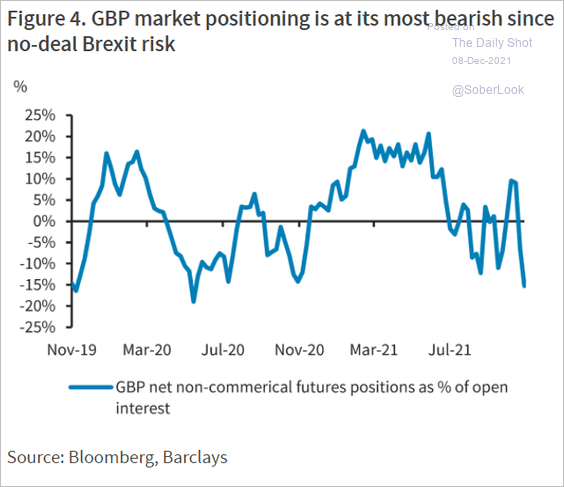 Source: Barclays Research
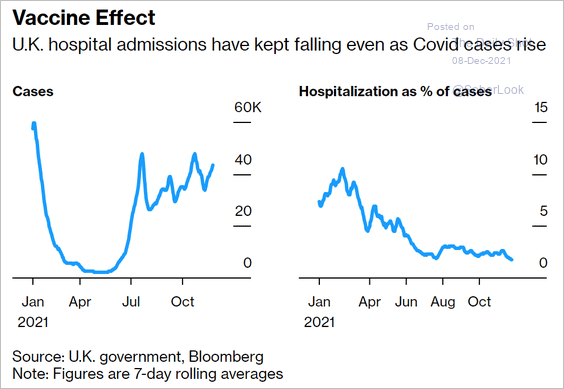
3. The vaccination program has successfully kept people out of the hospital despite the recent surge in COVID cases.
 Source: Bloomberg Read full article
Back to Index
The Eurozone
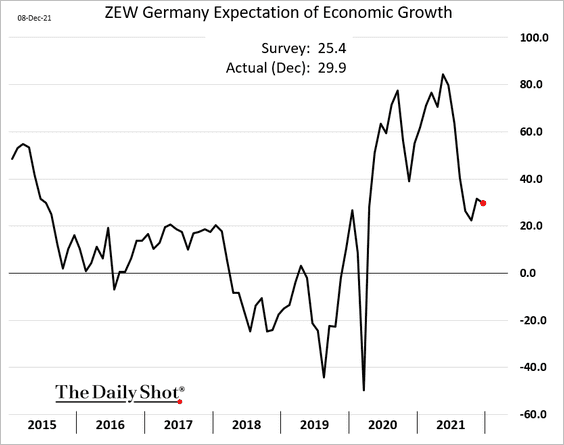
1. Germany’s ZEW expectations of economic growth are holding up.
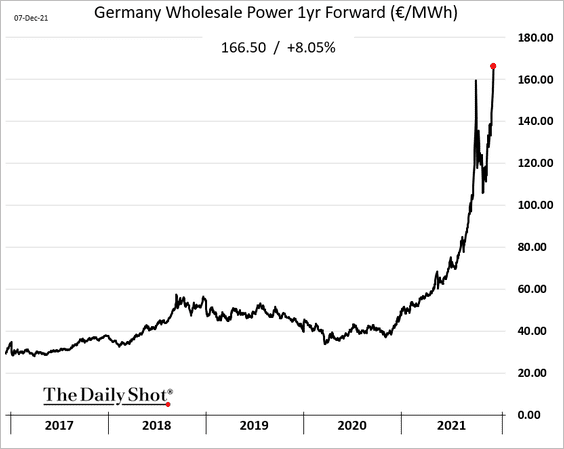
2. This chart shows wholesale electricity prices in Germany for contracts one year out. This trend will continue to feed into producer and consumer prices for months.
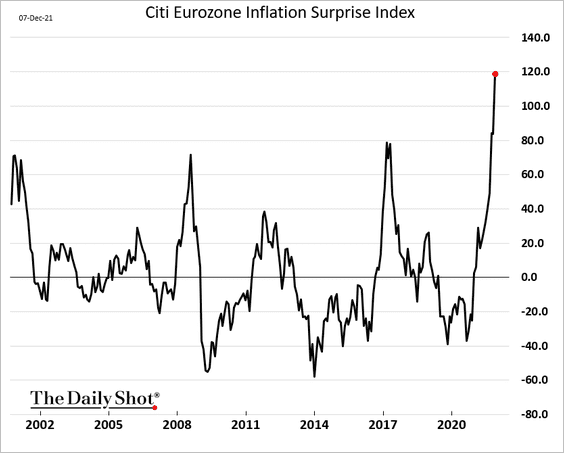
3. The Citi Eurozone Inflation Surprise Index hit a record high in November.
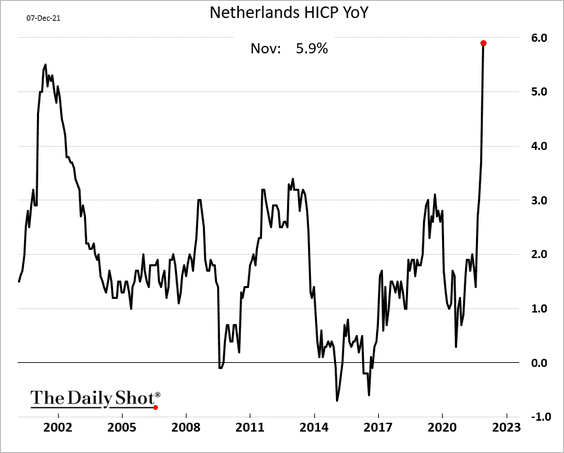
Here is the Dutch CPI.
——————–
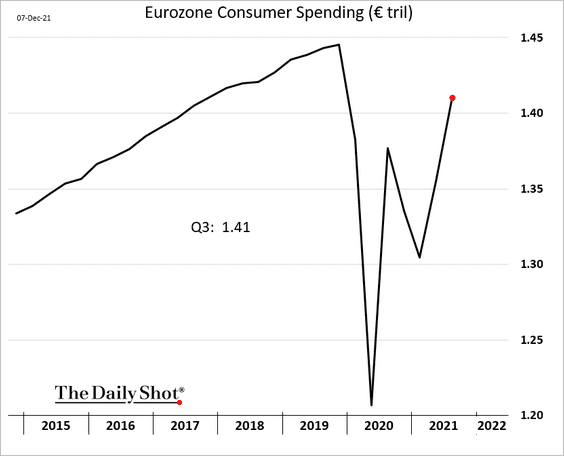
4. Consumer spending drove the GDP growth in Q3.
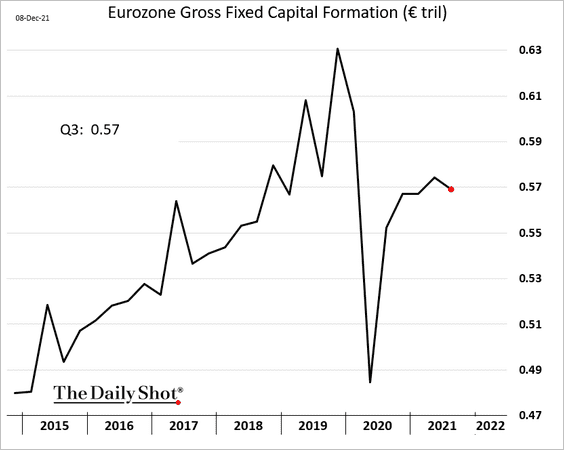
On the other hand, business investment was soft last quarter.
Back to Index
Japan
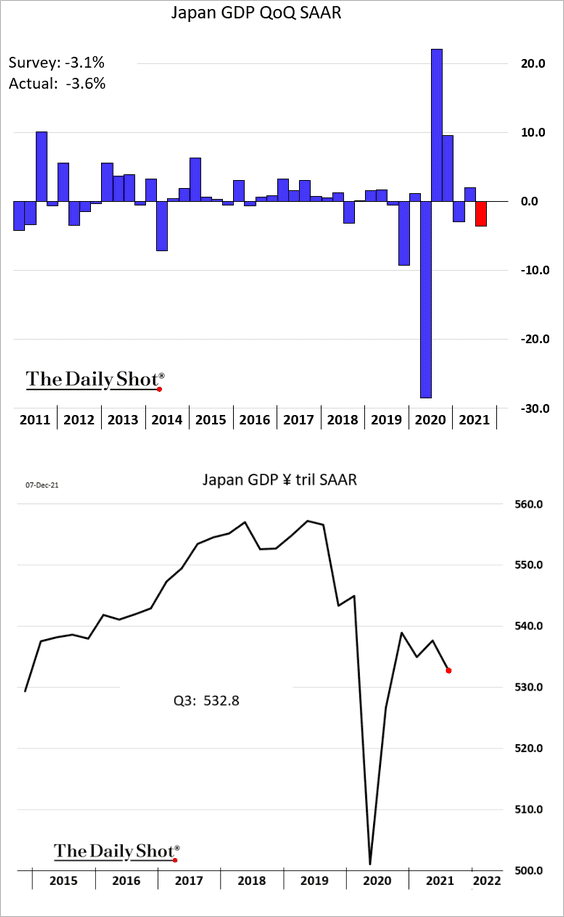
1. The Q3 GDP growth was revised lower.
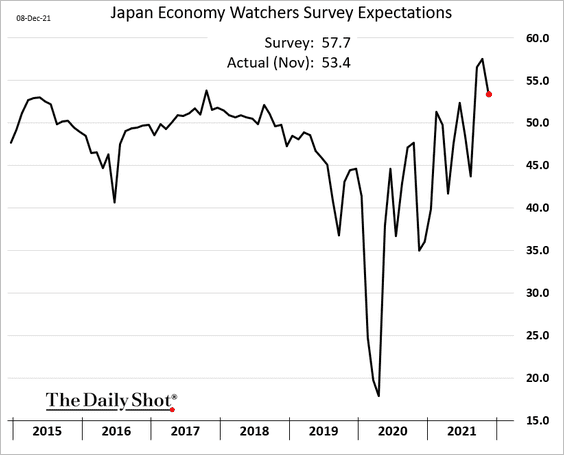
2. The Economy Watchers Expectations Index is off the highs but remains robust.
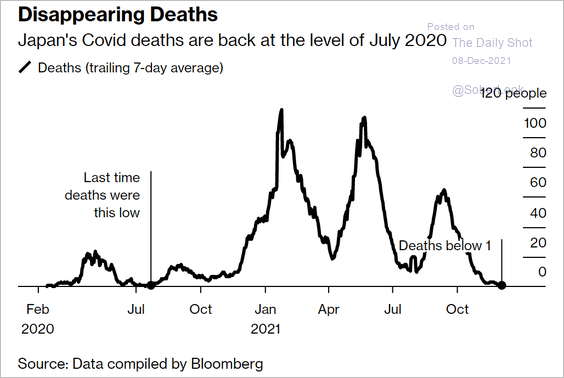
3. COVID deaths have collapsed.
 Source: Bloomberg Read full article
Back to Index
Asia – Pacific
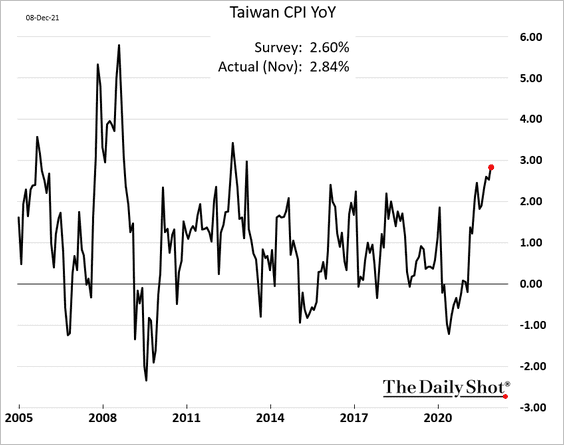
1. Taiwan’s CPI reached the highest level since 2013.
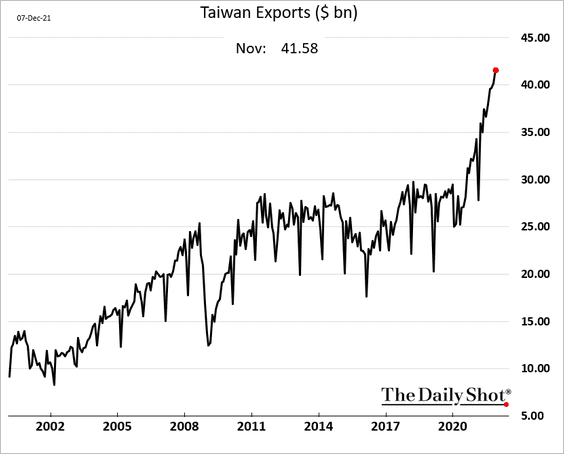
Taiwan’s exports hit another record high.
——————–
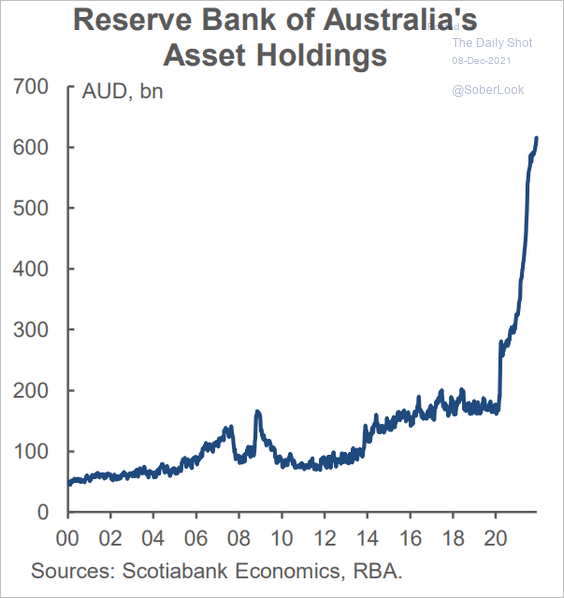
2. This chart shows the RBA’s asset holdings.
 Source: Scotiabank Economics
Back to Index
China
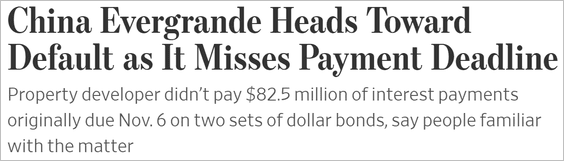
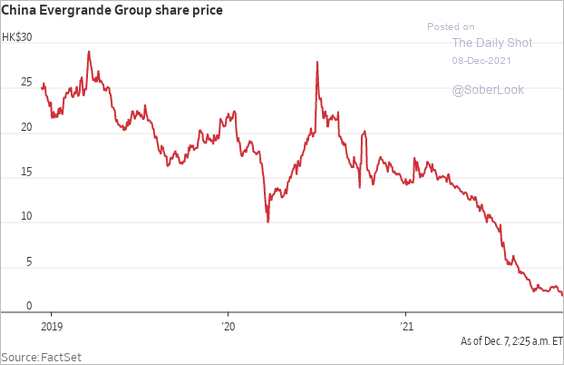
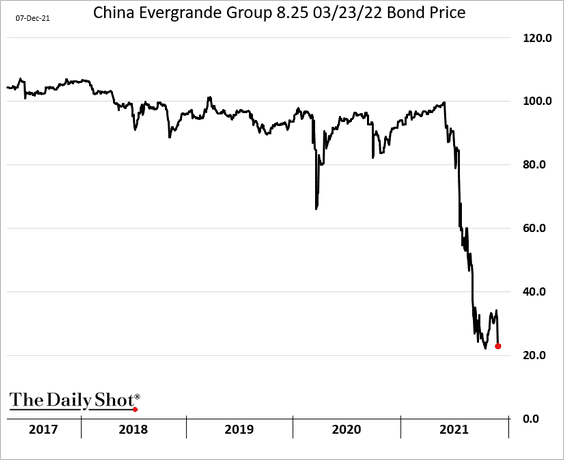
1. The developer credit crisis continues to unfold.
• Evergrande:
 Source: @WSJ Read full article
– Share price:
 Source: @WSJ Read full article
– Bonds:
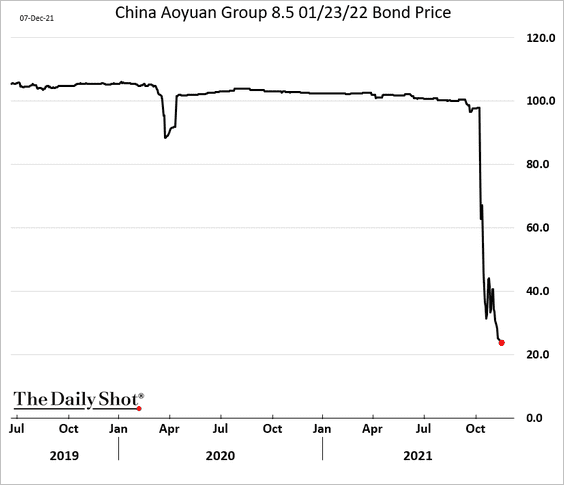
• Aoyuan:
 Source: Fitch Ratings Read full article
——————–
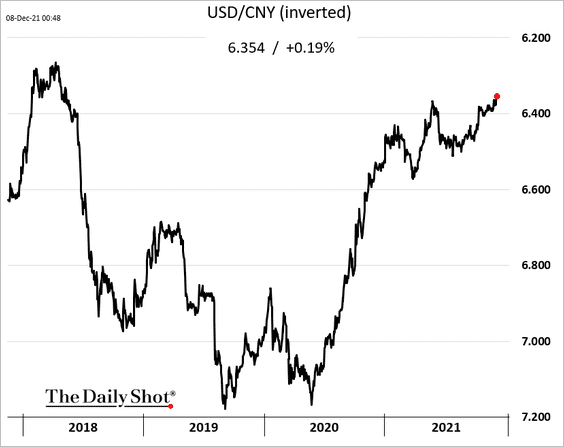
2. The renminbi hit the highest level against the dollar since 2018.
3. This chart shows China’s GDP growth across the various political cycles.
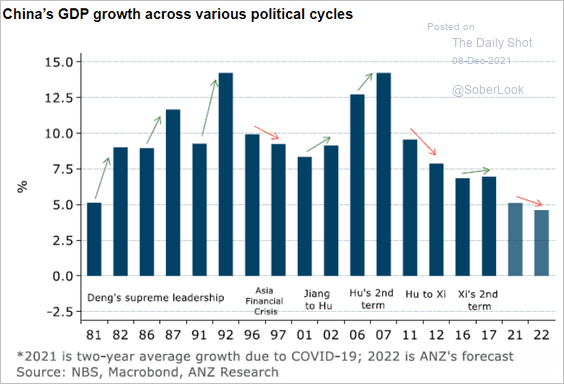 Source: ANZ Research
4. China’s government bonds have outperformed EM and US debt.
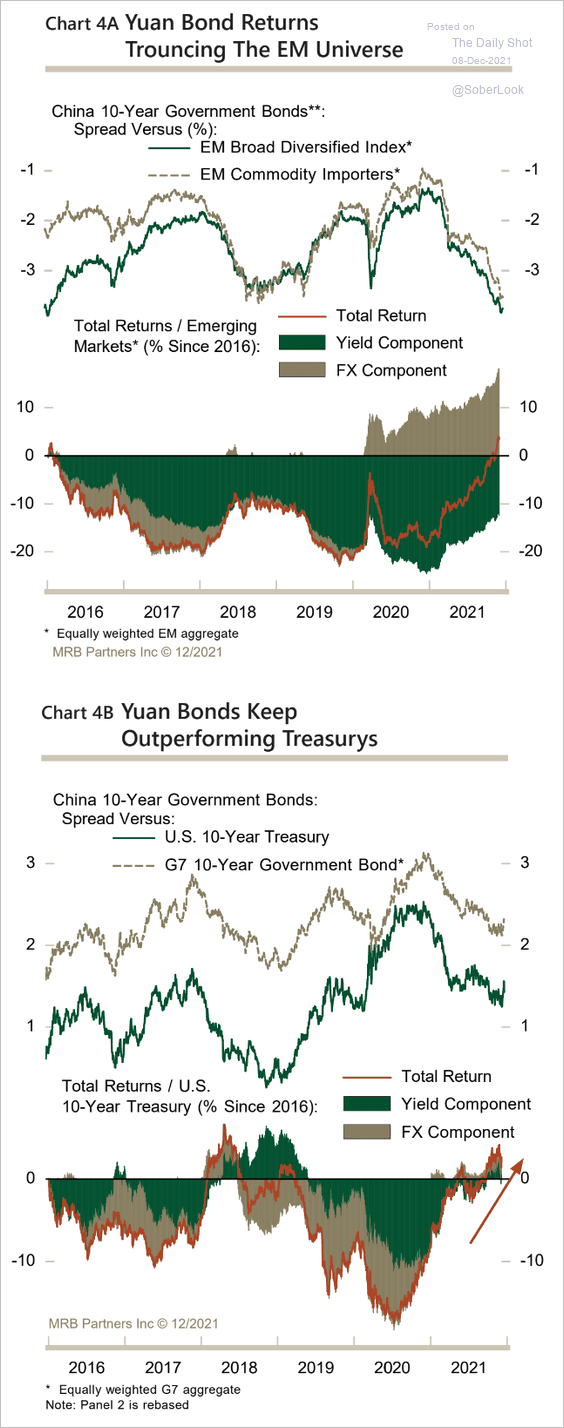 Source: MRB Partners
Back to Index
Emerging Markets
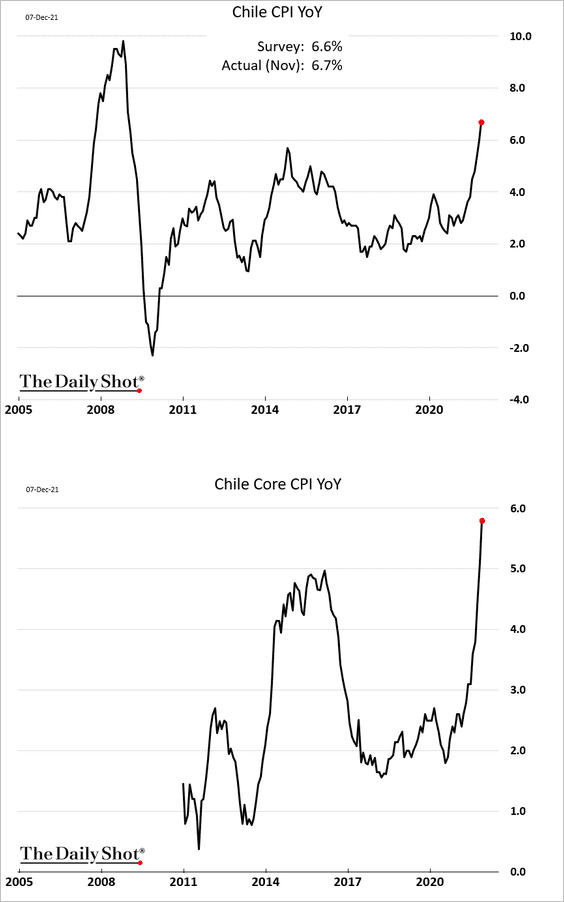
1. Chile’s CPI continues to climb.
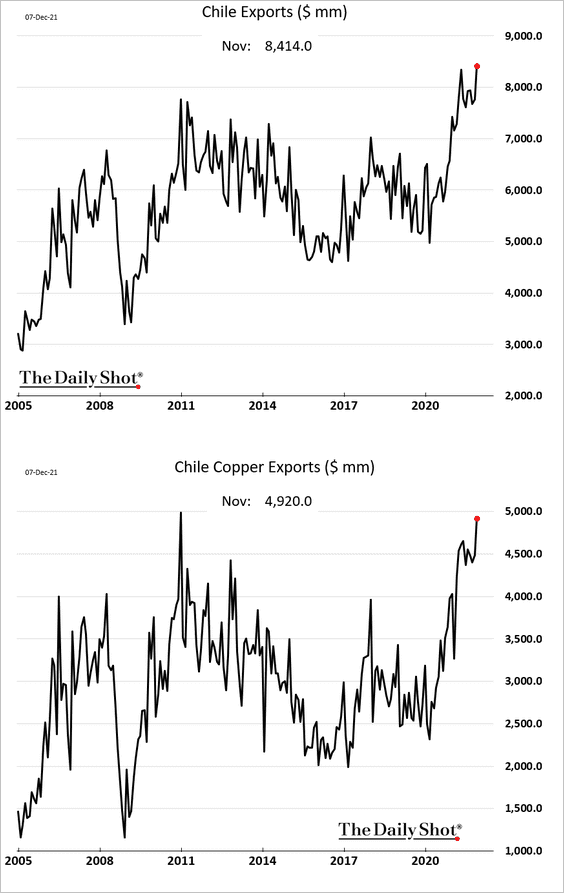
Exports hit a record high.
——————–
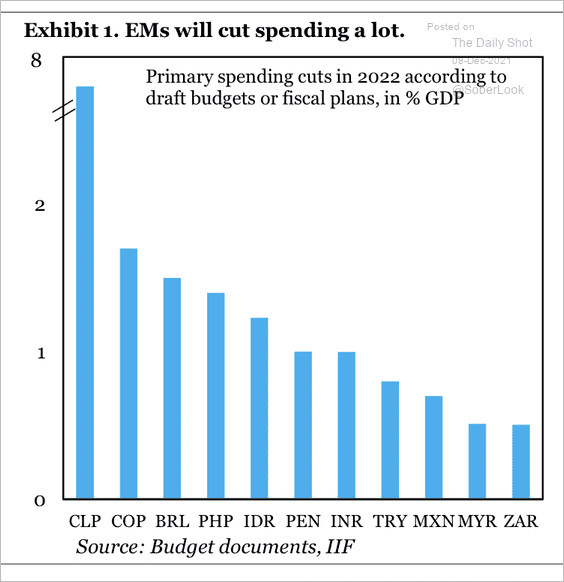
2. Many EM countries will roll back pandemic-related stimulus next year.
 Source: IIF
 Source: IIF
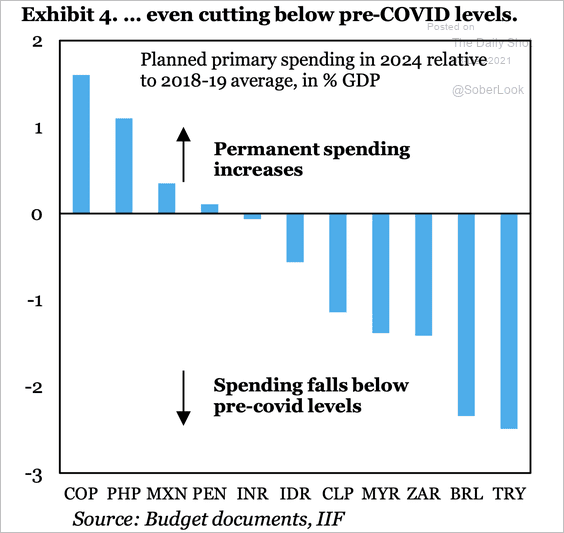
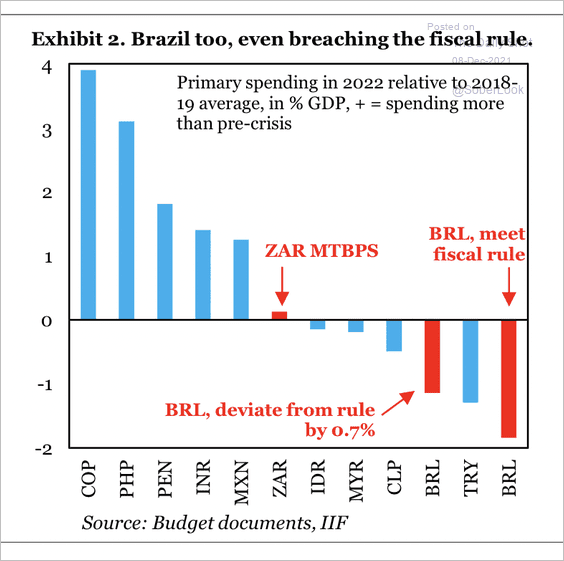
Brazil will cut government spending more than most EM countries even if the fiscal rule is breached.
 Source: IIF
——————–
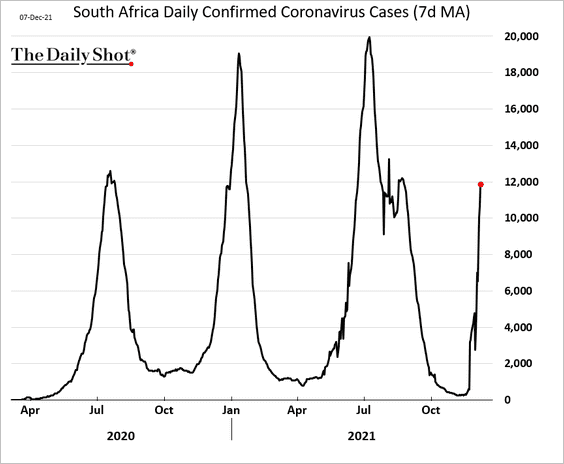
3. South Africa’s GDP is nearing full recovery.
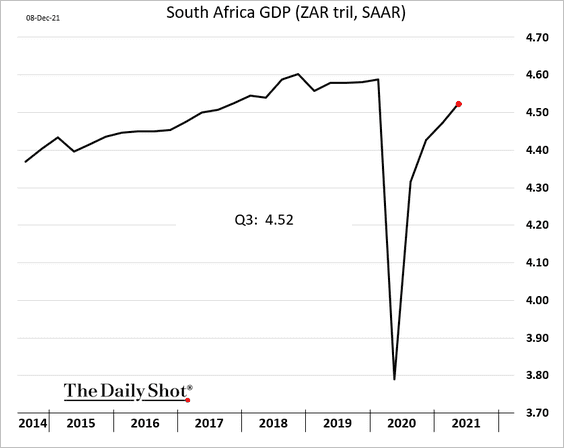
The fourth COVID wave is rising rapidly.
——————–
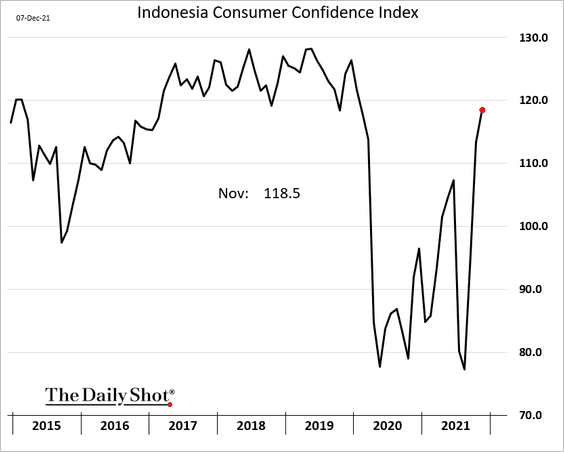
4. Indonesia’s consumer confidence is rebounding.
5. Vietnam’s private consumption remains depressed.
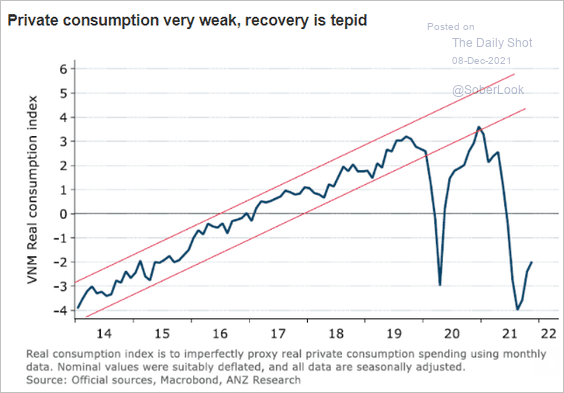 Source: ANZ Research
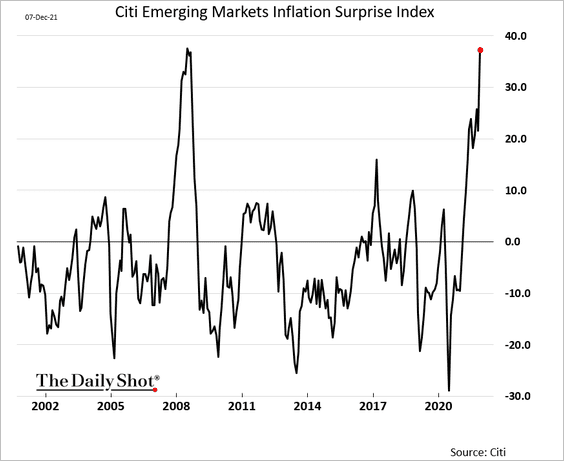
6. Here is the Citi EM Inflation Surprise Index through November.
Back to Index
Energy
1. Oil demand is approaching pre-pandemic levels, especially in Asia (2 charts).
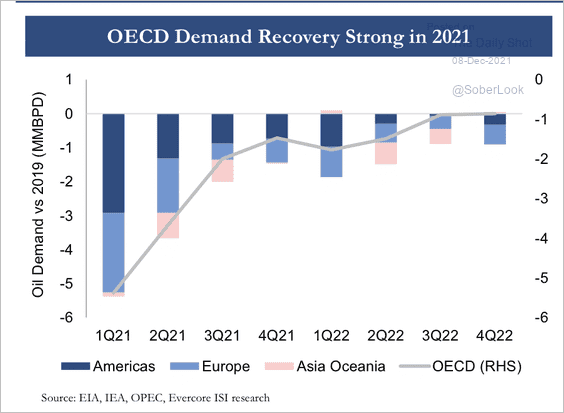 Source: Evercore ISI Research
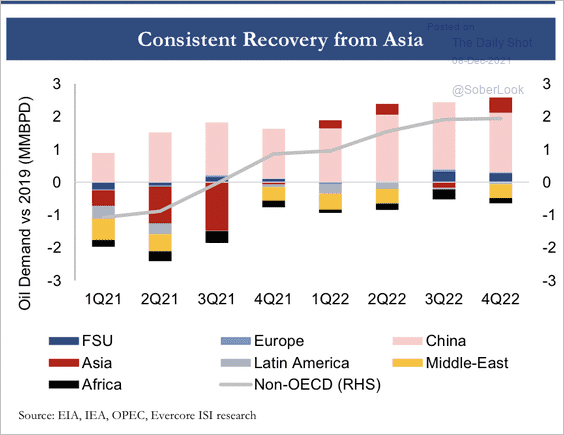 Source: Evercore ISI Research
——————–
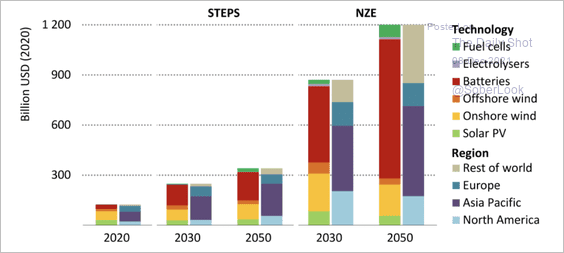
2. This chart shows the estimated market size for select clean energy technologies by region.
 Source: @EIAgov
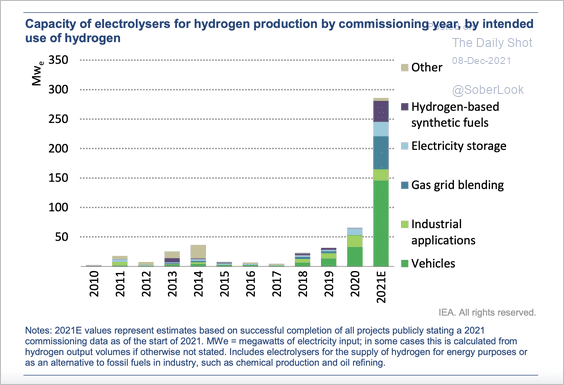
3. Investment in hydrogen production has exploded.
 Source: International Energy Agency
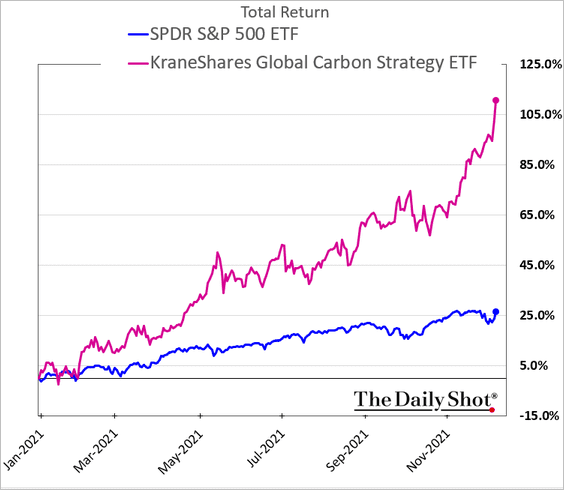
4. The European carbon market surge sent the global carbon strategy ETF to new highs.
 h/t Walter
Back to Index
Equities
1. Stock indices rose sharply on Tuesday as semiconductor shares surged.
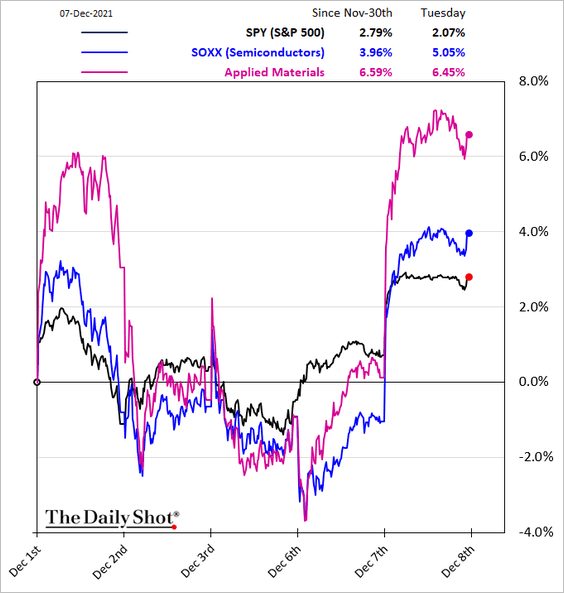
Energy stocks outperformed, as crude oil rebounded.
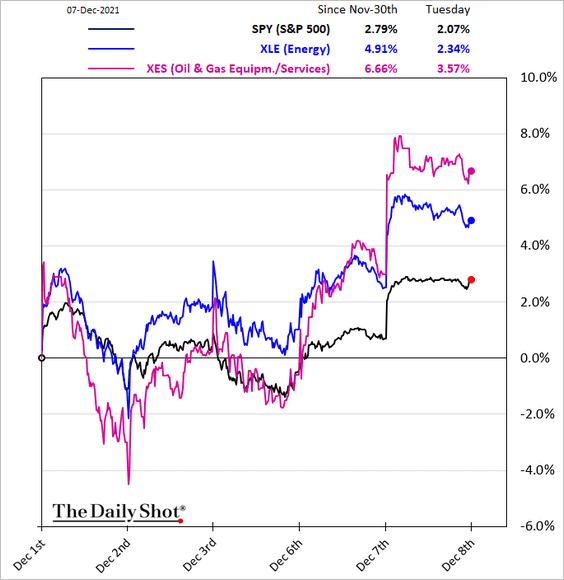
Speculative growth stocks jumped.
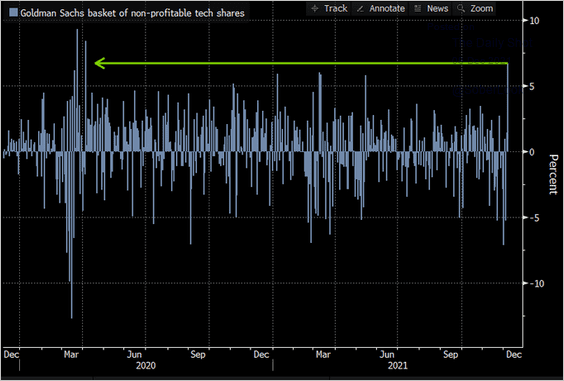 Source: @kgreifeld
——————–
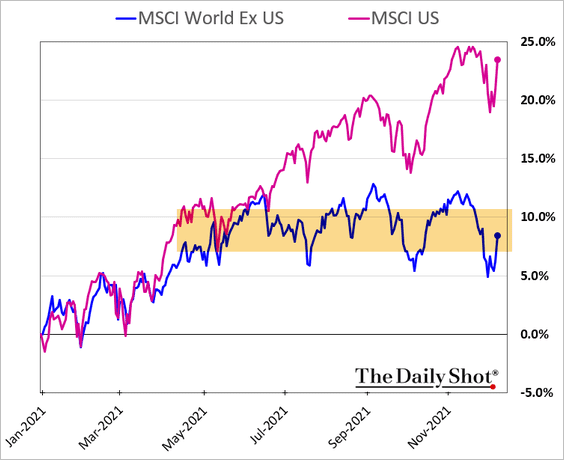
2. Excluding the US, global stocks have been flat since April.
3. The SPDR S&P 500 ETF (SPY) appears overbought relative to the iShares 20+ year Treasury ETF (TLT).
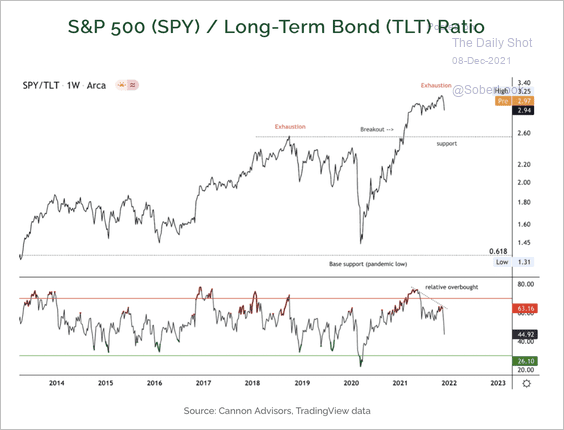 Source: Cannon Advisors
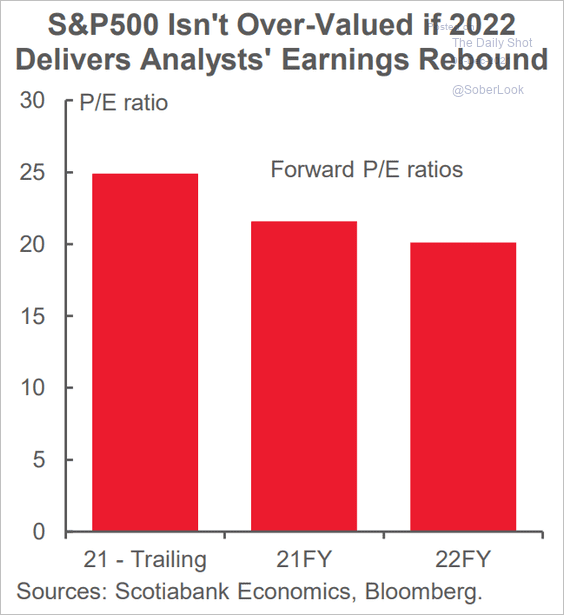
4. Valuations are not stretched if companies deliver the 2022 earnings projected by analysts.
 Source: Scotiabank Economics
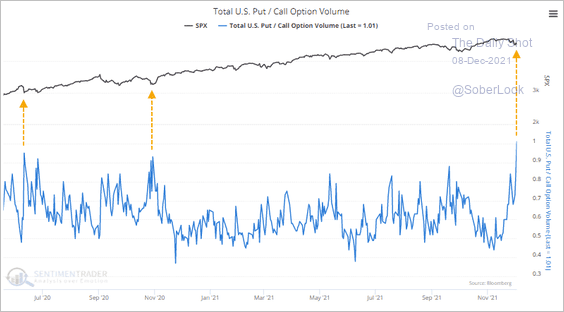
5. This week, for the first time since the post-pandemic rally began, there were more puts than calls traded across all US exchanges.
 Source: SentimenTrader
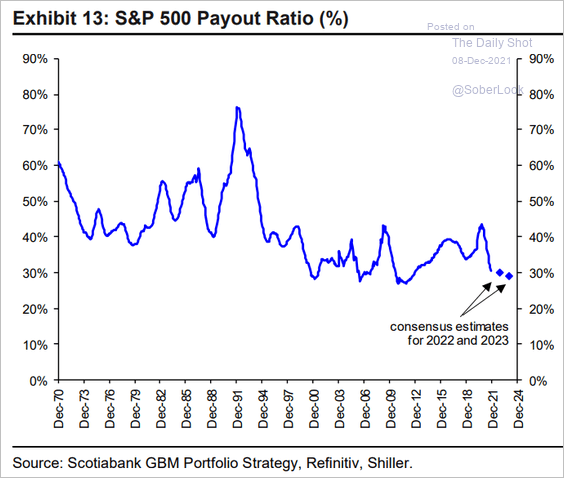
6. Here are the projections for the S&P 500 payout ratio.
 Source: Hugo Ste-Marie, Portfolio & Quantitative Strategy Global Equity Research, Scotia Capital
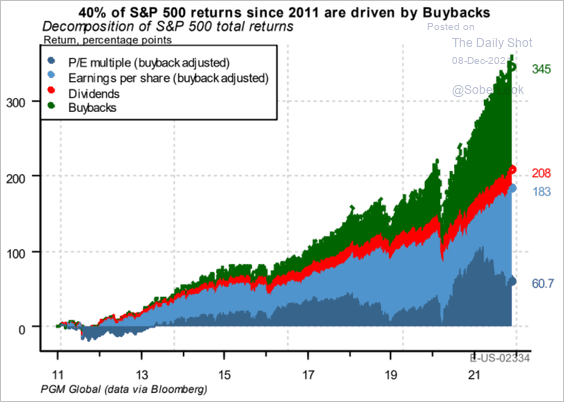
7. Buybacks have been a key component of US large-cap returns.
 Source: PGM Global
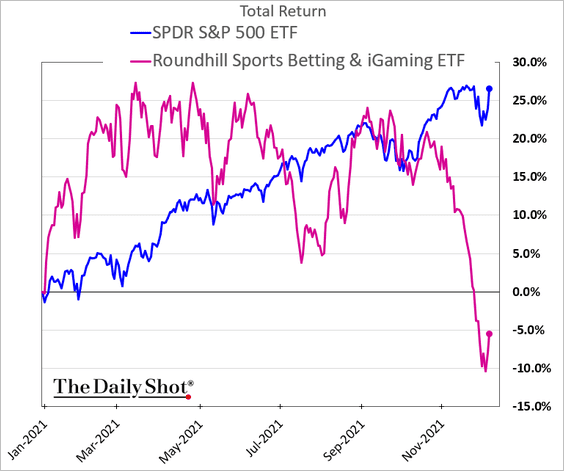
8. Sports betting stocks have underperformed massively in recent weeks. Have they bottomed?
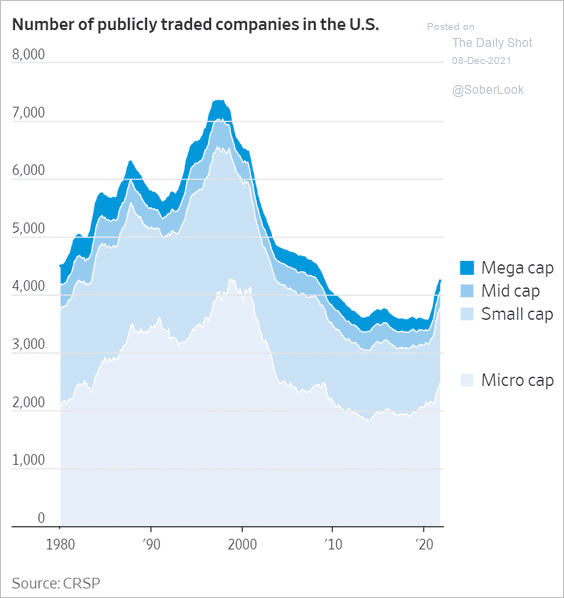
9. Here is the number of public companies by size (2 charts).
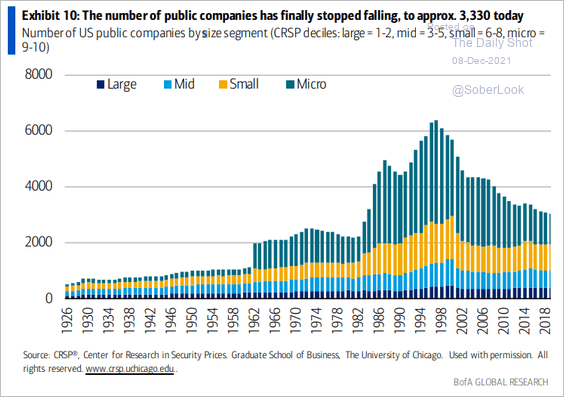 Source: BofA Global Research; @MikeZaccardi
 Source: @WSJ Read full article
Back to Index
Credit
1. Let’s start with yields across different fixed-income asset classes.
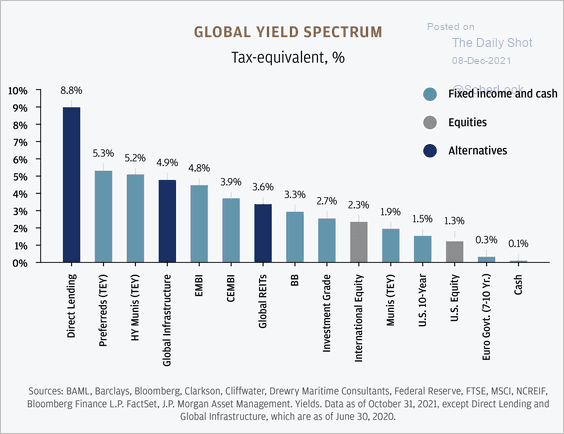 Source: J.P. Morgan Asset Management
2. US corporate bankruptcies declined significantly over the past year.
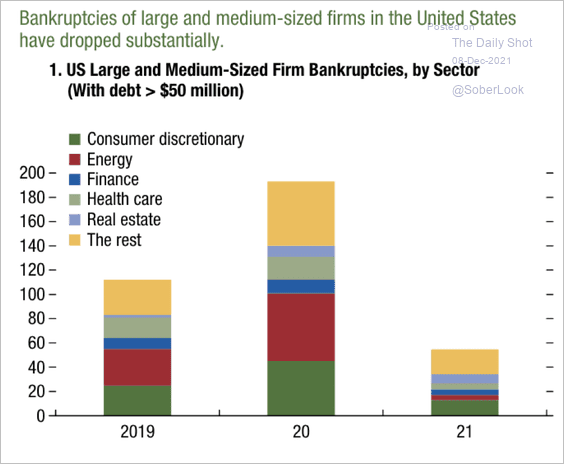 Source: IMF
Small firm bankruptcies have declined in the US and Japan, but have risen in Europe.
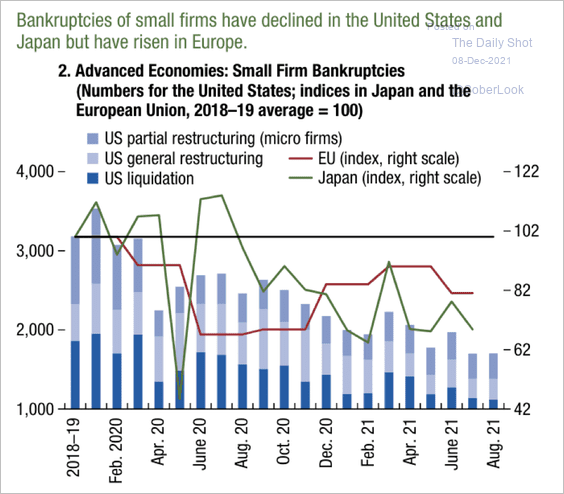 Source: IMF
——————–
3. The LIBOR deadline generated a surge in CLO issuance going into the year-end.
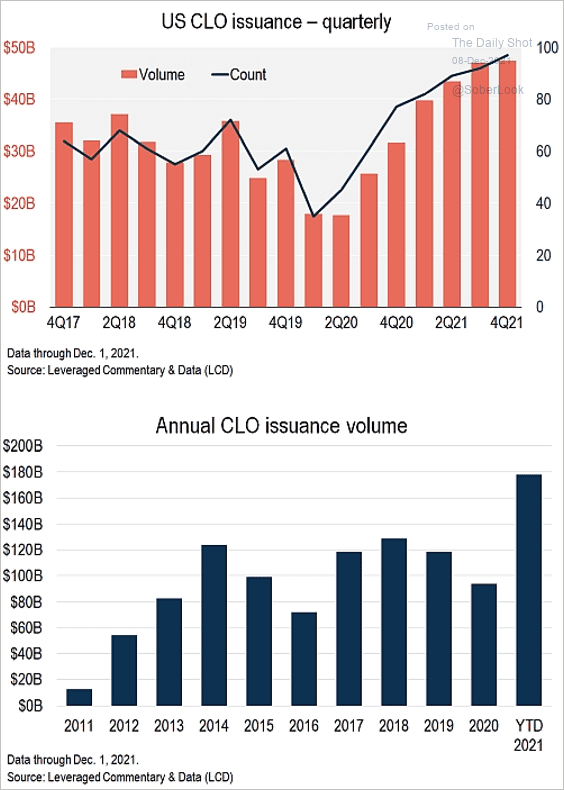 Source: @lcdnews Read full article
4. Muni issuance is accelerating.
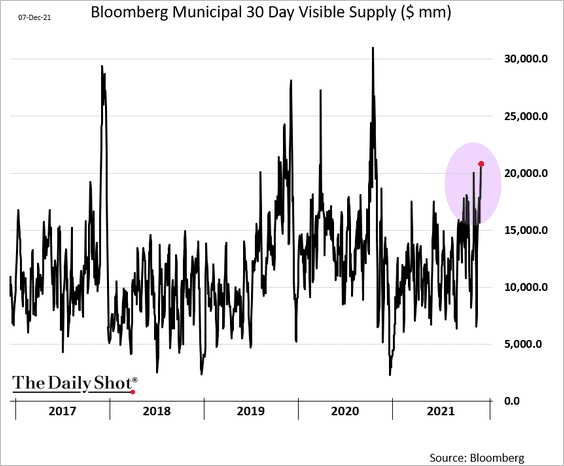
Back to Index
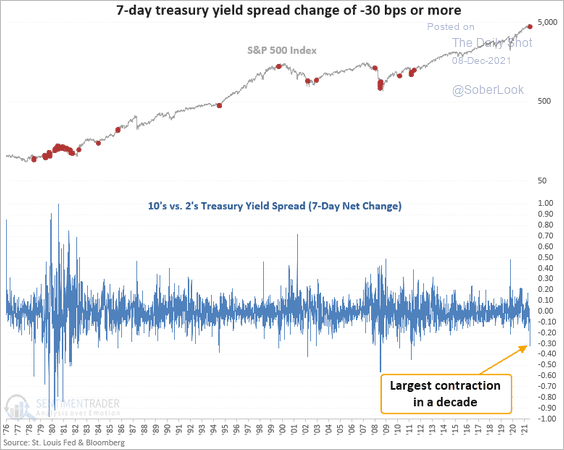
Rates
Over the past seven days, the 10yr – 2yr Treasury spread tightened the most in at least a decade (flattening curve).
 Source: SentimenTrader
Back to Index
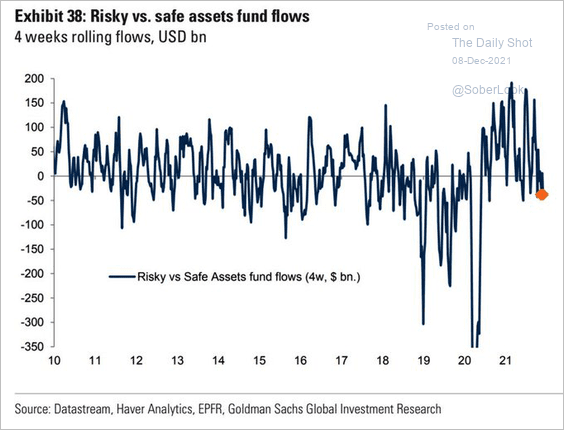
Global Developments
1. This chart shows the global risk appetite based on fund flows.
 Source: Goldman Sachs; @WallStJesus
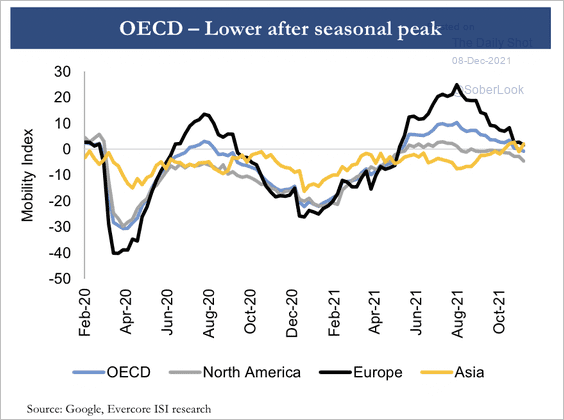
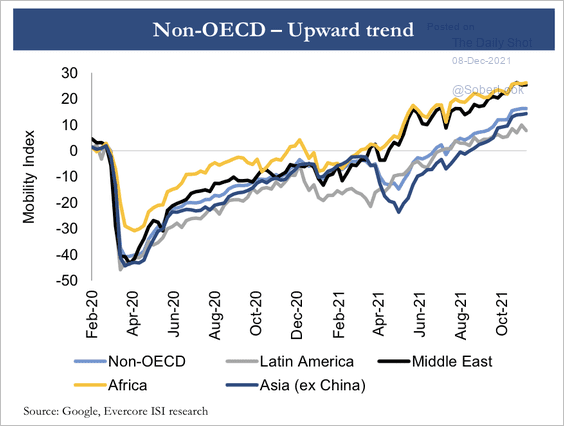
2. The mobility recovery has been relatively weak in OECD countries (2 charts).
 Source: Evercore ISI Research
 Source: Evercore ISI Research
——————–
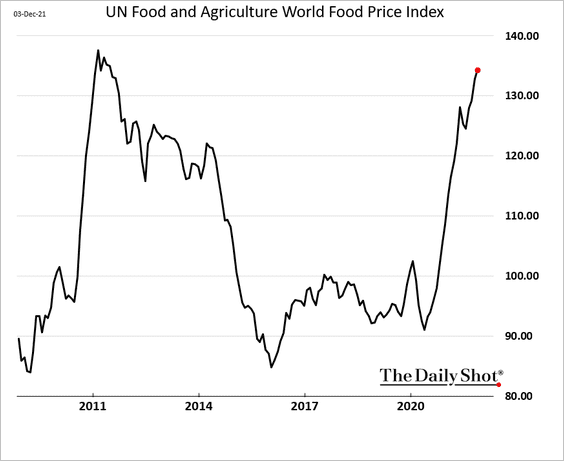
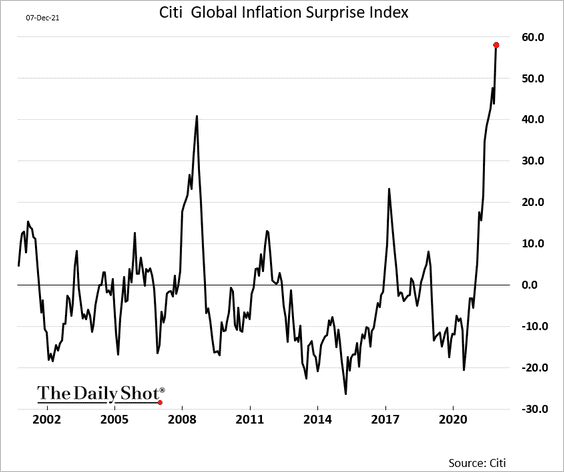
3. Next, we have some updates on inflation.
• Global food prices:
• The Citi Inflation Surprise Index:
Inflation has been much higher than expected in most G10 economies.
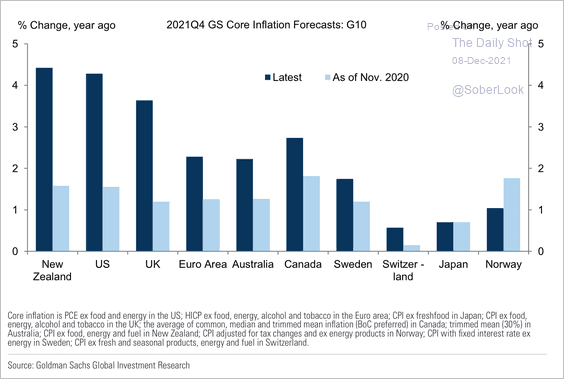 Source: Goldman Sachs
• Probability of inflation outcomes:
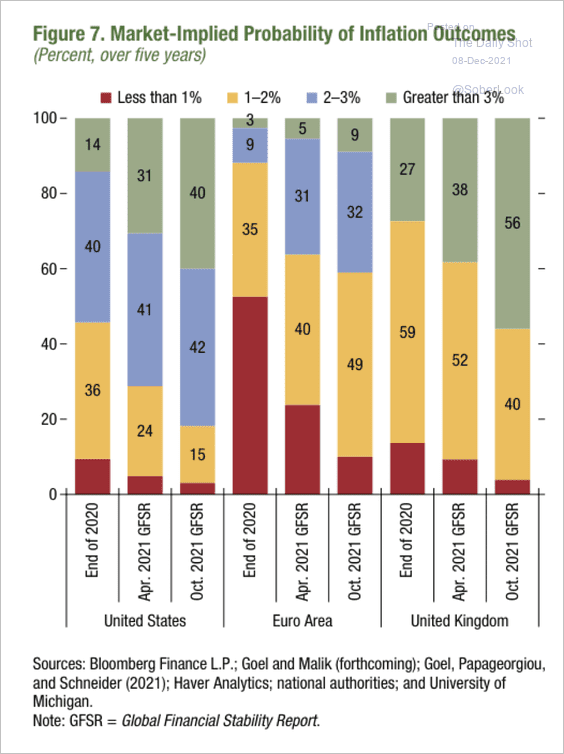 Source: IMF
• Inflation levels vs. central banks’ targets:
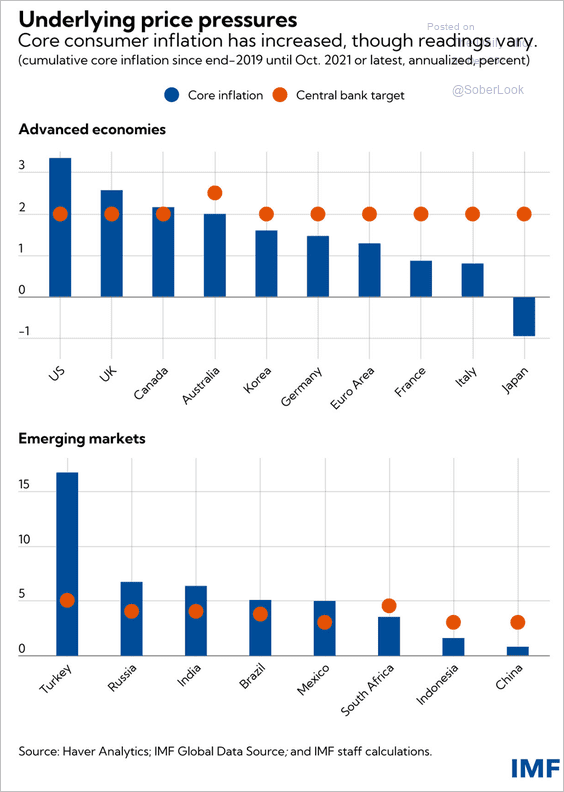 Source: IMF Read full article
• Most investors surveyed by JP Morgan believe inflation will fall back to 2% by 2023.
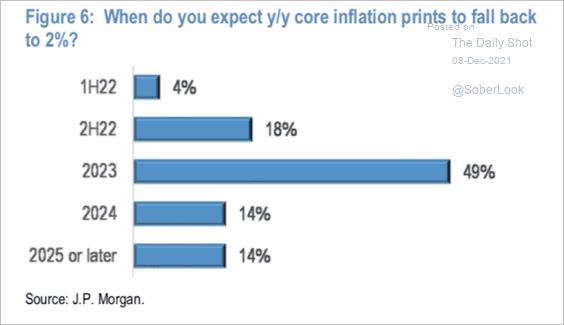 Source: JP Morgan Research
• Morgan Stanley expects global inflation to moderate next year.
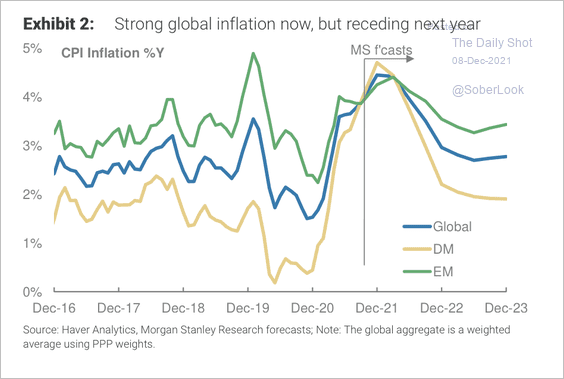 Source: Morgan Stanley Research
——————–
Food for Thought
1. Countries with the highest and lowest immigrant population rates:
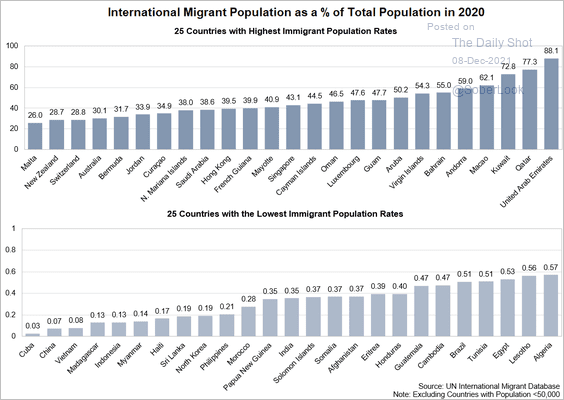 Source: @jlpobrien Read full article
2. Vaccination rates by age:
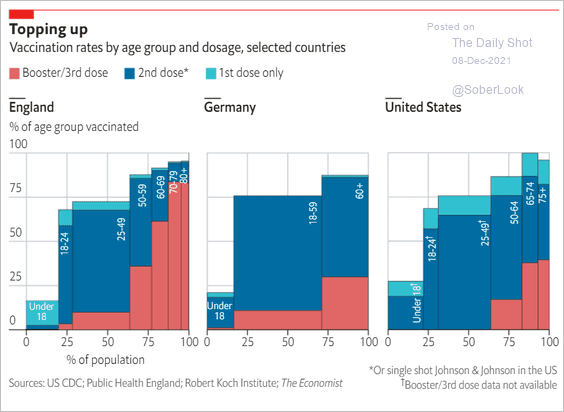 Source: The Economist Read full article
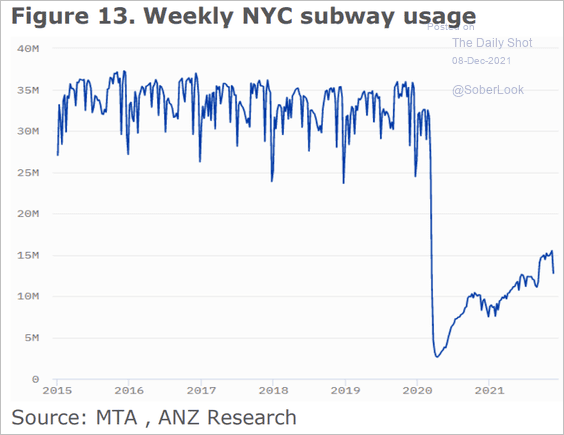
3. NYC subway usage:
 Source: ANZ Research
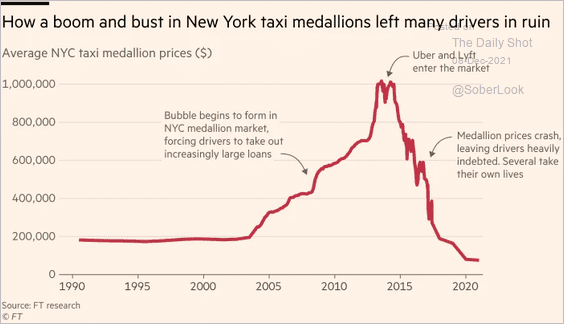
4. NYC taxi medallion prices:
 Source: @financialtimes Read full article
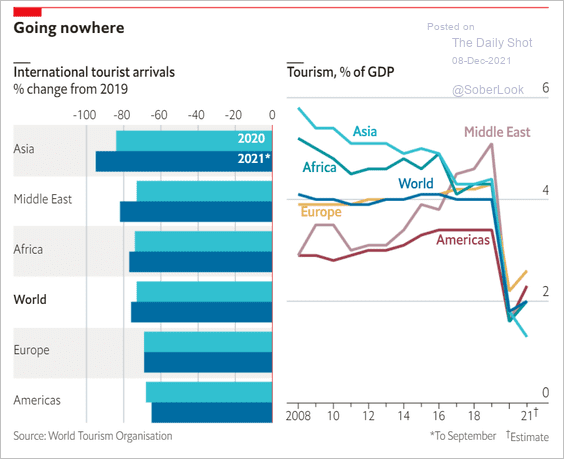
5. International tourist arrivals:
 Source: The Economist Read full article
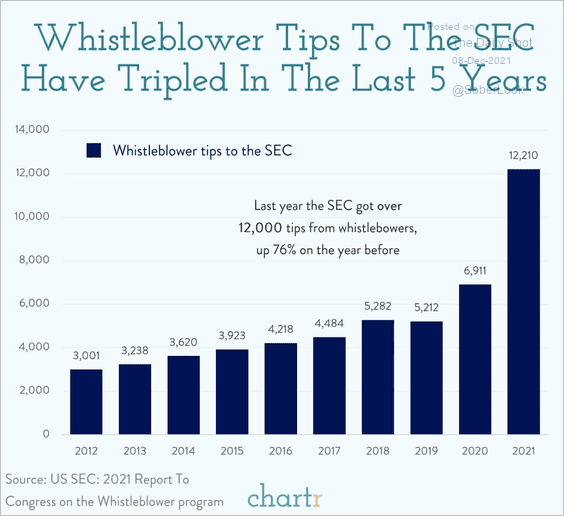
6. Whistleblower tips to the SEC:
 Source: @chartrdaily
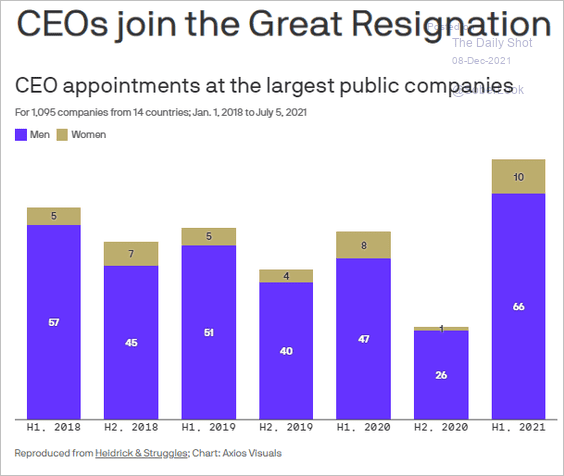
7. CEO appointments:
 Source: @axios Read full article
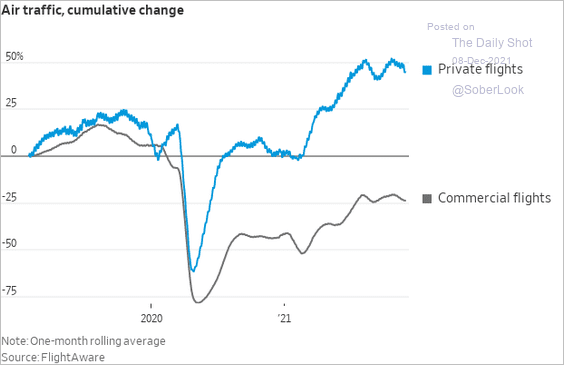
8. Private-aviation boom:
 Source: @WSJ Read full article
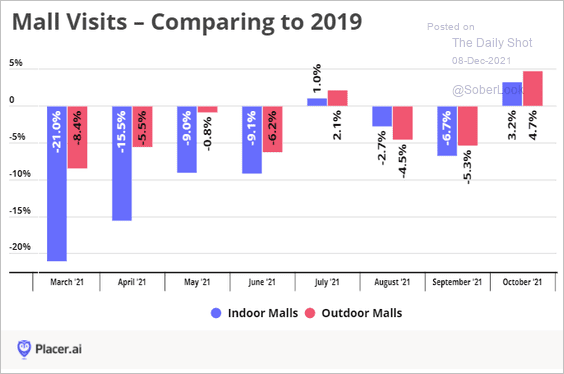
9. Mall visits vs. 2019:
 Source: Placer.ai
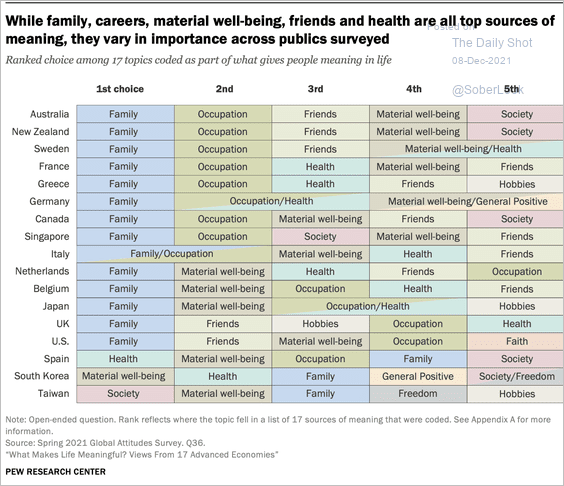
10. What gives people meaning in life:
 Source: Pew Research Center Read full article
——————–
Back to Index