
The Daily Shot: 16-Dec-21
• The United States
• Canada
• The United Kingdom
• The Eurozone
• Japan
• Asia – Pacific
• China
• Emerging Markets
• Cryptocurrency
• Energy
• Equities
• Credit
• Rates
• Global Developments
• Food for Thought
The United States
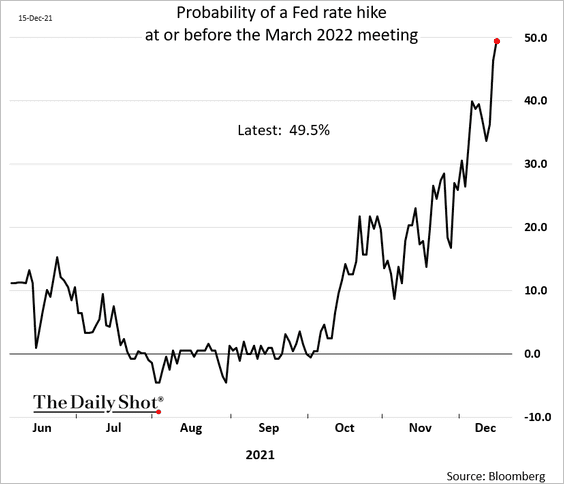
1. The FOMC delivered a widely anticipated hawkish shift to tackle surging prices. As expected, the central bank will double the pace of taper. That change opens the possibility of a rate hike as early as March. The market now sees even odds of such an outcome.
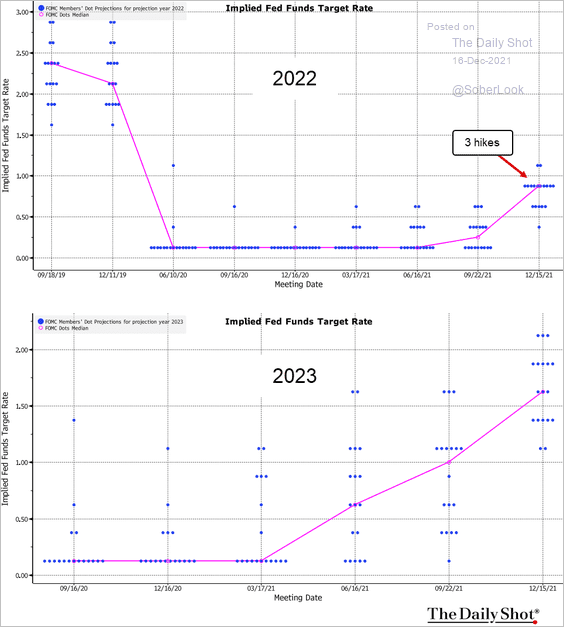
A more surprising communication from the FOMC was the dot-plot which showed the Fed hiking three times next year. The market expected to see two.
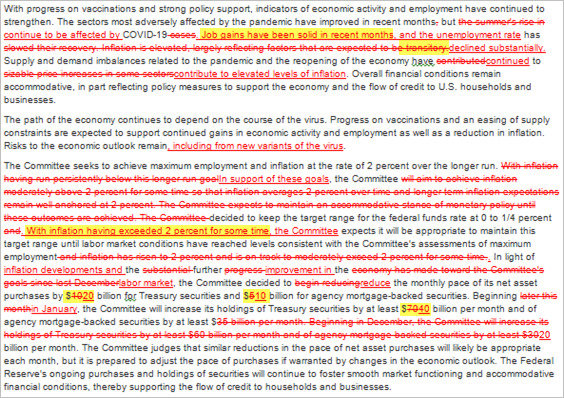
• In addition to the taper changes, the FOMC statement indicated that …
– the Fed is happy with the labor market progress,
– the FOMC got rid of “transitory” language
– and focused on inflation running above 2% “for some time.”
 Source: @johnjhardy
• Here is the evolution of the dot plot for 2022 and 2023.
 Source: @TheTerminal, Bloomberg Finance L.P.
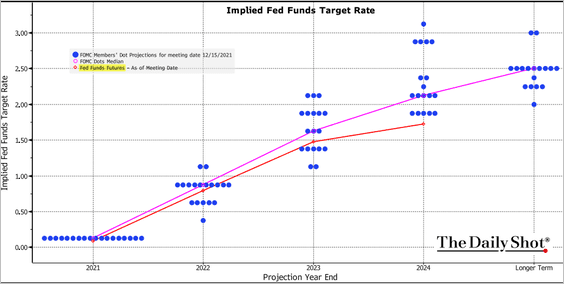
• And this is the expected FOMC rate trajectory. Note that it’s more hawkish than the market (orange line).
 Source: @TheTerminal, Bloomberg Finance L.P.
• The FOMC boosted its inflation forecasts.

——————–
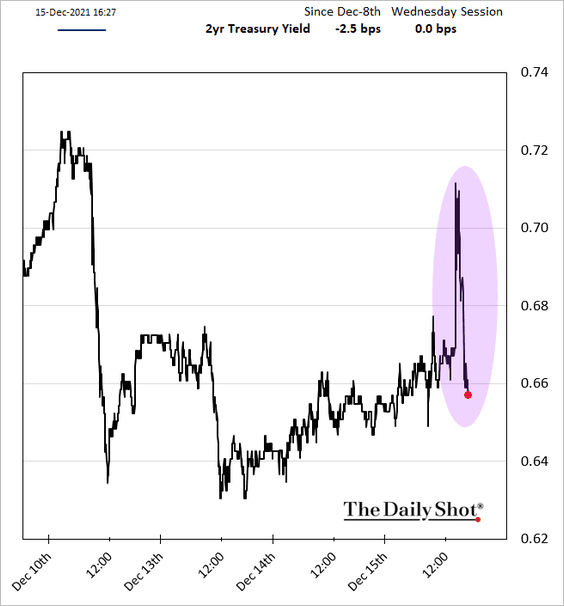
2. By all accounts, the Fed took a hawkish posture (the sharpest policy reversal in years). But the markets’ response was remarkable.
• Short-term Treasury yields jumped but then rapidly retreated. The market is simply not convinced that the Fed will go through with the dot-plot hikes.
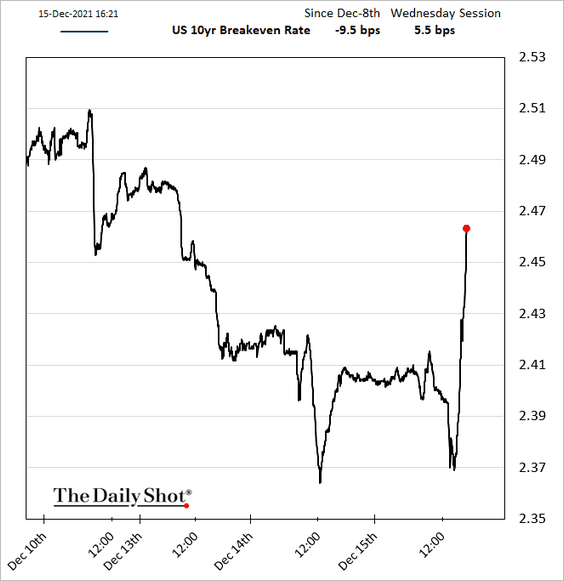
• Inflation expectations jumped, questioning the Fed’s inflation-fighting commitment.
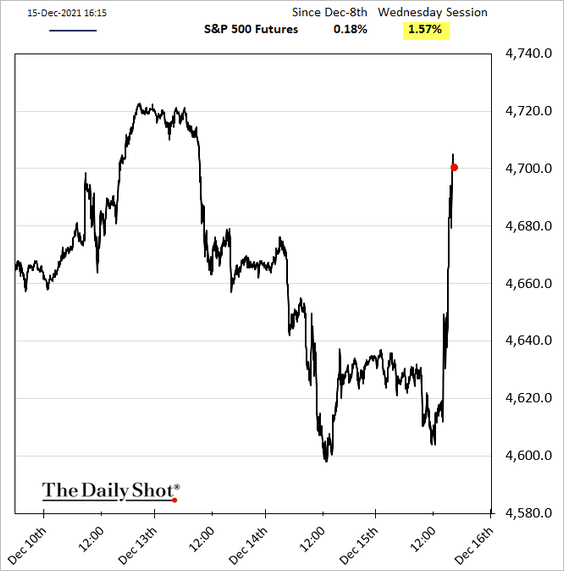
• Stocks surged as traders unwound hedges/short positions.
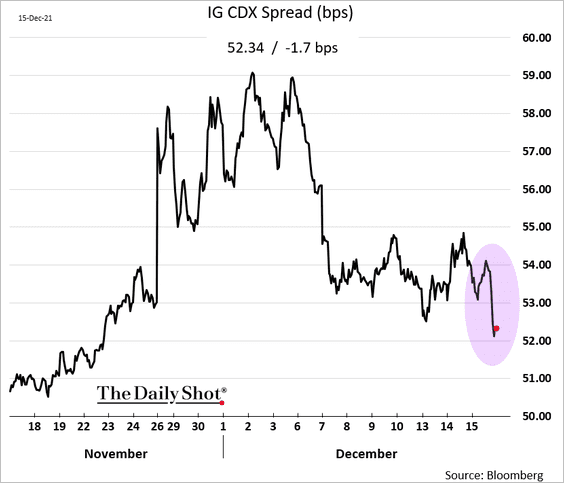
• Credit spreads tightened.
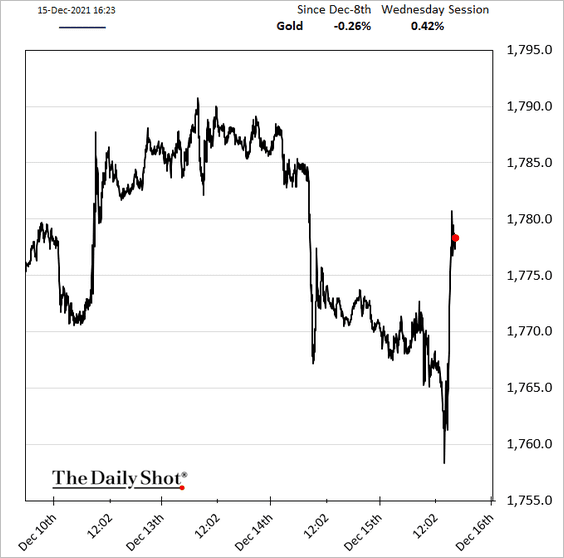
• The dollar declined, …
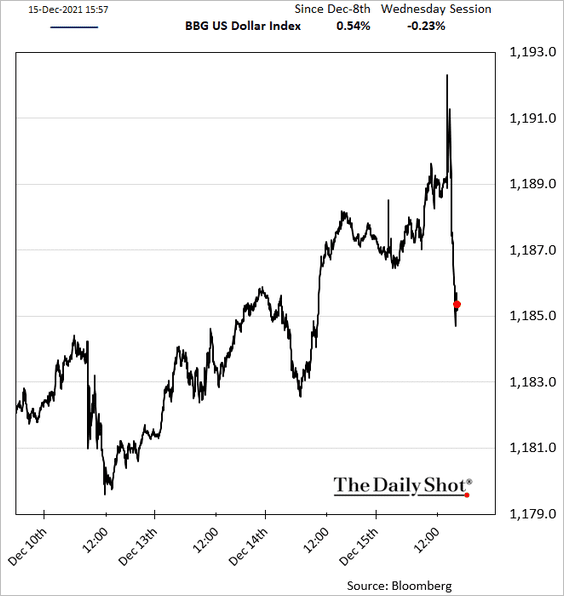
… pushing gold and copper higher.
——————–
3. November retail sales surprised to the downside, …
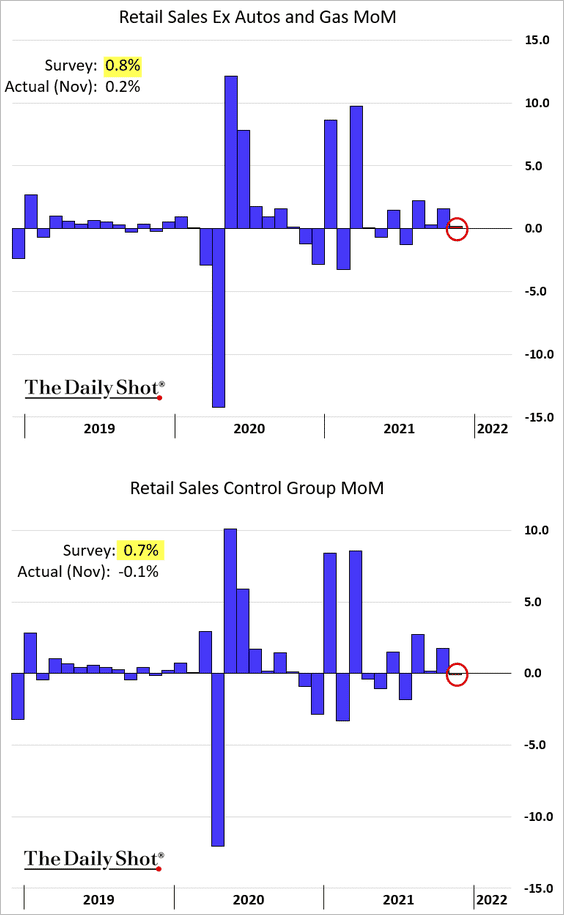
… sending the Atlanta Fed’s GDPNow model estimate for Q4 growth down sharply (now more in line with economists’ estimates).
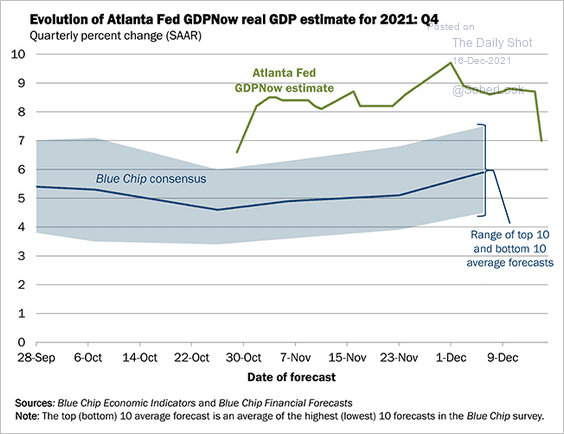 Source: @AtlantaFed Read full article
However, the overall level of retail sales remains well above the pre-COVID trend.
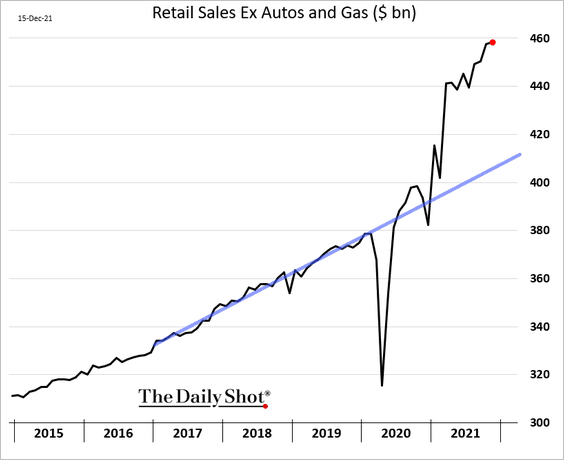
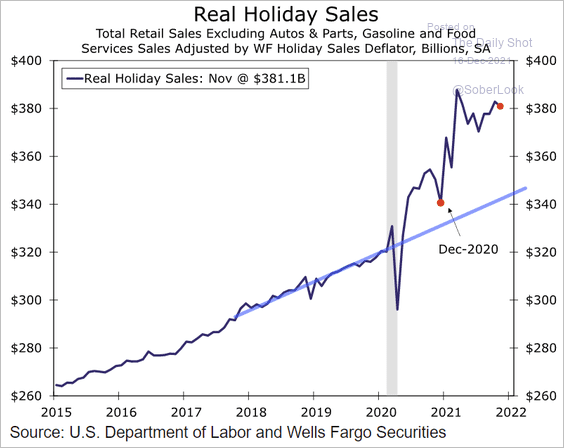 Source: Wells Fargo Securities
• Here is a comparison to the post-2008 recovery.
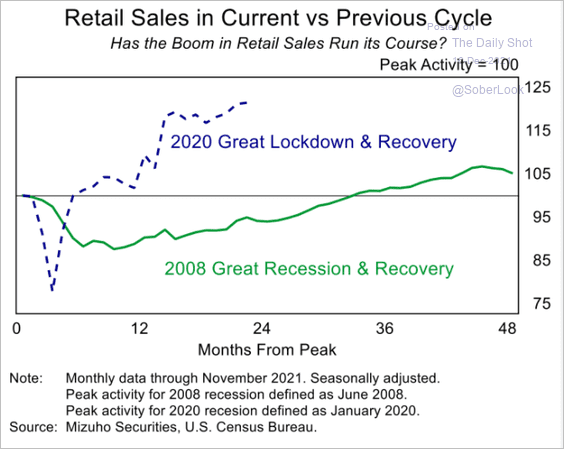 Source: Mizuho Securities USA
• And this chart shows November retail sales changes by sector.
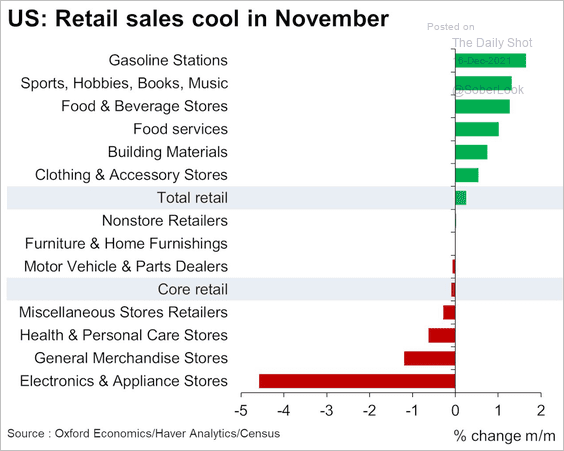 Source: @GregDaco
——————–
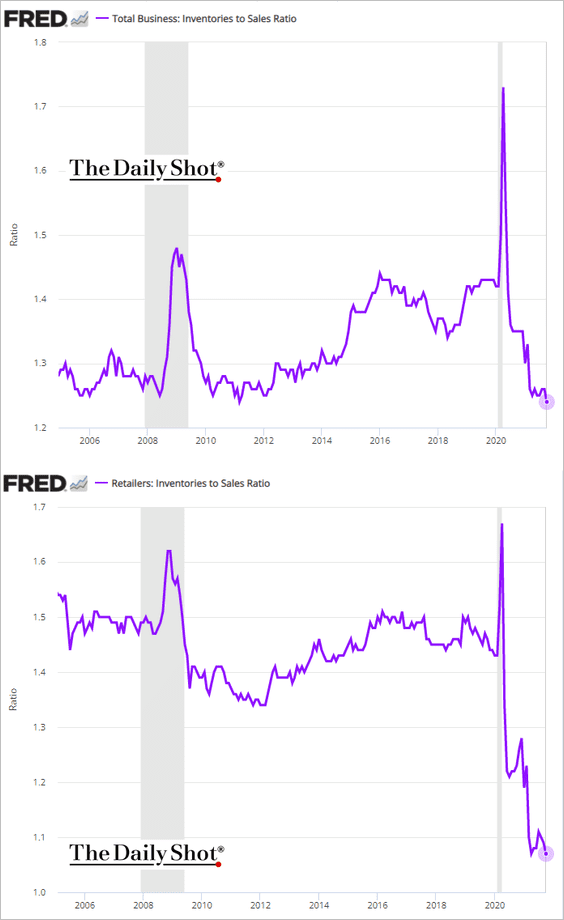
4. The inventories-to-sales ratio tumbled further, driven by the retail sector. With supply constraints persisting, businesses are having trouble keeping up with robust demand.
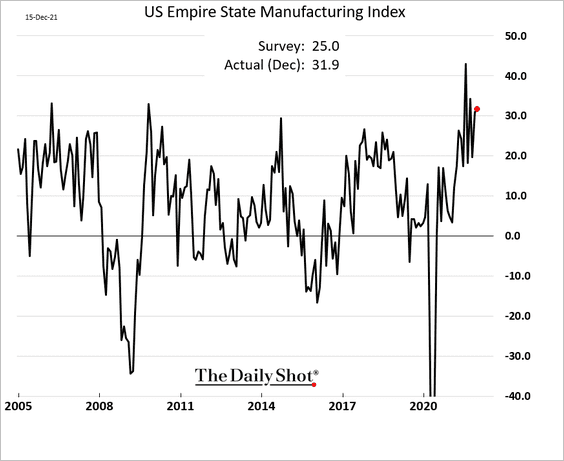
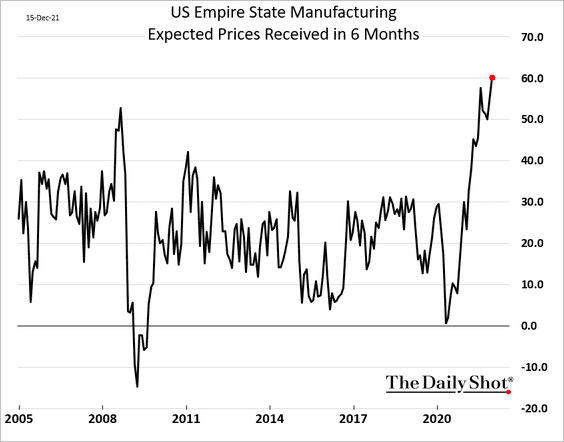
5. The first regional manufacturing report of the month, Empire Manufacturing (NY Fed), topped forecasts.
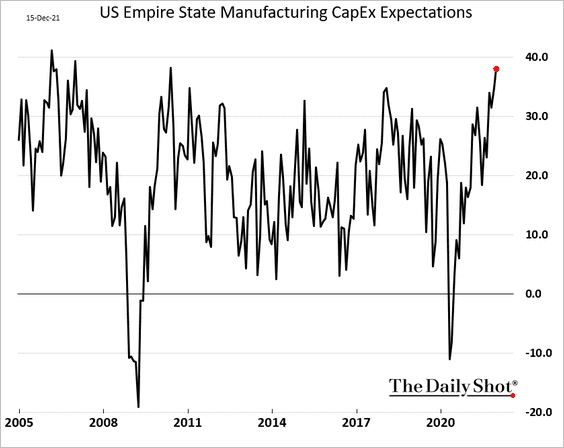
• CapEx expectations hit the highest level in a decade.
• Price pressures endure.
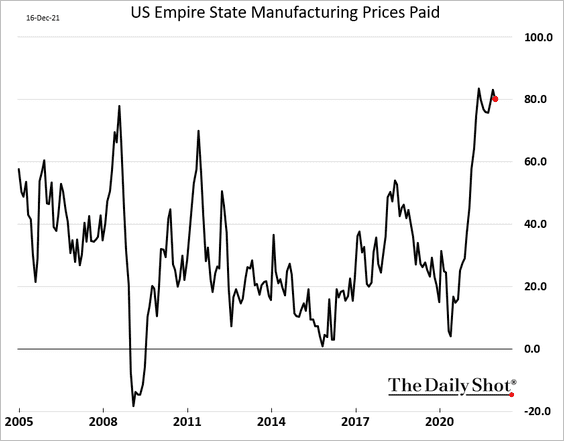
And factories expect to keep boosting prices in the months ahead.
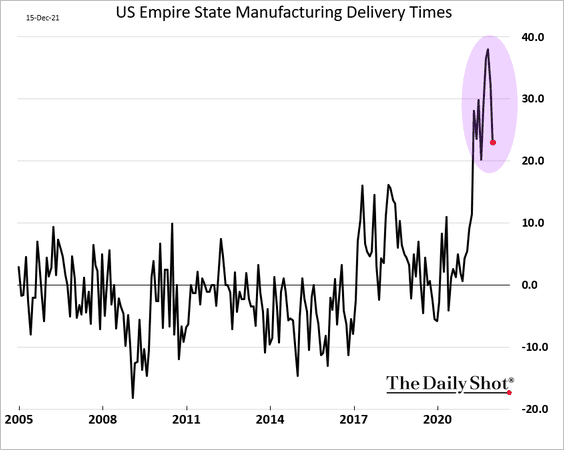
• The delivery times index appears to have peaked, suggesting that supply constraints are starting to ease.
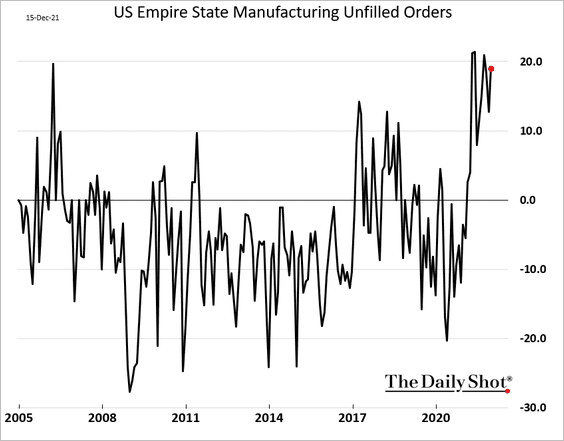
However, unfilled orders remain near the highs.
• Forward-looking activity indicators softened.
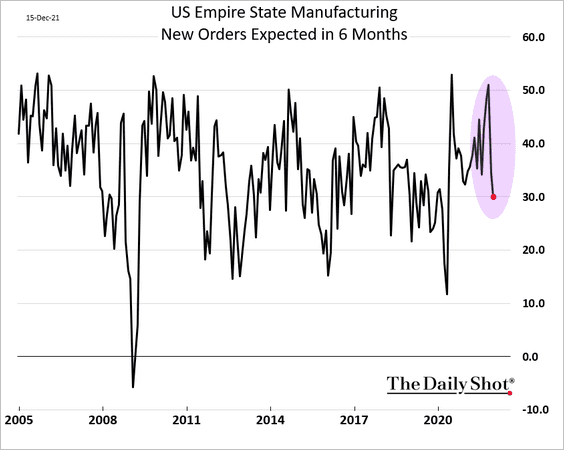
And weakness in China’s factory activity adds to downside risks for Empire Manufacturing.
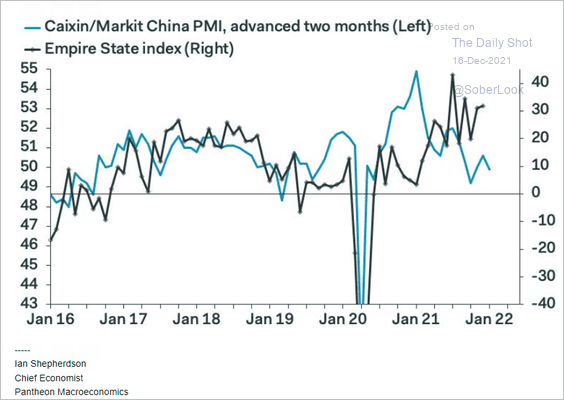 Source: Pantheon Macroeconomics
——————–
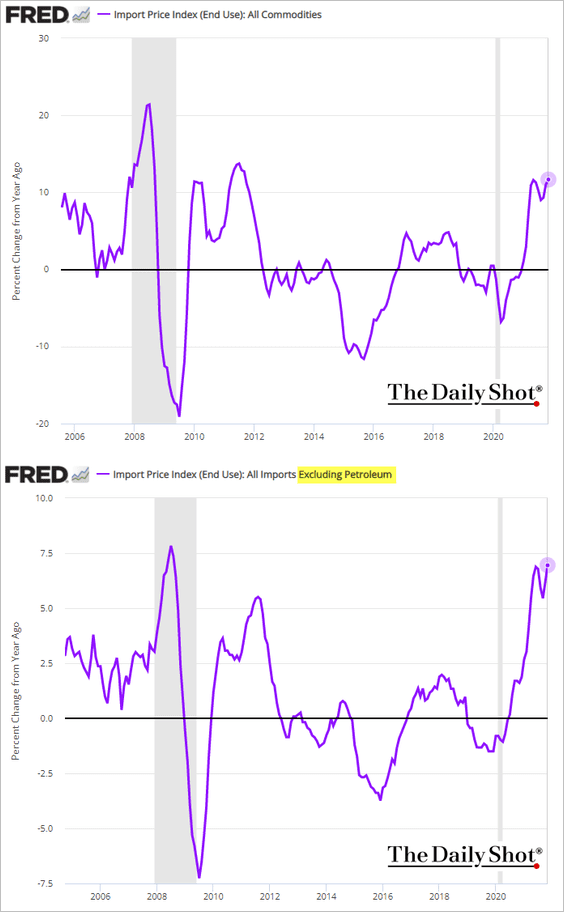
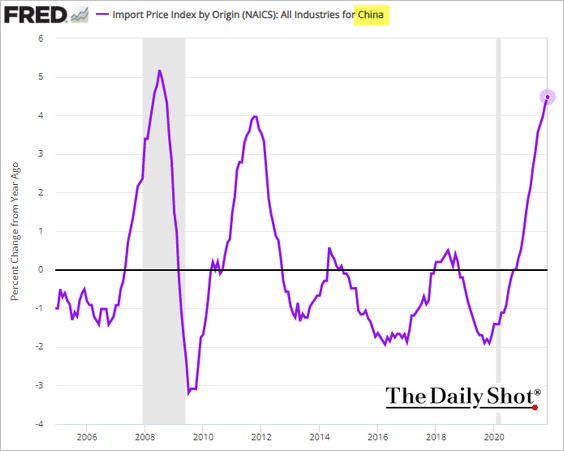
5. Import prices continue to surge despite a stronger dollar. Excluding petroleum, import price inflation is now the highest since 2008.
——————–
6. Homebuilder sentiment improved further this month as demand picks up.
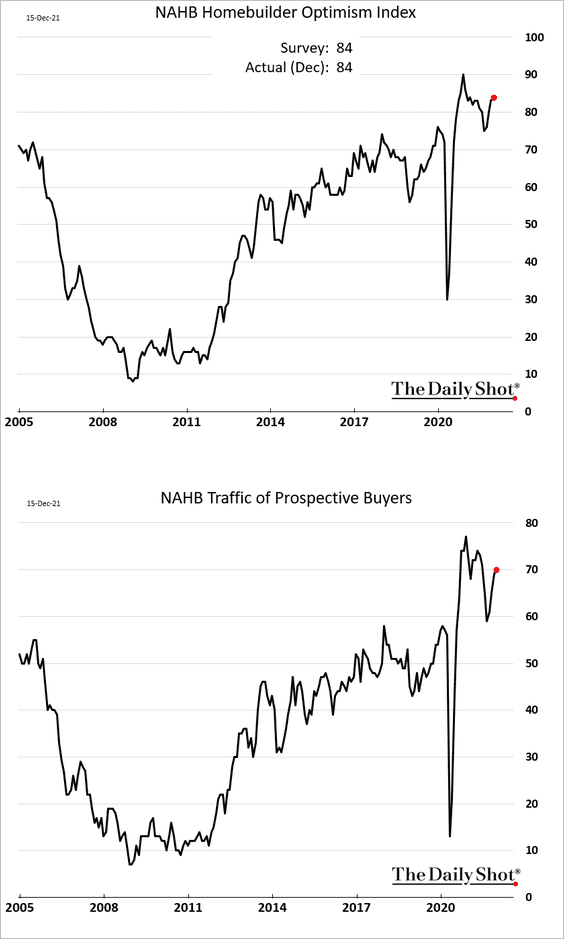
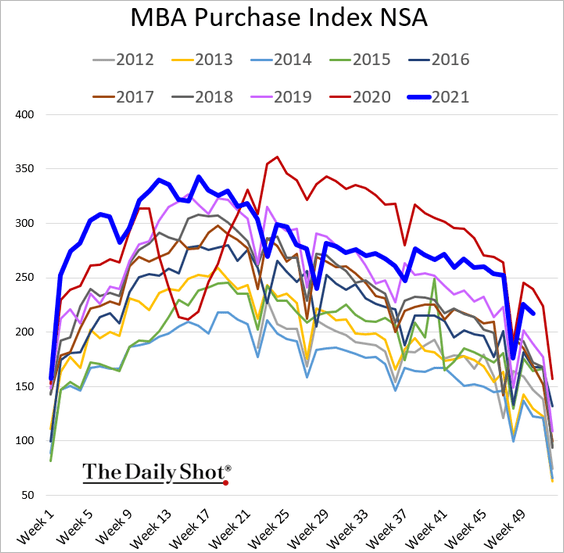
House purchase loan applications are still going strong, running well above 2019 levels.
Back to Index
Canada
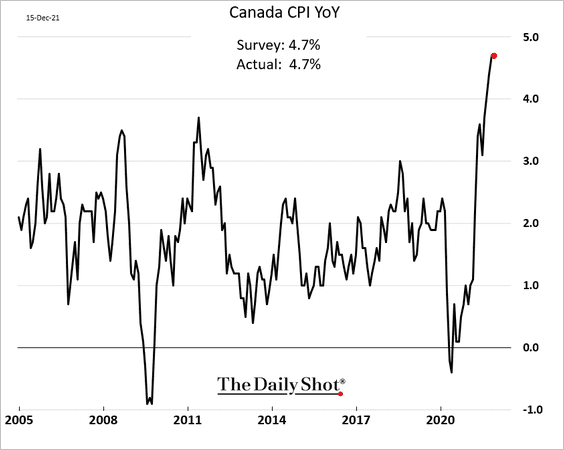
1. Inflation reached the 2003 peak, in line with expectations. The market is pricing in a (roughly) 60% probability of a BoC rate hike in January.
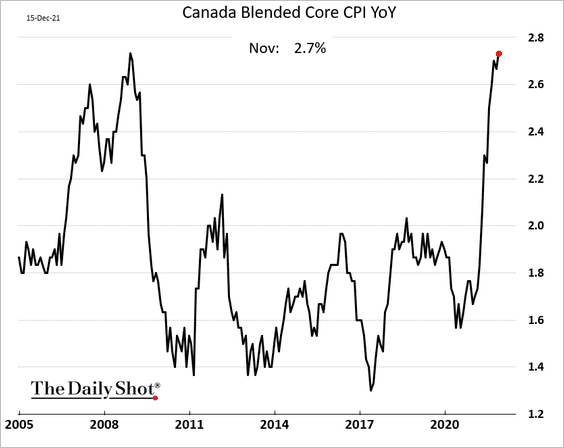
• The blended core CPI climbed further.
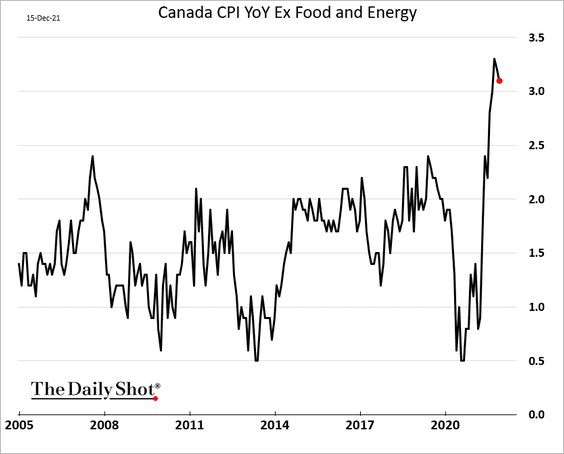
• The CPI excluding food and energy came off the highs.
——————–
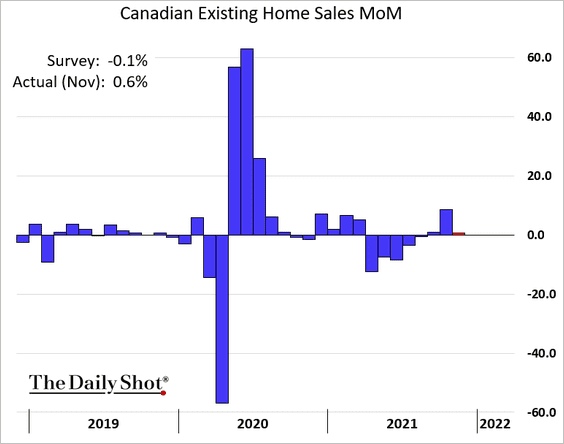
2. Existing home sales increased in November – the market expected a decline.
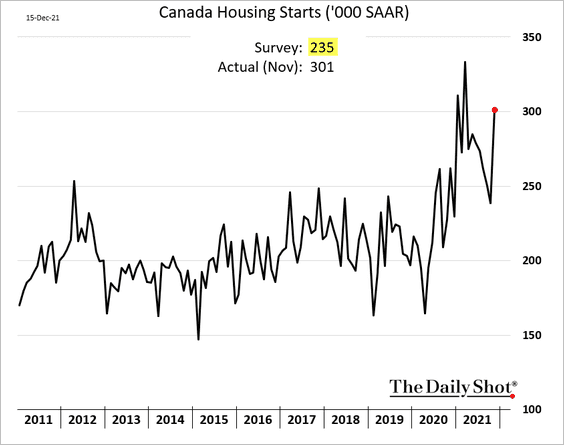
3. Housing starts surged, also surprising to the upside.
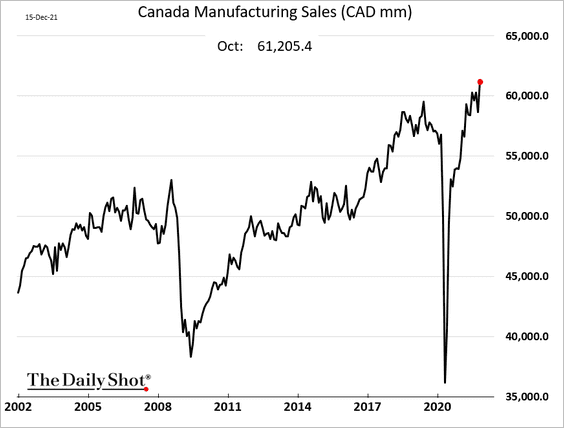
4. Manufacturing sales hit a new high in October.
5. The inventory-to-sales ratio continues to signal severe capacity constraints.
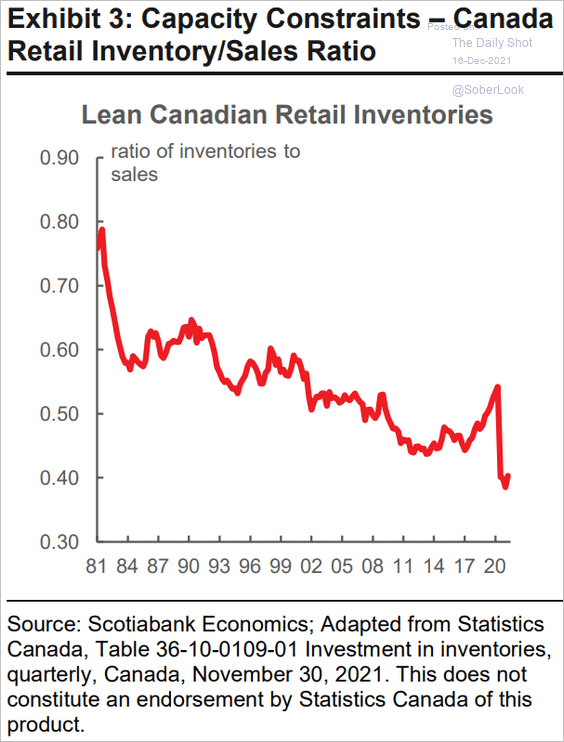 Source: Scotiabank Economics
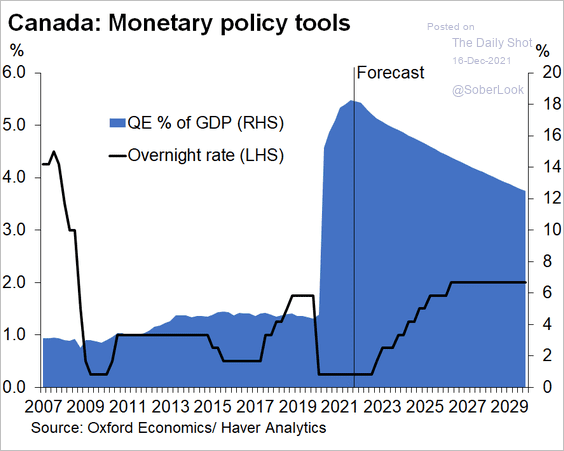
6. Here is a forecast for the BoC policy trajectory from Oxford Economics.
 Source: Oxford Economics
Back to Index
The United Kingdom
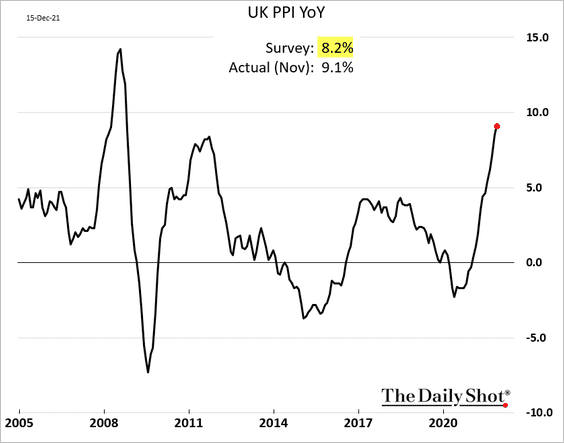
1. Inflation topped forecasts, with the core CPI growth hitting the highest level in three decades.
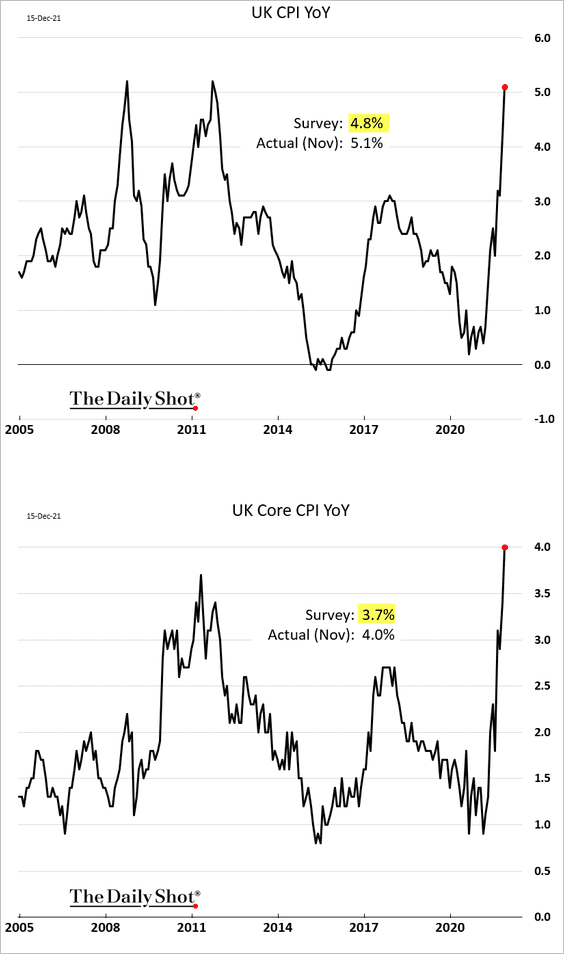
• Much of the price pressure is coming from abroad.
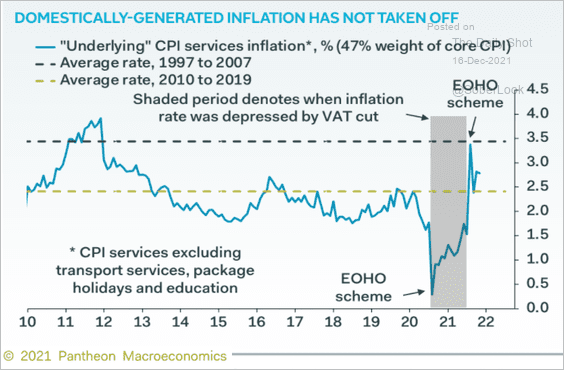 Source: Pantheon Macroeconomics
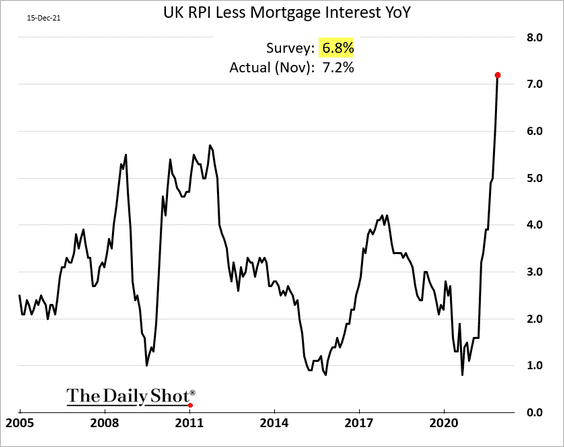
• Retail prices are also rising at the fastest pace in three decades.
• And producer prices continue to surge.
——————–
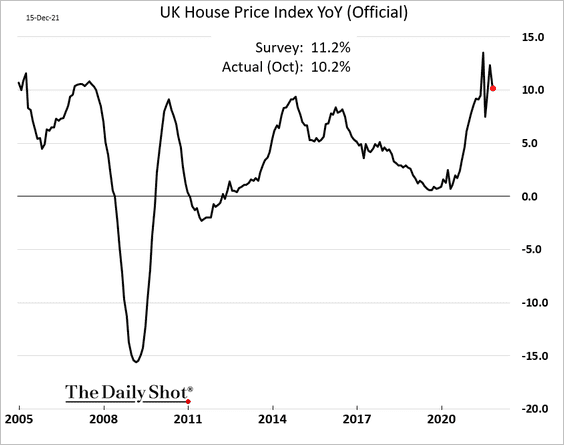
2. Home price gains were softer than expected in October.
3. The UK has made significant progress on booster shots.
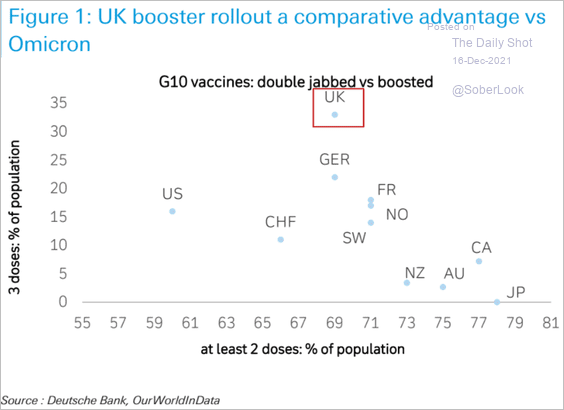 Source: Deutsche Bank Research
Back to Index
The Eurozone
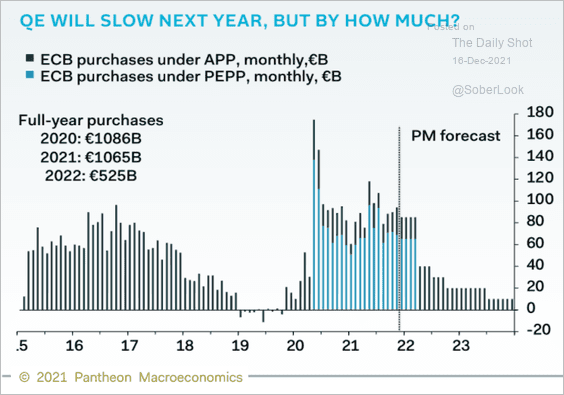
1. How much will QE slow next year? Below is an estimate from Pantheon Macroeconomics.
 Source: Pantheon Macroeconomics
2. Exit from emergency fiscal stimulus could be cushioned by excess savings.
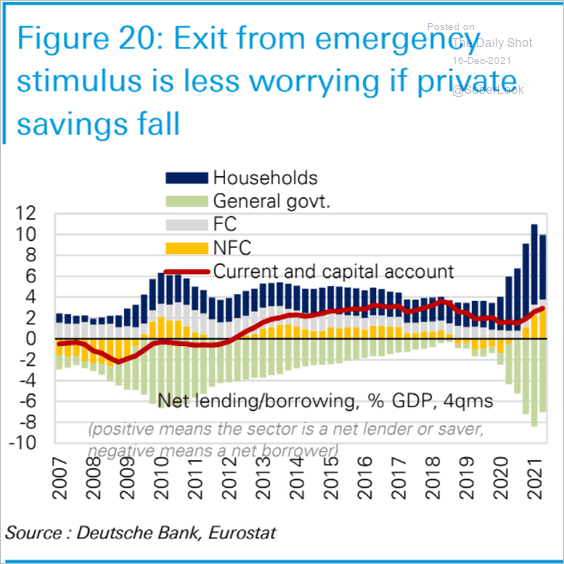 Source: Deutsche Bank Research
3. German online Christmas spending accelerated over the past couple of years.
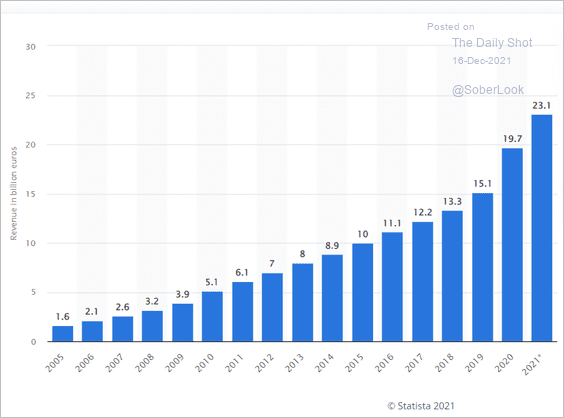 Source: Statista
Back to Index
Japan
1. Growth in business activity eased in December but remains in positive territory.
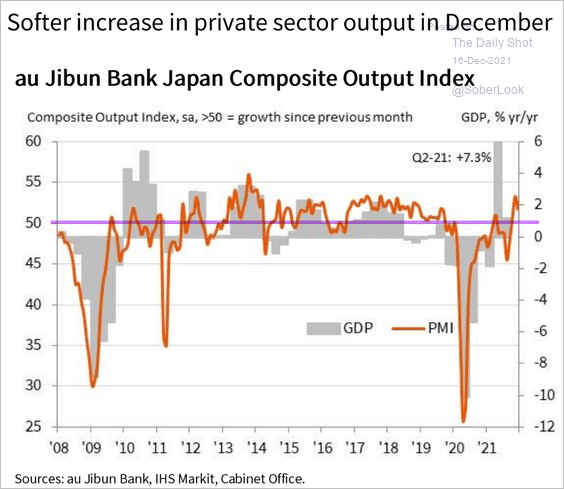 Source: IHS Markit
2. Exports hit a record high.
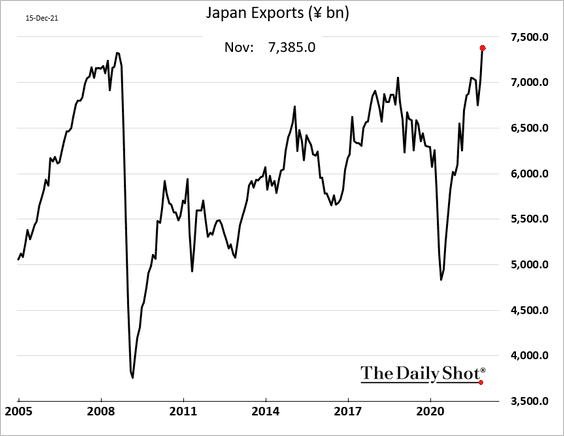
But elevated energy prices are keeping Japan’s trade balance in deficit.

Back to Index
Asia – Pacific
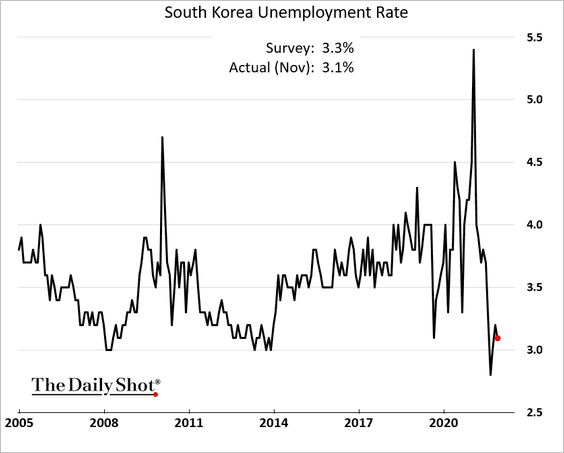
1. South Korea’s unemployment rate remains near 3%.
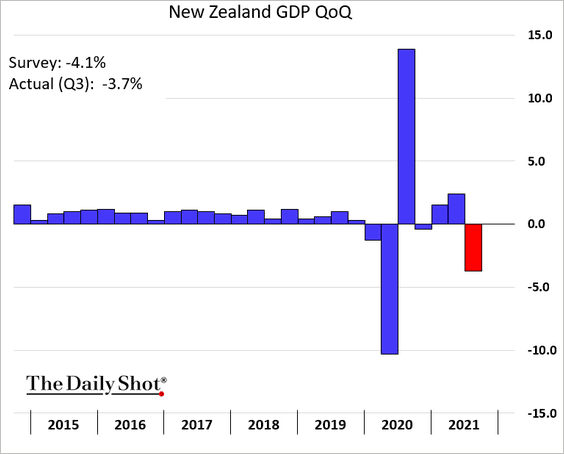
2. New Zealand’s GDP declined less than expected last quarter (lockdowns).
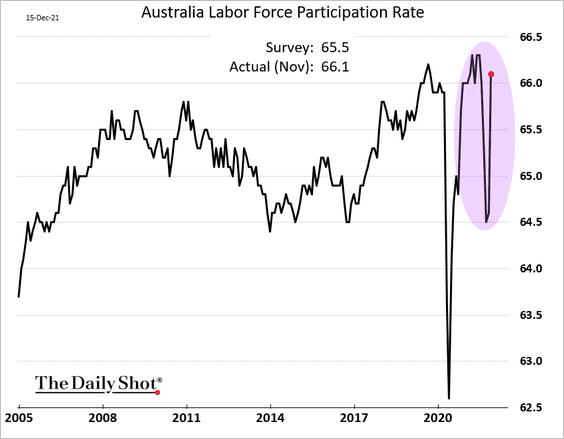
3. Next, we have some updates on Australia
• Employment roared back in November, topping expectations.
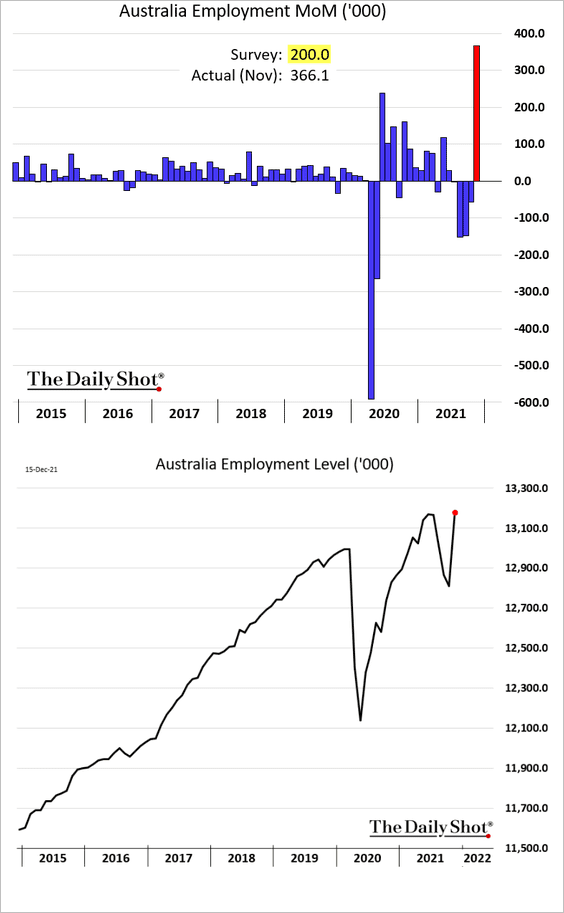
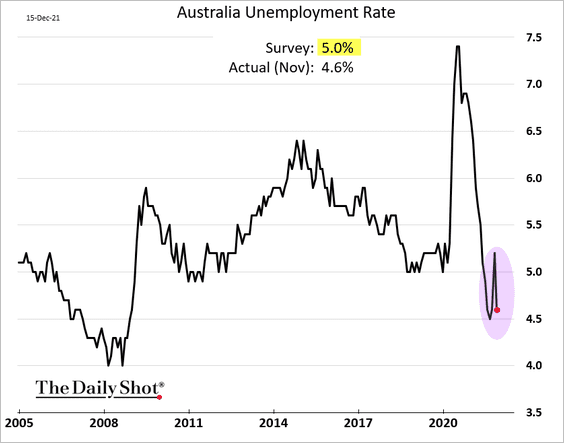
The unemployment rate is back below 5%.
And the participation rate rebounded.
• Growth in business activity is holding up well this month.
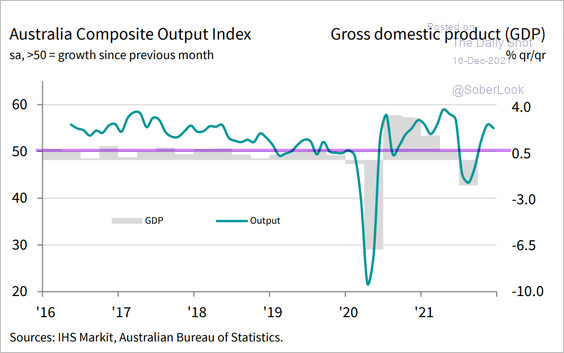 Source: IHS Markit
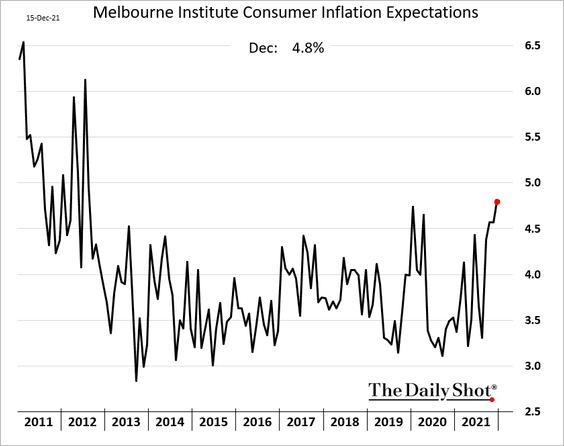
• Consumer inflation expectations hit the highest level in nearly a decade. The RBA’s QE is likely to end in February.
Back to Index
China
1. Shares in Hong Kong have been under pressure as the US blacklists more Chinese firms.
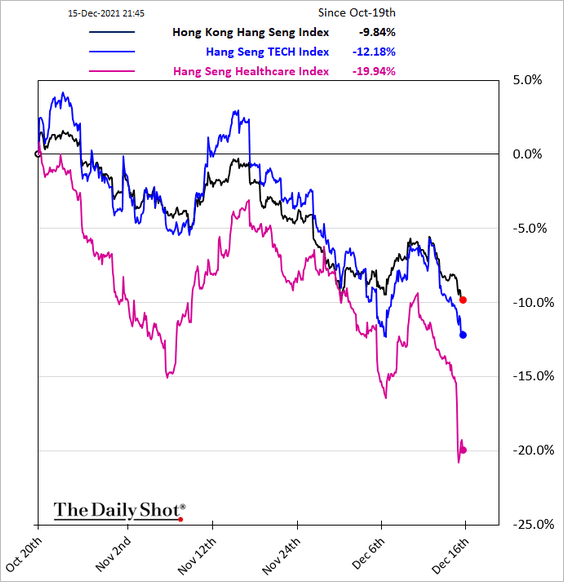
 Source: @financialtimes Read full article
——————–
2. Shimao was viewed as one of the less leveraged developers and thus immune to the ongoing credit crisis. Investors are now concerned about contagion beyond high-yield borrowers.
![]() Source: Bloomberg Read full article
Source: Bloomberg Read full article
Can you spot China’s developer credit crisis in Fitch’s APAC ratings changes?
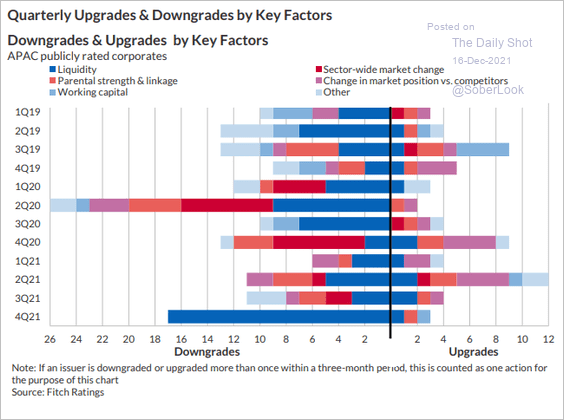 Source: Fitch Ratings
——————–
3. The renminbi has decoupled from other EM currencies.
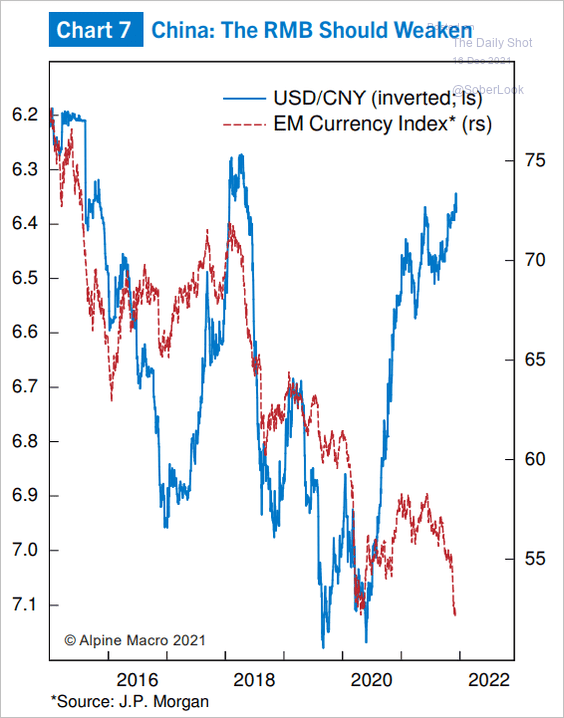 Source: Alpine Macro
Back to Index
Emerging Markets
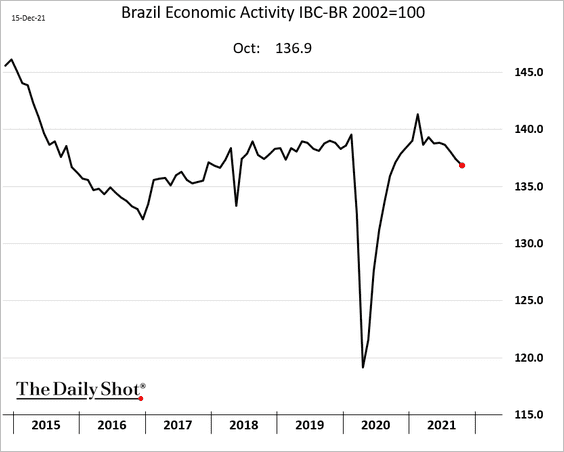
1. Brazil’s economic activity continued to deteriorate in October.
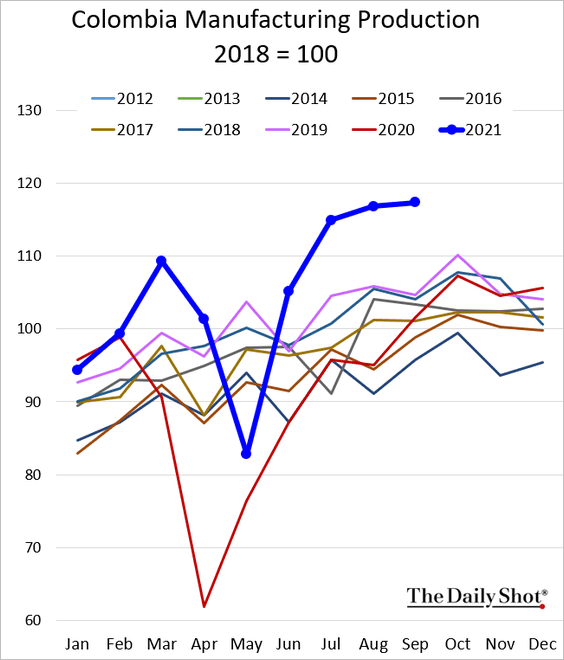
2. Colombia’s factory output remains very strong.
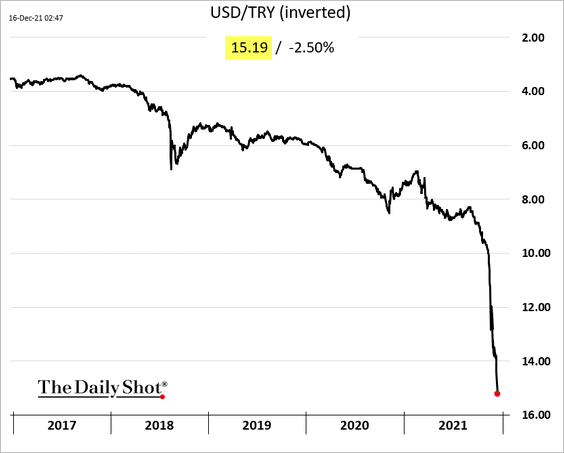
3. The Turkish lira is in free-fall, breaching 15 to the dollar. This is not going to end well.
4. The next chart shows real yields for select economies.
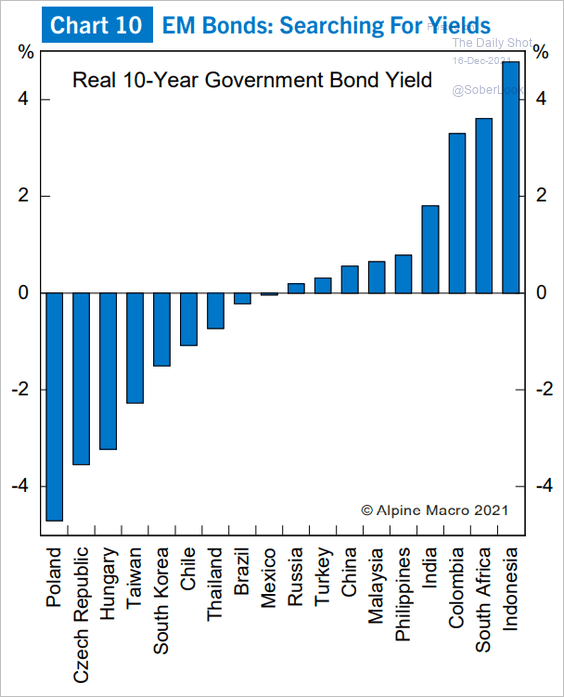 Source: Alpine Macro
• Brazil, Russia, Poland, and Chile offer increased term premia relative to the start of the year.
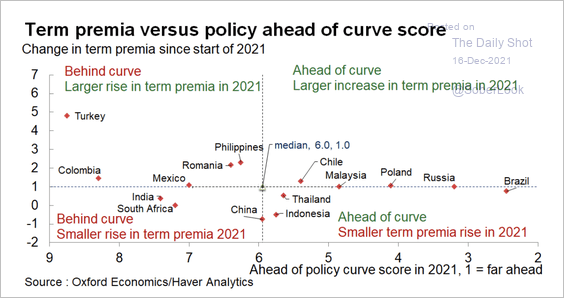 Source: Oxford Economics
• By the way, term premia are at historically high levels across EM.
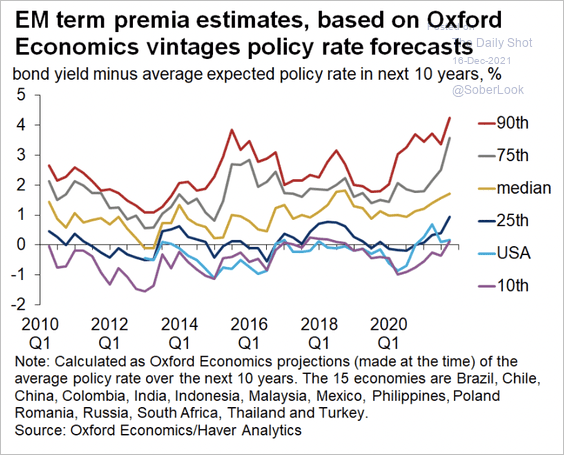 Source: Oxford Economics
Back to Index
Cryptocurrency
1. Implied volatility for near-term bitcoin options is skewed toward puts, indicating some concern in the market. However, option expiries toward Jan-Feb are less skewed, suggesting a neutral price outlook over the intermediate term.
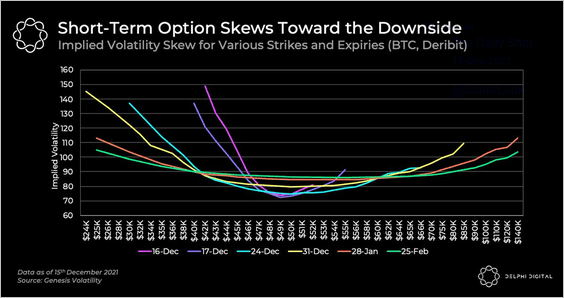 Source: @Delphi_Digital
2. During the recent correction, bitcoin holders have experienced an acceleration in “realized losses” (price declines below their cost basis).
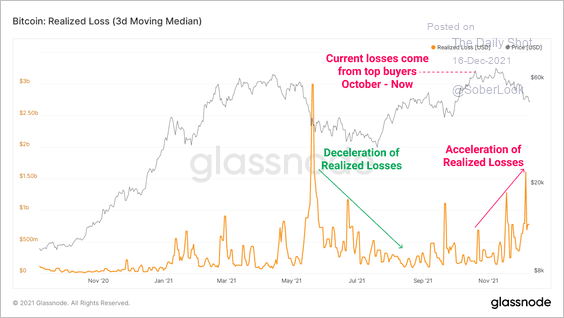 Source: Glassnode Read full article
3. Despite higher losses, however, blockchain data shows the balance of BTC on exchanges continues to decline this year. This could mean some investors prefer to hold BTC in their digital wallets instead of making it available for sale on the exchange.
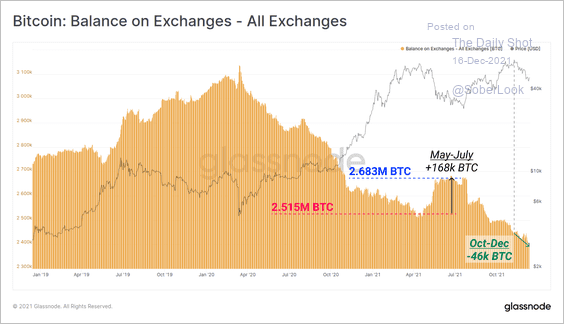 Source: Glassnode Read full article
Back to Index
Energy
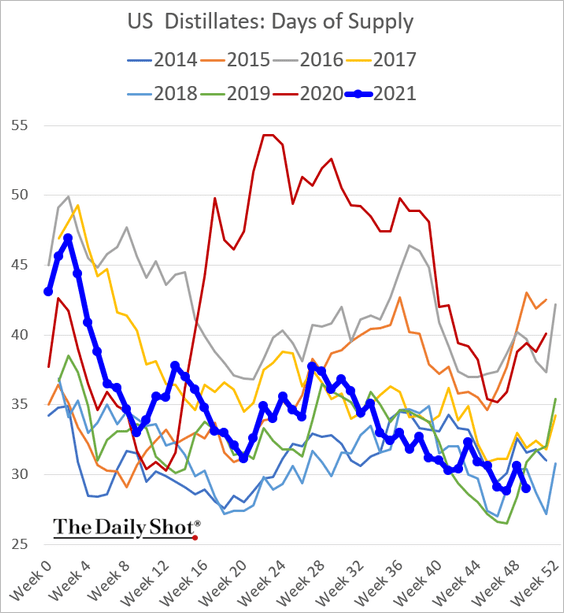
1. US liquids inventories are tight.
• Crude oil:
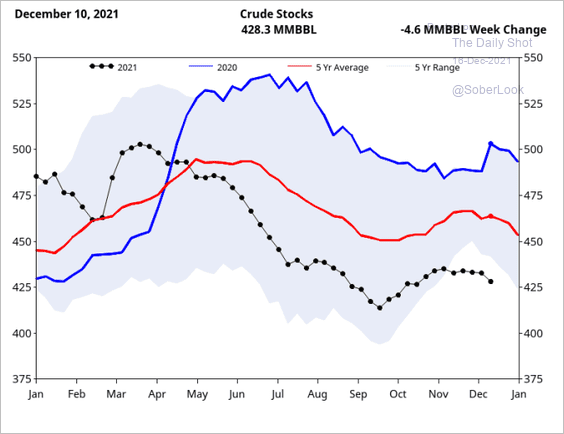 Source: Fundamental Analytics
• Products (2 charts):
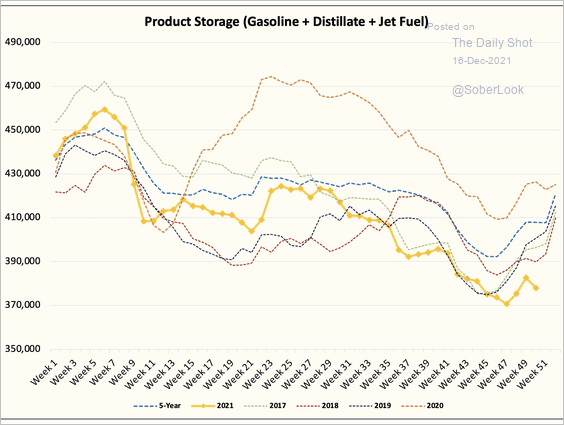 Source: @HFI_Research
• Total liquids:
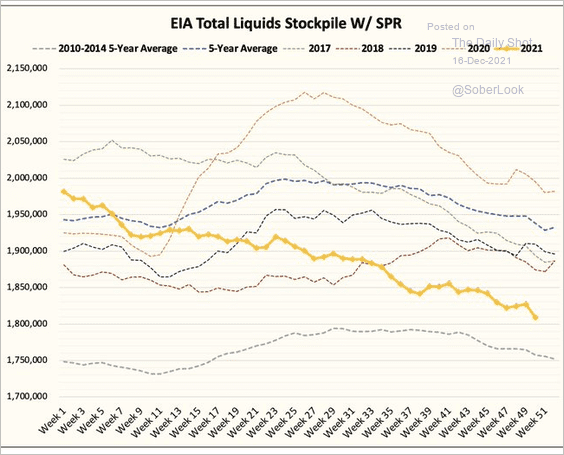 Source: @HFI_Research
——————–
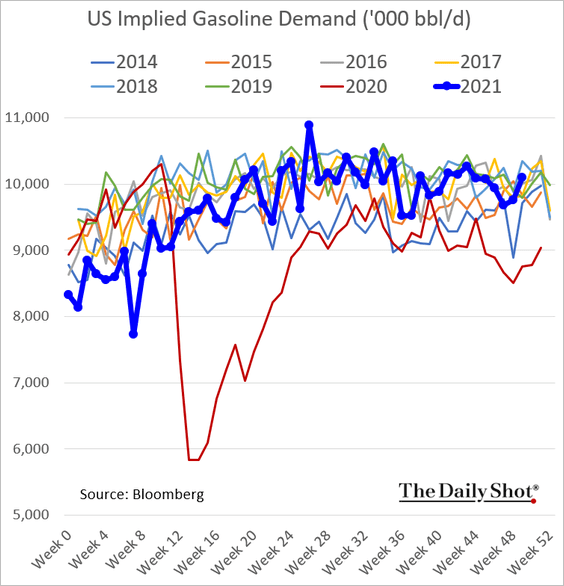
2. US gasoline demand firmed up last week.
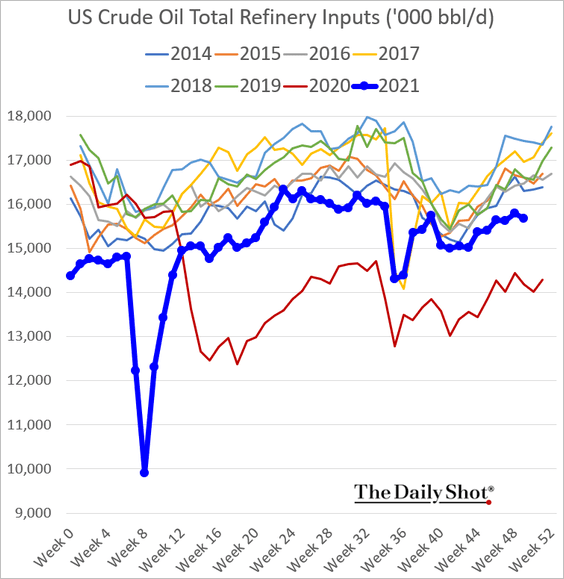
3. Refinery runs remain very low for this time of the year.
4. This chart shows global power sector investment.
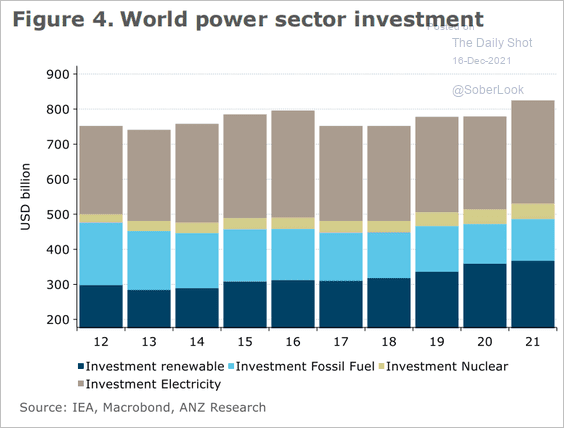 Source: ANZ Research
5. Renewables are a lot more labor-intensive than fossil fuels.
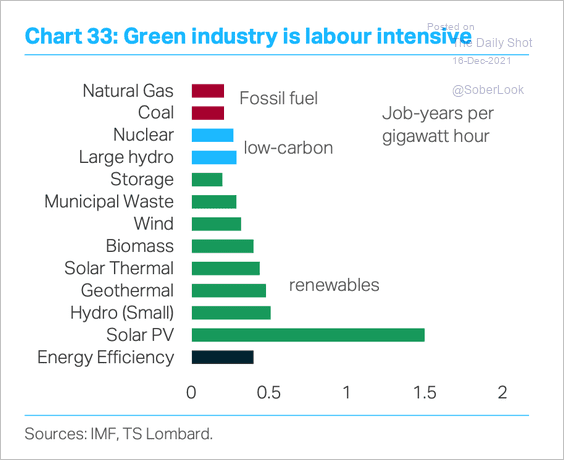 Source: TS Lombard
Back to Index
Equities
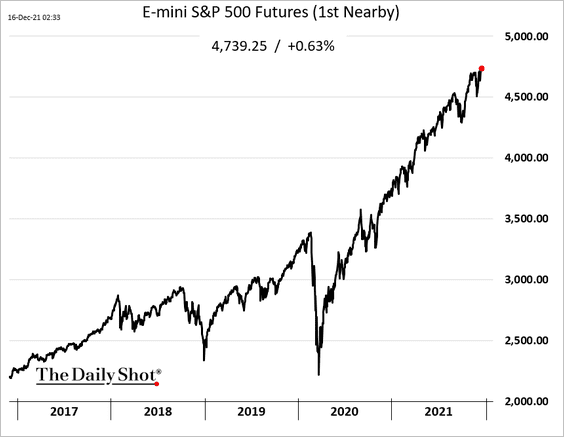
1. S&P 500 futures hit a record high this morning. Who cares about some hawkish central bank …
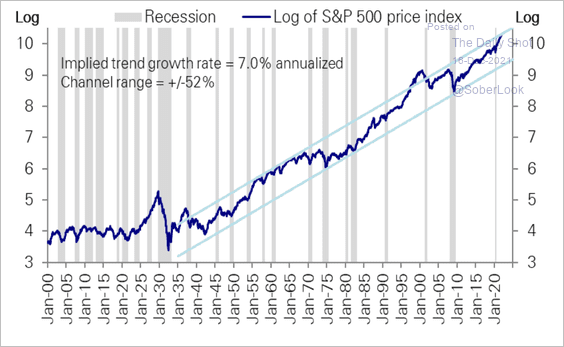
2. The S&P 500 is at the top of its very long-term (since the 1930s) channel. It broke out only twice (late 30s and 90s) and is at levels comparable to the booming 50s and 60s.
 Source: Deutsche Bank Research
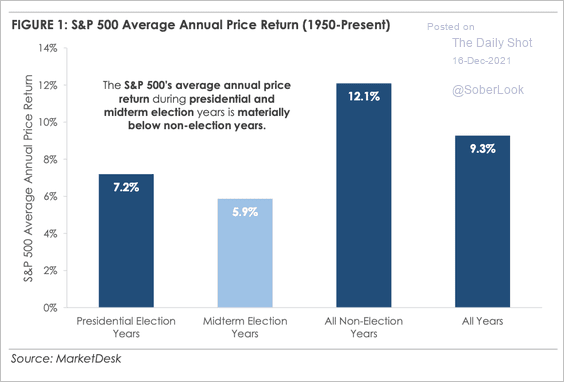
3. S&P 500 returns are slightly weaker during mid-term election years.
 Source: MarketDesk Research
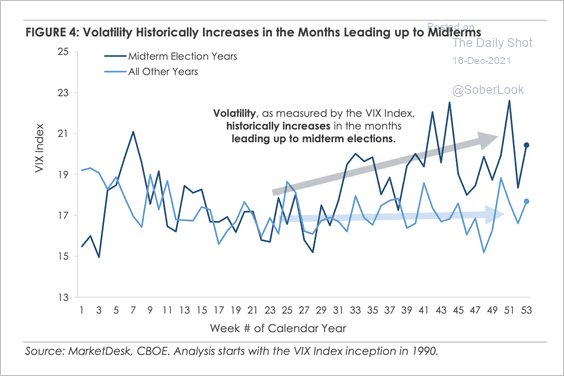
Stock volatility picks up in the months running up to the midterm elections.
 Source: MarketDesk Research
——————–
4. Q4 earnings estimates came down in a number of sectors.
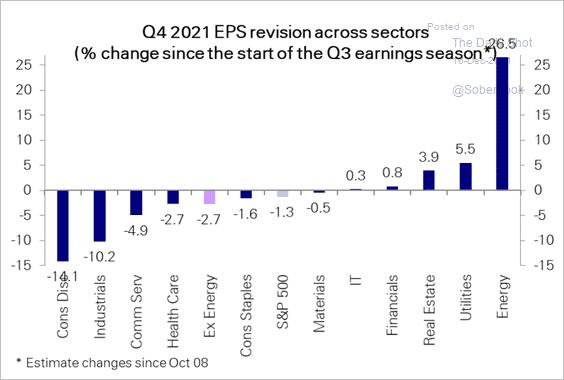 Source: Deutsche Bank Research
5. This chart shows S&P 500 target price estimates at the beginning of each year vs. actual levels at the end of the year.
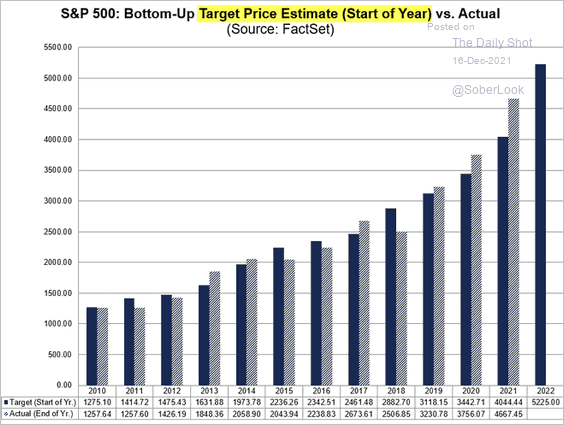 Source: @FactSet Read full article
6. Small-cap valuations are at a two-decade low relative to large caps.
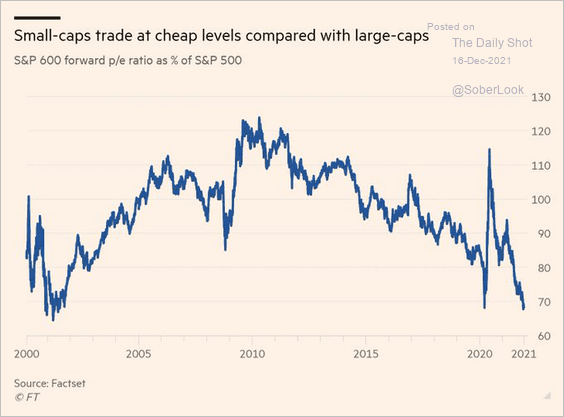 Source: @jessefelder, @FT Read full article
7. Finally, we have each sector’s correlation to GDP growth.
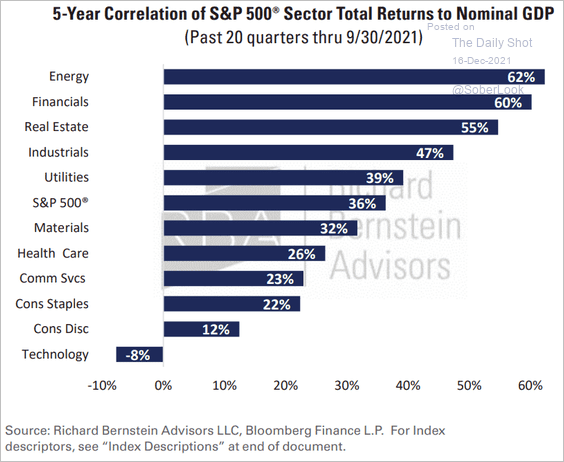 Source: Richard Bernstein Advisors
Back to Index
Credit
1. Sources of fixed income yield are more attractive outside of the US.
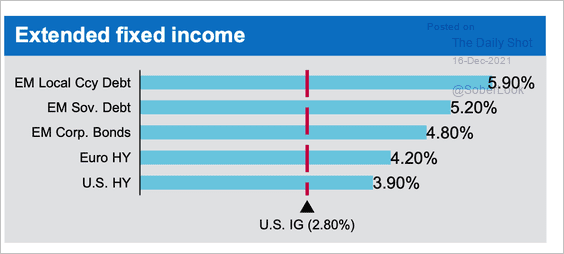 Source: J.P. Morgan Asset Management
2. Second-lien loan recoveries have been worse than senior unsecured debt.
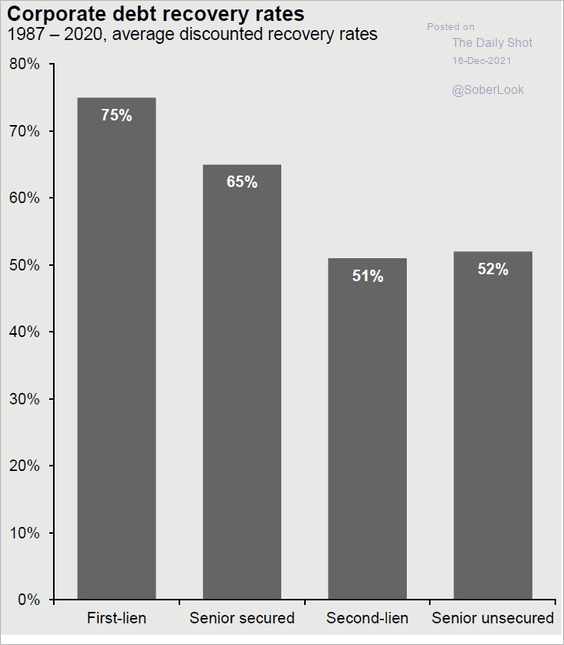 Source: J.P. Morgan Asset Management
Back to Index
Rates
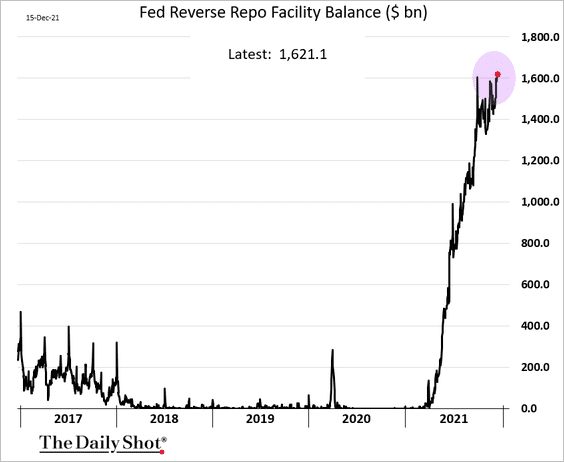
1. The Fed’s reverse repo program balances hit a record high. Flush with ECB cash, European banks have been swapping euros into dollars and depositing USD at the Fed’s reverse repo facility.
2. The US Treasury will be boosting its balances at the Fed, which will reduce liquidity in the banking system (reserves).
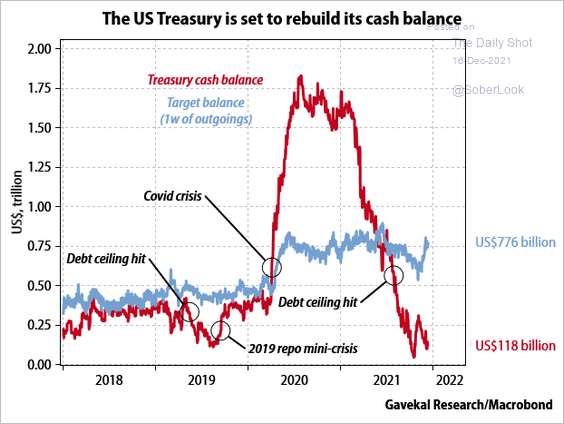 Source: Gavekal Research
Back to Index
Global Developments
1. Inflation has been driven by targeted government transfers (support for households) rather than the overall deficit increases.
![]() Source: Oxford Economics
Source: Oxford Economics
2. 2021 has been a good year for home price appreciation.
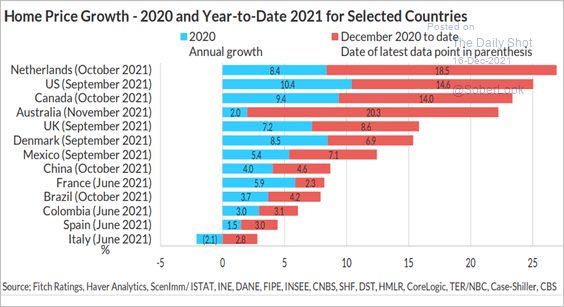 Source: Fitch Ratings
3. This chart shows business investment trends in select economies.
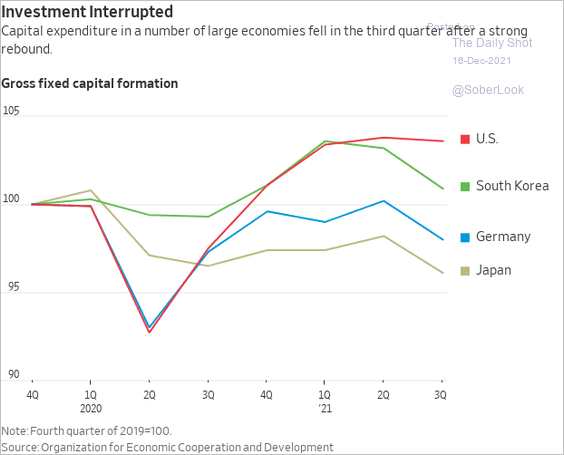 Source: @WSJ Read full article
4. Next, we have the PPI inflation outcome distribution for 2022 and 2023, from Numera Analytics.
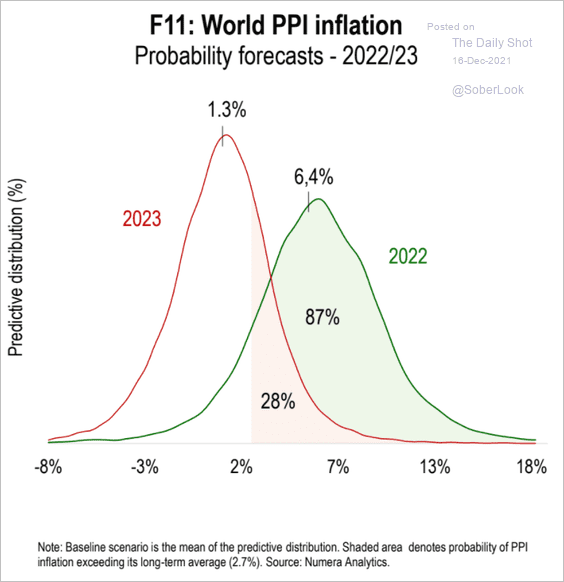 Source: Numera Analytics
5. Which economic pressures are central banks facing?
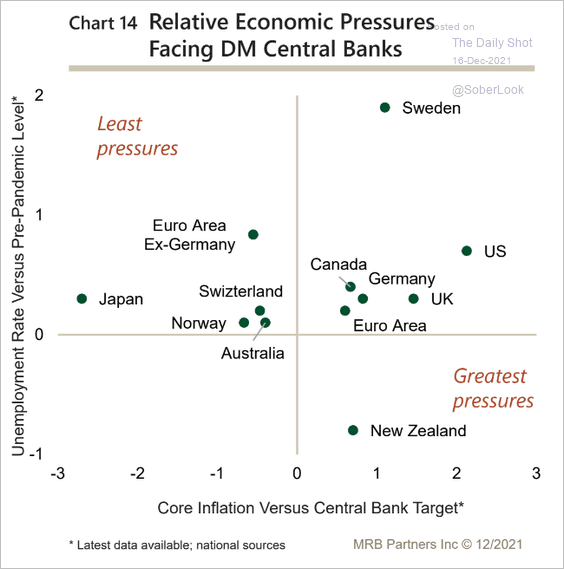 Source: MRB Partners
——————–
Food for Thought
1. Growth in data warehouses:
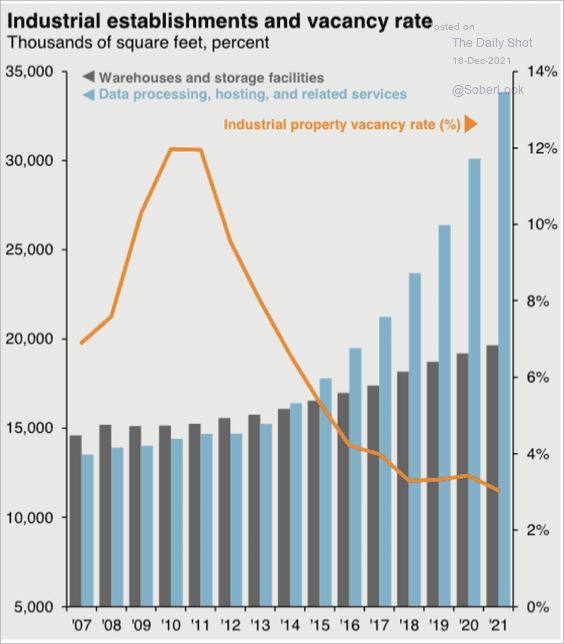 Source: J.P. Morgan Asset Management
2. City cost of living index:
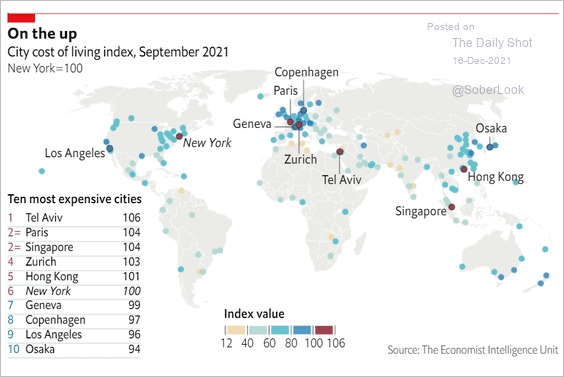 Source: The Economist Read full article
3. US mortgage applications by generation:
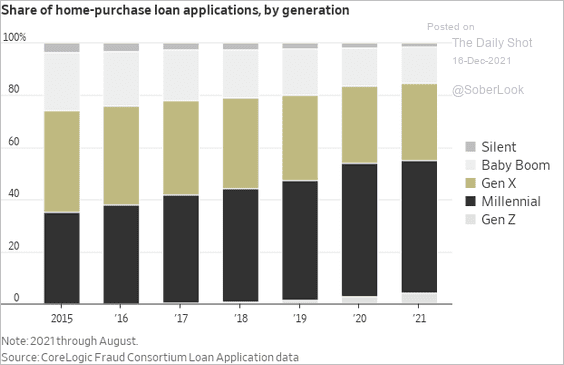 Source: @WSJ Read full article
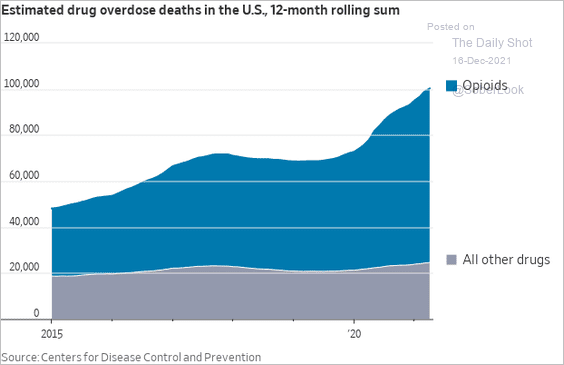
4. Next, we have some updates on US drug overdose deaths.
• Total deaths over time and by state:
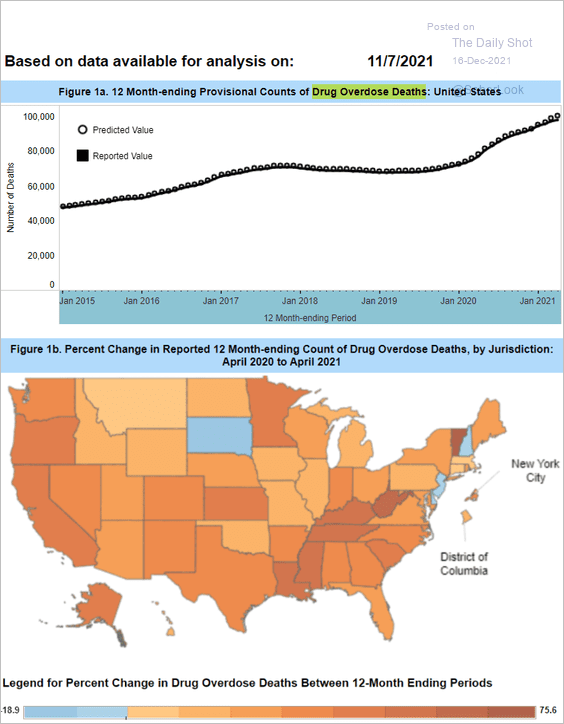 Source: CDC
• Deaths by drug type (2 charts):
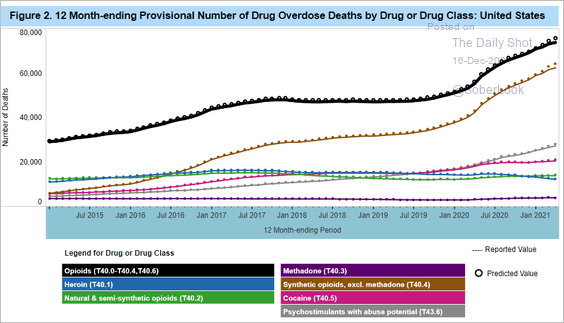 Source: CDC
 Source: @WSJ Read full article
• US deaths (per 100k people) vs. other advanced economies:
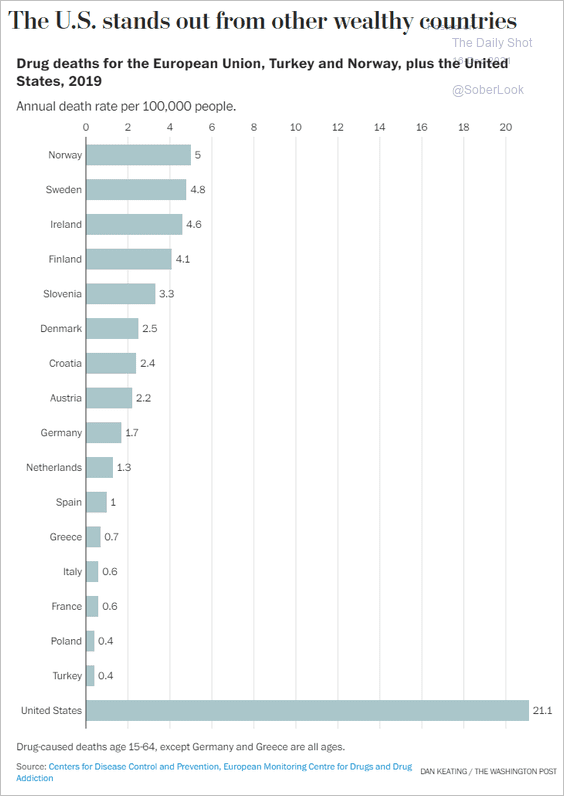 Source: The Washington Post Read full article
——————–
5. US need for high-skill immigrants:
 Source: Statista
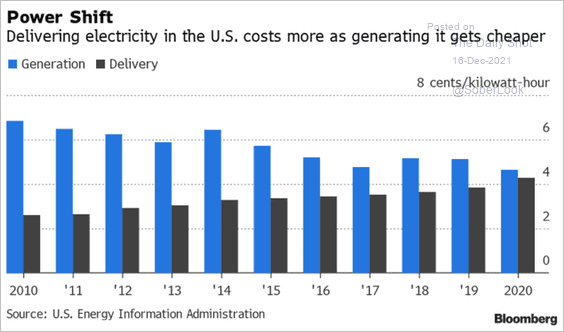
6. Power delivery costs:
 Source: @TheOneDave
7. US craft breweries:
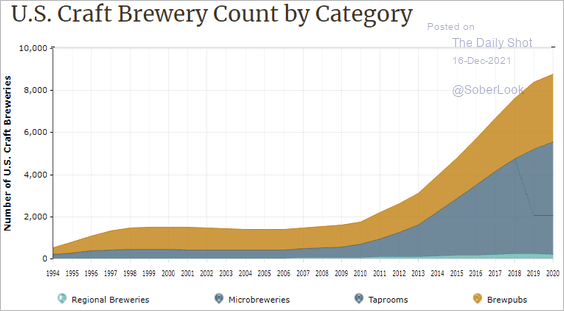 Source: Brewers Association Read full article
——————–
Back to Index