
The Daily Shot: 21-Dec-21
• Administrative Update
• The United States
• The United Kingdom
• The Eurozone
• Europe
• Asia – Pacific
• China
• Emerging Markets
• Cryptocurrency
• Commodities
• Energy
• Equities
• Rates
• Food for Thought
Administrative Update
Correction: The Daily Shot will not be published the week of December 27th.
Back to Index
The United States
1. The first full (25 bps) rate hike is now priced in for May of next year …
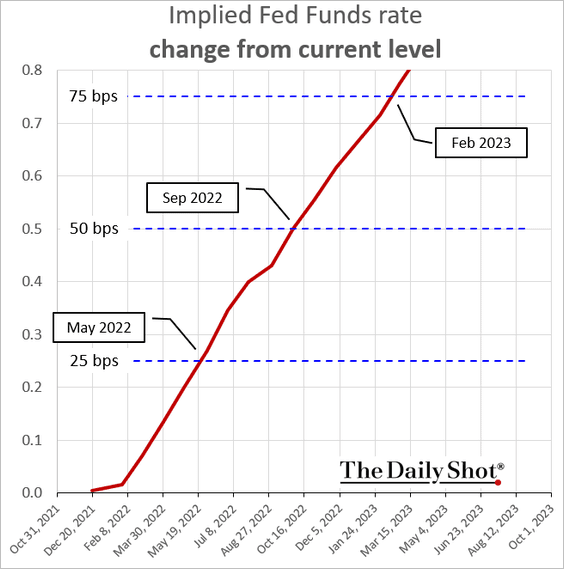
… with a 56% chance of liftoff in March.
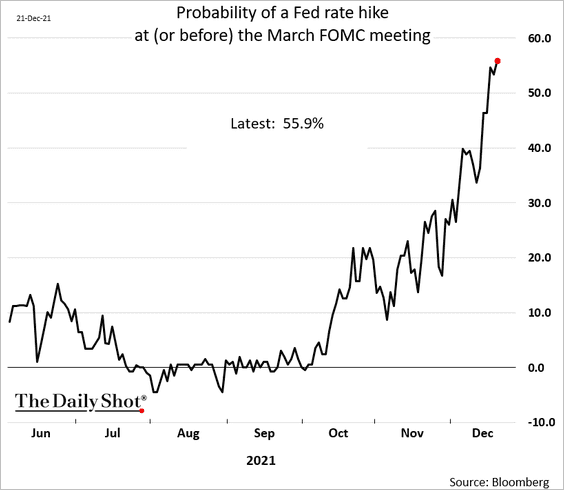
But there is now less certainty in the market about rate increases over the following 12 months.
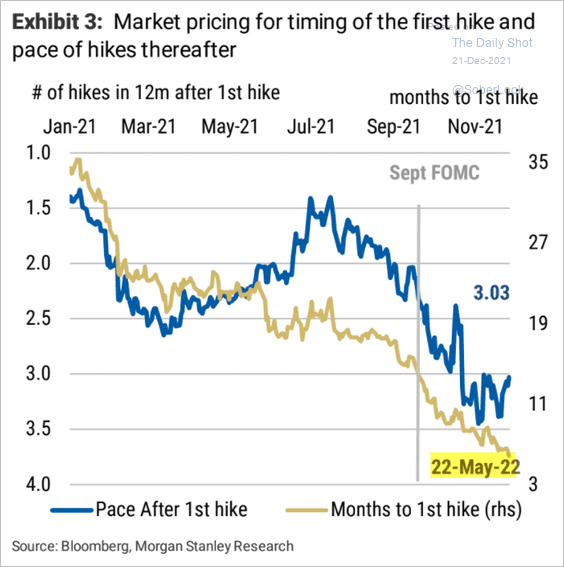 Source: Morgan Stanley Research
Nonetheless, Credit Suisse expects three hikes next year and four in 2023.
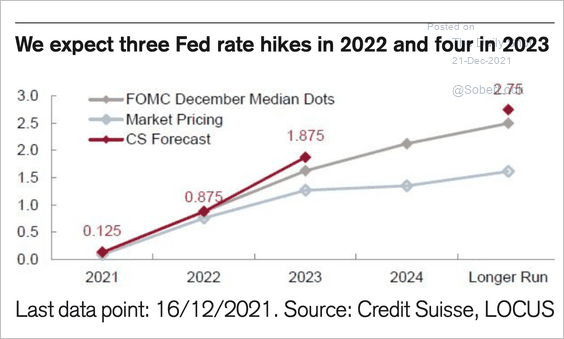 Source: @acemaxx, @csresearch
——————–
2. Will financial conditions tighten next year, similar to 2018 (as the Fed hikes rates)?
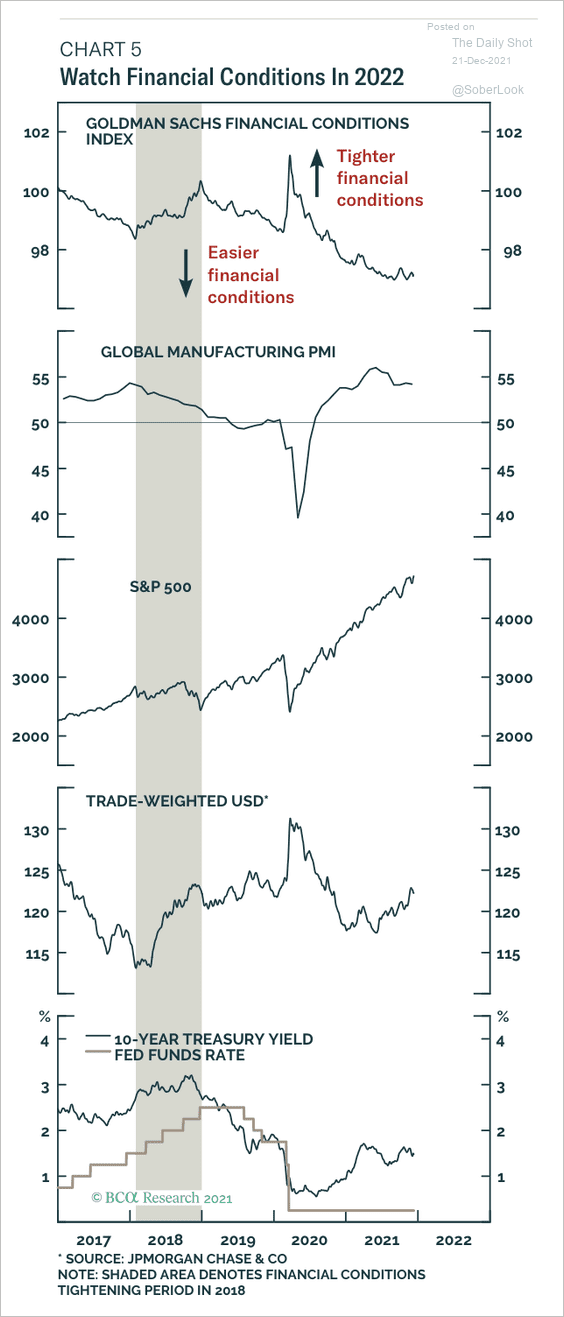 Source: BCA Research
3. The Conference Board’s leading index continues to point to robust economic activity ahead. Falling unemployment claims have been the key driver of this indicator over the past couple of months.
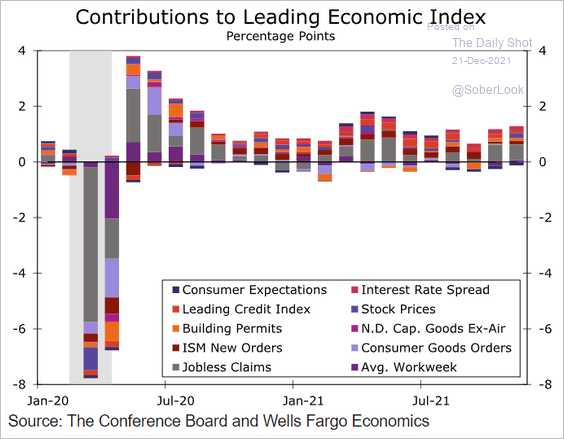 Source: Wells Fargo Securities
4. Here is the World Economics SMI index for the United States (manufacturing + services). Price growth remains near the highs, and profit margins are under pressure.
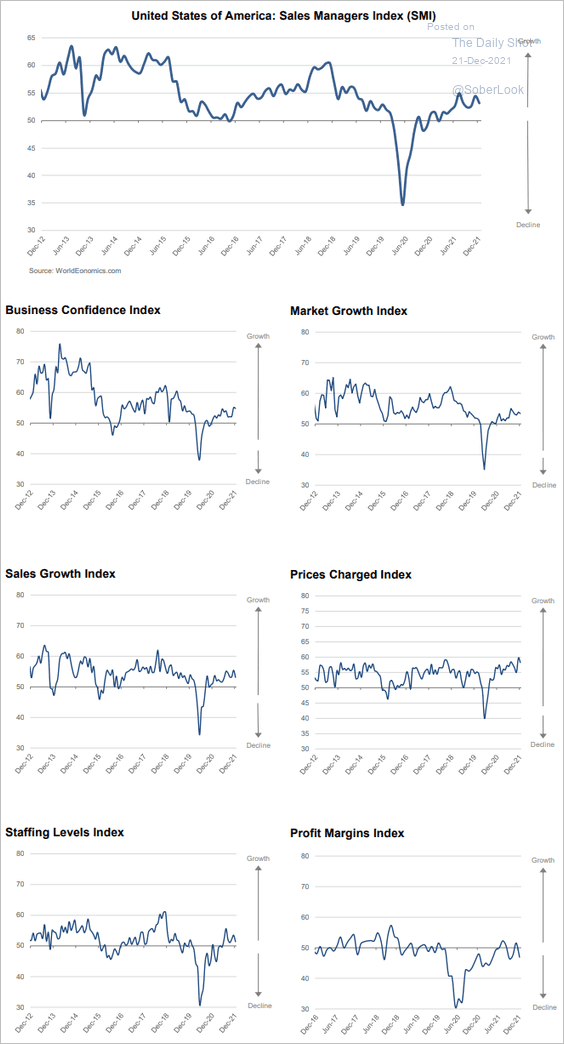 Source: World Economics
5. Next, we have some updates on the labor market.
• Job openings on Indeed continue to climb.
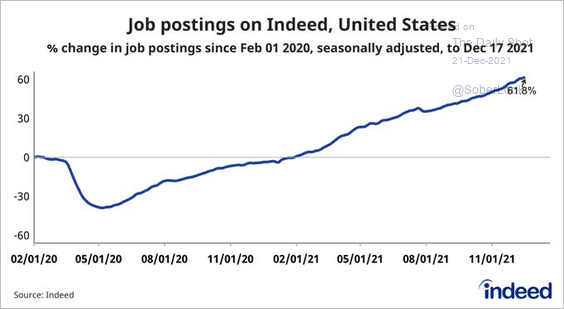 Source: @AE_Konkel, @indeed
• The quits rate suggests that the unemployment rate should be much lower.
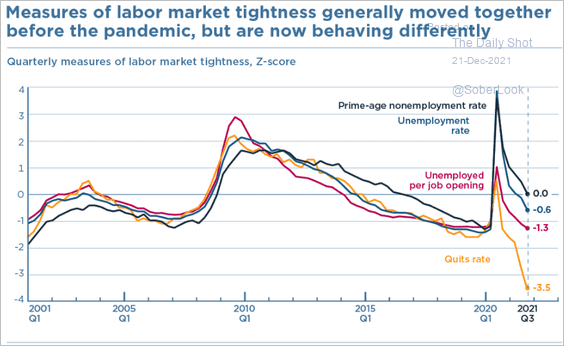 Source: PIIE Read full article
• Fewer businesses are participating in the government’s jobs survey, creating volatility and large adjustments in the official employment data.
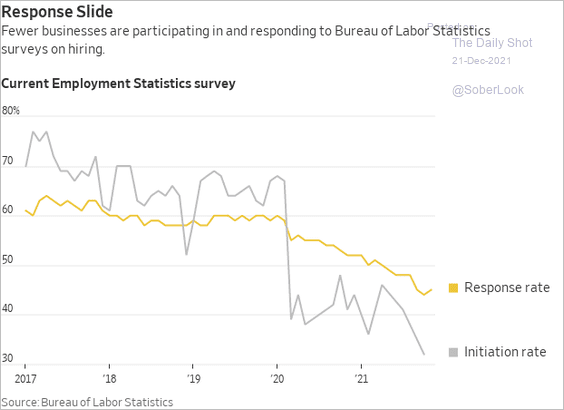 Source: @WSJ Read full article
• Morgan Stanley expects labor force participation to keep climbing over the next couple of years.
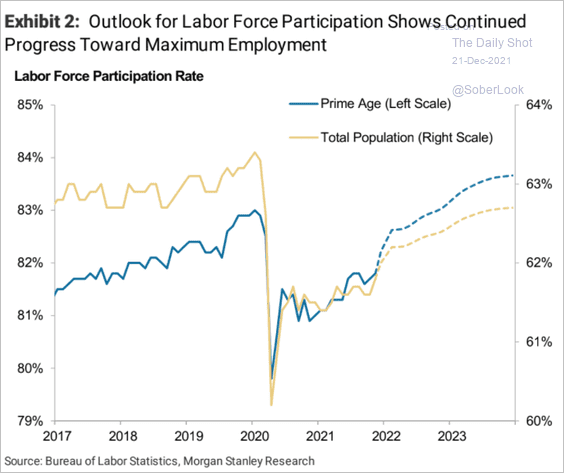 Source: Morgan Stanley Research
• Here is the infrastructure bill’s (IIJA) impact on growth and employment.
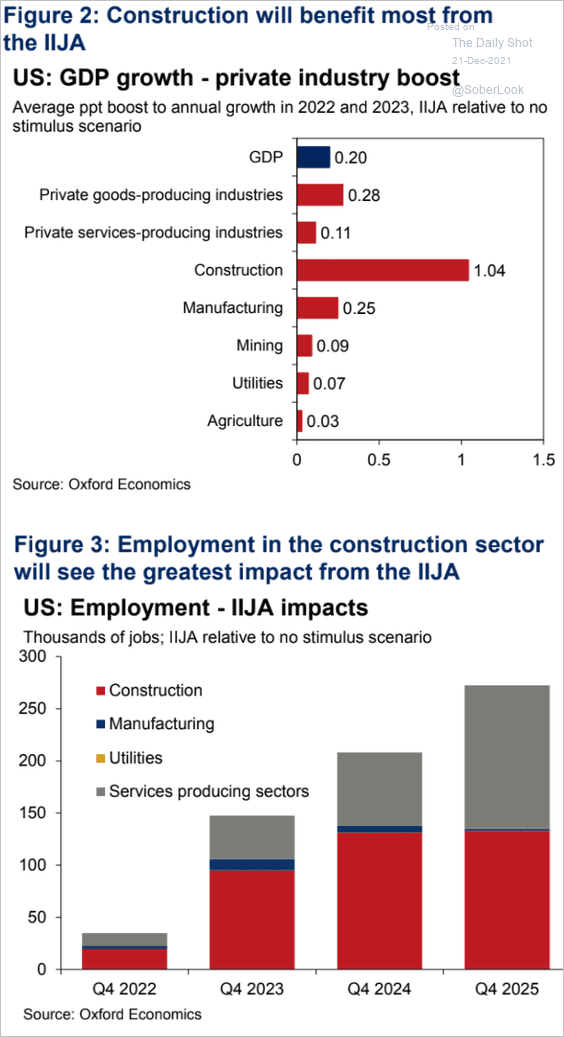 Source: Oxford Economics
——————–
6. COVID cases are on the rise again, with omicron now the dominant variant (2nd chart). Omicron is highly contagious (similar to measles), with a much shorter incubation period than previous COVID variants.
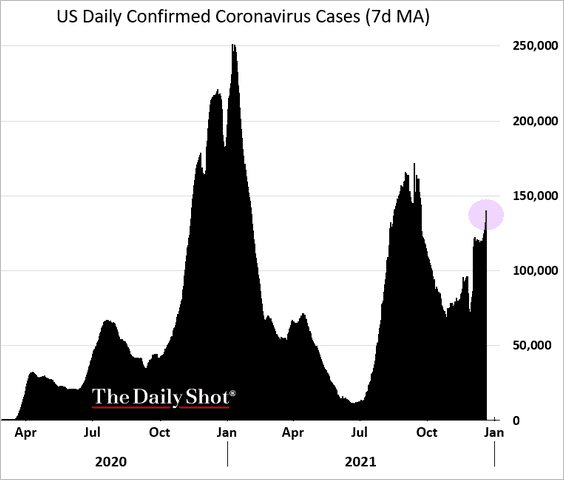
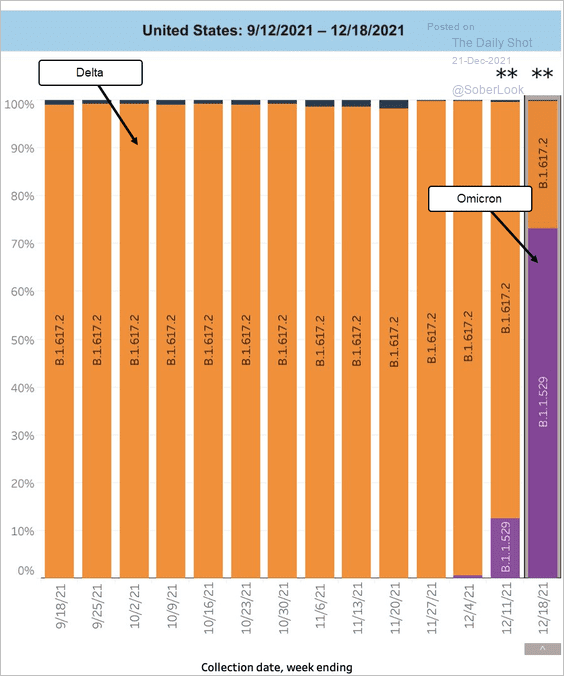 Source: @DrTomFrieden
Back to Index
The United Kingdom
1. The CBI report showed that industrial orders reminded robust this month.
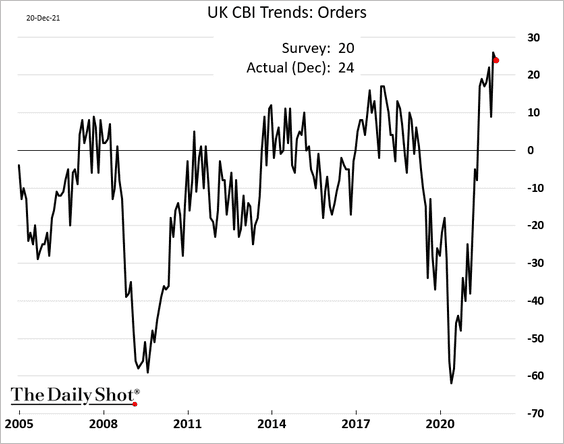
Orders have been outpacing production due to supply issues.
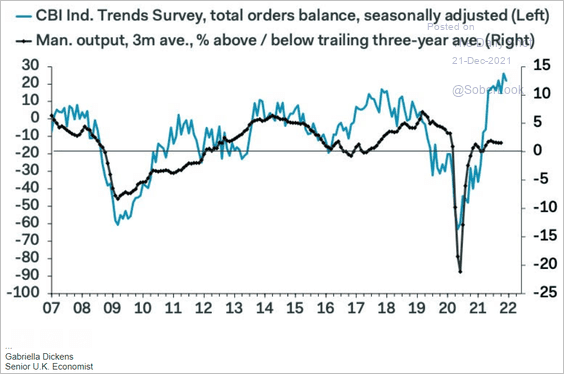 Source: Pantheon Macroeconomics
Indeed, the measure of inventories of finished goods hit a record low.
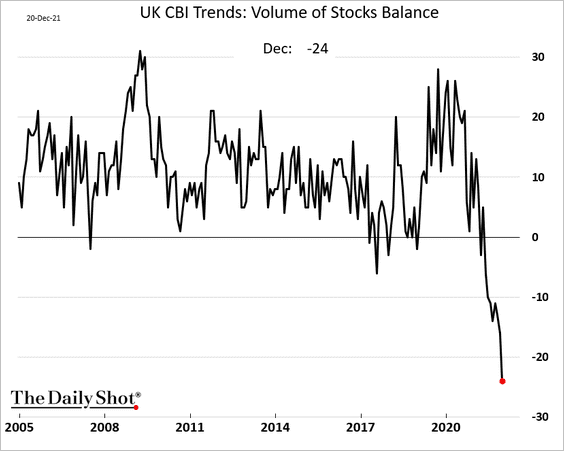
 Source: Reuters Read full article
——————–
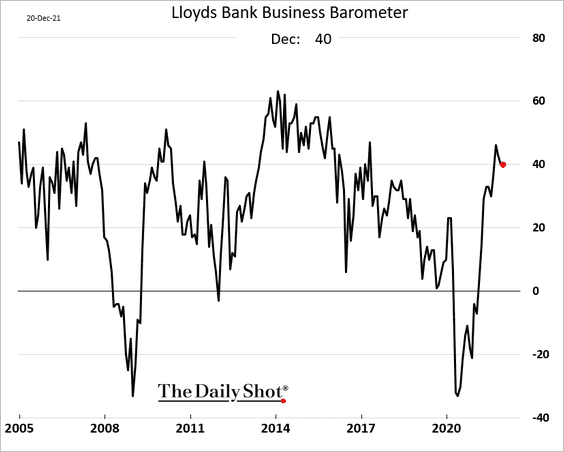
2. The Lloyds business sentiment indicator is holding up well.
3. This chart shows COVID cases vs. hospitalizations.
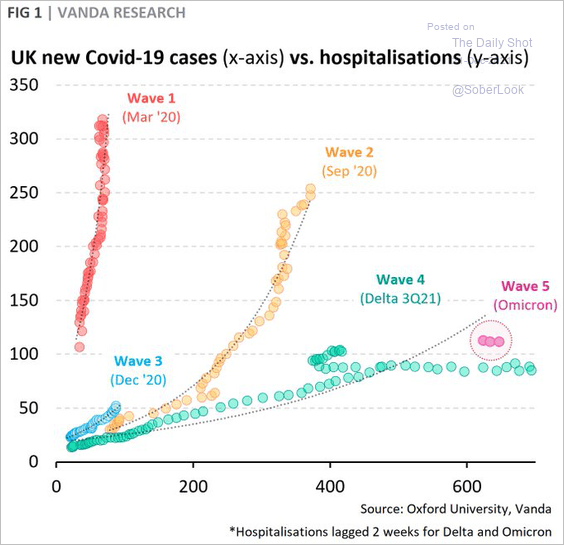 Source: @VPatelFX
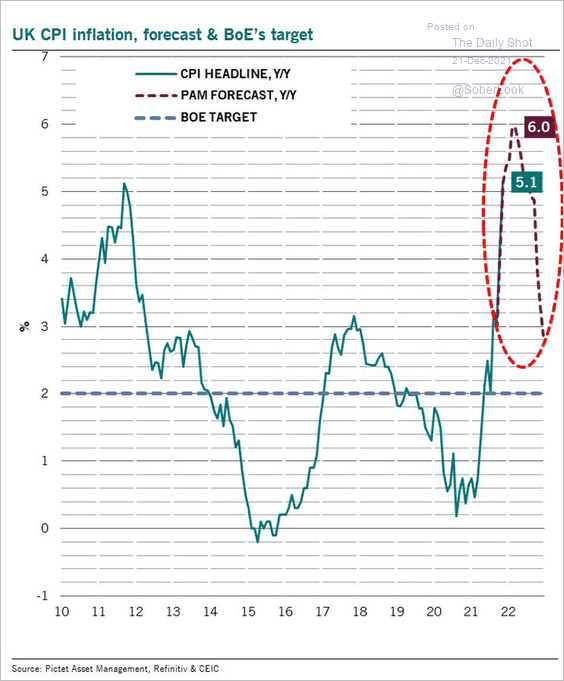
4. The CPI is expected to peak at 6% next year, according to Pictet Wealth Management.
 Source: @MarkoNikolay
Back to Index
The Eurozone
1. More euro-area firms are reporting severe labor shortages, especially in manufacturing and construction.
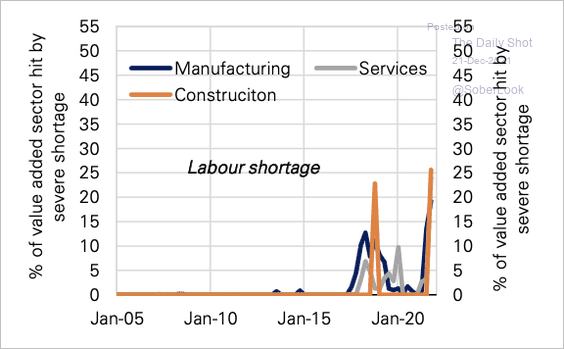 Source: Deutsche Bank Research
Labor market slack is expected to return to pre-pandemic levels around mid-2023.
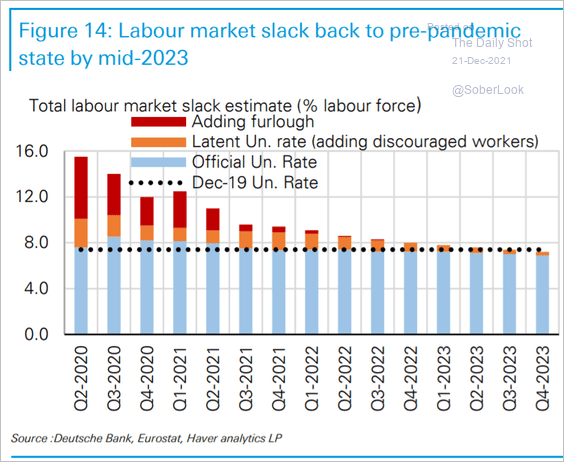 Source: Deutsche Bank Research
——————–
2. Next, we have some updates on the ECB’s QE program.
• Debt supply vs. purchases:
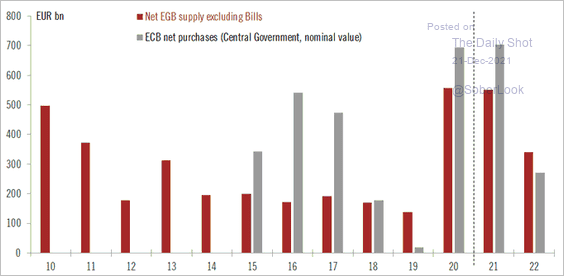 Source: @fwred
• Cumulative asset purchases:
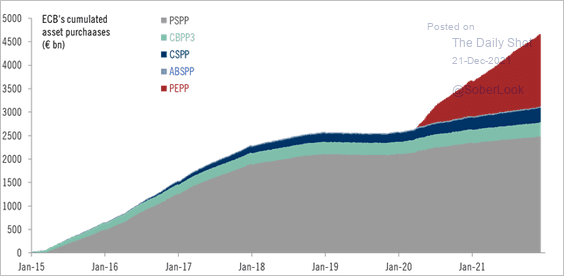 Source: @fwred
• The ECB’s lending programs:
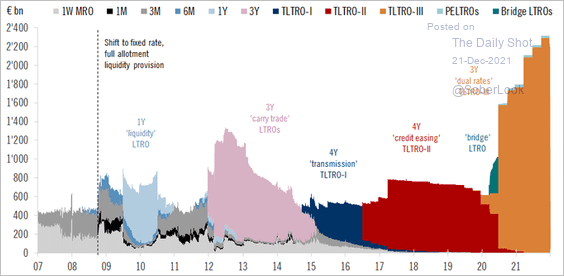 Source: @fwred
——————–
3. This scatterplot shows the percentage of French ICU and hospital patients who are out within seven days.
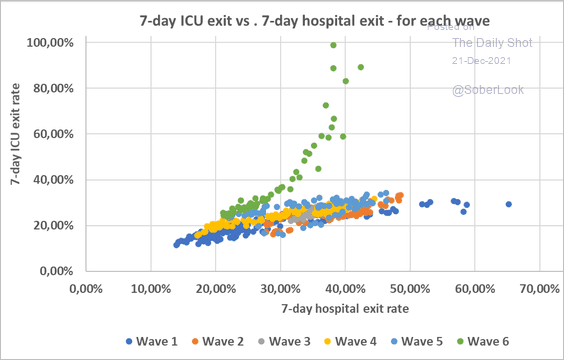 Source: @jeuasommenulle
Back to Index
Europe
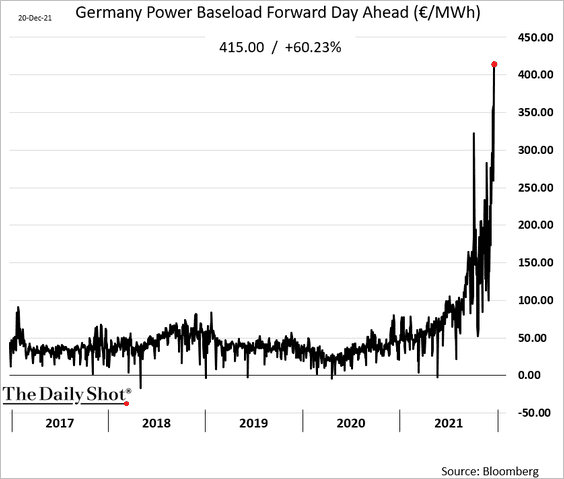
1. Natural gas and power prices continue to surge.
• Natural gas inventories:
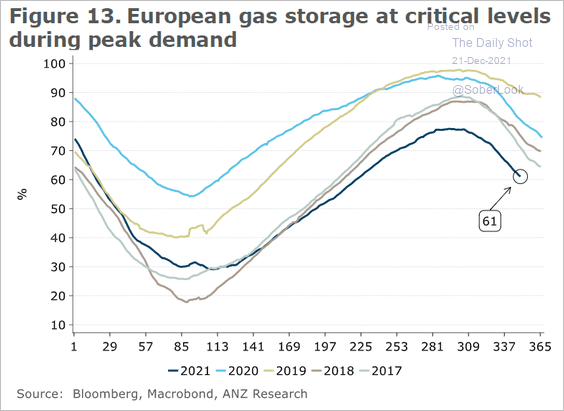 Source: ANZ Research
• Natural gas prices (new record highs):
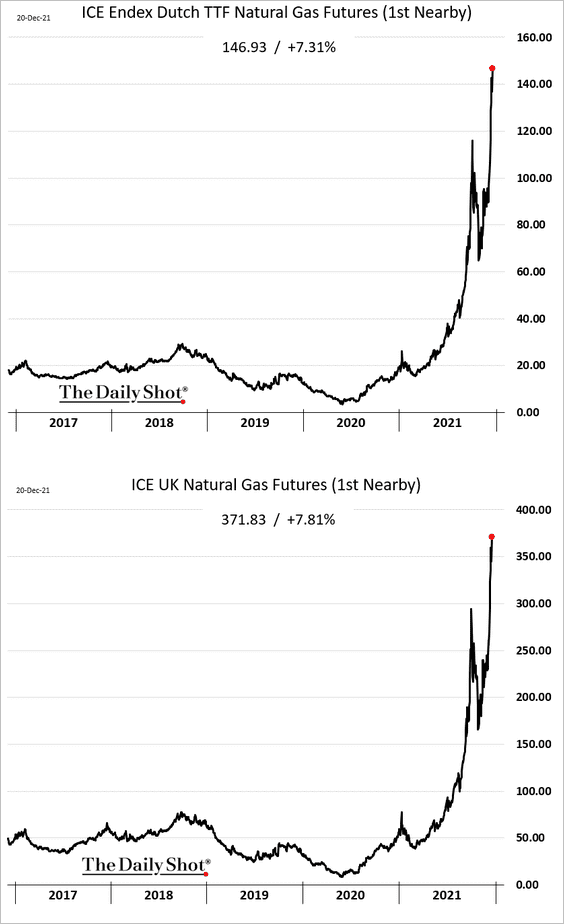
• German day-ahead power prices (record high).
——————–
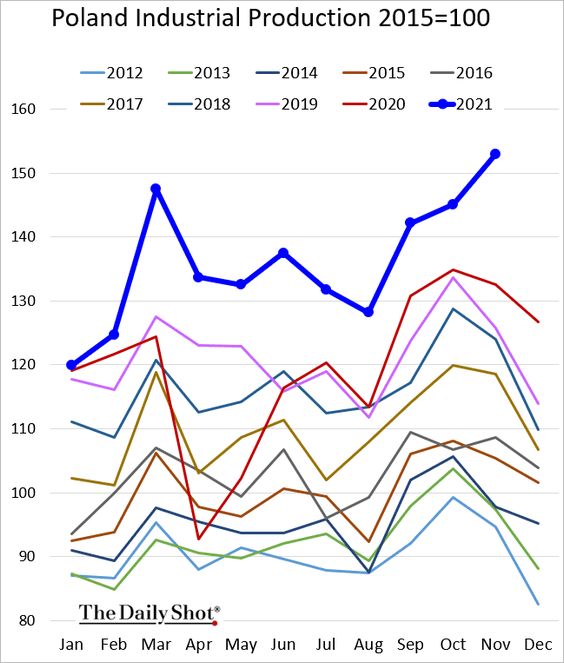
2. Poland’s industrial production continues to surge.
3. This chart shows inflation rates across the EU.
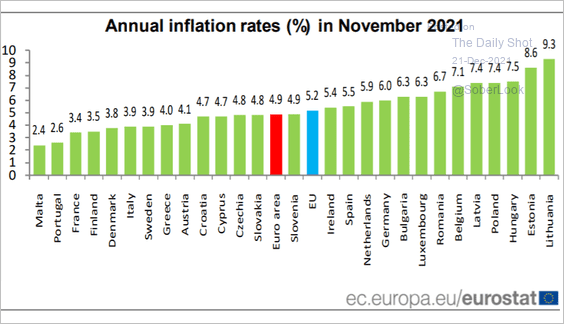 Source: Eurostat Read full article
4. Finally, we have EU carbon intensity by sector.
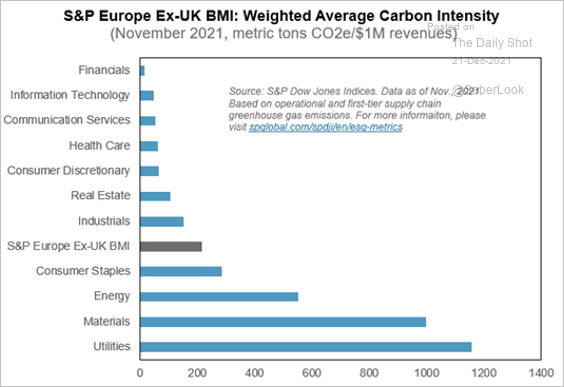 Source: S&P Global Market Intelligence
Back to Index
Asia – Pacific
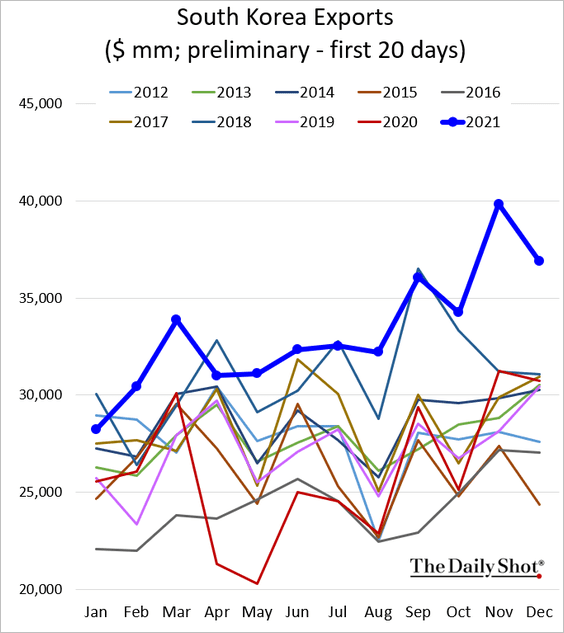
1. South Korea’s exports remain remarkably strong.
2. Australian mortgage rates are rising well ahead of any RBA hikes.
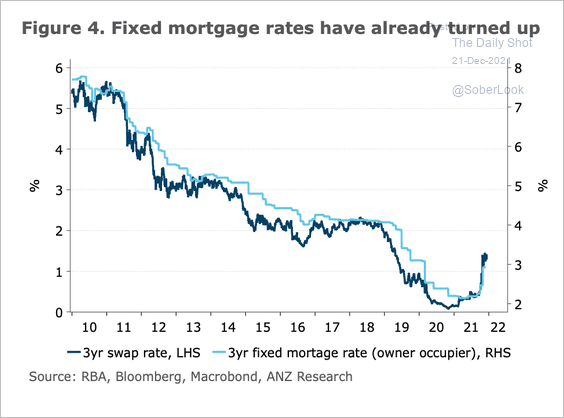 Source: ANZ Research
Back to Index
China
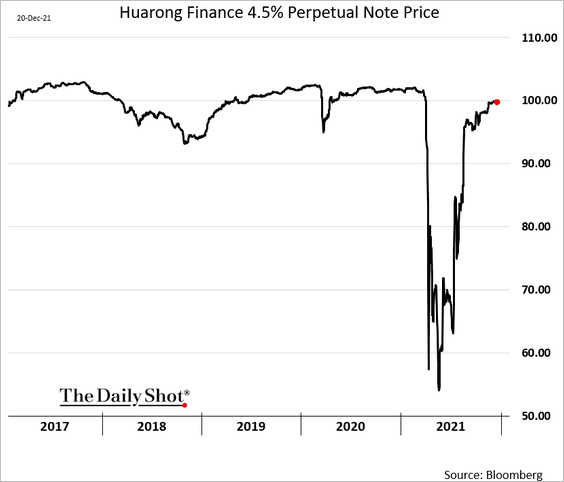
1. Huarong’s debt has recovered after the government bailout.
2. These charts depict China’s industrial production and retail sales relative to the pre-COVID trend.
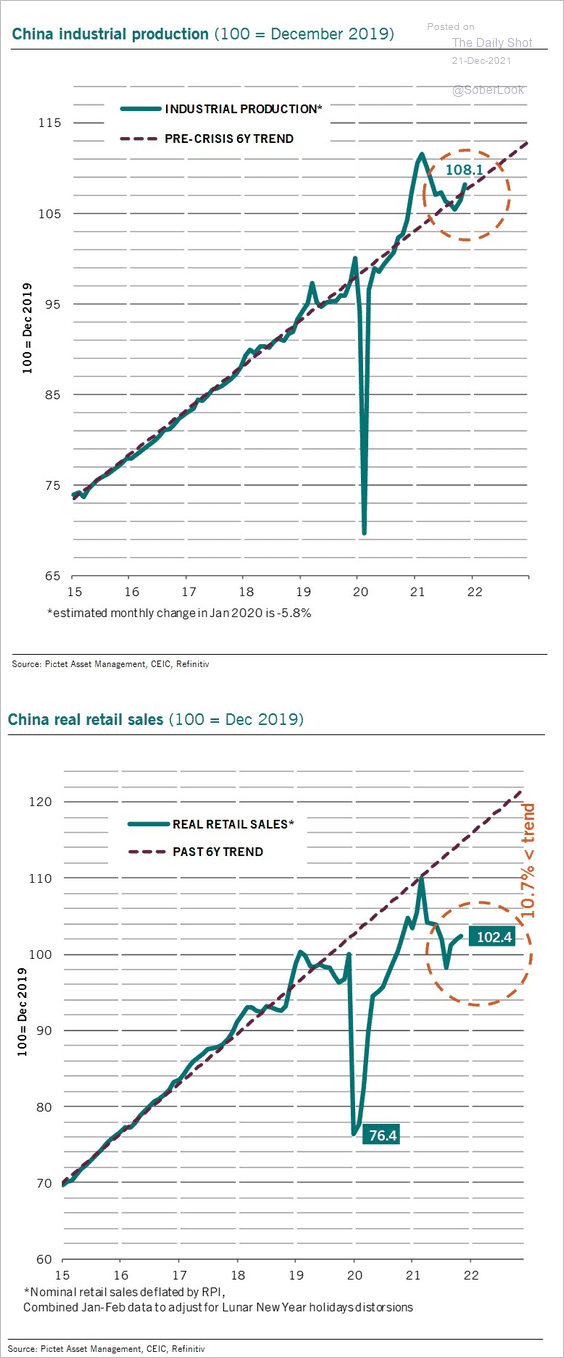 Source: @PkZweifel
3. Recent flows into China’s bonds have been massive when compared to other EM peers.
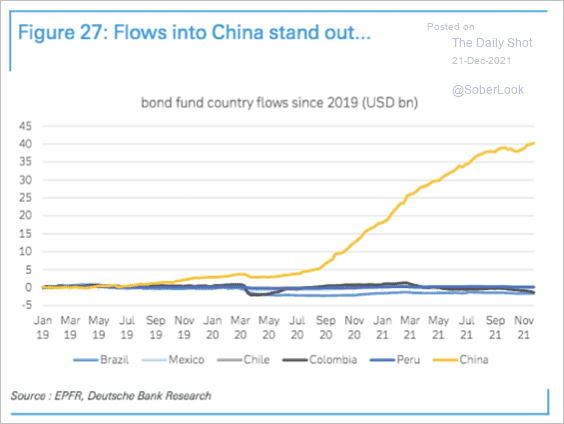 Source: Deutsche Bank Research
Yuan-denominated bonds have been outperforming both EM bonds and Treasuries (2 charts).
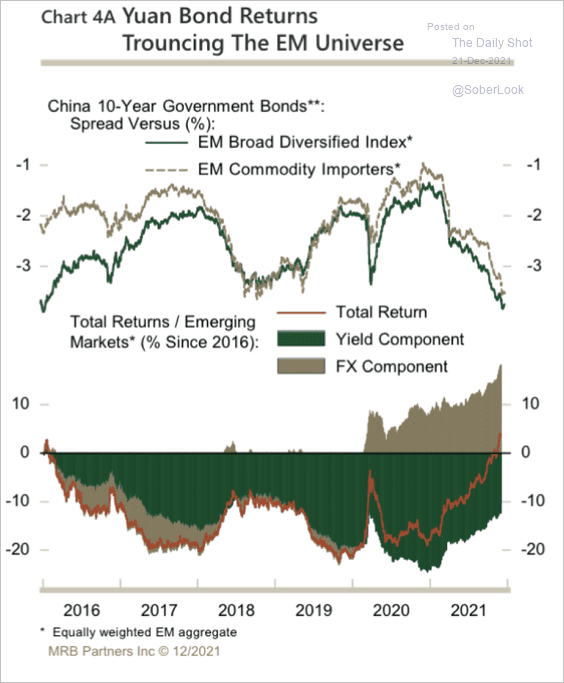 Source: MRB Partners
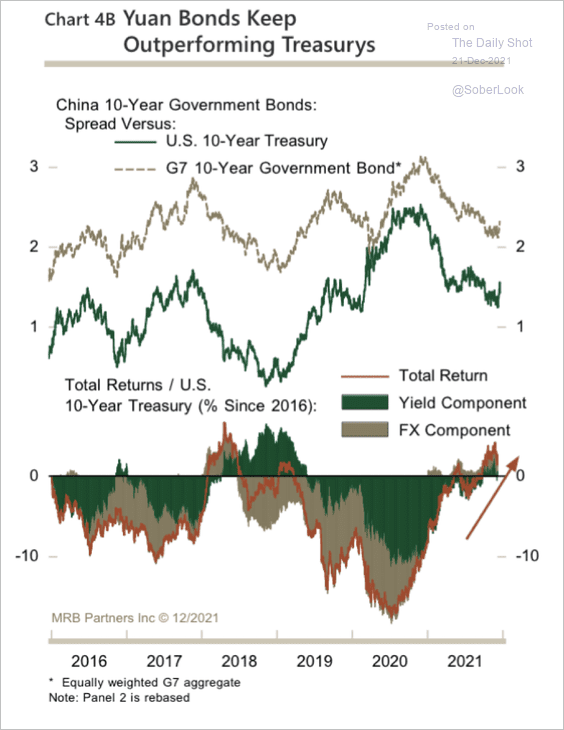 Source: MRB Partners
——————–
4. The iShares China Lage-Cap ETF is nearing the pandemic-era low.
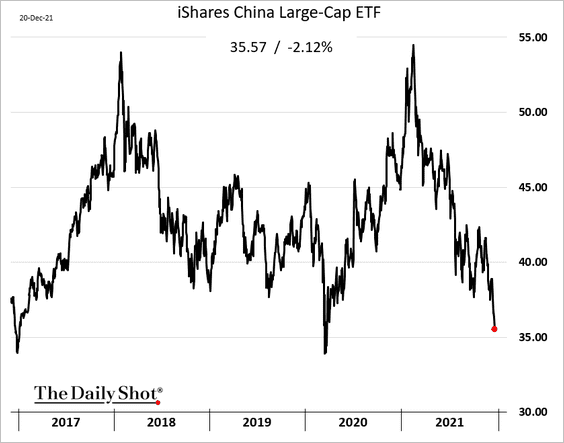 h/t @AlessioUrban
Back to Index
Emerging Markets
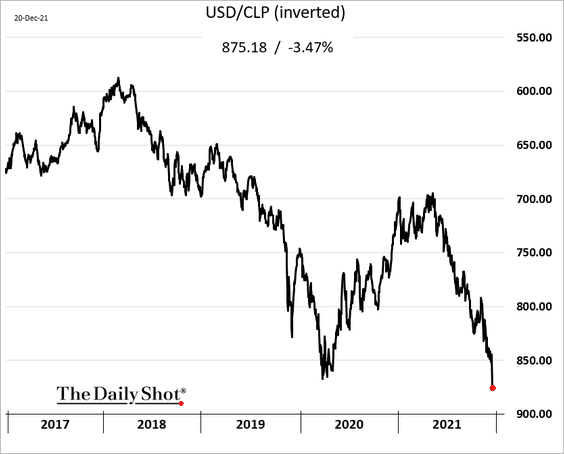
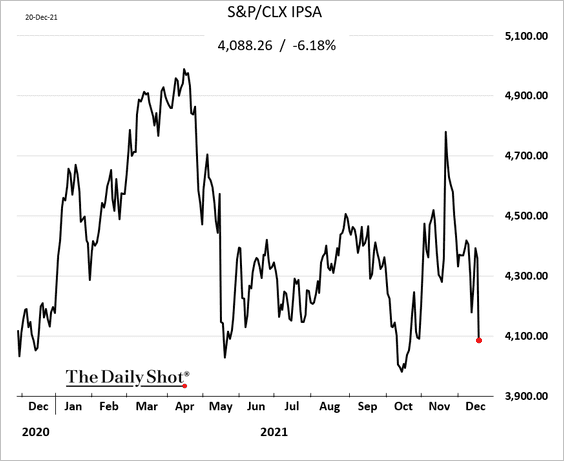
1. Chile’s markets slumped in response to the election outcome.
 Source: CNN World Read full article
• The peso:
• The stock market:
——————–
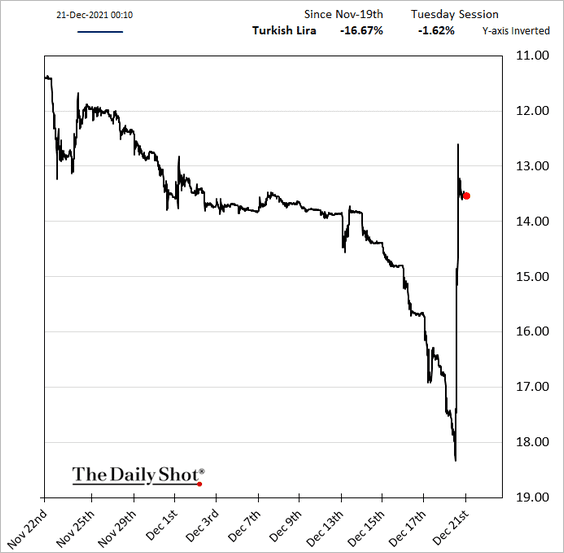
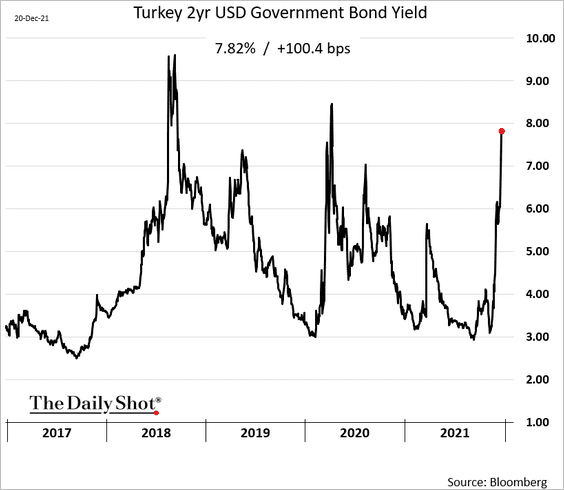
2. The Turkish lira rallied by over 20% as the government promised that it will protect lira deposits against currency depreciation.
 Source: Reuters Read full article
Turkish sovereign CDS spreads …
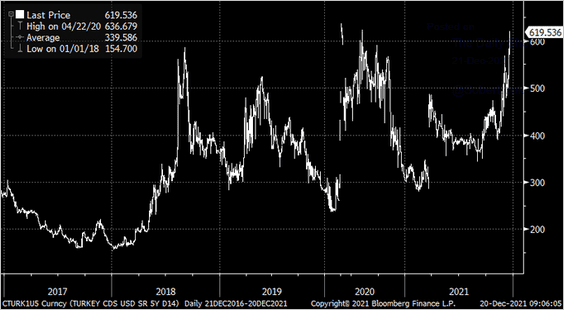 Source: @Marcomadness2
… and hard-currency bond yields remain elevated.
——————–
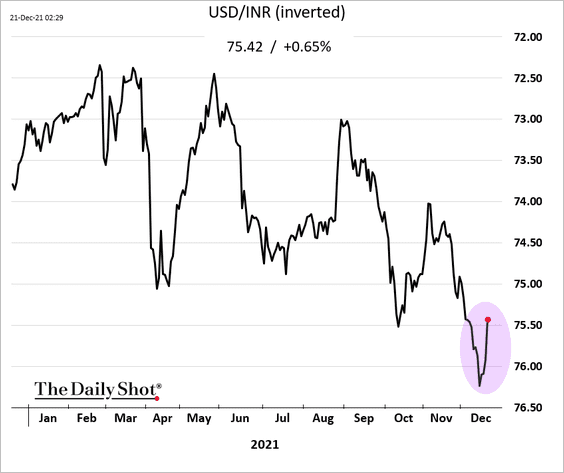
3. The Indian rupee rebounded on talk of RBI Intervention.
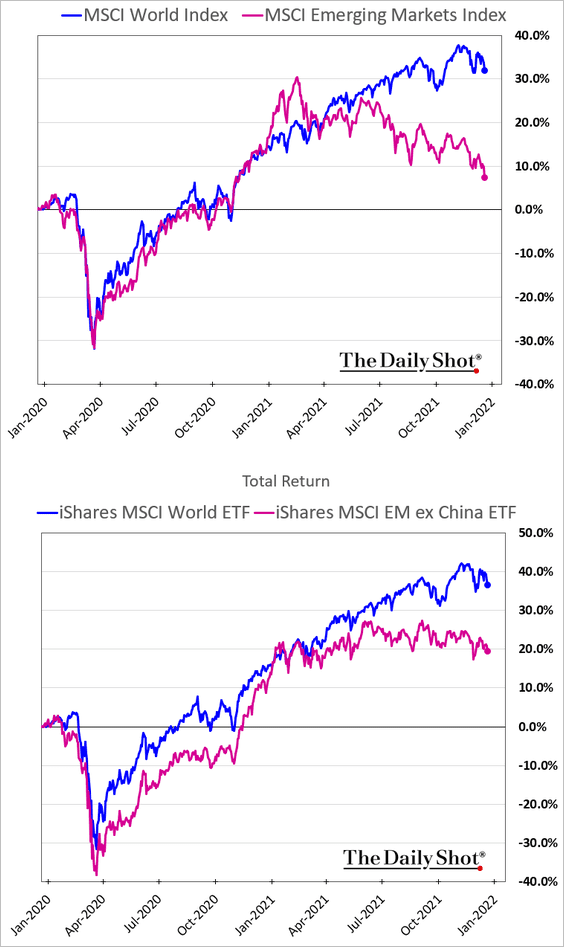
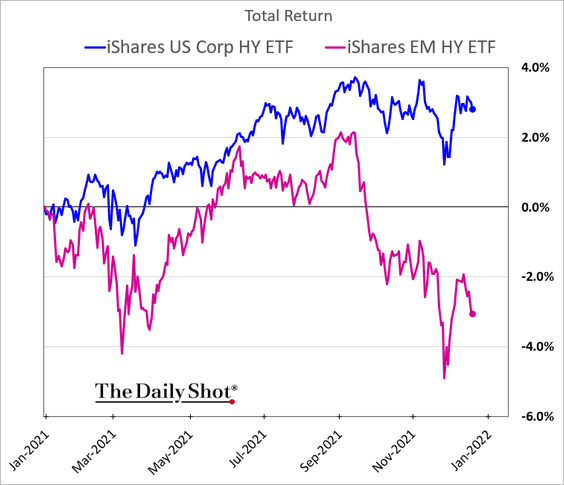
4. EM equities continue to underperform.
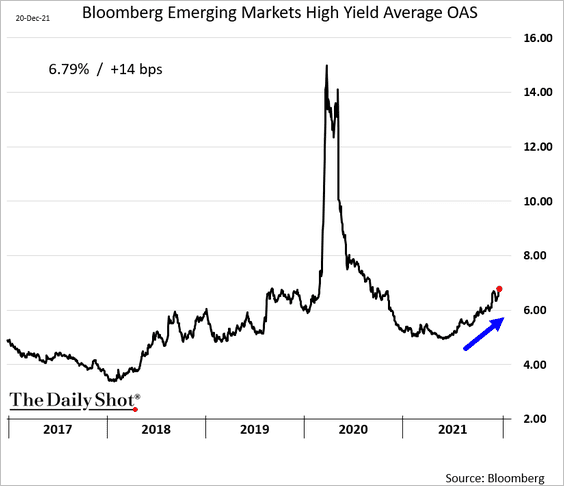
5. EM high-yield bonds remain under pressure.
• Spreads:
• Prices (in USD):
Back to Index
Cryptocurrency
1. Here is a timeline of central bank digital currency (CBDC) research and experiments in various countries.
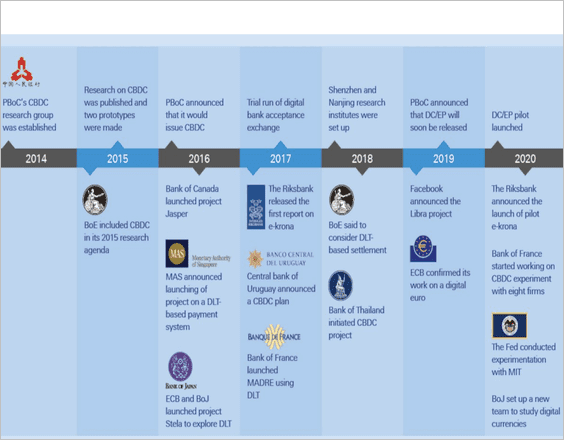 Source: Deutsche Bank Research Read full article
2. Digital asset funds saw outflows totaling $142 million last week, which is the largest weekly outflow on record.
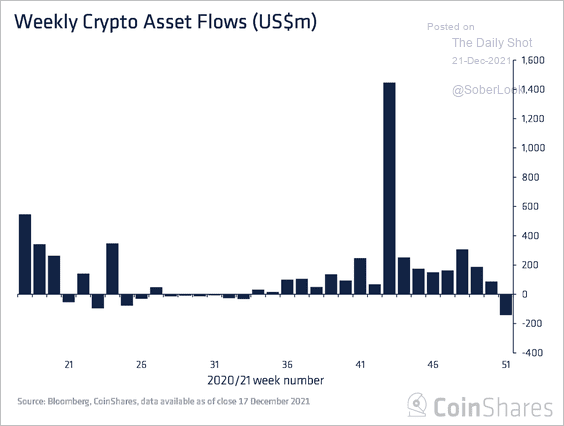 Source: CoinShares Read full article
Bitcoin and Ethereum investment products accounted for most outflows last week, while some altcoin products saw inflows.
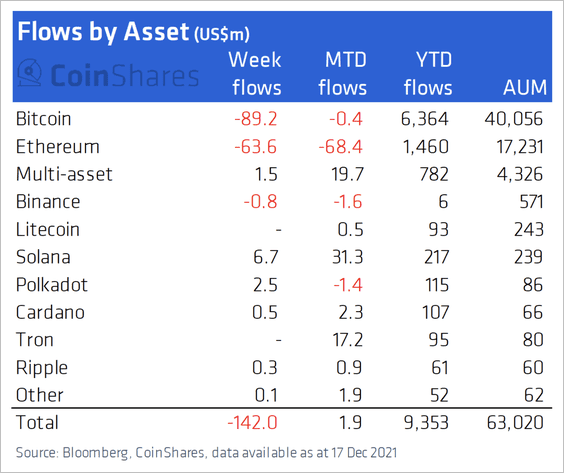 Source: CoinShares Read full article
——————–
3. The Grayscale Bitcoin Trust discount to NAV hit a new record.
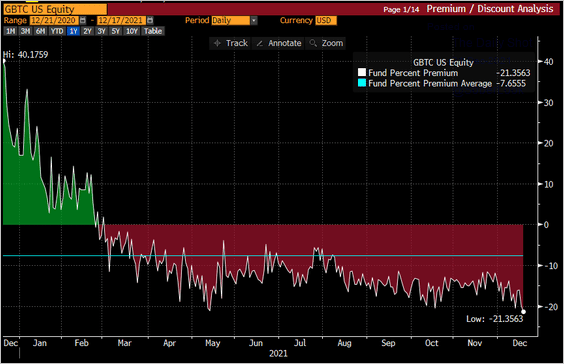 Source: @kgreifeld, @crypto, @dliedtka Read full article
Back to Index
Commodities
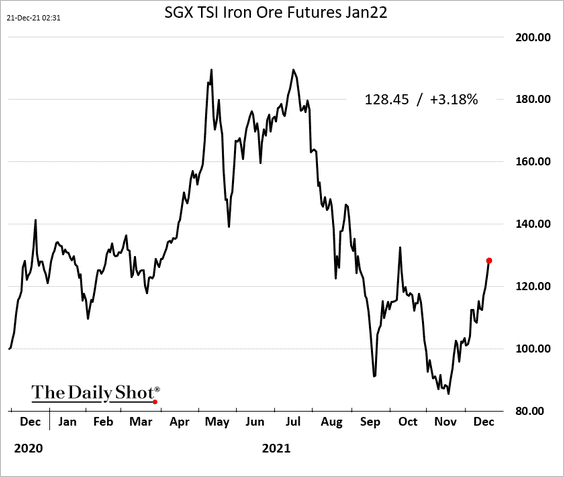
1. Iron ore continues to rebound.
This chart shows the breakdown of global iron ore demand.
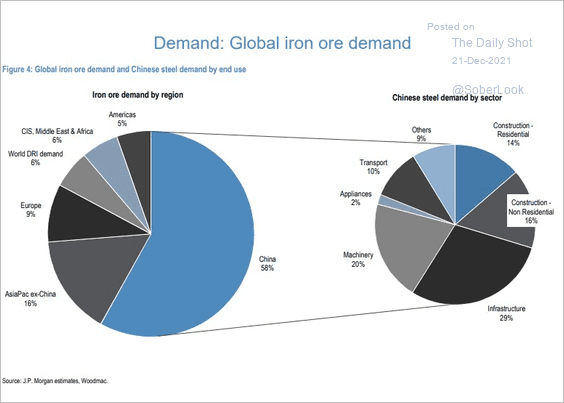 Source: JP Morgan Research; @chigrl
——————–
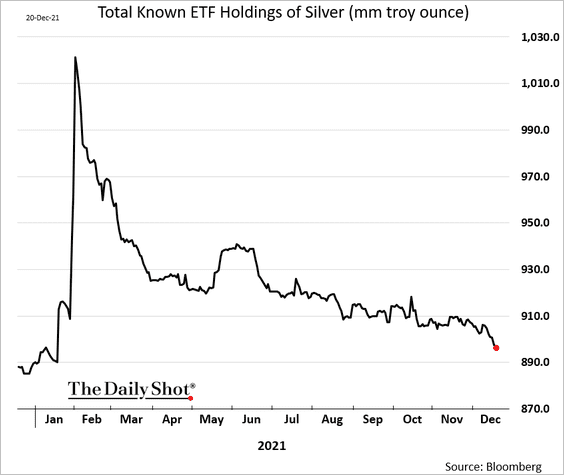
2. ETFs’ holdings of silver have been drifting lower.
3. China’s gold imports accelerated in recent months.
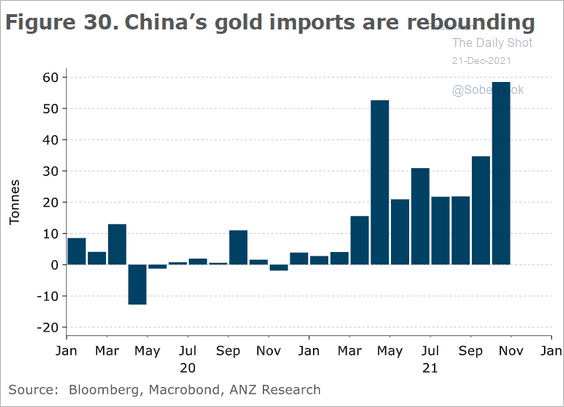 Source: ANZ Research
4. Coffee futures took a hit on Monday.
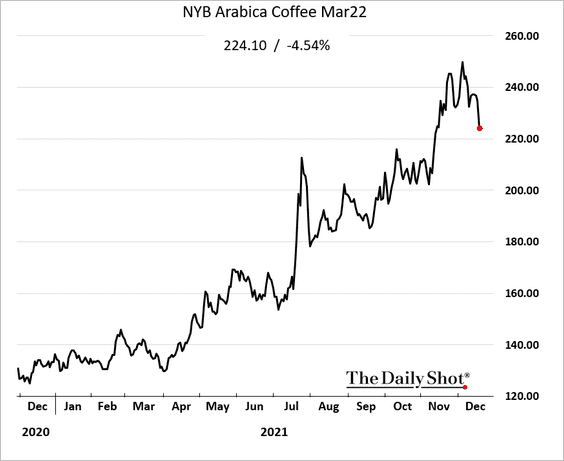
 Source: Bloomberg Read full article
Back to Index
Energy
1. Solar has become significantly cheaper over the past decade and is now less expensive than other energy sources.
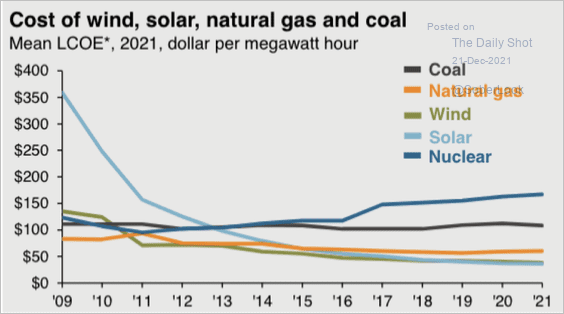 Source: J.P. Morgan Asset Management
But prices are going up this year. China controls the solar panel supply chain.
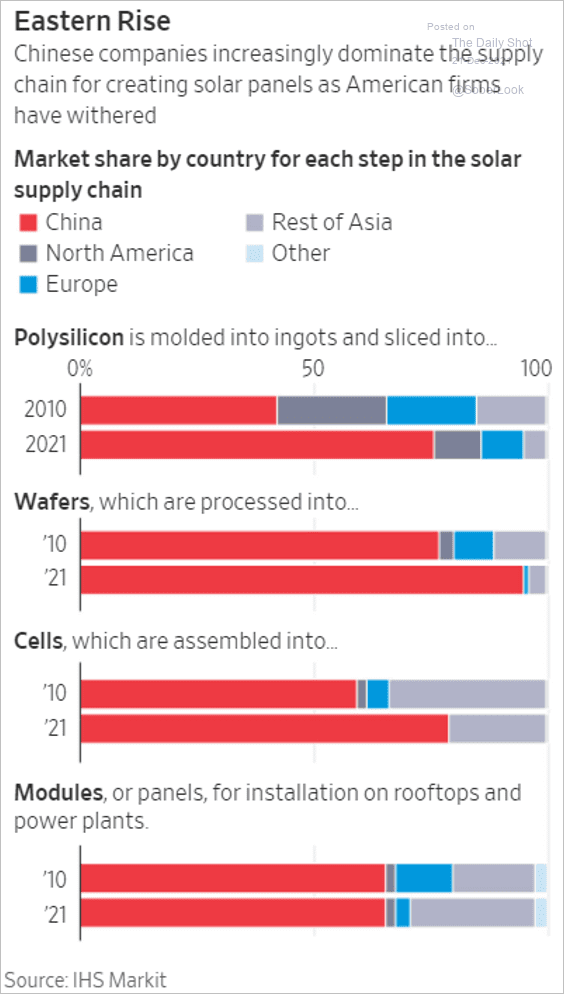 Source: @WSJ Read full article
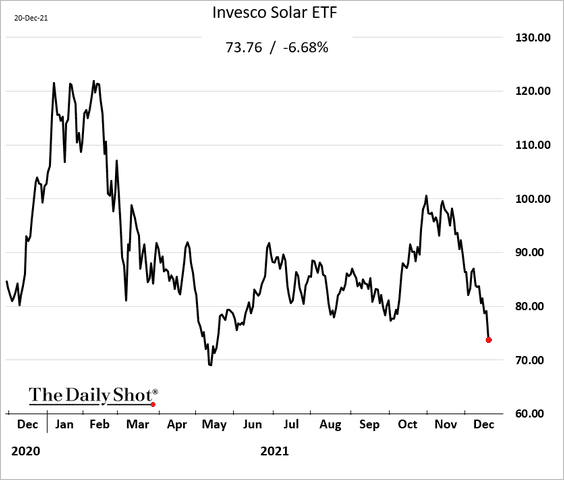
Solar-focused equities have been tumbling.
——————–
2. US LNG exports hit a record high as global demand surges.
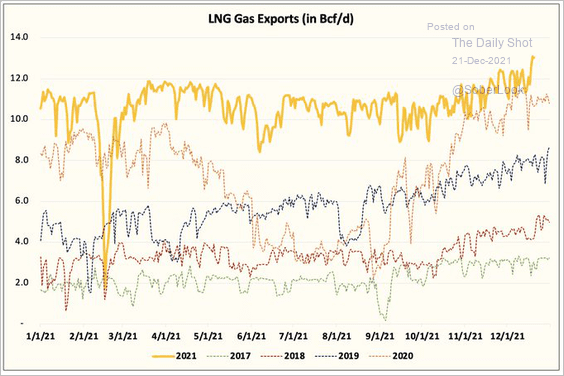 Source: @HFI_Research
Back to Index
Equities
1. The S&P 500 dropped below the 50-day moving average.
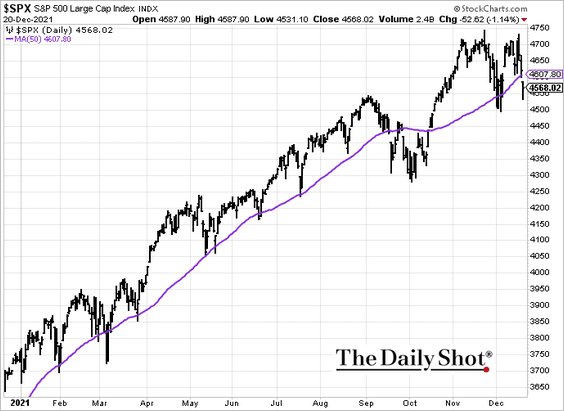
But dip buyers are back this morning amid hopes of resurrecting the BBBA fiscal stimulus.
 Source: NBC Read full article
——————–
2. Long-only developed-market funds saw significant outflows this month.
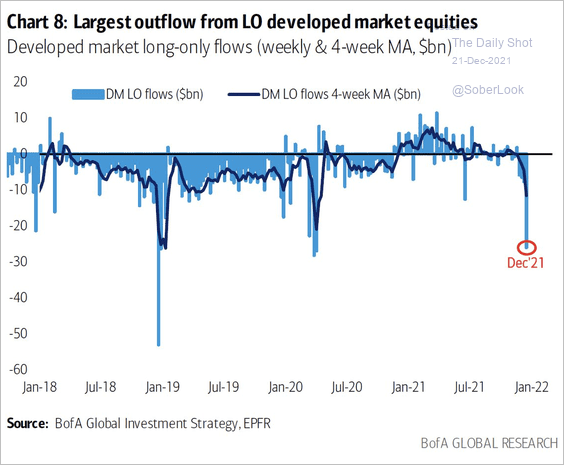 Source: BofA Global Research
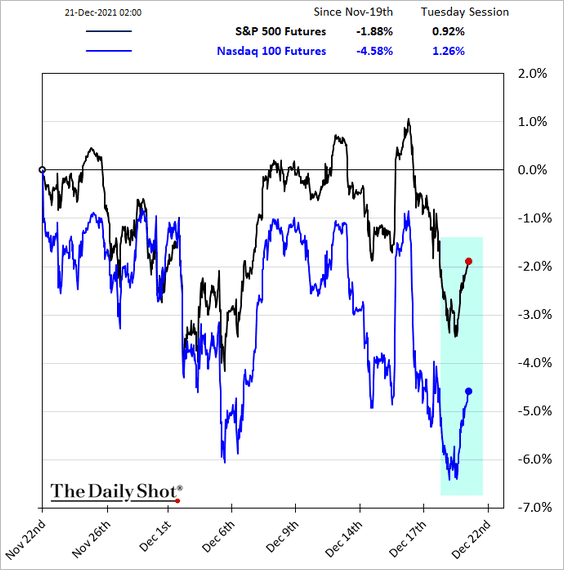
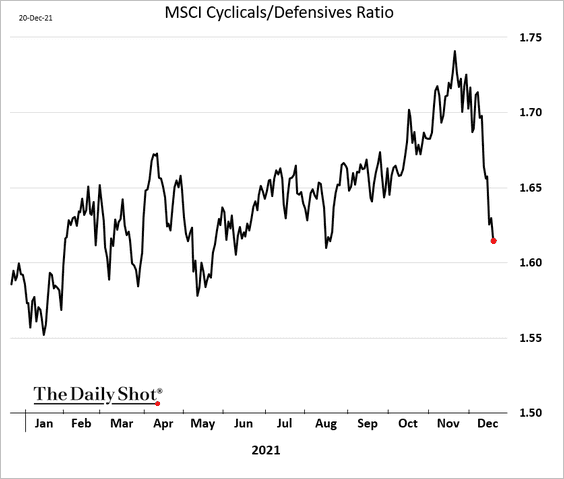
3. Cyclical sectors have massively underperformed defensives this month.
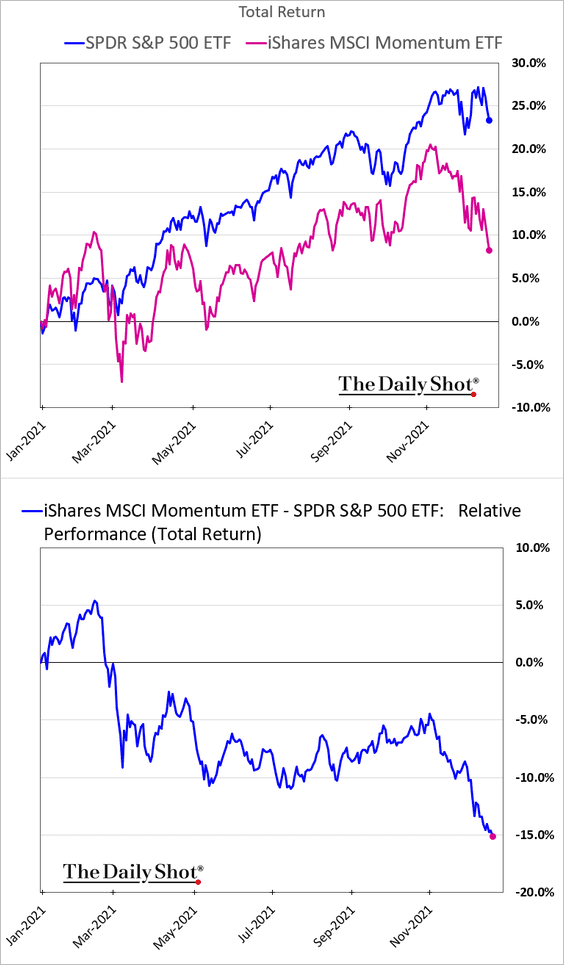
4. Momentum stocks have widened their underperformance.
5. Investors remain cautious, with the Fear & Greed Index in fear territory.
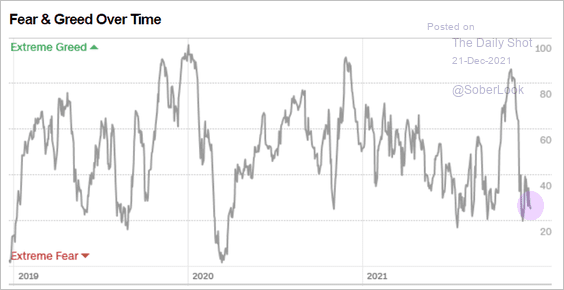 Source: CNN Business
6. Next, we have some sector updates.
• Fund flows:
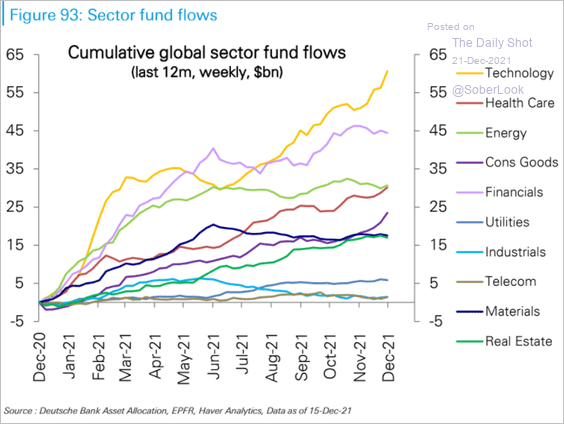 Source: Deutsche Bank Research
• Global sector and style/factor month-to-date performance:
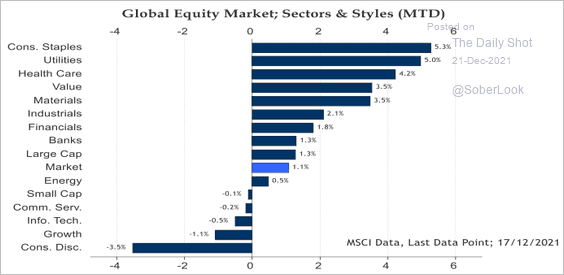 Source: Acorn Macro Consulting Ltd.
• Sector performance leading up to Fed rate hike cycles:
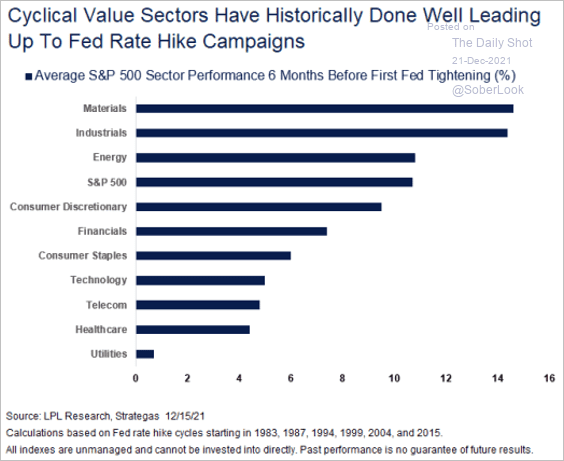 Source: LPL Research
• Hedge funds’ sector exposure:
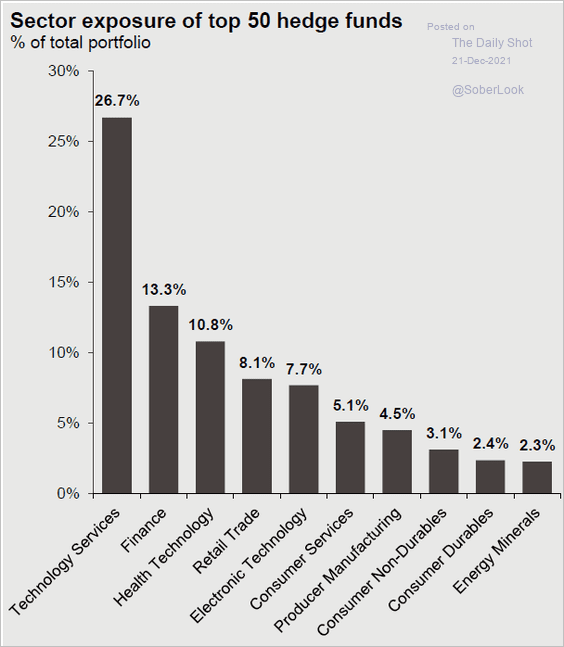 Source: J.P. Morgan Asset Management
• Buy/sell recommendations:
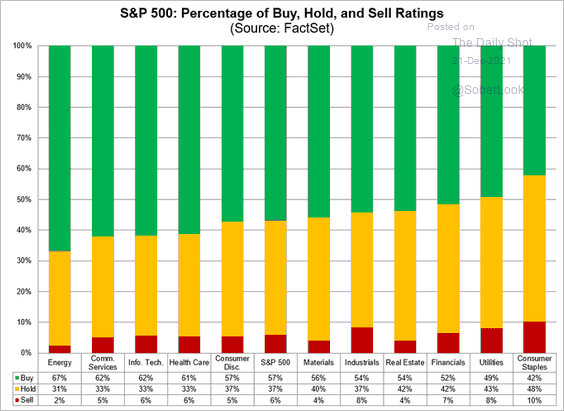 Source: @FactSet Read full article
——————–
7. Higher real yields could put pressure on tech mega-caps.
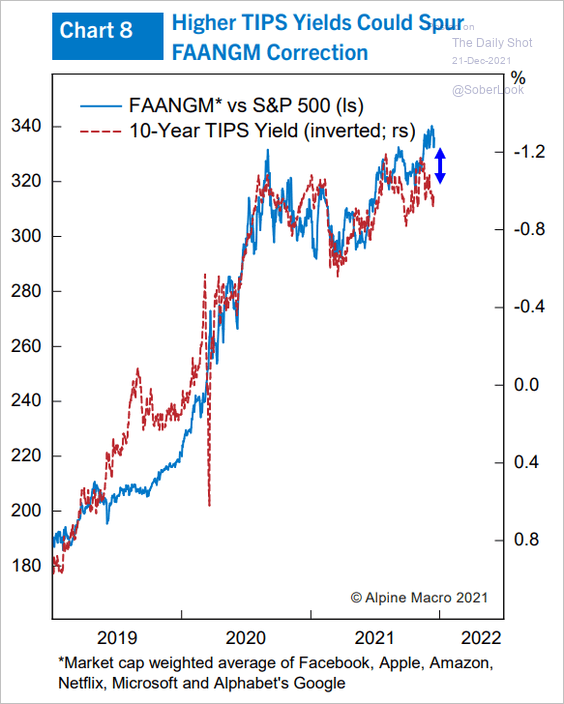 Source: Alpine Macro
8. The S&P 500 appears extremely overbought relative to Treasuries.
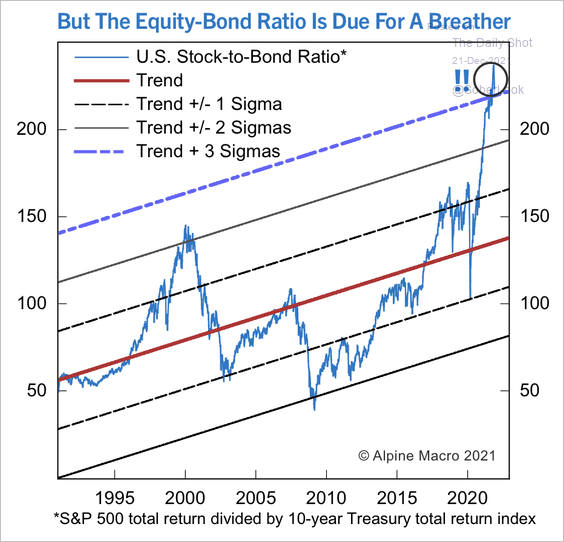 Source: Alpine Macro
Back to Index
Rates
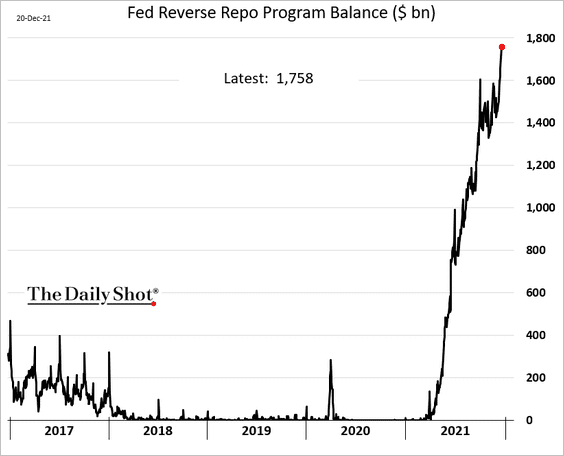
1. The Fed’s reverse repo facility balance hit a record high as European banks deposit dollars. Also, dealers have been reducing their balance sheets before the year-end and are using this facility to park cash.
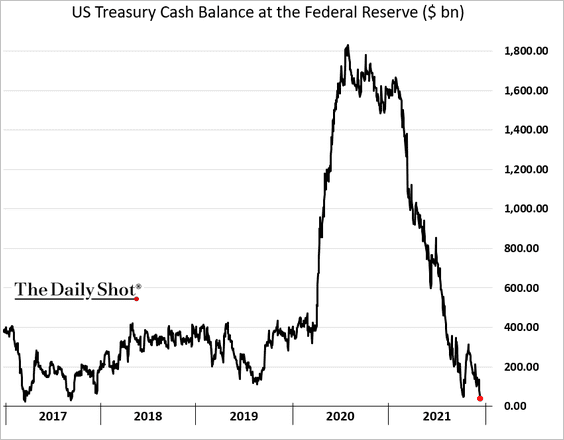
2. The US Treasury’s cash balances hit the lowest level since 2017.
3. The 10-year Treasury yield is starting to decline along its fair value trend.
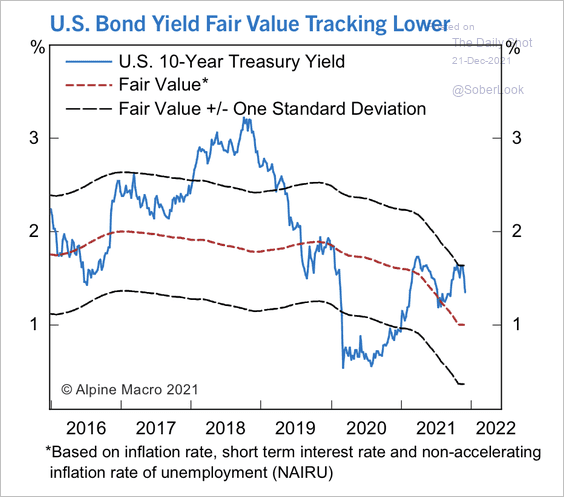 Source: Alpine Macro
——————–
Food for Thought
1. Consumers opting out of purchases:
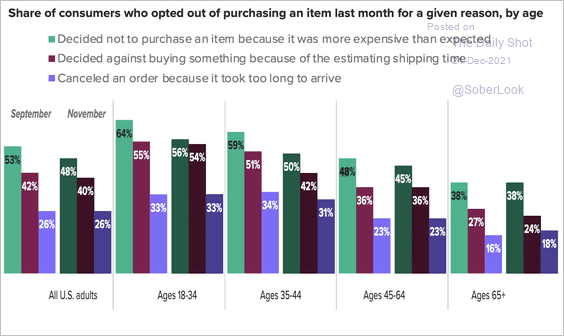 Source: Morning Consult Read full article
2. Social media influencing holiday-buying decisions:
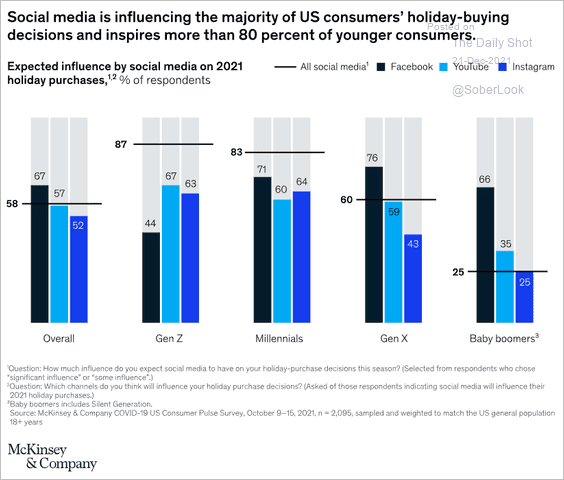 Source: McKinsey Read full article
3. Taking the next leisure trip:
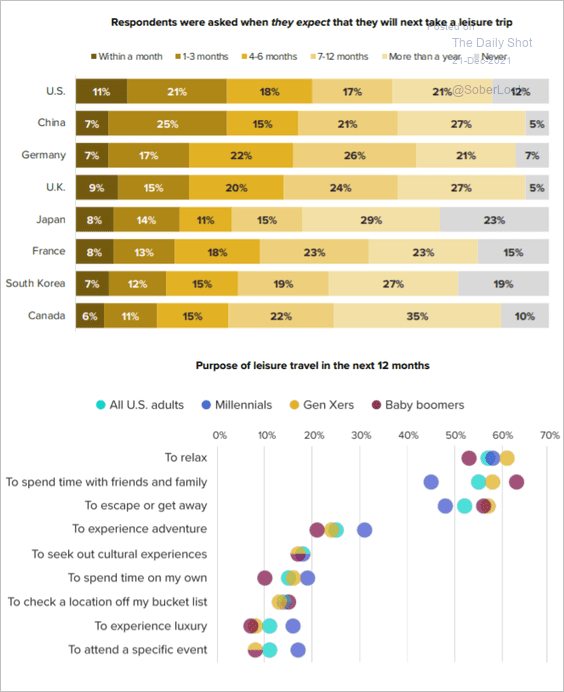 Source: Morning Consult Read full article
4. US fiscal response to COVID vs. the financial crisis:
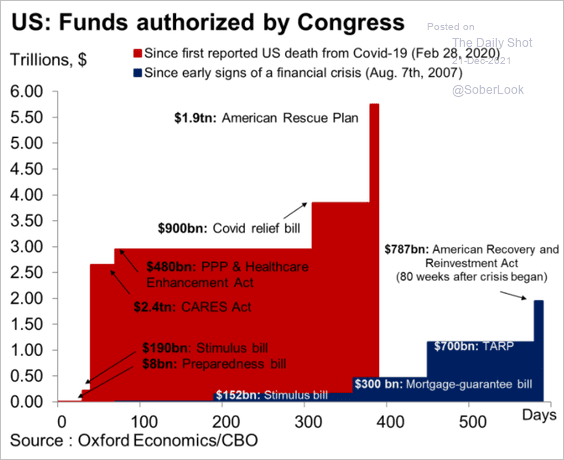 Source: Oxford Economics
5. Forbearance programs and mortgage delinquencies:
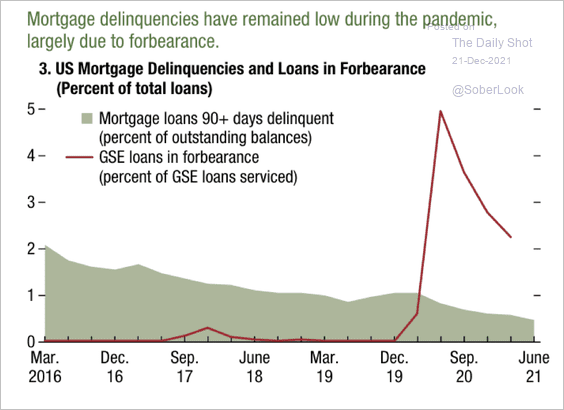 Source: IMF
6. Not going downtown:
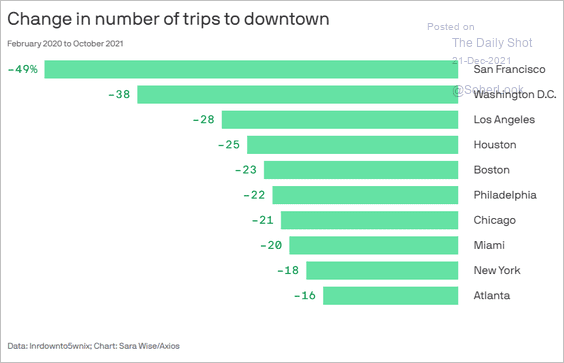 Source: @axios Read full article
7. ESPN subscribers:
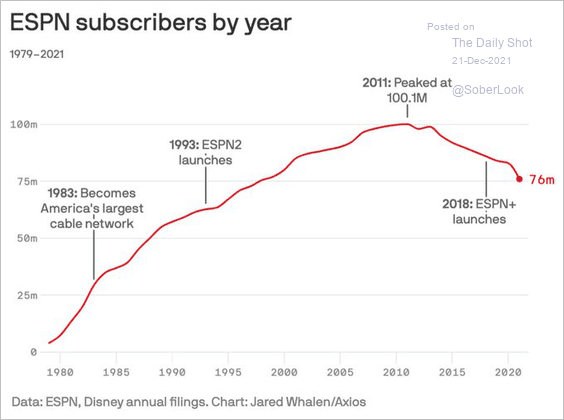 Source: @mredmond88 Read full article
8. WHO’s funding sources:
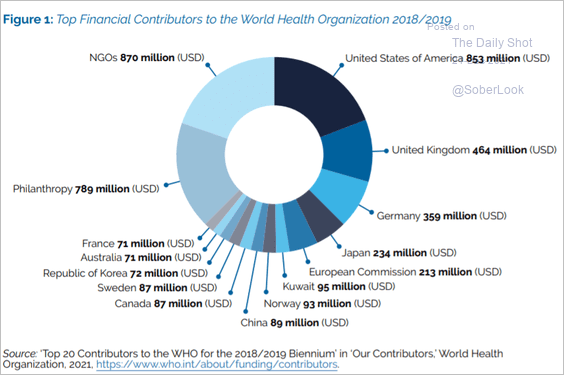 Source: Blavatnik School of Government, University of Oxford Read full article
9. Concentration of lead pipes:
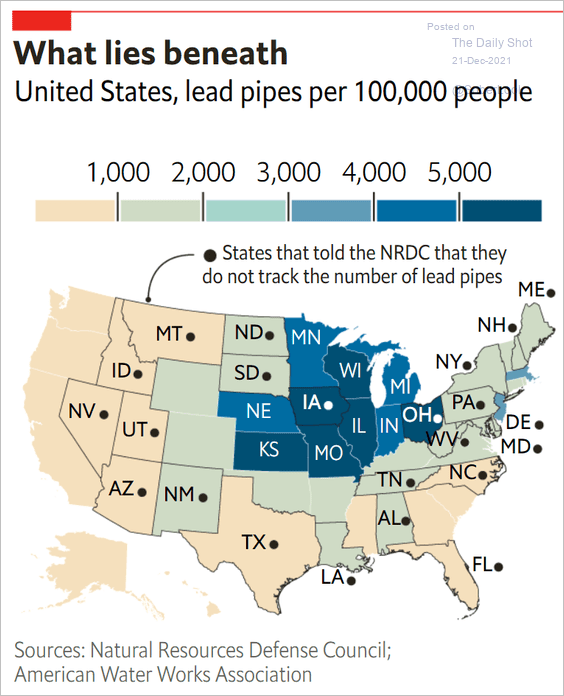 Source: The Economist Read full article
10. Defunct car brands:
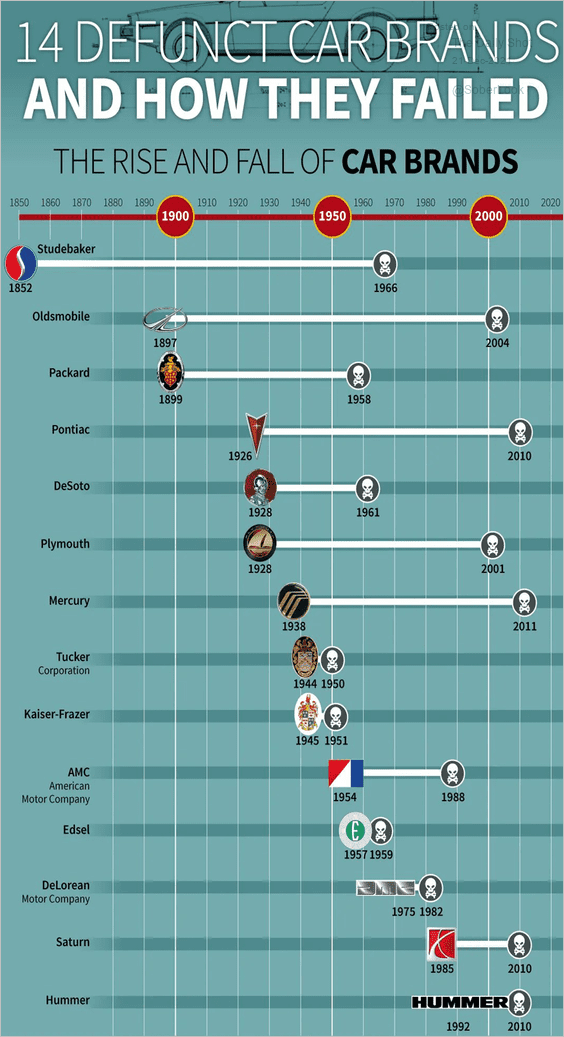 Source: Visual Capitalist Read full article
——————–
Back to Index