
The Daily Shot: 05-Jan-22
• The United States
• The United Kingdom
• The Eurozone
• Europe
• Asia – Pacific
• China
• Emerging Markets
• Cryptocurrency
• Commodities
• Energy
• Equities
• Credit
• Rates
• Global Developments
• Food for Thought
The United States
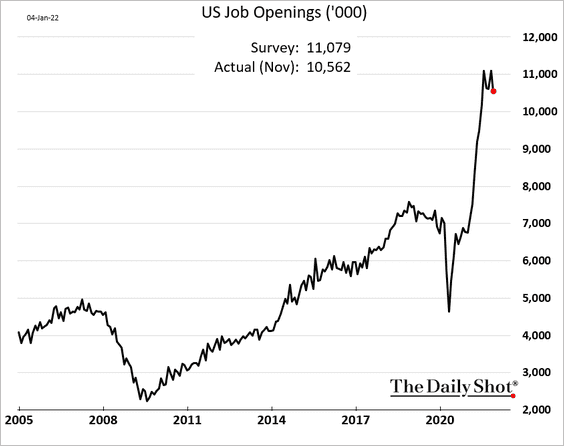
1. Let’s begin with the labor market.
• Job openings ticked down, but demand for workers remains extraordinarily high.
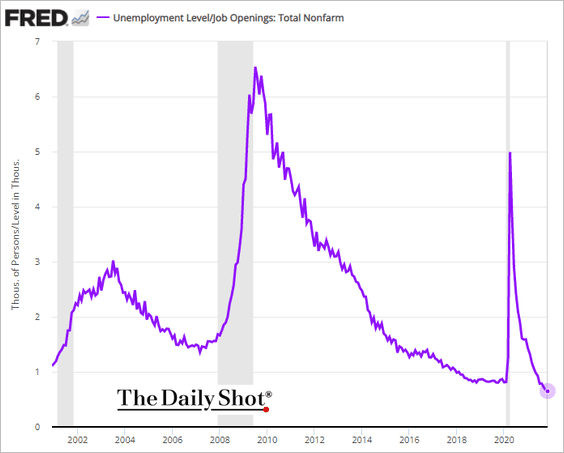
– The ratio of unemployed workers to job openings continues to hit new lows.
Here is the Beveridge curve.
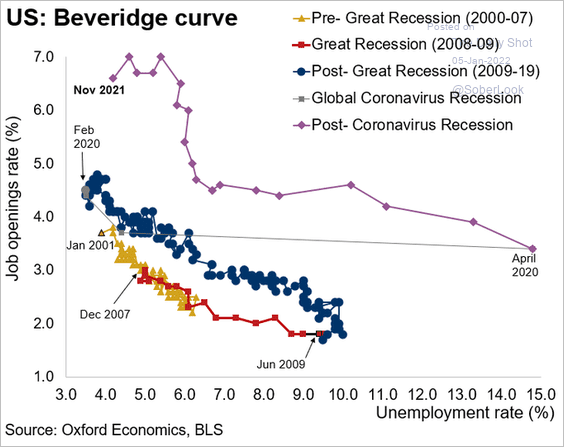 Source: @GregDaco
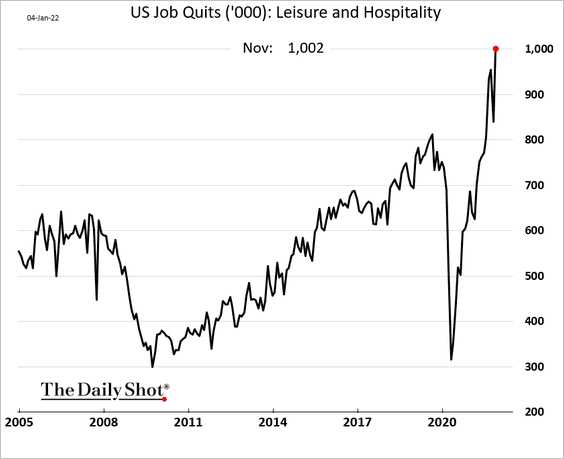
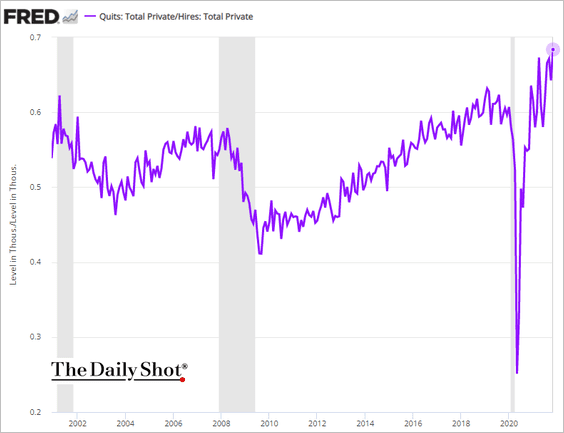
• Voluntary separations reached a new record, with 4.5 million Americans quitting their jobs in November.
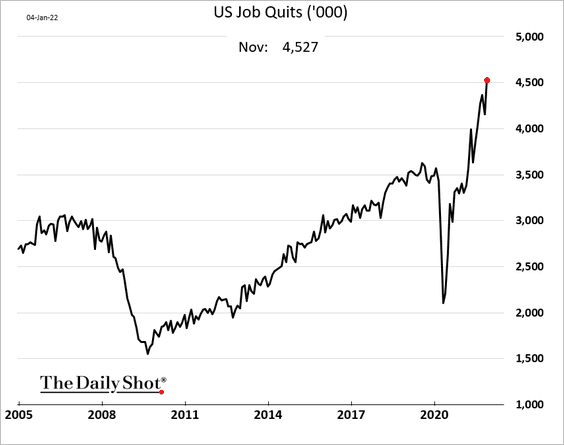
A million workers resigned in Leisure and Hospitality alone.
Here is the breakdown of quit rates by sector.
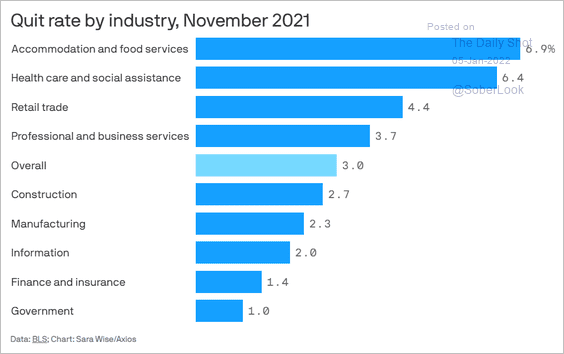 Source: @axios Read full article
– Based on the level of resignations, the unemployment rate should be much lower.
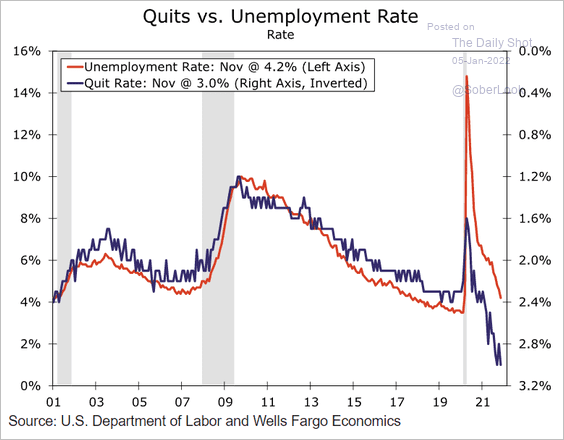 Source: Wells Fargo Securities
– This chart shows quits and layoffs rates over the past two decades.
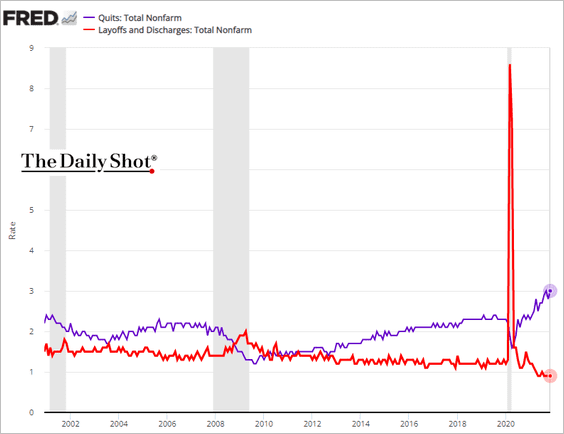
– While hiring has also been strong, resignations are outpacing recruitment.
• Here is why many Americans are staying out of the labor force.
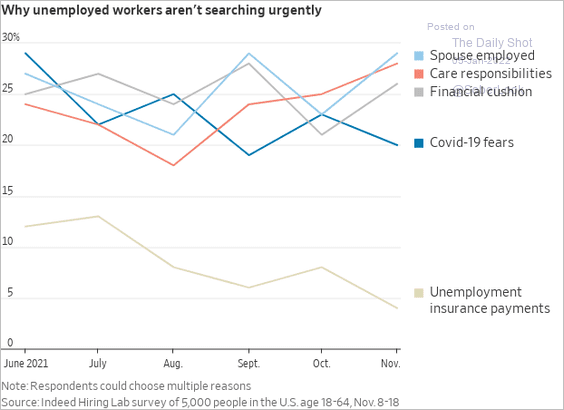 Source: @WSJ Read full article
• It will take a while before US employment returns to pre-COVID levels.
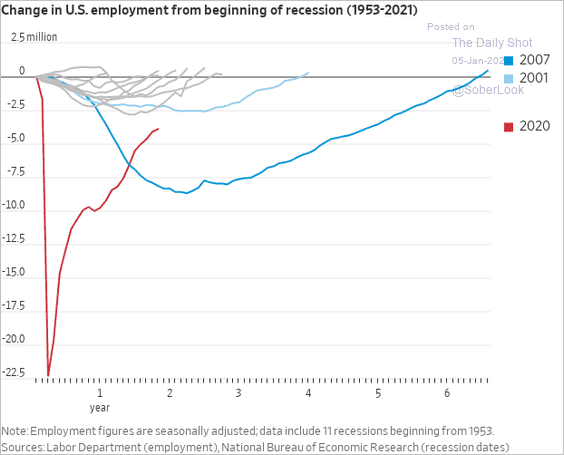 Source: @WSJ Read full article
• Falling labor force growth in the US has been a long-term drag on GDP growth. With early retirements and low immigration, this trend is unlikely to reverse soon.
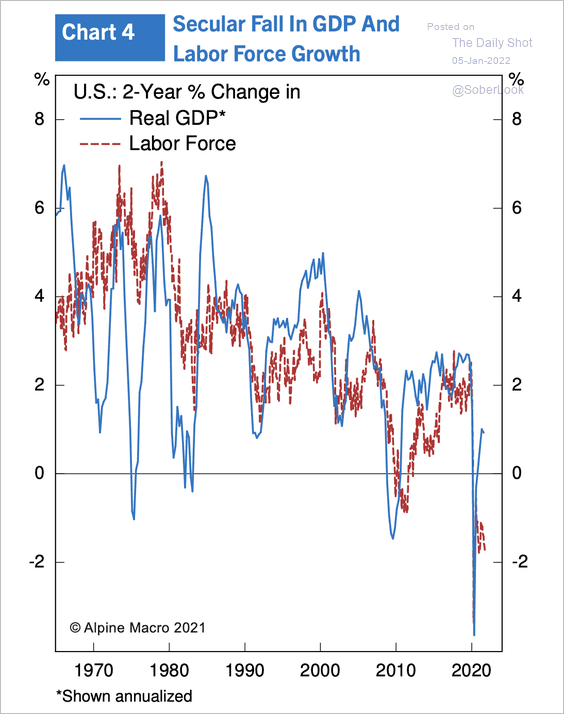 Source: Alpine Macro
• US wage growth dispersion (see definition below) hit a new high.
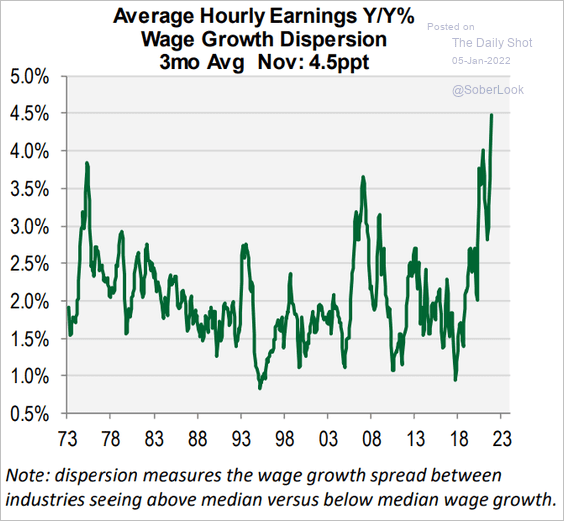 Source: Cornerstone Macro
• Placement companies’ revenues have fully recovered.
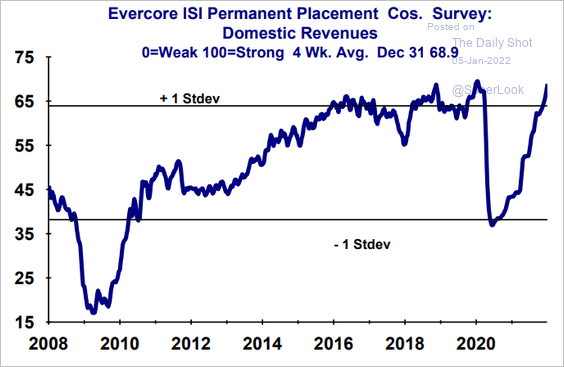 Source: Evercore ISI Research
• The spike in unemployment at the start of the pandemic did not generate the consumer credit draw we saw in 2008 (partially due to generous government support).
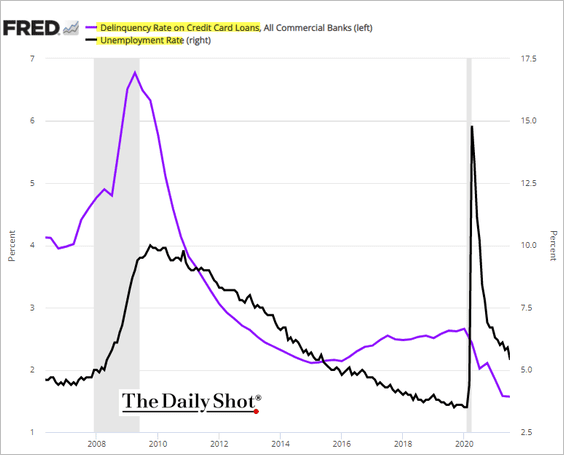 Source: The FRED Blog Read full article
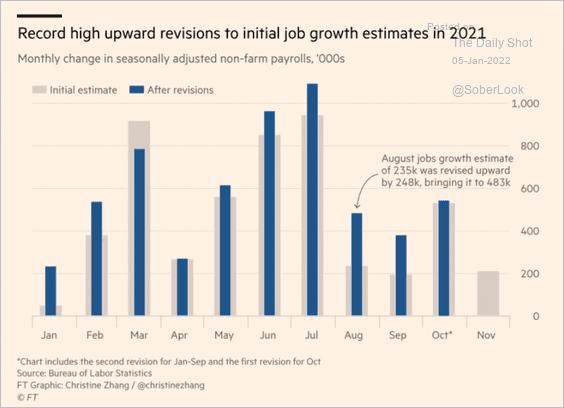
• US jobs data revisions tend to be higher during periods of job growth volatility.
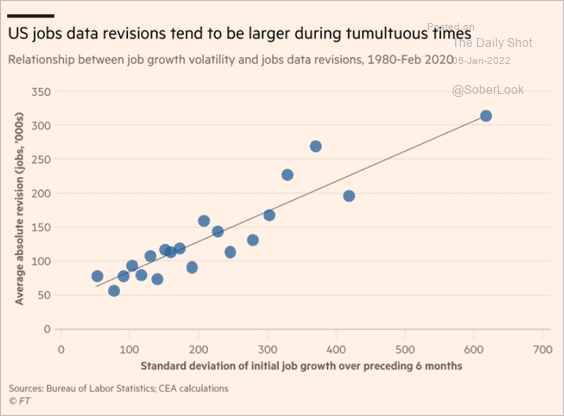 Source: @financialtimes Read full article
 Source: @financialtimes Read full article
——————–
2. The ISM Manufacturing PMI declined in December.
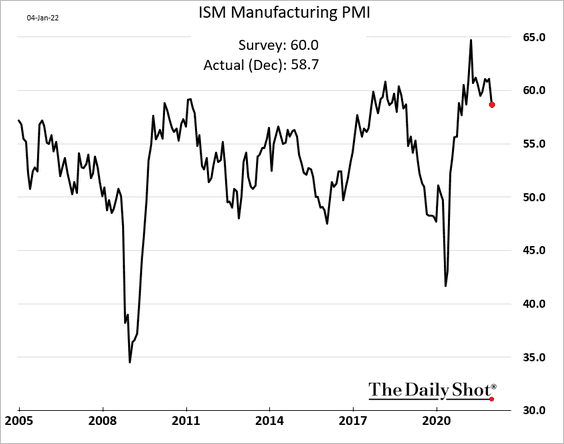
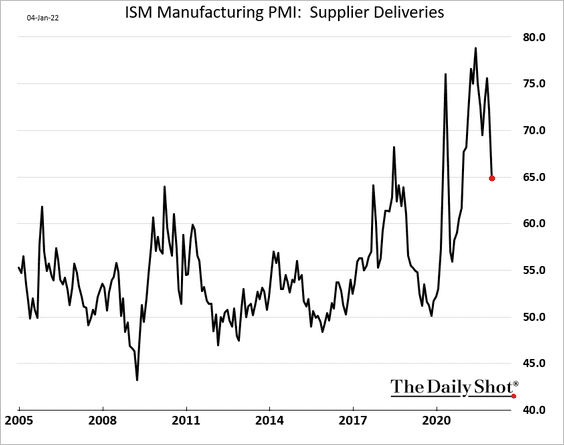
But this drop turned out to be good news. Much of the decline was due to faster supplier deliveries rather than weaker production.
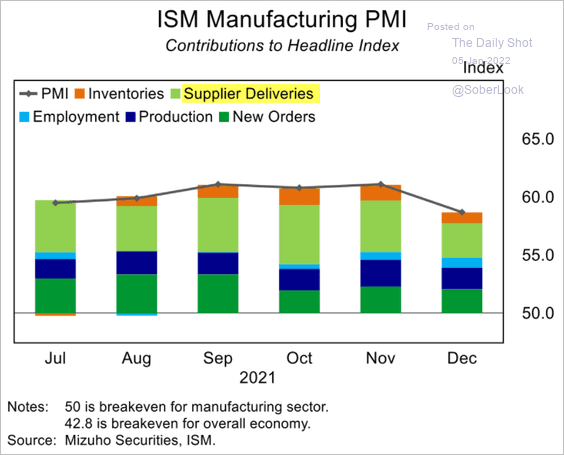 Source: Mizuho Securities USA
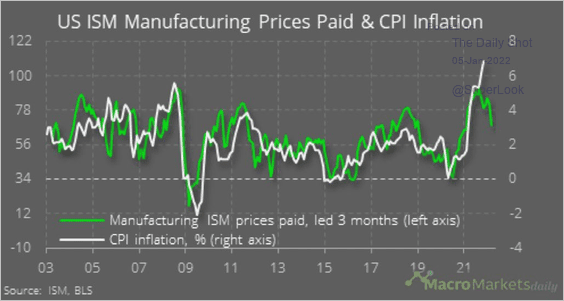
Price gains are slowing as well, …
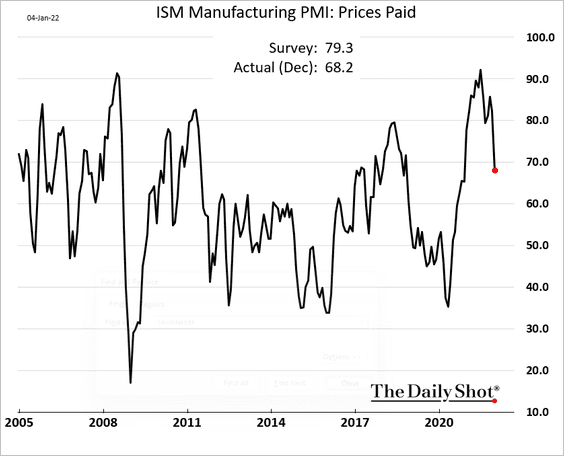
… which points to some moderation in inflation ahead.
 Source: @macro_daily
All supply-chain indicators have peaked.
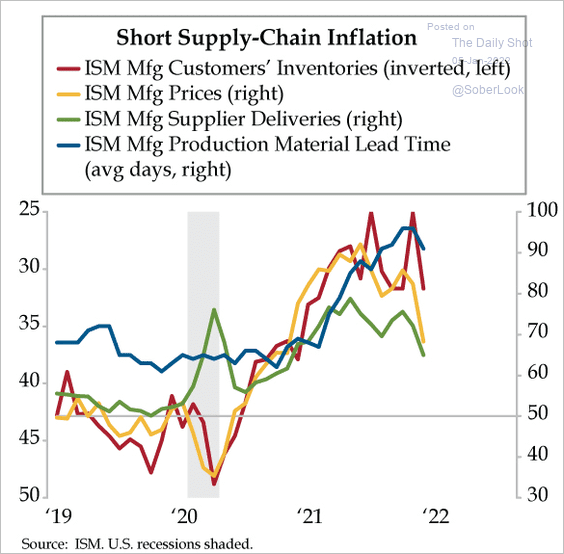 Source: The Daily Feather
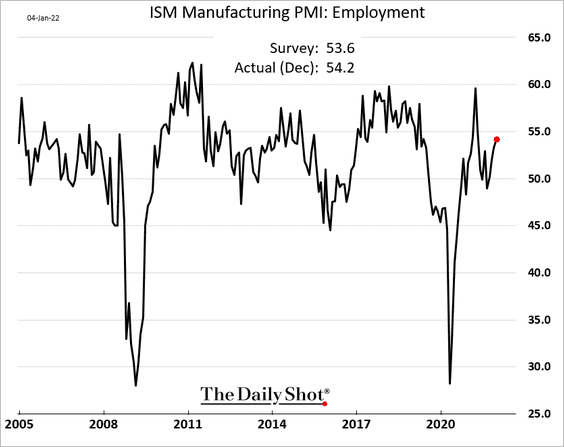
• Factory hiring improved in December.
• The spread between indices of new orders and inventory points to moderation in manufacturing growth this year.
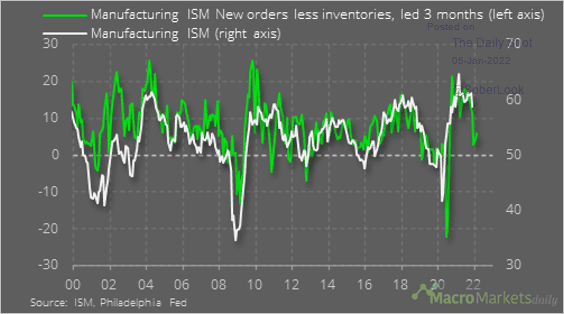 Source: @macro_daily
——————–
3. US automobile sales remained depressed in December …
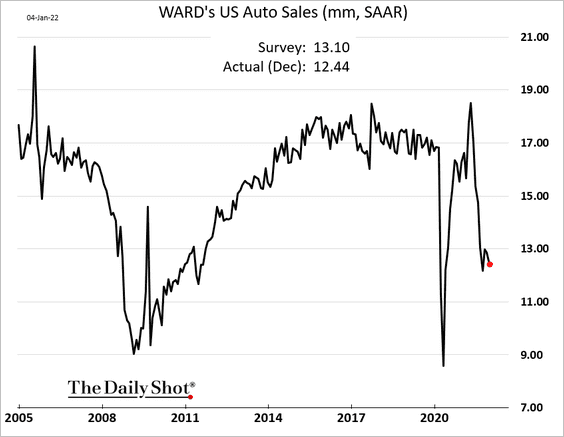
 Source: Reuters Read full article
… as the semiconductor backlog continues to worsen.
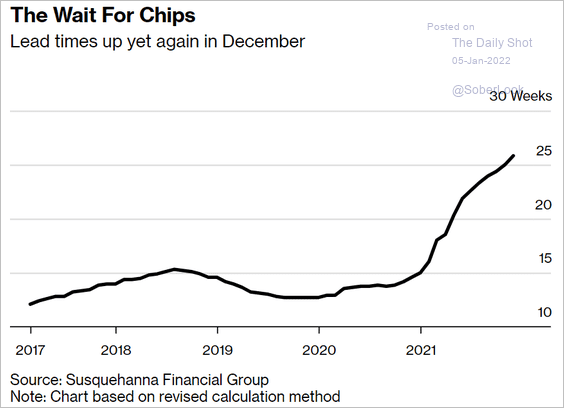 Source: Bloomberg Read full article
 Source: Bloomberg Read full article
——————–
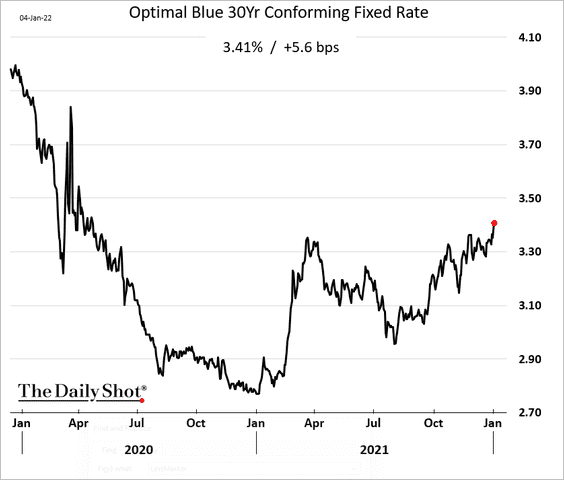
4. Mortgage rates climbed to the highest level since early 2020.
Back to Index
The United Kingdom
1. Manufacturing growth was stable in December.
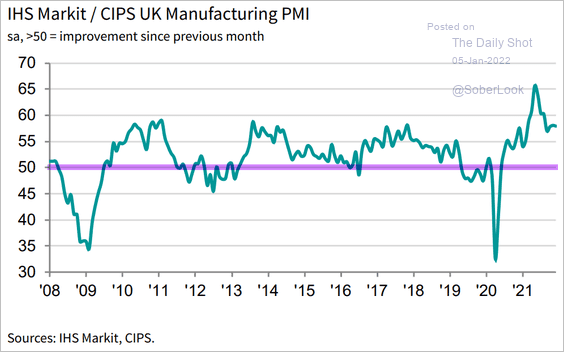 Source: IHS Markit
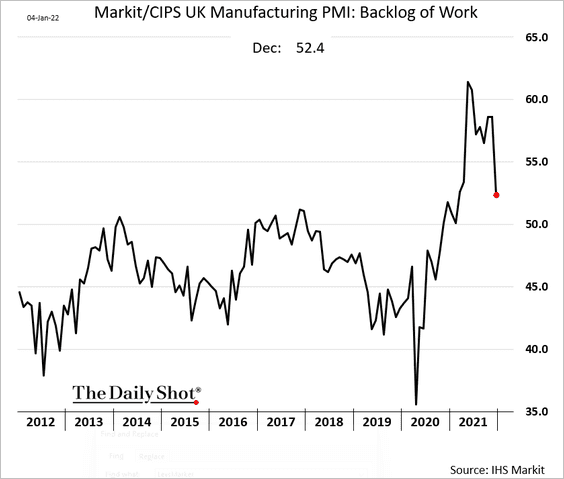
The backlog is starting to ease.
——————–
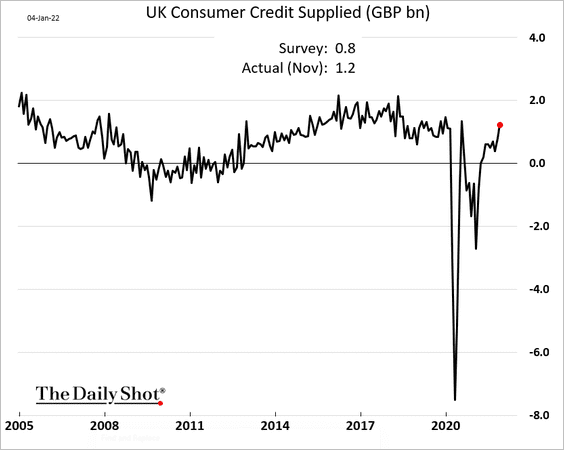
2. Consumer credit supplied is back at pre-COVID levels.
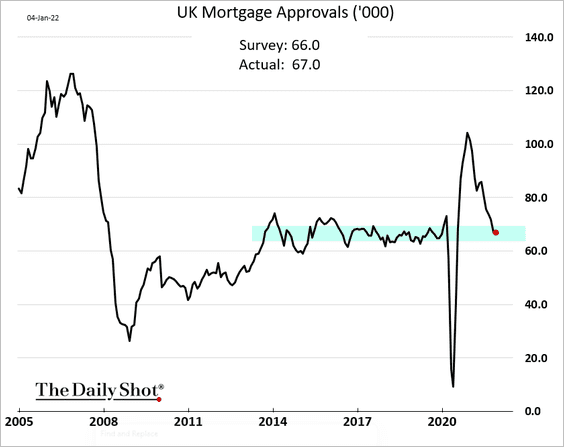
Mortgage approvals are stabilizing inside the pre-pandemic range.
——————–
3. The surge in new cases has not translated into much higher hospitalizations and deaths (2 charts).
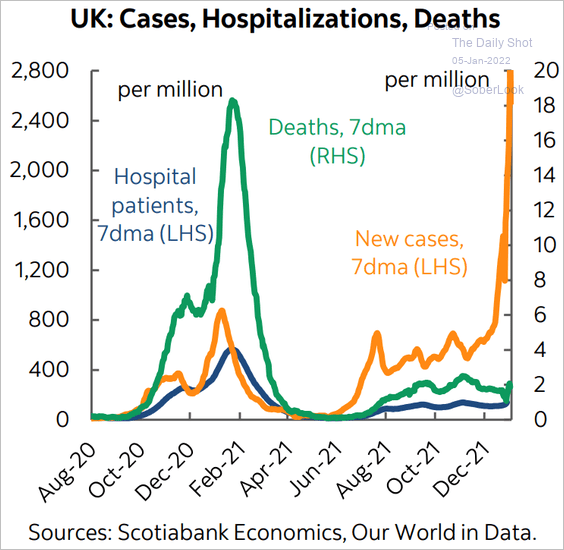 Source: Scotiabank Economics
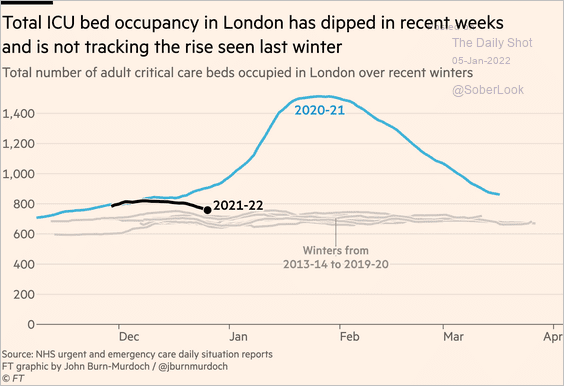 Source: @financialtimes Read full article
——————–
4. A record 5.9 million people in the UK are waiting for some sort of medical treatment.
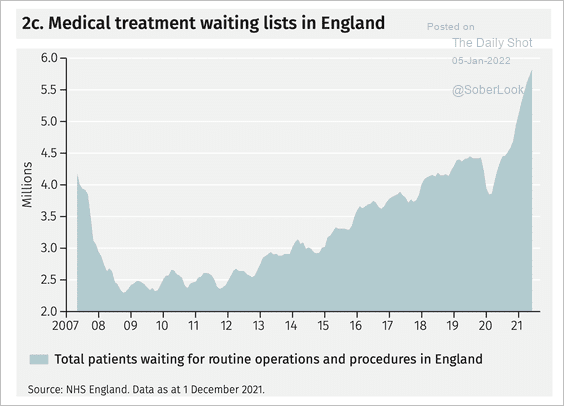 Source: EFG International
Back to Index
The Eurozone
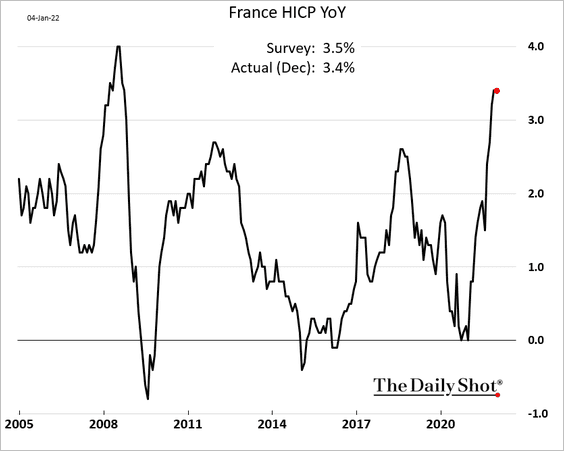
1. French inflation appears to have peaked for now.
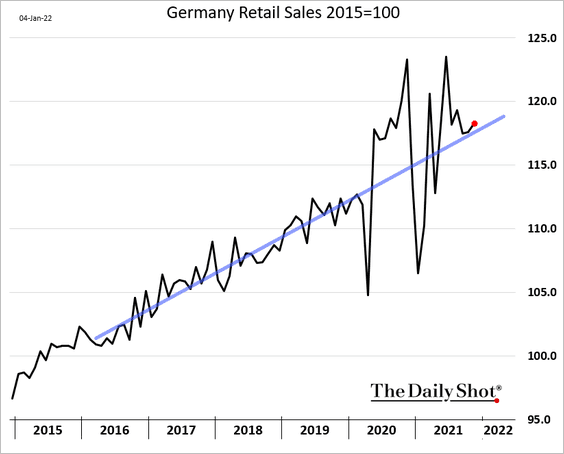
2. Next, we have some updates on Germany.
• Retail sales increased in November, running close to the pre-COVID trend.
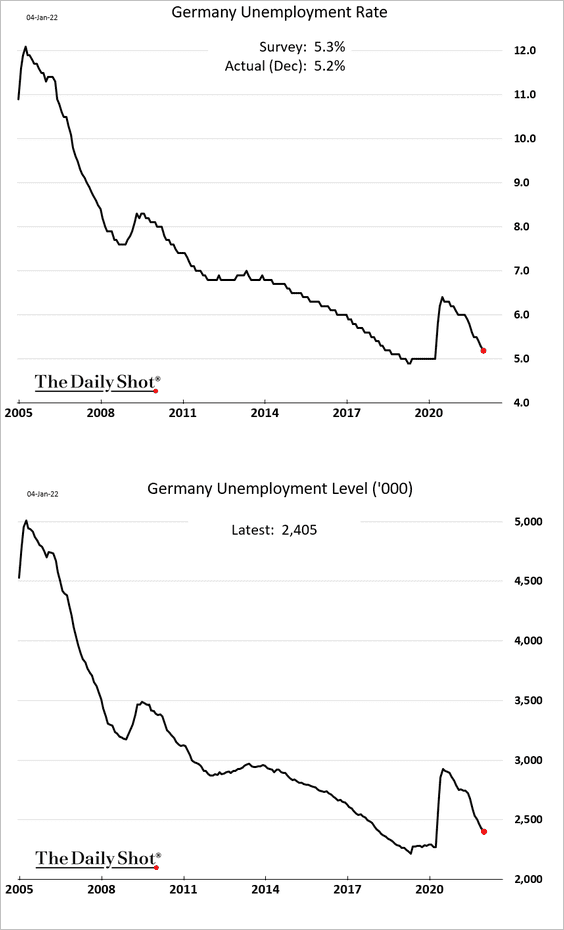
• Unemployment is nearing pre-pandemic levels.
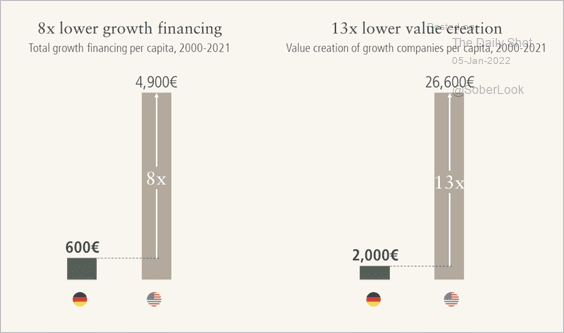
• Germany lags behind the US in terms of venture growth and value creation (2 charts).
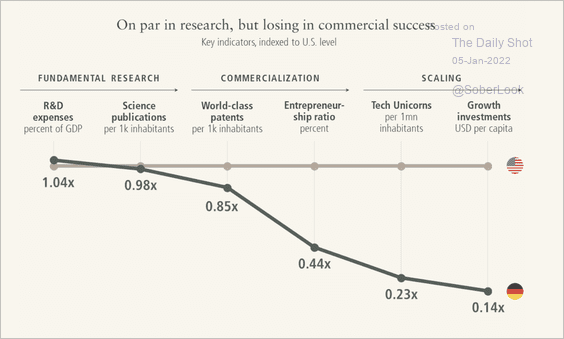 Source: Lakestar Read full article
 Source: Lakestar Read full article
• Here is a projection for Germany’s “prime-age” population.
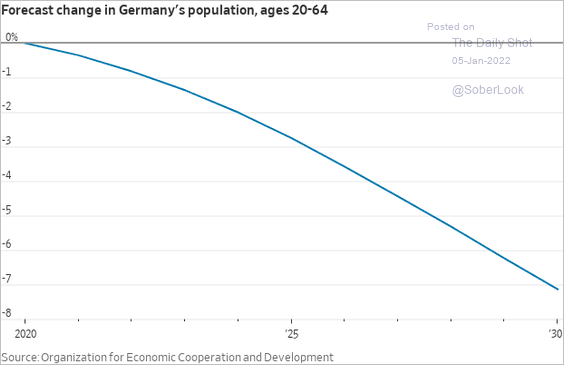 Source: @WSJ Read full article
——————–
3. The euro-area economy is highly correlated to global growth.
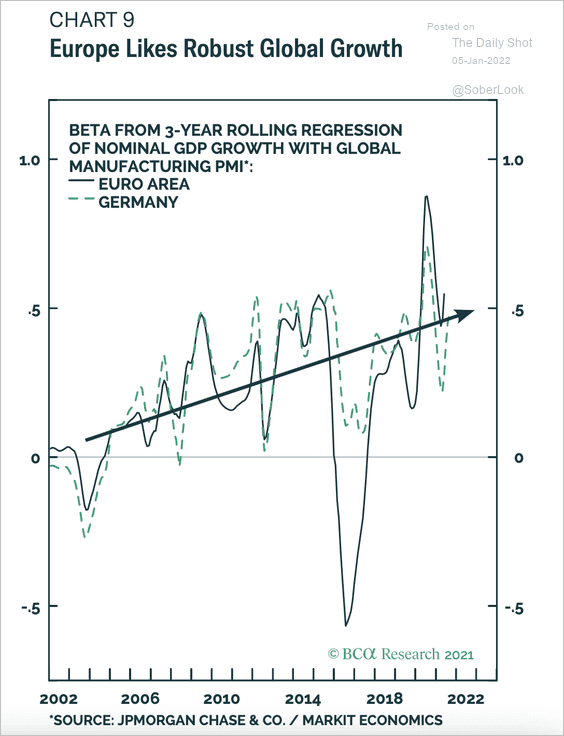 Source: BCA Research
Back to Index
Europe
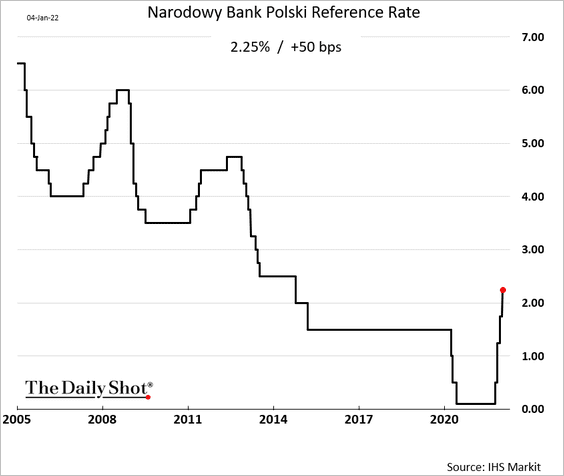
1. Poland’s central bank hiked rates again as inflation surges.
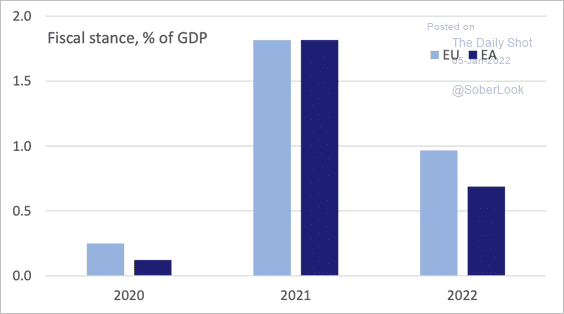
2. Deutsche Bank expects the fiscal impulse in the EU to remain positive this year.
 Source: Deutsche Bank Research
3. This chart shows the share of companies with online sales of at least 1% of the total.
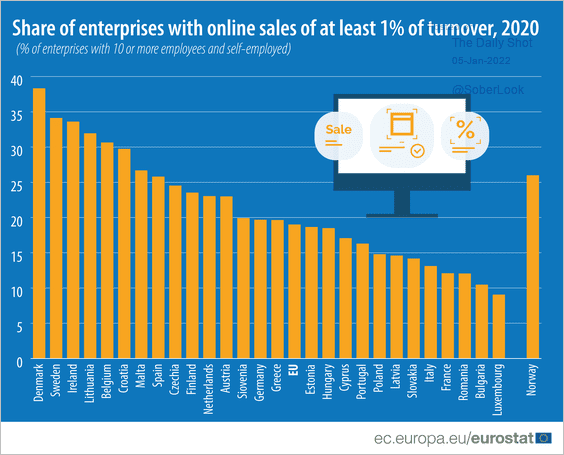 Source: Eurostat Read full article
Back to Index
Asia – Pacific
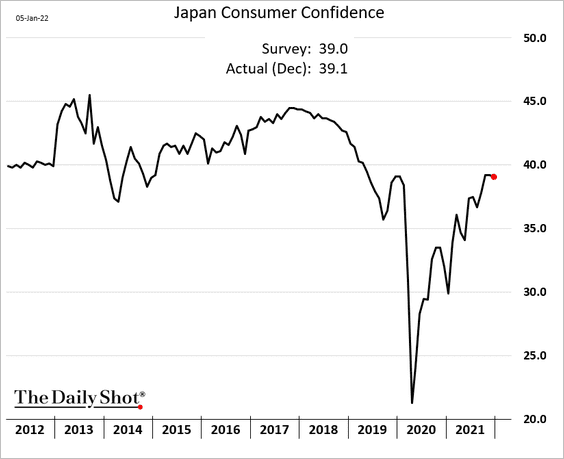
1. Japan’s consumer confidence held steady last month.
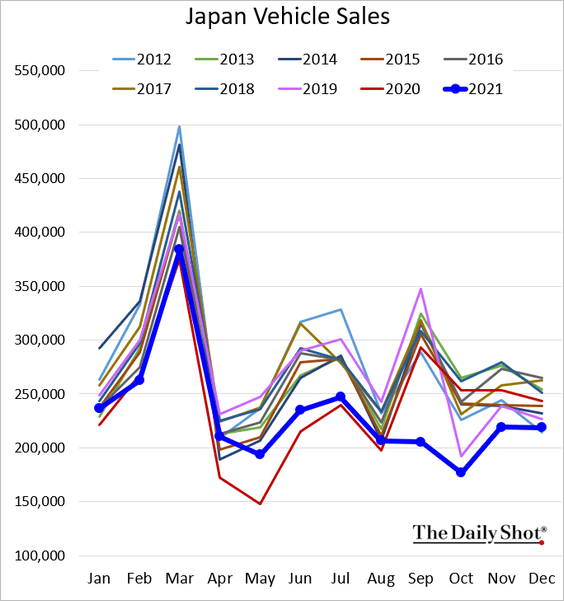
Vehicle sales remain soft.
——————–
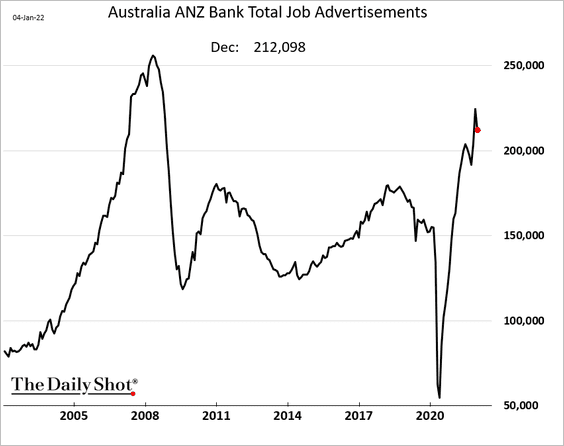
2. Australia’s job ads came off the recent highs.
Dining spending dropped more than usual for this time of the year.
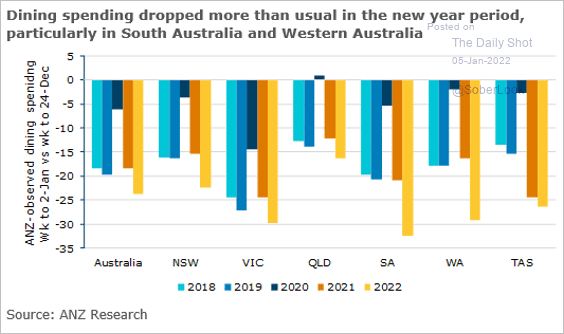 Source: ANZ Research
——————–
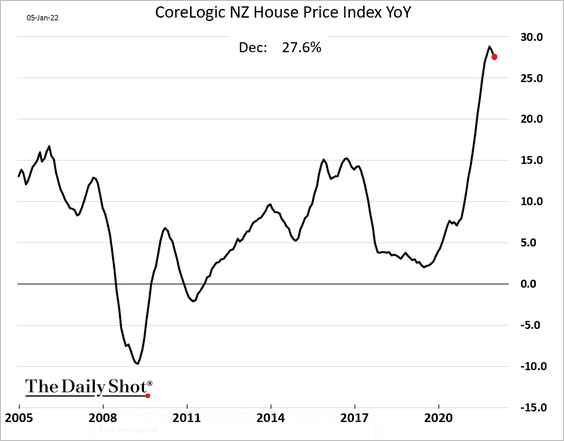
3. New Zealand’s home price appreciation has peaked.
Back to Index
China
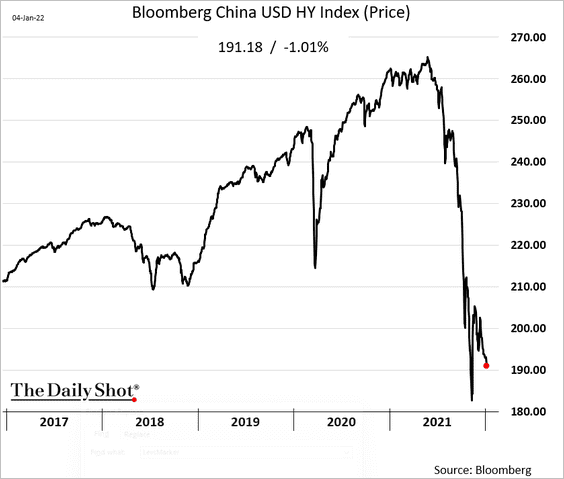
1. USD-denominated high-yield bond prices are dropping again.
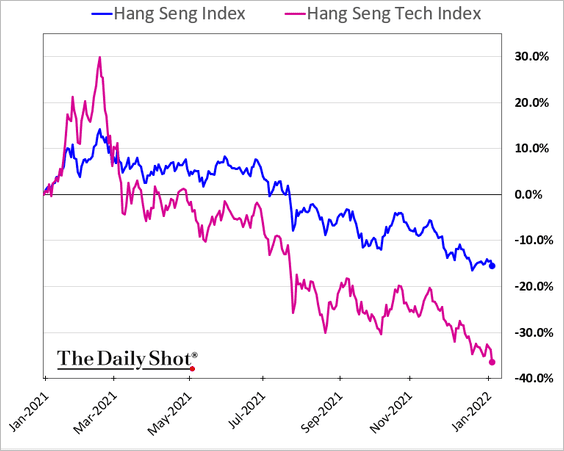
2. Tech shares continue to tumble in Hong Kong.
• Equity capitalization growth in 2021 has been in the mainland market.
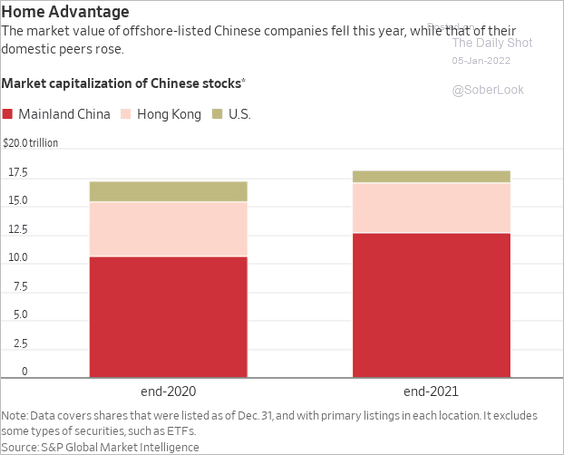 Source: @WSJ Read full article
• Chinese stocks had a tough year, hitting the bottom end of the range relative to emerging markets.
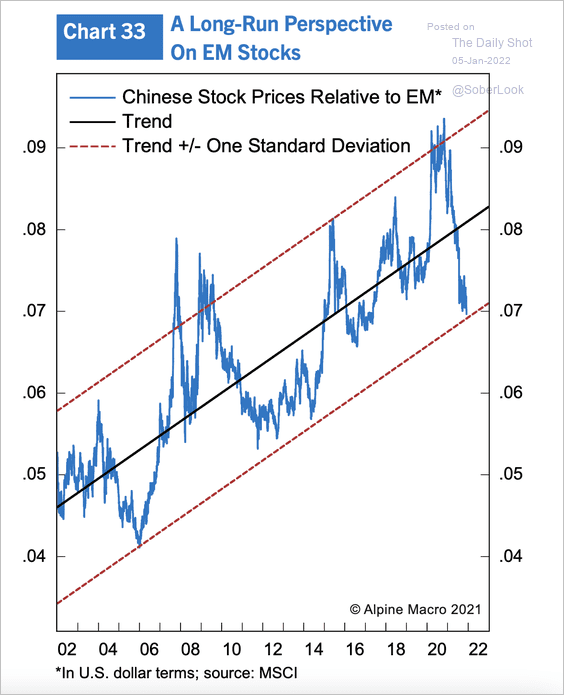 Source: Alpine Macro
——————–
3. Interest rates on loans to small and medium-sized enterprises (SMEs) are rising relative to large firms.
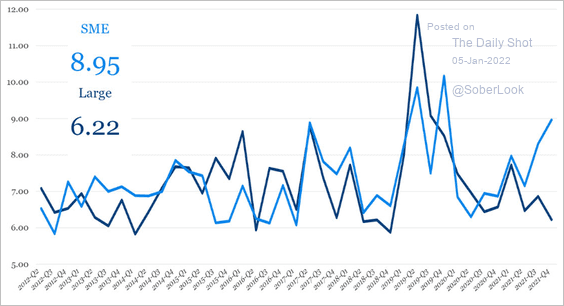 Source: China Beige Book
Corporate borrowing declined over the past quarter, except in the transport sector.
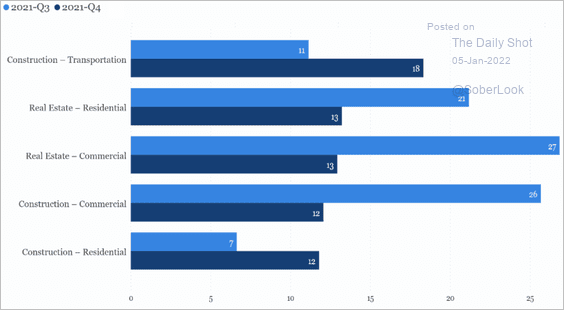 Source: China Beige Book
——————–
4. China’s imports from the US are well under the Phase-I agreement levels.
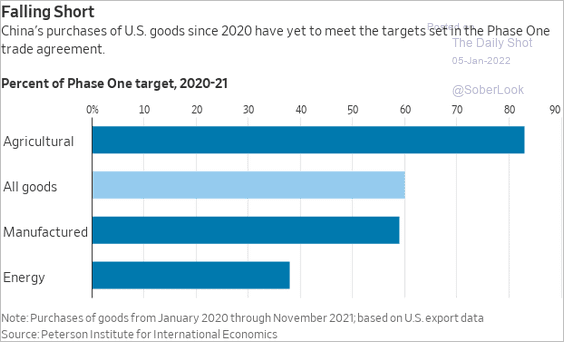 Source: @WSJ Read full article
5. Here is a projection for China’s working-age population.
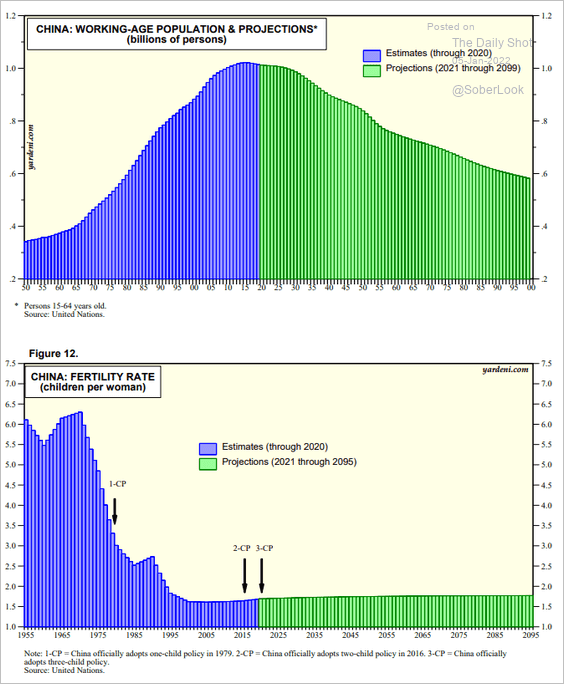 Source: Yardeni Research
Back to Index
Emerging Markets
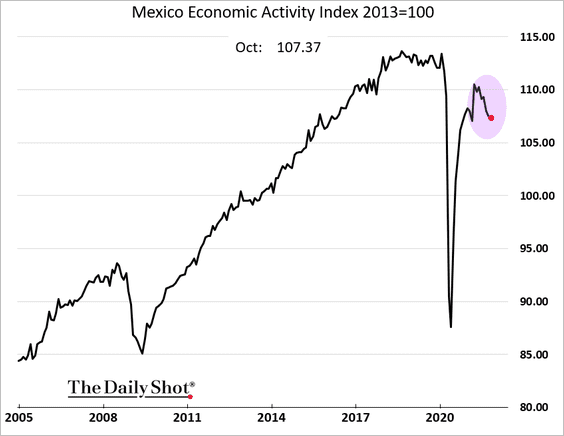
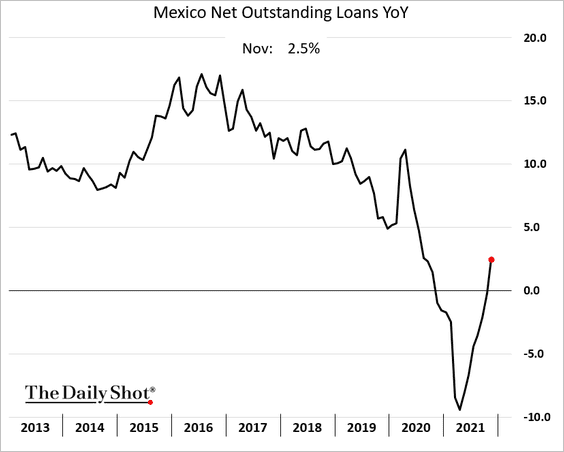
1. Let’s begin with Mexico.
• Economic activity has been weakening (through October).
• The manufacturing sector just can’t break into growth mode.
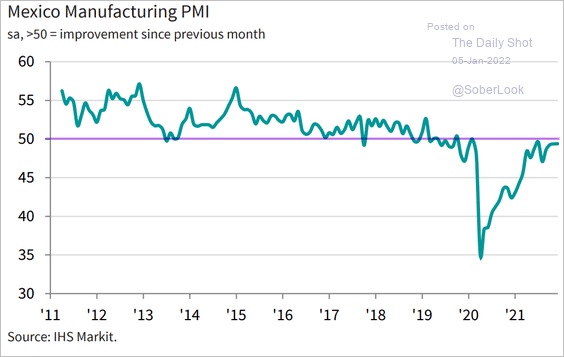 Source: IHS Markit
• Loan growth is rebounding.
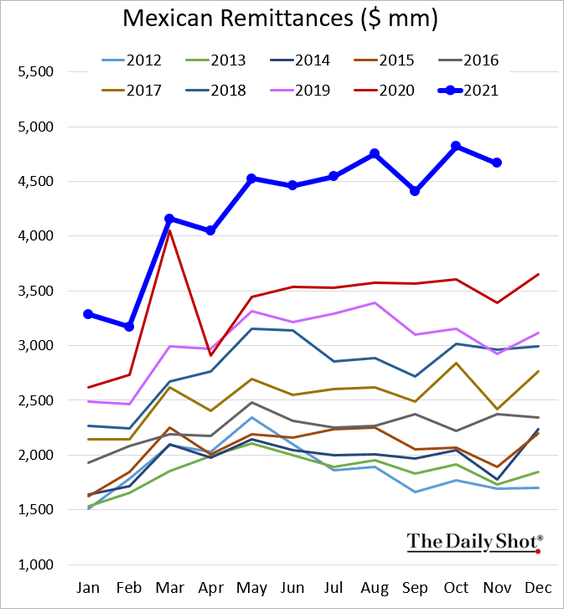
• Remittances remain at record levels for this time of the year.
——————–
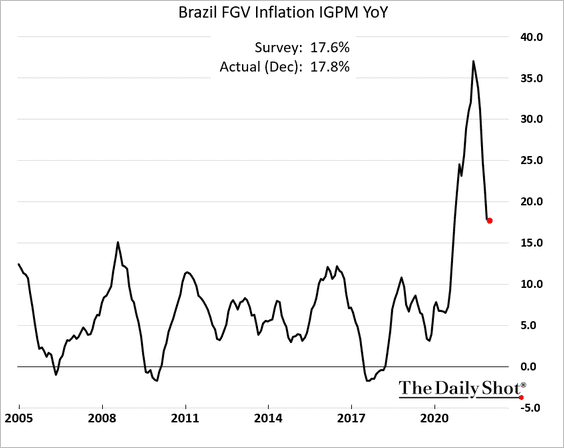
2. Next, we have some updates on Brazil.
• Inflation has been moderating.
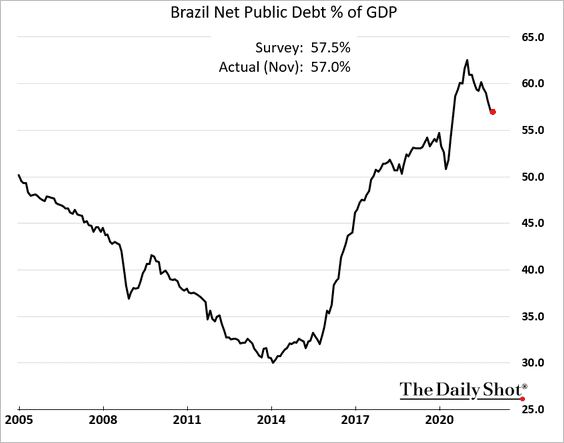
• The debt-to-GDP ratio has peaked for now but remains well above pre-COVID levels.
• Manufacturing growth has stalled.
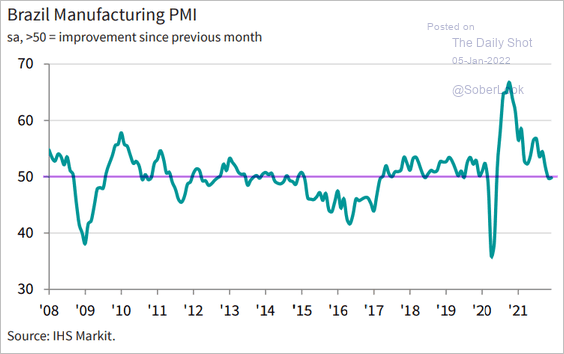 Source: IHS Markit
——————–
3. LatAm economic surprises have been negative recently.
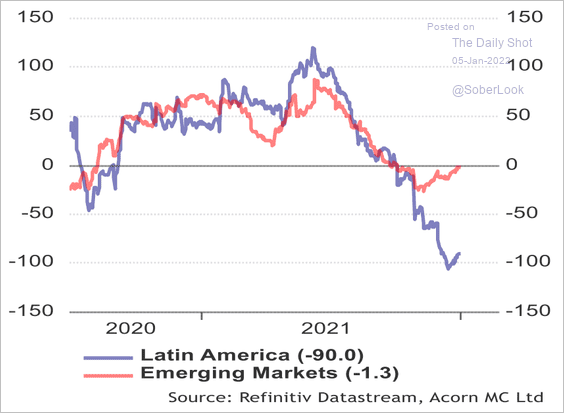 Source: Acorn Macro Consulting Ltd.
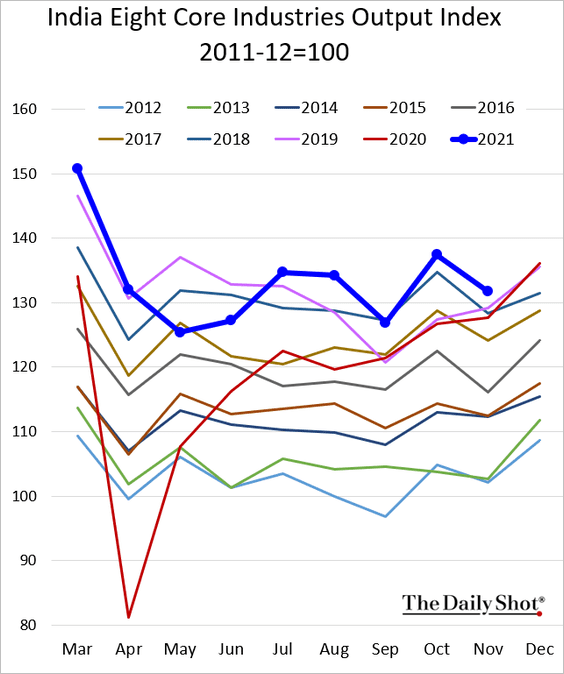
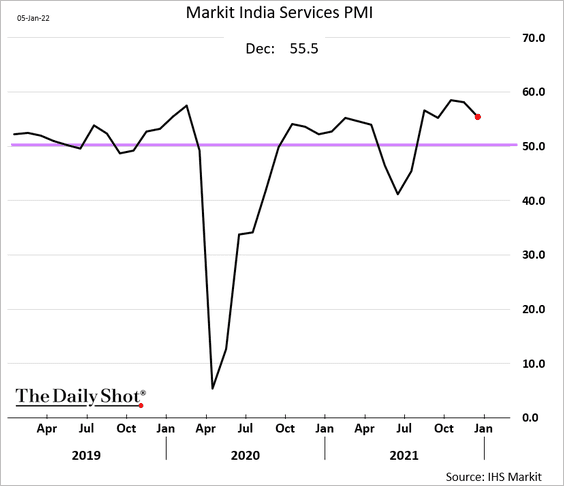
4. India’s industrial output remains robust.
PMI measures continue to show growth.
• Manufacturing:
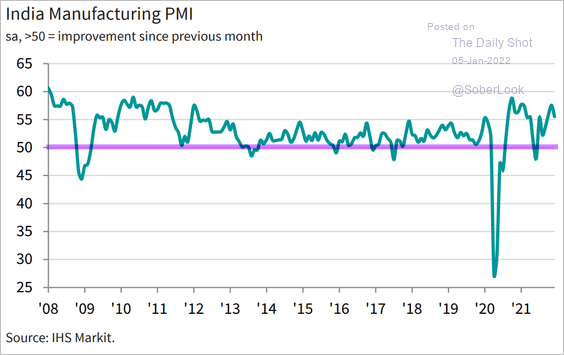 Source: IHS Markit
• Services:
——————–
5. ASEAN manufacturing growth remains robust.
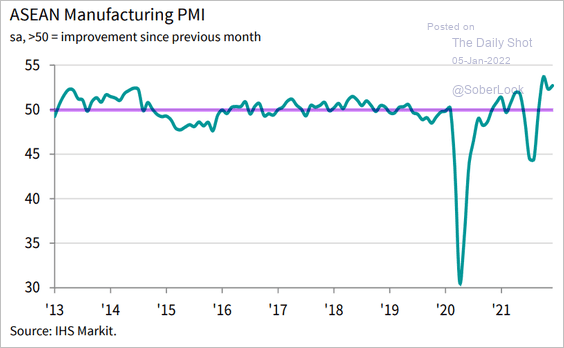 Source: IHS Markit
Back to Index
Cryptocurrency
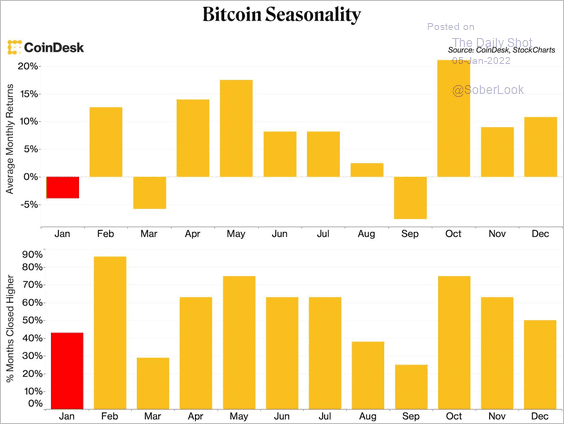
1. Historically, bitcoin tends to fall in January, although the cryptocurrency registered a positive return 50% of the time over the past nine years. The probability of a positive outcome is mixed.
 Source: CoinDesk Read full article
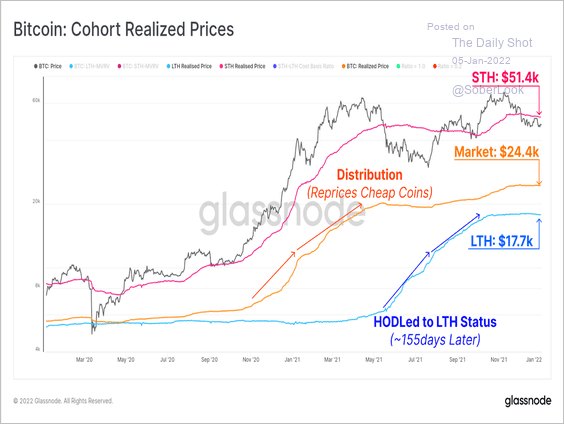
2. With bitcoin’s little movement over the past week, short-term holders are bearing the most pain, which could lead to increased selling pressure.
 Source: Glassnode Read full article
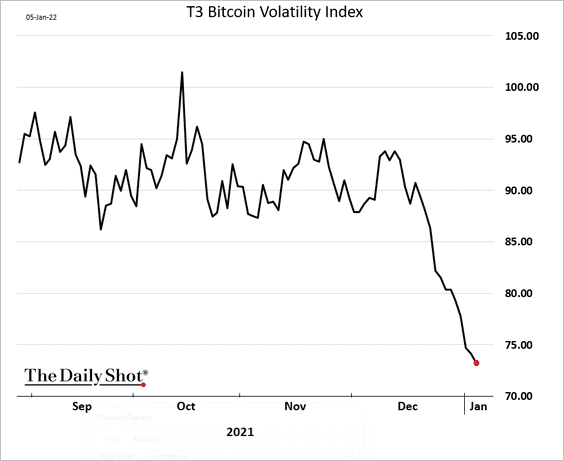
3. Bitcoin implied volatility is following realized vol lower.
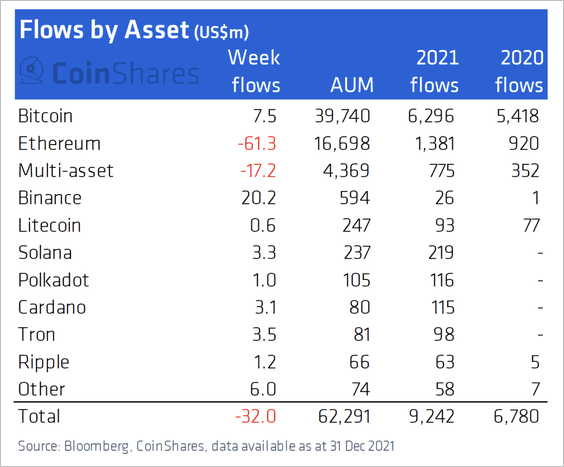
4. Digital asset funds saw a roughly 36% increase in flows over the past year. Still, over the past week, some funds saw outflows as crypto prices declined (2 charts).
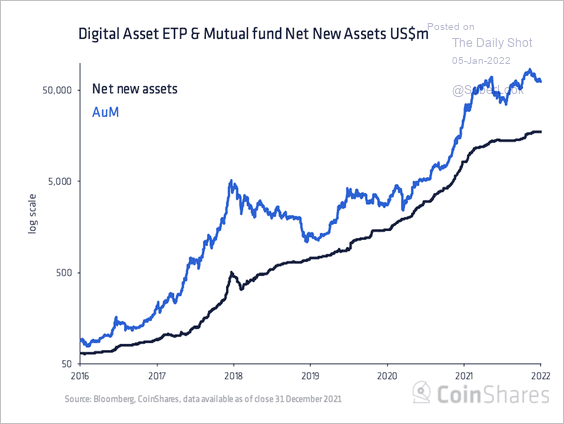 Source: CoinShares Read full article
 Source: CoinShares Read full article
——————–
5. Development activity in Polkadot has picked up significantly over the past year.
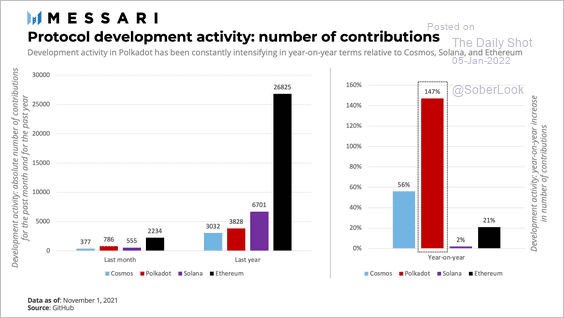 Source: @MessariCrypto
6. Recently, a majority of NFT transaction volume consists of collectors with deep pockets (2 charts).
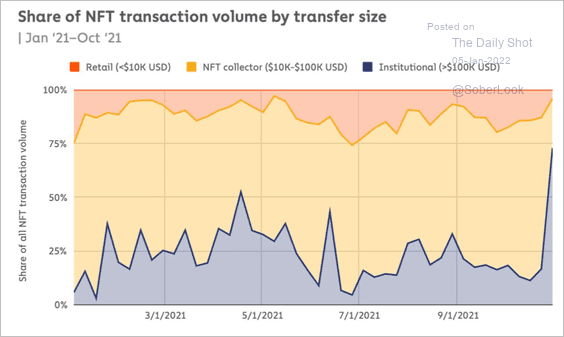 Source: @chainalysis
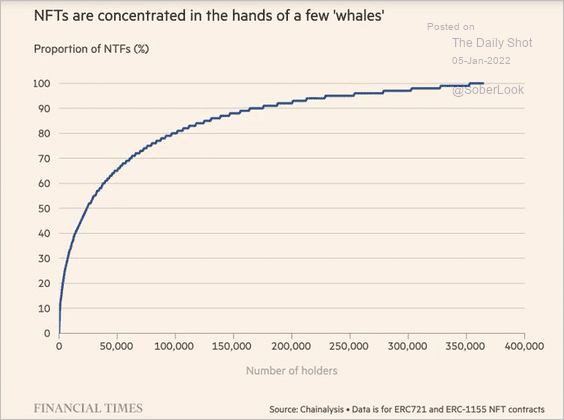 Source: @acemaxx, @FT Read full article
Back to Index
Commodities
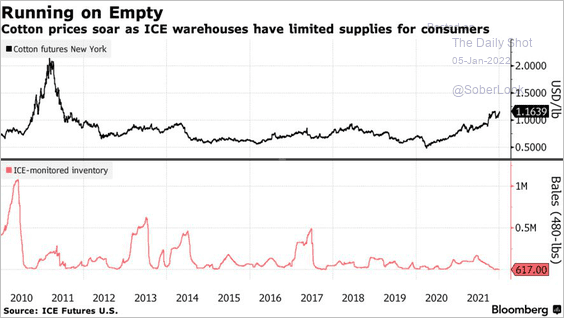
1. Cotton prices have been surging due to limited supplies.
 Source: Bloomberg Read full article
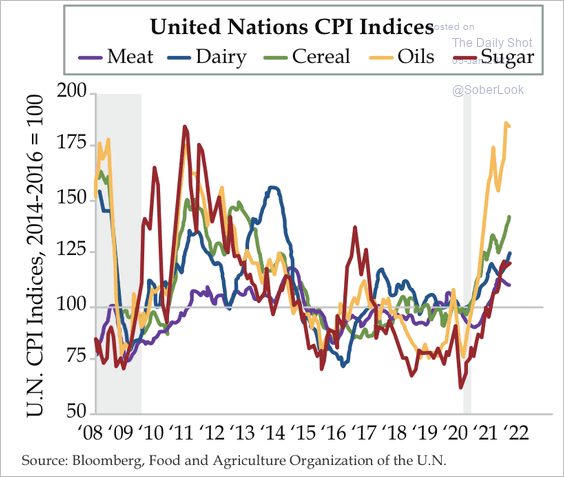
2. US meat and sugar prices rose to a higher degree relative to the world as a whole (2 charts).
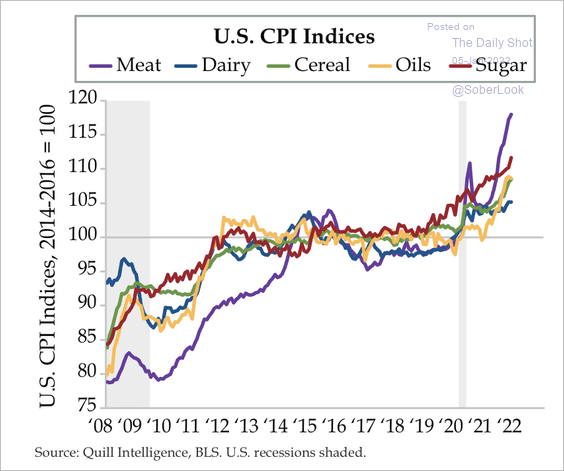 Source: Quill Intelligence
 Source: Quill Intelligence
Back to Index
Energy
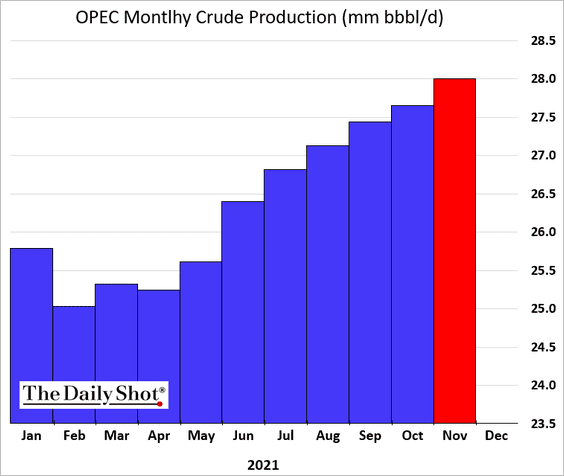
1. Comforted by estimates of tight oil supplies this year, OPEC is raising output.
2. Energy has mostly outperformed other commodities last year.
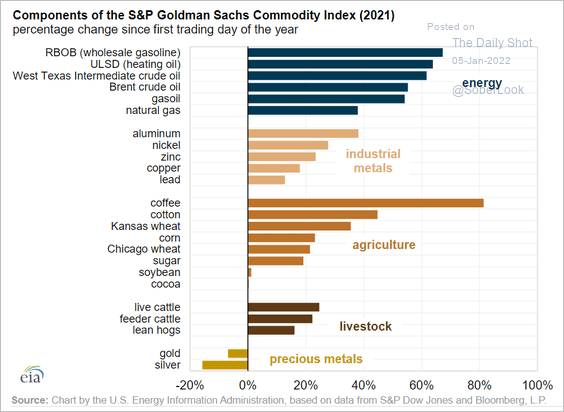 Source: EIA Read full article
3. Crude oil hedging activities are declining for US oil producers, which suggests companies expect to capitalize on higher prices. Will we see a further increase in production?
 Source: Argus Media Read full article
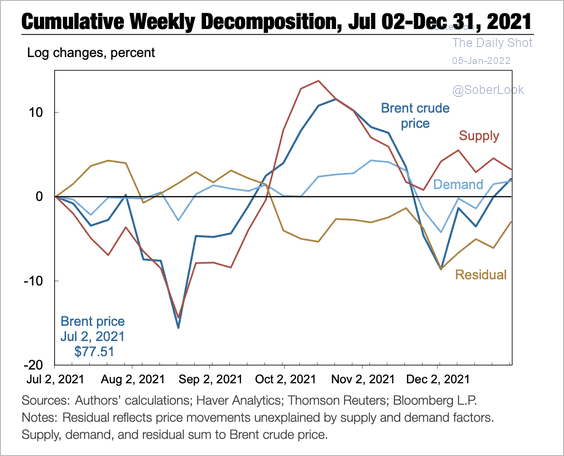
4. Over the past week, an increase in anticipated supply was offset by an increase in demand expectations, which resulted in higher oil prices.
 Source: NY Fed Read full article
5. The largest US wind project is ready to proceed.
 Source: Bloomberg Read full article
Back to Index
Equities
1. Following the past 10 years with the shallowest intra-year pullbacks, stocks tended to see deeper drawdowns and more modest annual gains in the next year.
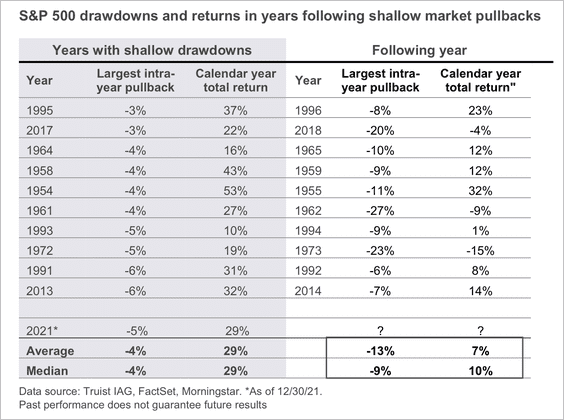 Source: Truist Advisory Services
2. This chart shows the 2021 winners and losers by market cap change.
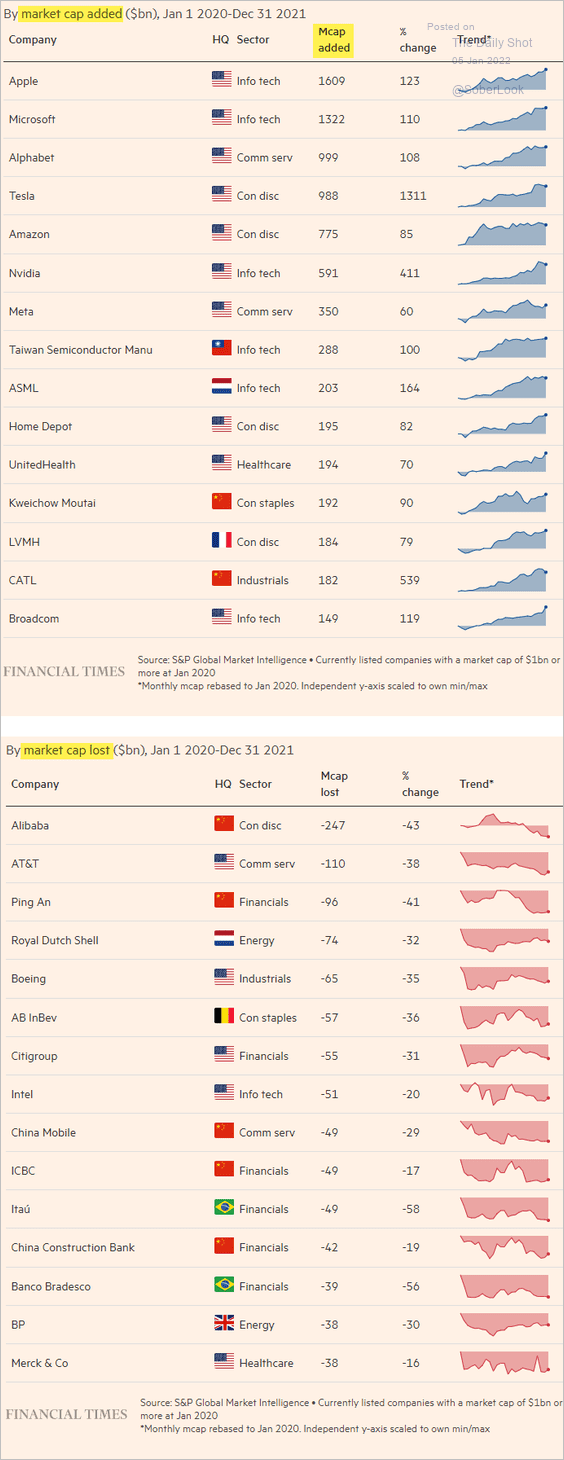 Source: @financialtimes, h/t Walter Read full article
3. Next, we have the trajectories of full-year earnings estimates since 2016.
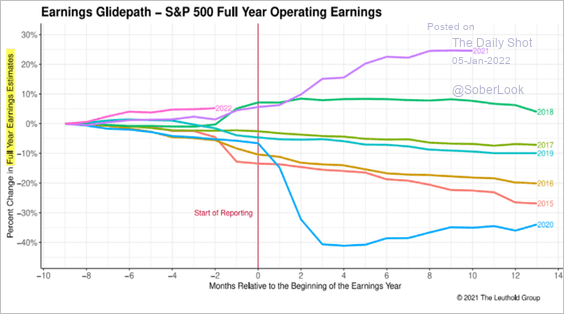 Source: Leuthold Group
4. US outperformance vs. the rest of the world is not limited to growth stocks.
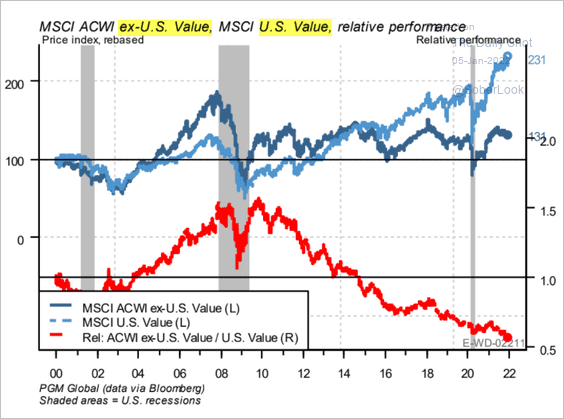 Source: PGM Global
5. S&P 500 valuations tend to decline during periods of rising inflation.
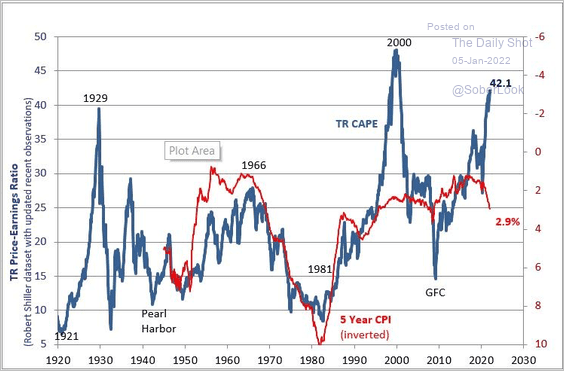 Source: Norges Bank
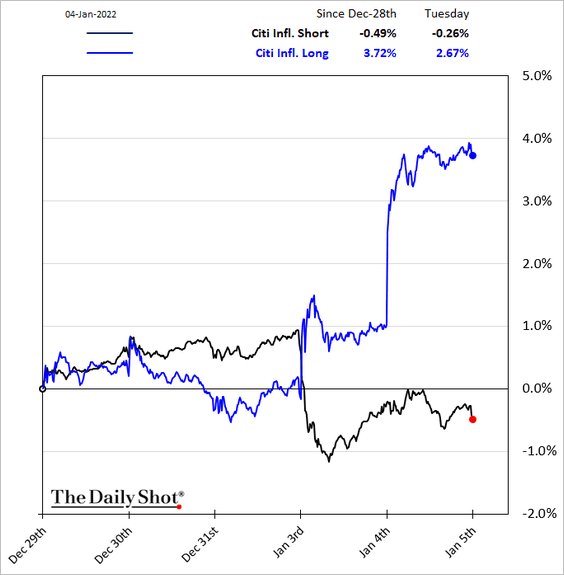
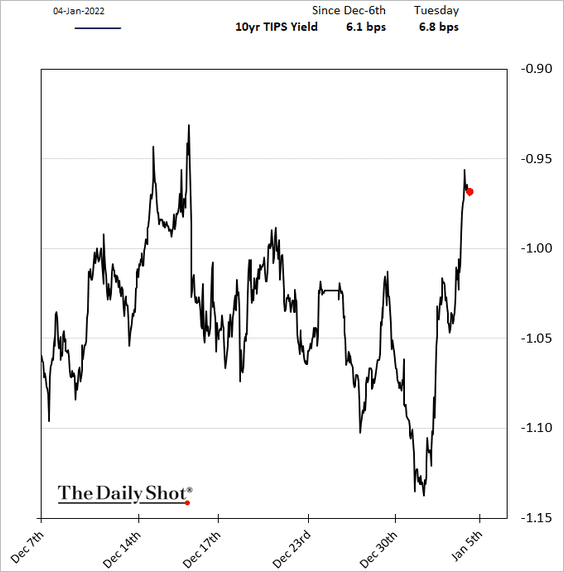
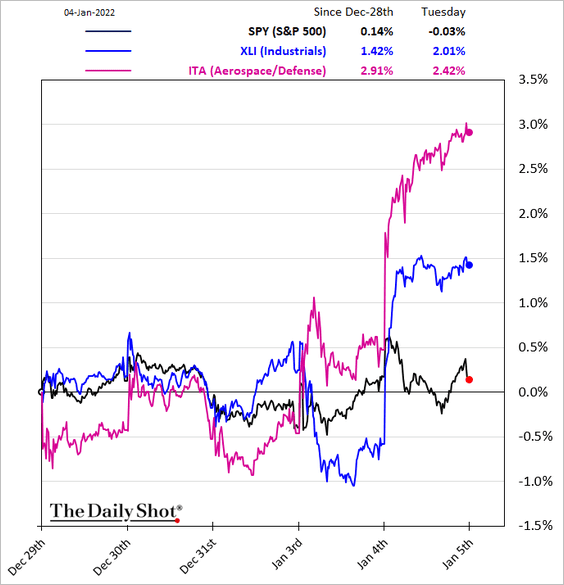
6. Inflation-sensitive stocks jumped on Tuesday.
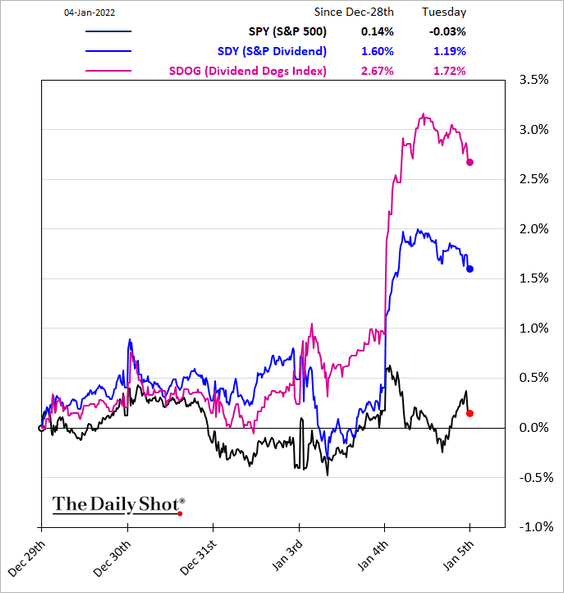
7. High-dividend sharers rallied.
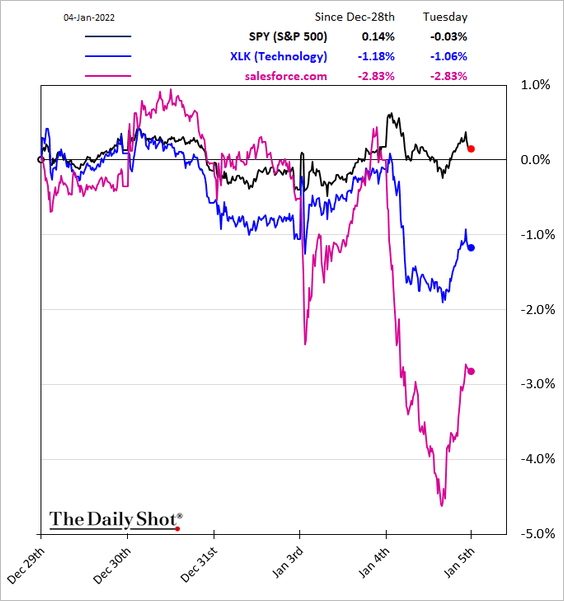
Speculative growth stocks took a hit …
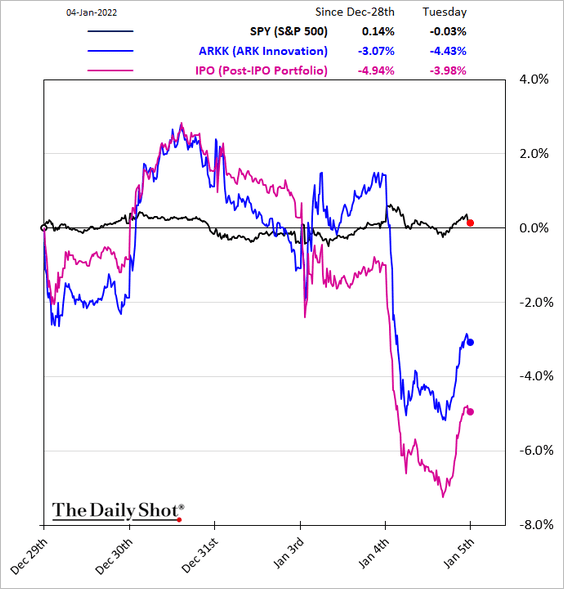
… as real rates (TIPS yields) claimed.
——————–
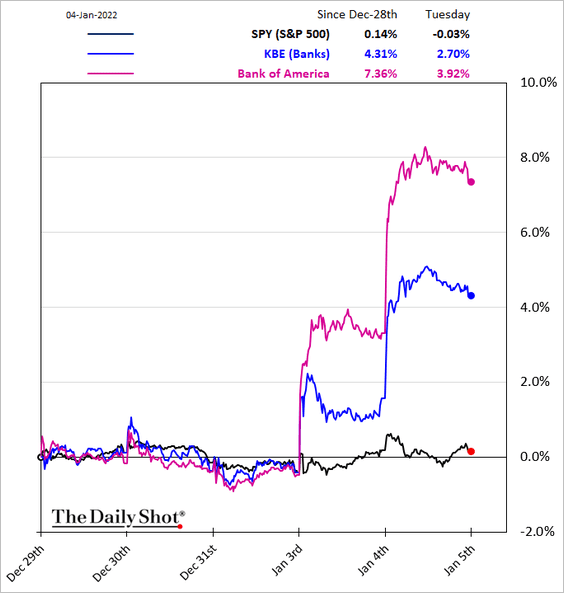
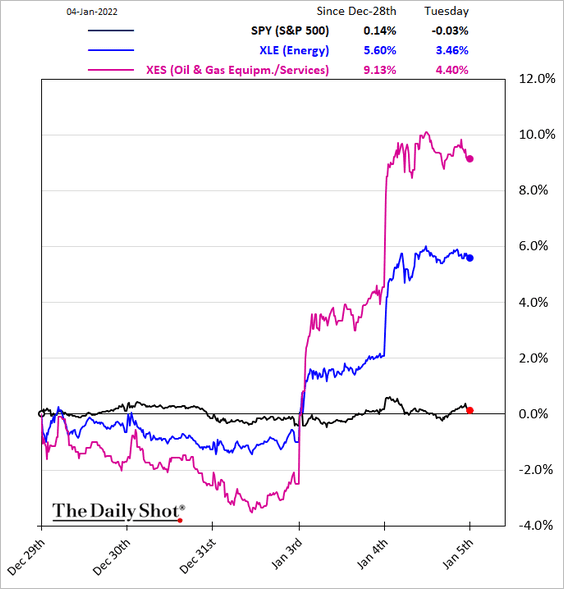
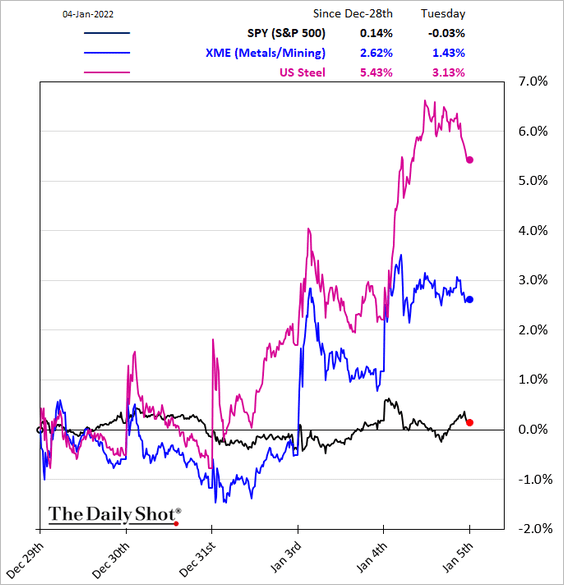
8. Here are some sector trends over the past few days.
• Banks:
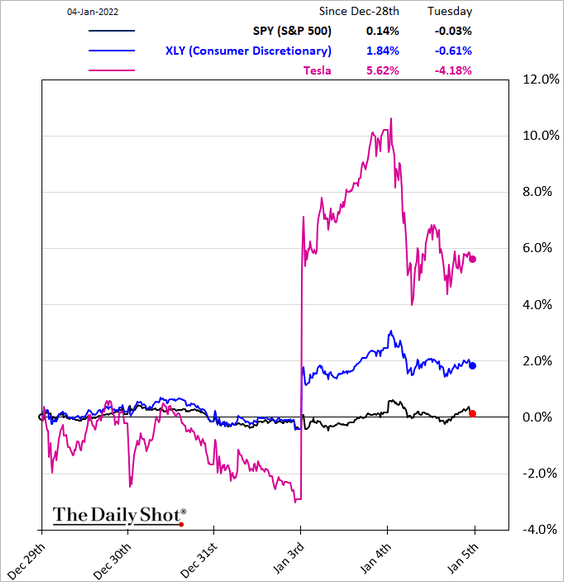
• Consumer discretionary (lead by Tesla).
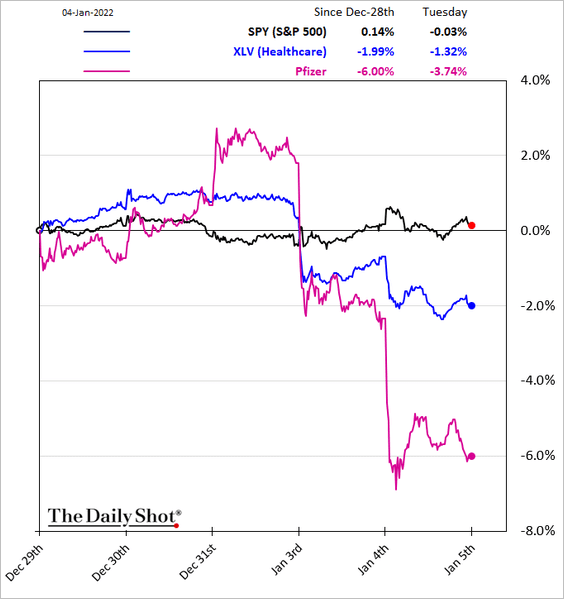
• Healthcare:
• Industrials:
• Transportation/logisitcs:
![]()
• Tech:
• Energy:
• Metals & Mining:
Back to Index
Credit
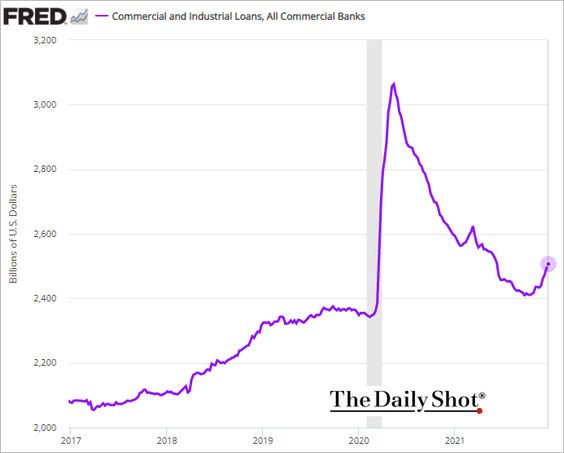
1. US business lending is rebounding.
2. US corporate health appears strong relative to history, which suggests the credit cycle is in an expansion phase.
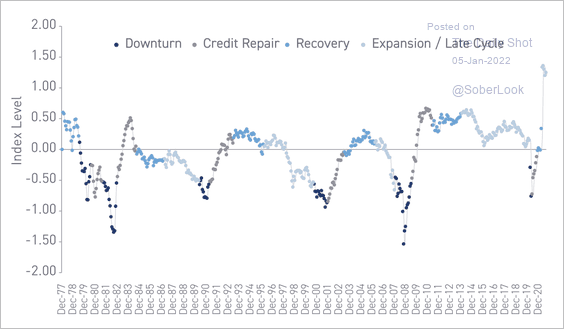 Source: Loomis Sayles Read full article
3. Loan issuance hit a record in 2021.
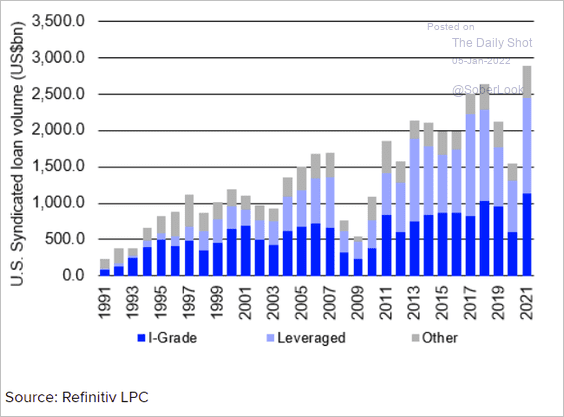 Source: @LPCLoans, @refinitiv Read full article
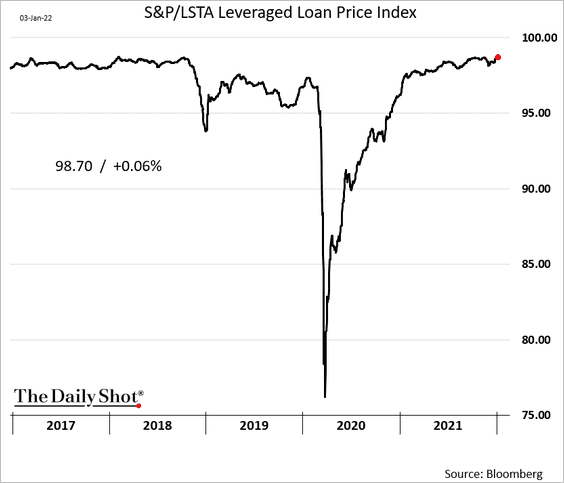
4. Loan prices are near multi-year highs.
5. ESG-linked credit exploded in 2021.
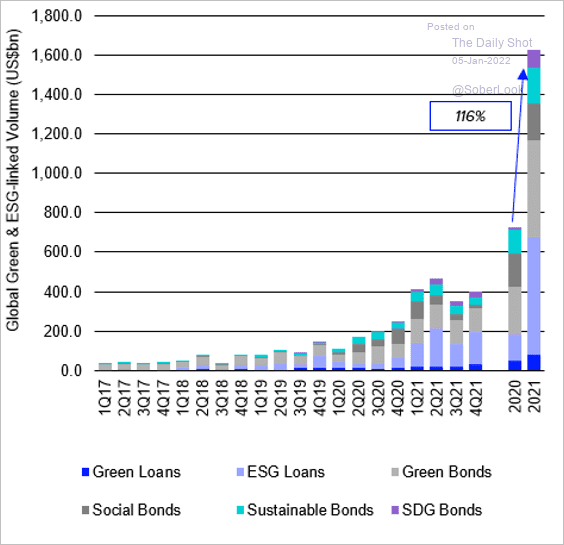 Source: @LPCLoans
Back to Index
Rates
1. Treasury market implied volatility remains elevated relative to equity vol.
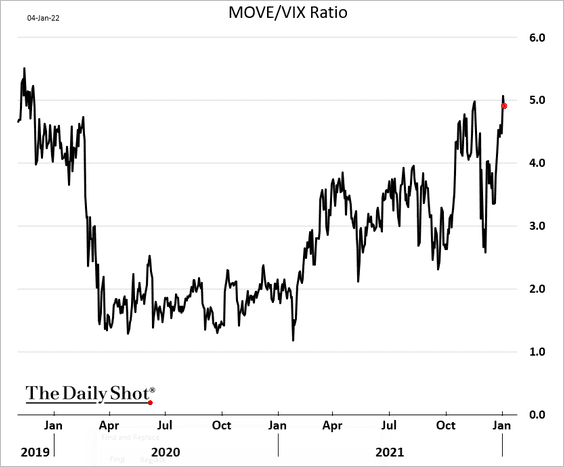 h/t @ossingerj
2. Demand for the 7-year and 20-year Treasury auctions have weakened last year.
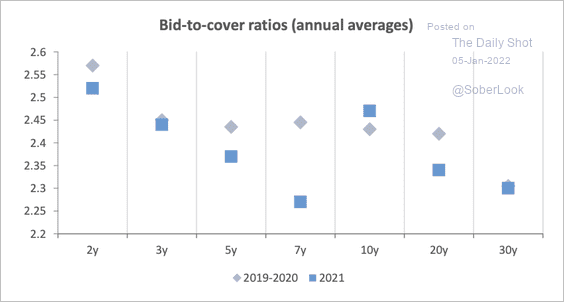 Source: Deutsche Bank Research
3. Treasury duration-weighted supply net of Fed purchases is projected to fall by about 10% this year.
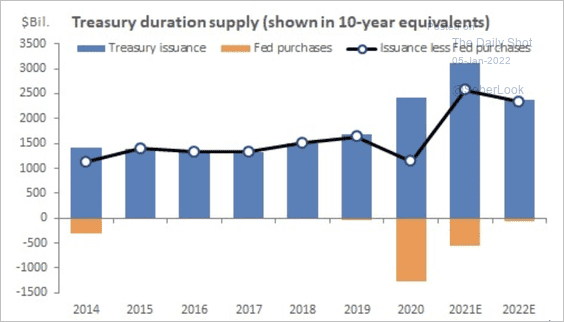 Source: Deutsche Bank Research
4. Here is Goldman’s forecast for the 10yr Treasury yield.
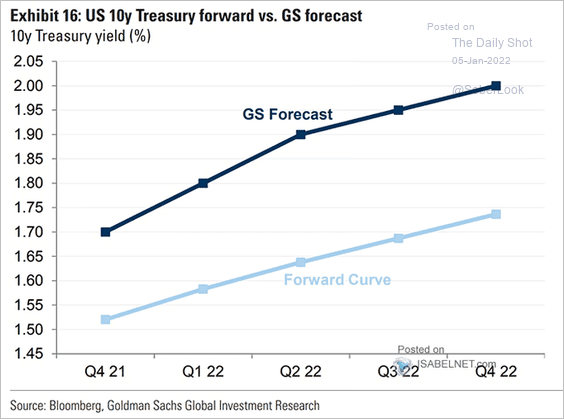 Source: @ISABELNET_SA, @GoldmanSachs
Back to Index
Global Developments
1. Let’s start with performance across asset classes in 2021.
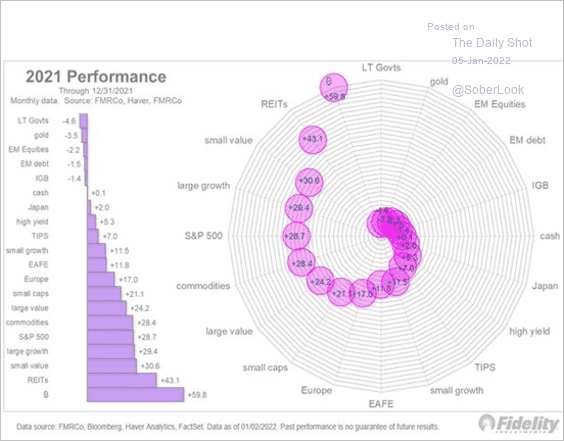 Source: @TimmerFidelity, @Fidelity
Here is how equity markets performed.
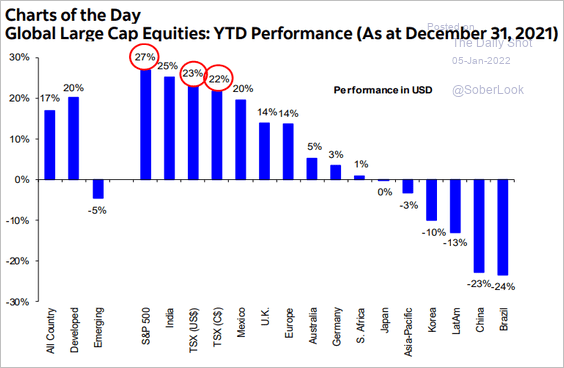 Source: Hugo Ste-Marie, Portfolio & Quantitative Strategy Global Equity Research, Scotia Capital
——————–
2. ESG fund flows have slowed over the past year.
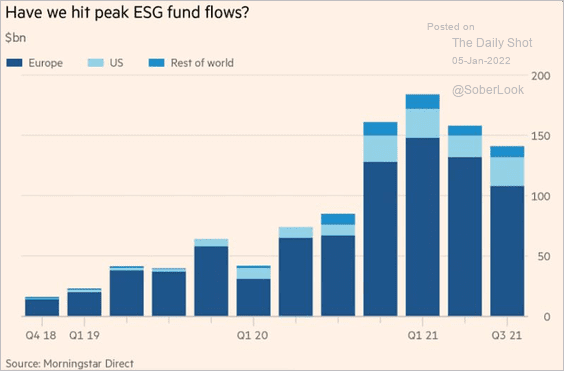 Source: @financialtimes Read full article
Interest in ESG appears to have peaked.
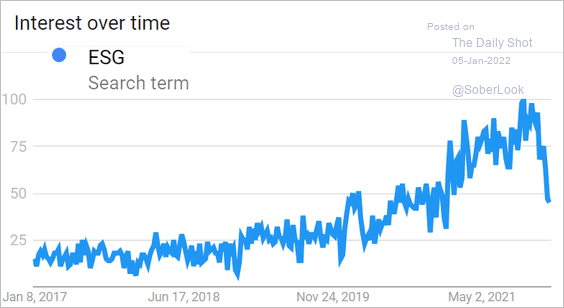 Source: Google Trends
——————–
3. Manufacturing growth held steady in December.
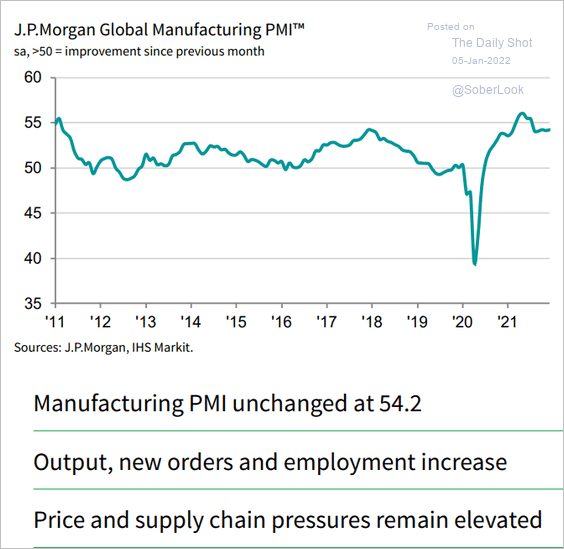 Source: IHS Markit
• Italy saw the fastest growth in factory activity.
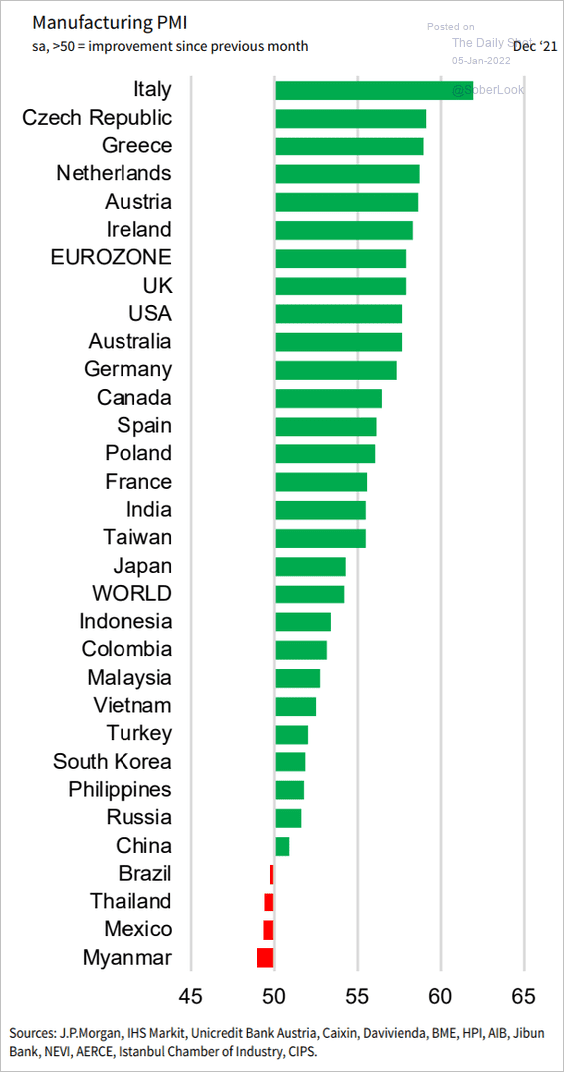 Source: IHS Markit
• US and Eurozone manufacturing PMIs have recovered more than emerging markets.
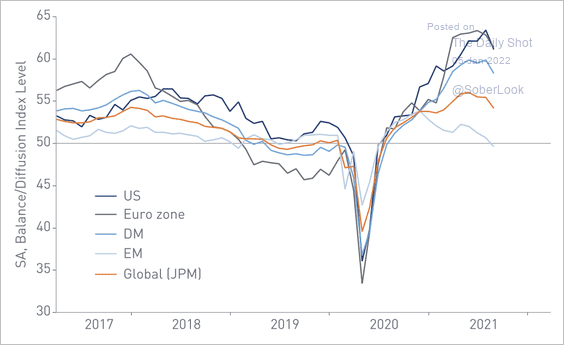 Source: Loomis Sayles Read full article
——————–
Food for Thought
1. US mortgage rates by year (average):
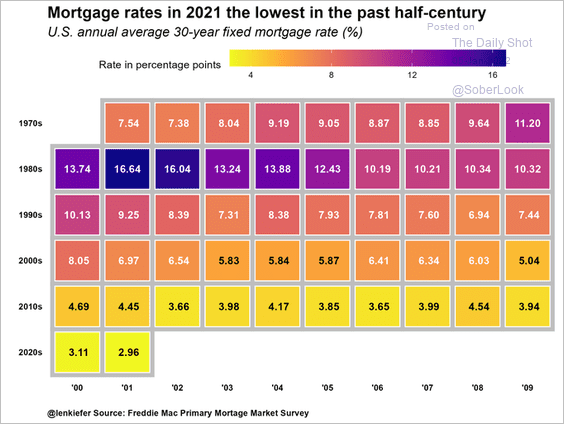 Source: @lenkiefer
2. Third-quarter GDP growth by state:
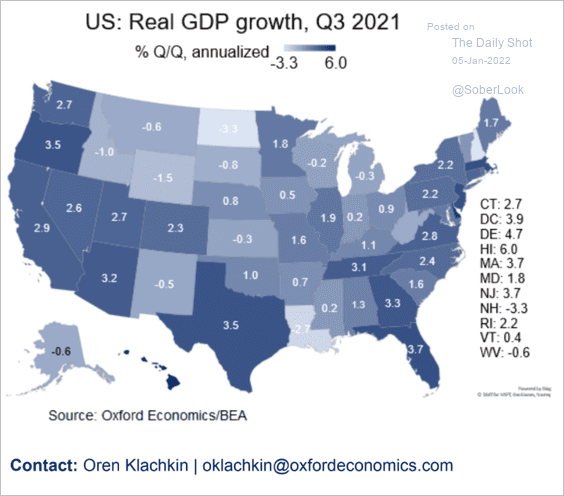 Source: Oxford Economics
3. The average age of US government structures:
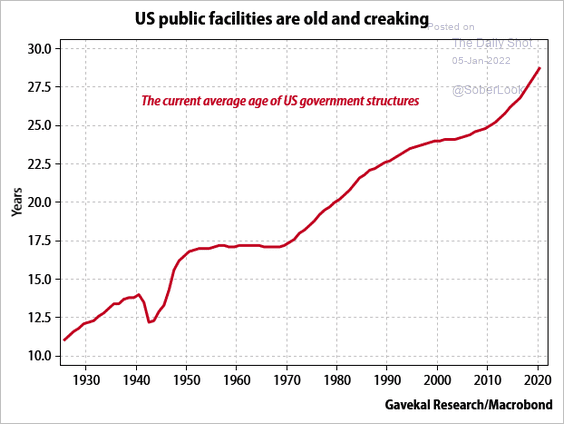 Source: Gavekal Research
4. US local governments’ sources of revenue:
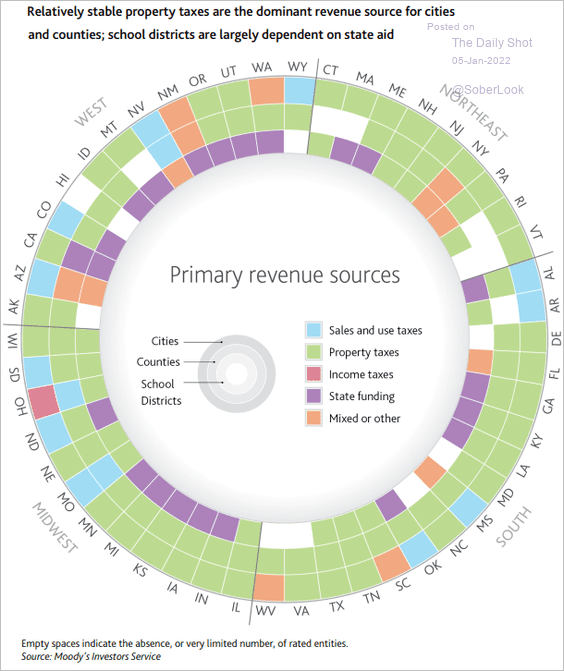 Source: Moody’s Investors Service
5. Champagne as a share of wine deliveries:
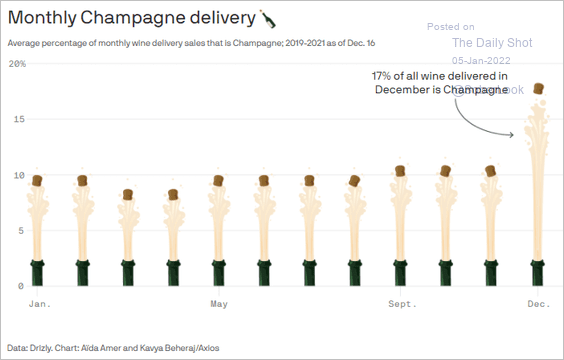 Source: @axios Read full article
——————–
Back to Index