
The Daily Shot: 13-Jan-22
• The United States
• The Eurozone
• Europe
• China
• Emerging Markets
• Cryptocurrency
• Commodities
• Energy
• Equities
• Credit
• Rates
• Global Developments
• Food for Thought
The United States
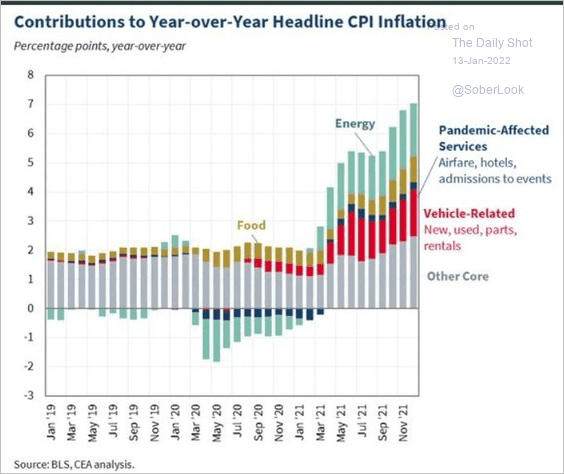
1. As expected, the CPI hit a four-decade high in December, driven by supply bottlenecks and robust consumer demand for goods.
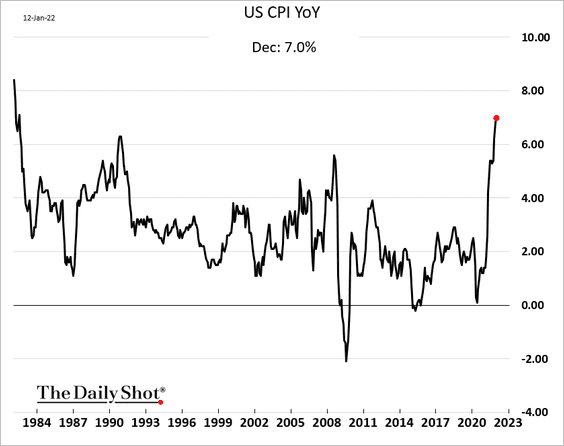
Here are the key components.
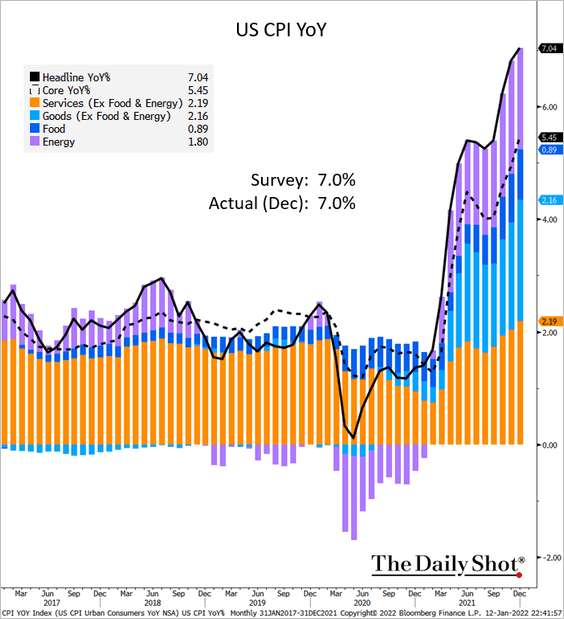 Source: @TheTerminal, Bloomberg Finance L.P.
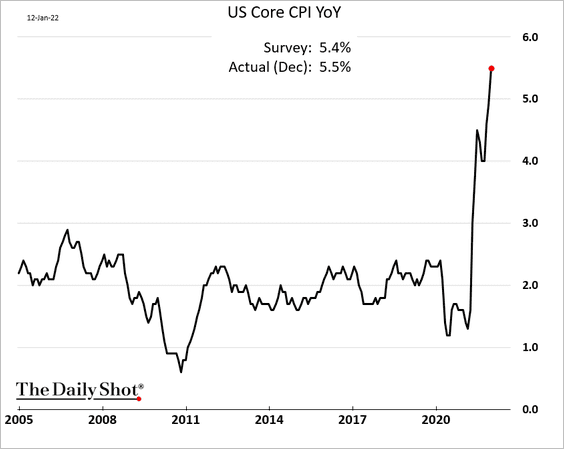
The core CPI was a bit stronger than expected.
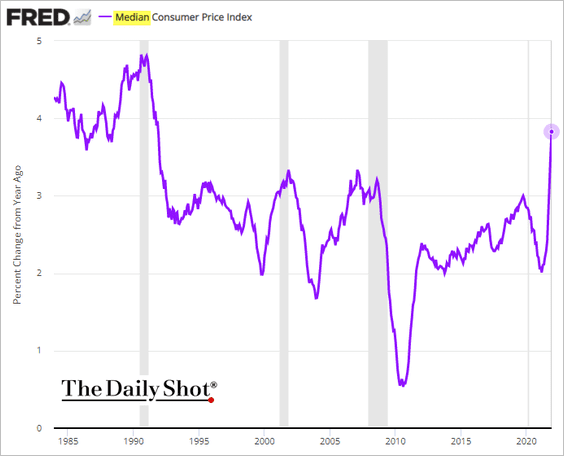
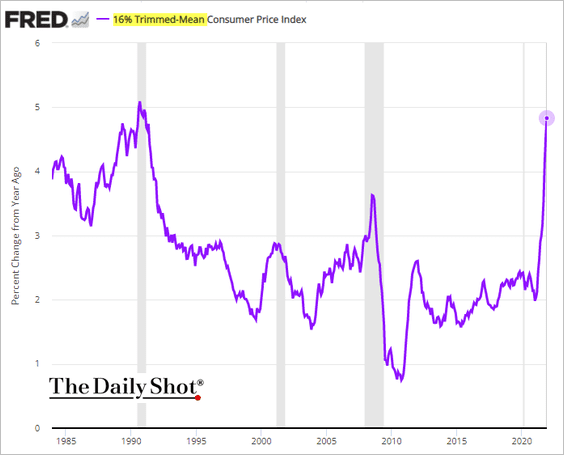
• Other measures of core inflation also surged.
– Median CPI:
– Trimmed-mean CPI:
• The share of CPI components rising by more than 5% has exploded.
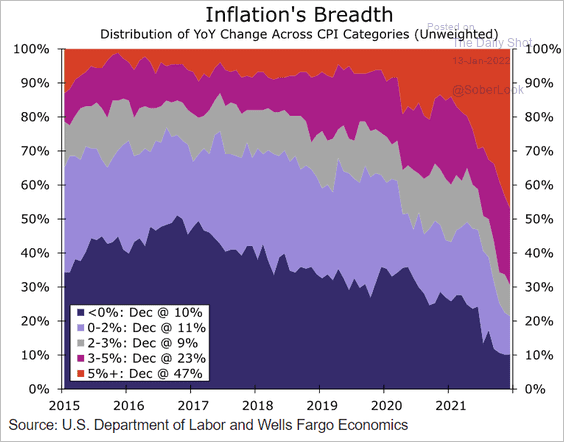 Source: Wells Fargo Securities
• However, the increase in core inflation outside of chip-related sectors (autos) and pandemic-related items is not extreme.
 Source: @MarketInterest
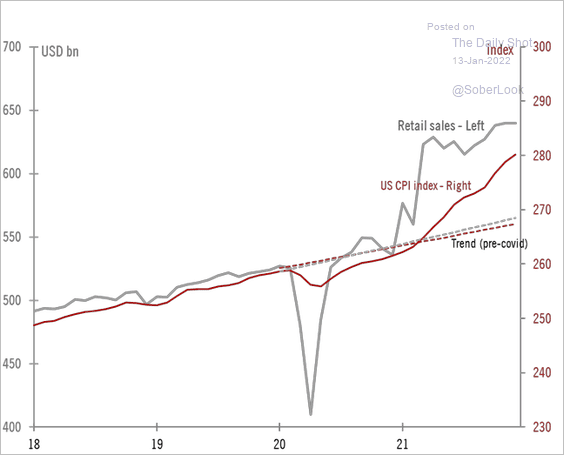
• An important driver of rapid price gains has been the massive demand for goods, …
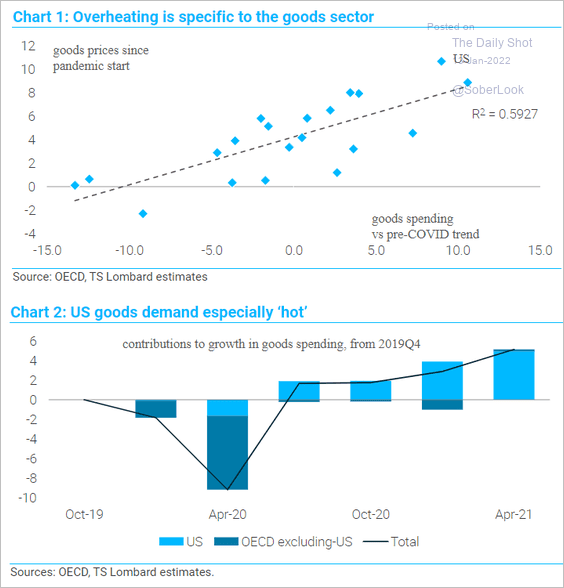 Source: TS Lombard
… as Americans put their excess savings to work.
 Source: @TCosterg
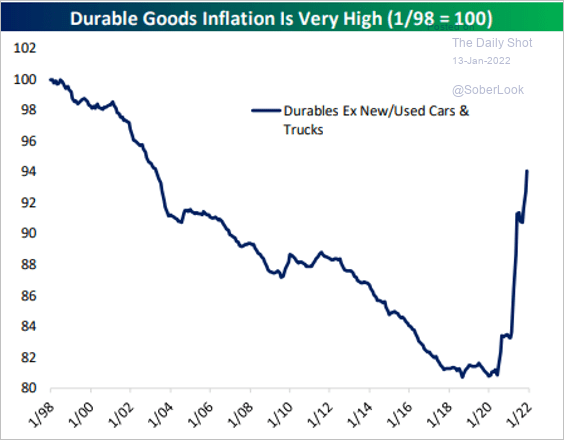
Durable goods have unwound two decades of deflation.
 Source: @bespokeinvest Read full article
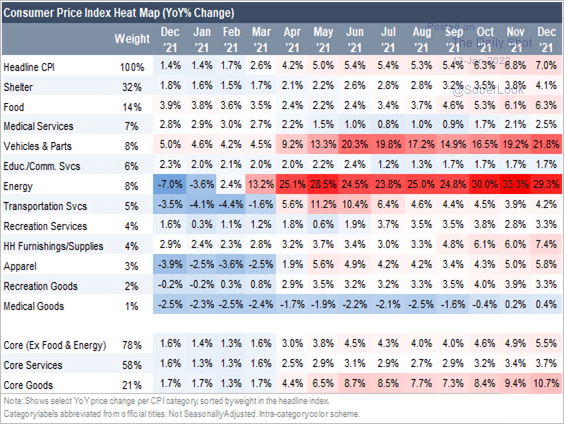
• Here is the CPI “heat map.”
 Source: CreditSights
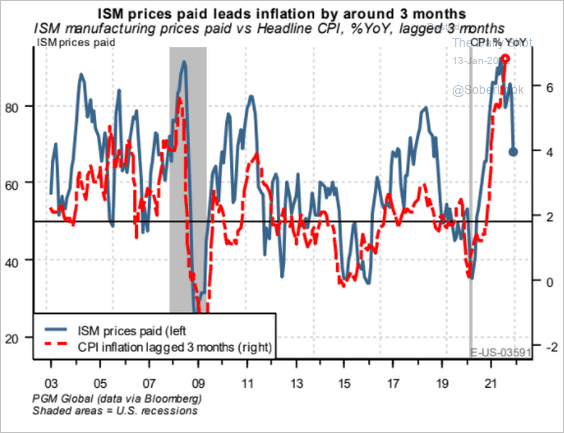
• Economists see inflation peaking within a month or two but staying elevated for some time.
 Source: PGM Global
We will have more on the CPI report tomorrow.
——————–
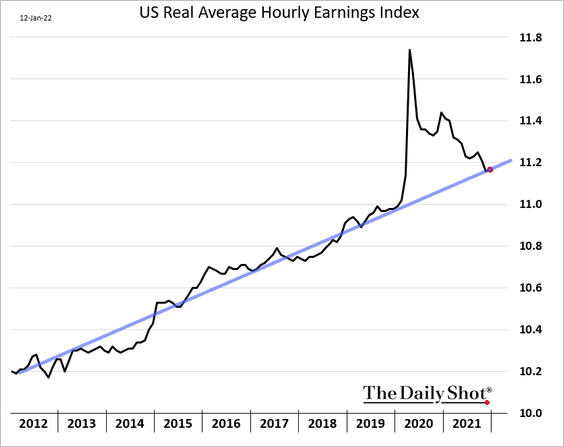
2. Real wages are back to their pre-COVID trend.
3. Freight rates continued to surge in December.
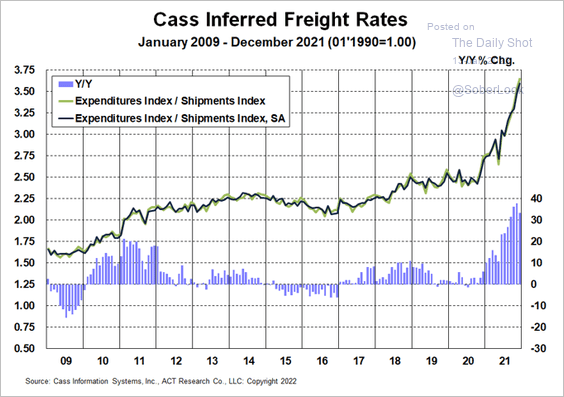 Source: Cass Information Systems
4. The Fed’s Beige Book shows companies still worried about climbing costs and supply chain issues. And the pandemic is back in focus.
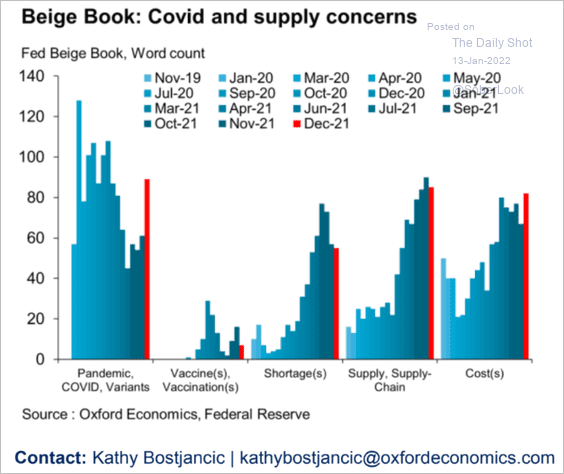 Source: Oxford Economics
5. What factors are driving businesses to boost prices?
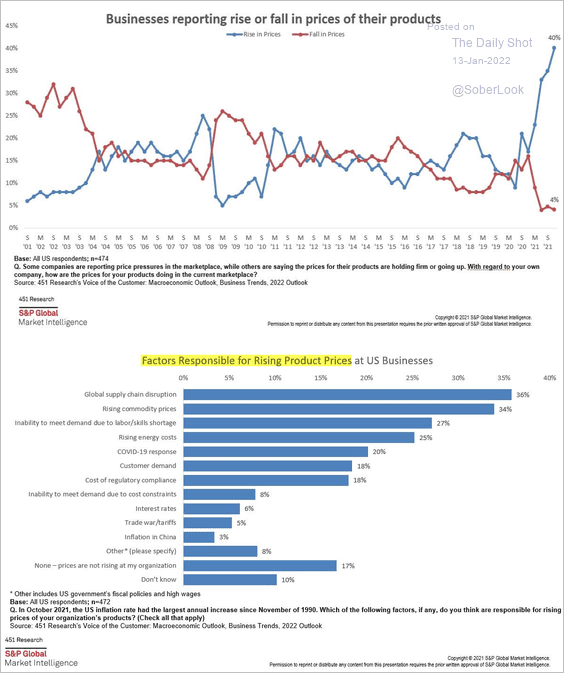 Source: S&P Global Market Intelligence
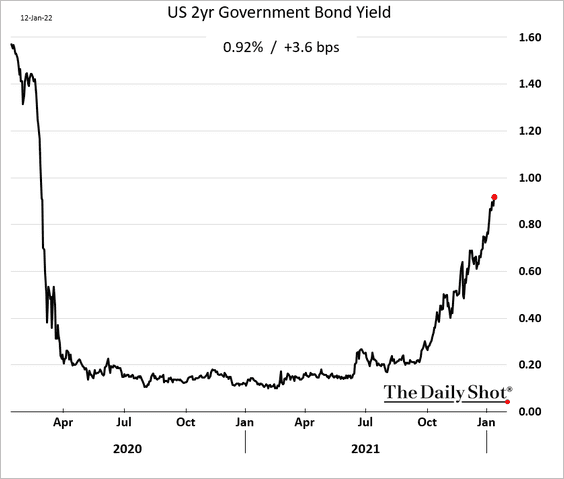
6. The 2-year Treasury yield is pushing toward 1%.
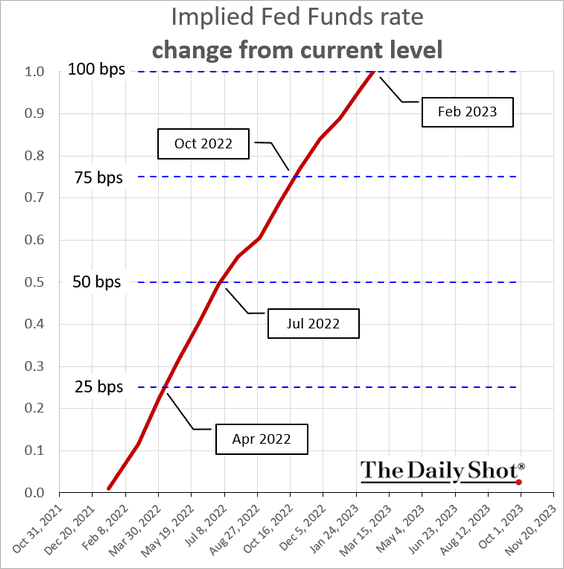
Here are the Fed rate hikes that are fully priced into the market (note that there is a high probability of these events occurring sooner).
——————–
7. Liquidity conditions remain highly accommodative.
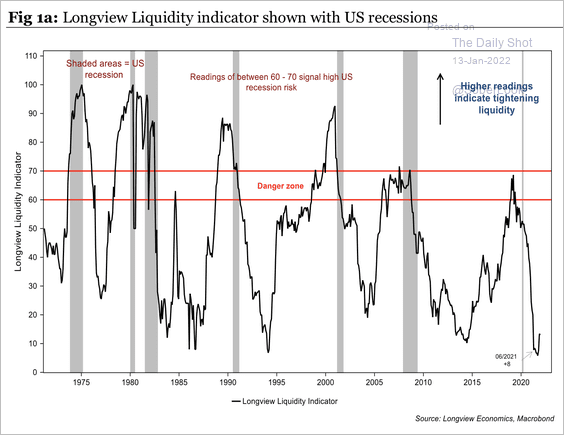 Source: Longview Economics
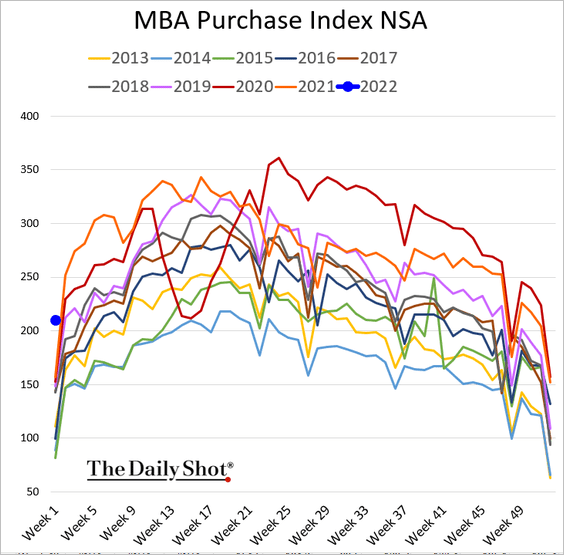
8. Mortgage applications started the year on a strong note despite higher rates.
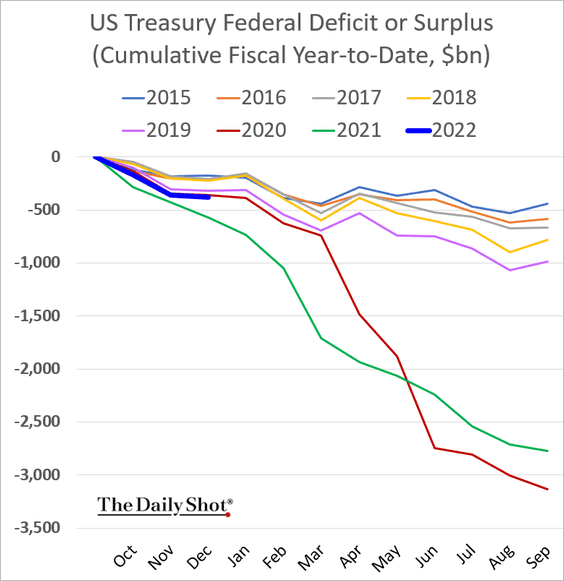
9. The federal deficit is following the 2020 trajectory for now.
Back to Index
The Eurozone
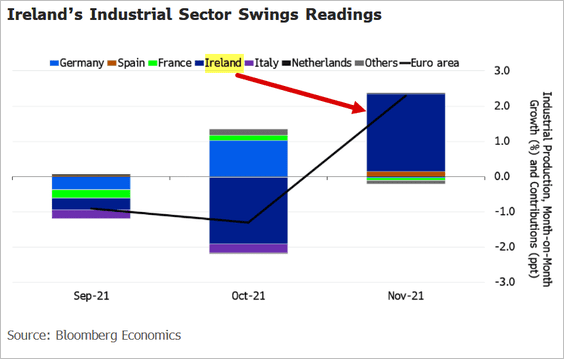
1. Industrial production rose more than expected in November.
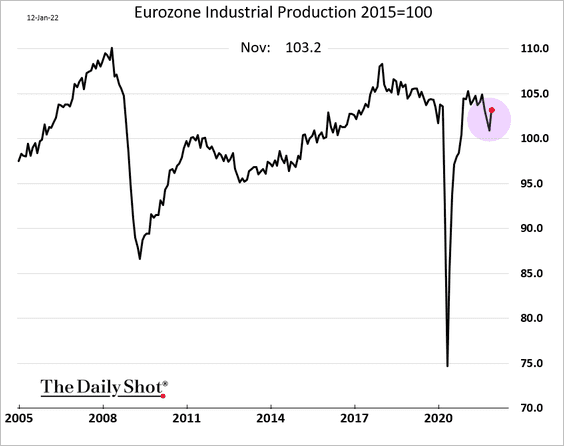
Both the November and October figures were distorted by massive output swings in Ireland.
 Source: @MaevaDebarge, @TheTerminal Read full article
——————–
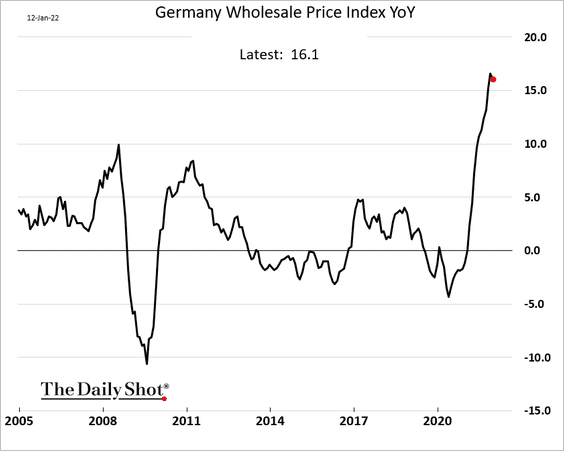
2. Germany’s wholesale inflation appears to be peaking.
3. French industrial sentiment has been topping forecasts.
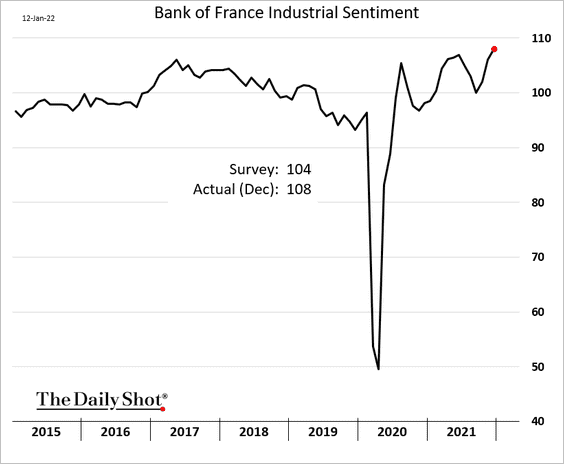
Separately, Macron continues to poll well for the upcoming election (despite his 35% approval rating).
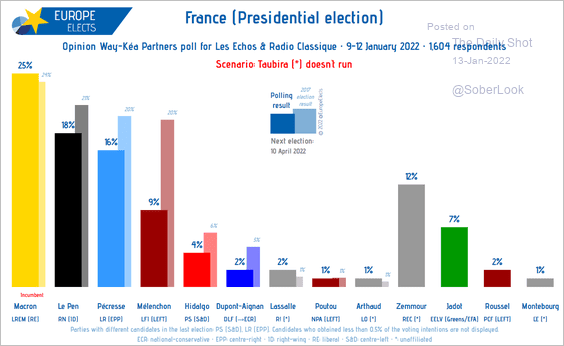 Source: @EuropeElects Read full article
Back to Index
Europe
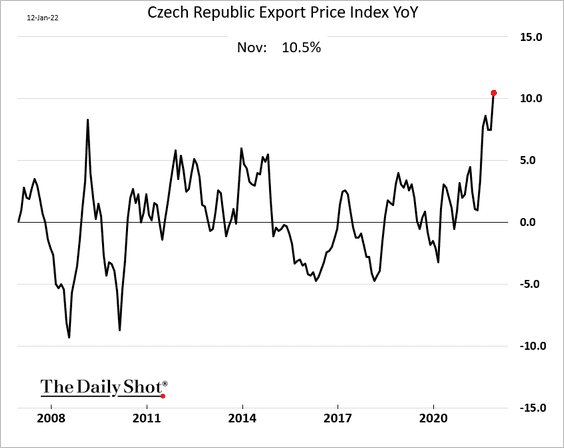
1. Czech CPI continues to surge.
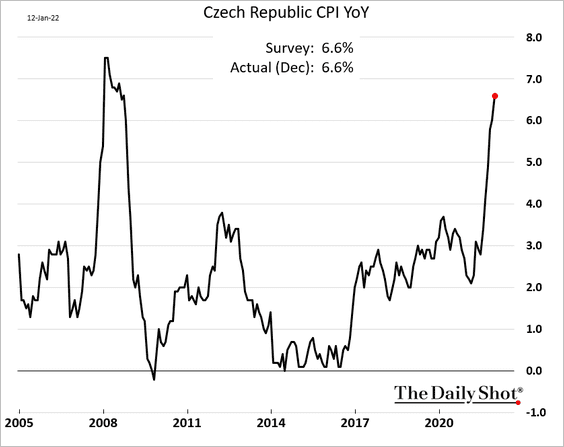
The Czech Republic is exporting inflation to the Eurozone.
——————–
2. European equities tend to do relatively well when US yields rise (the chart shows beta to bond prices).
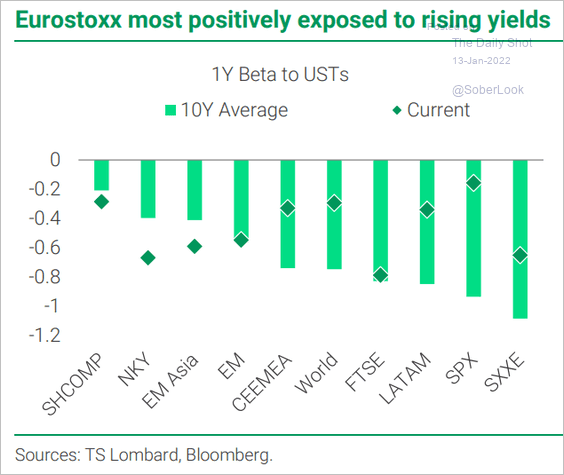 Source: TS Lombard
3. This chart depicts vaccine hesitancy by age.
 Source: @DToshkov
Back to Index
China
1. Developers’ bonds remain under pressure.
• Evergrande:
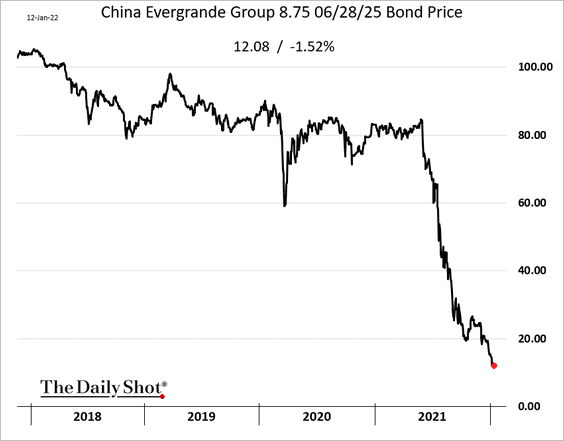 Source: Bloomberg
• Sunac:
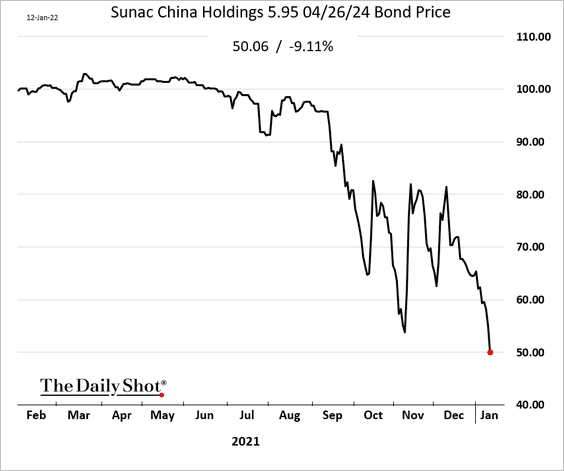 Source: Bloomberg
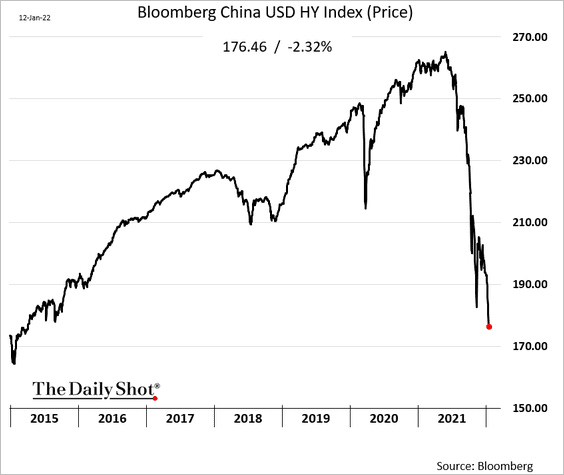
Bloomberg’s China USD high-yield index hit the lowest level since 2015.
——————–
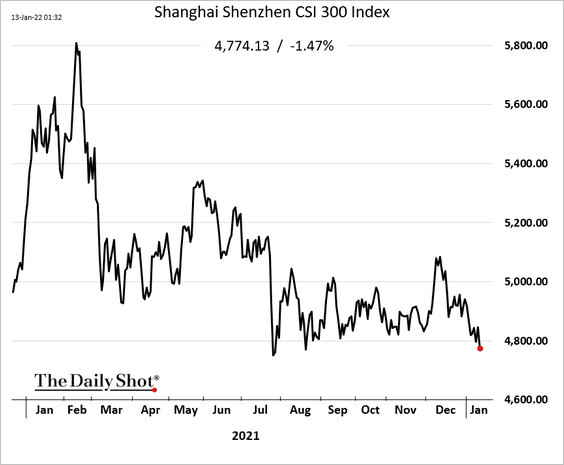
2. Shares have been selling off in the mainland.
3. Loan growth has been softening (2 charts).
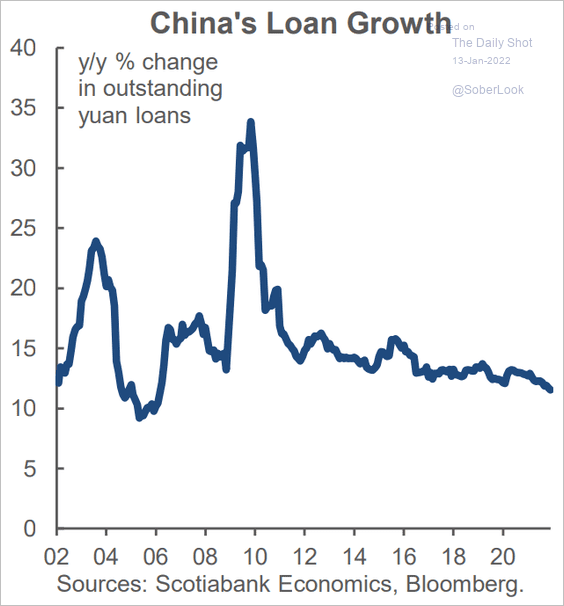 Source: Scotiabank Economics
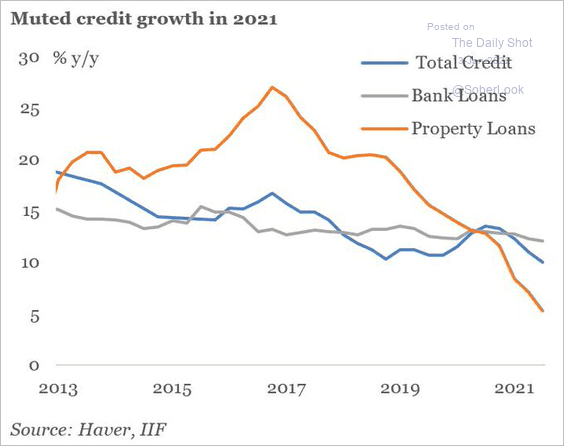 Source: @IIF, @genemaIIF, @phoebe_fengxy Read full article
——————–
4. This chart shows China’s system-wide leverage.
 Source: Wells Fargo Securities
5. China’s real policy rate remains high relative to other economies.
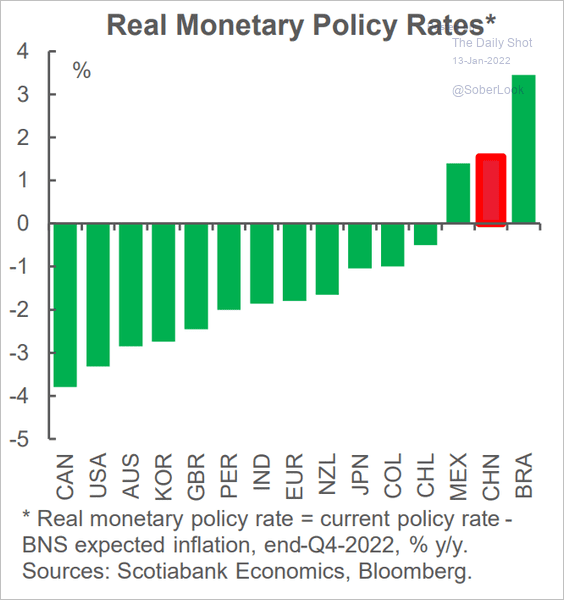 Source: Scotiabank Economics
6. Finally, we have the count of headlines in People’s Daily mentioning China’s leader.
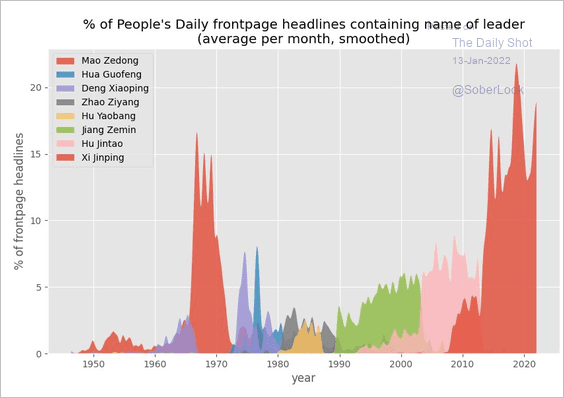 Source: @Chri5tianGoebel
Back to Index
Emerging Markets
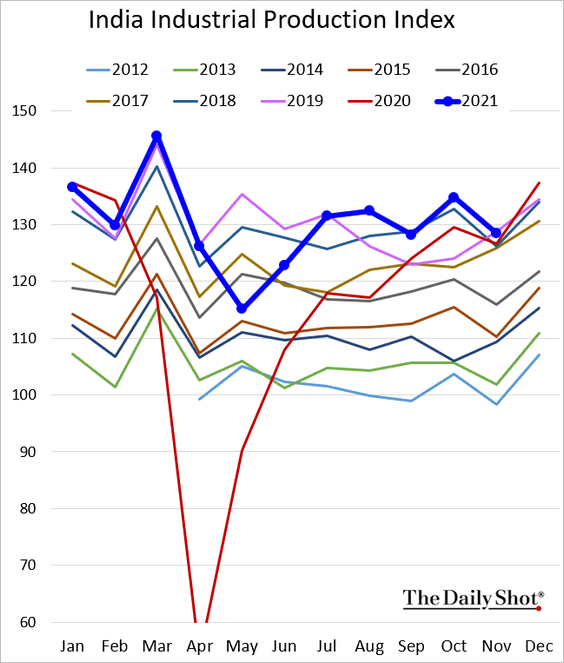
1. India’s industrial production dipped below 2019 levels in November.
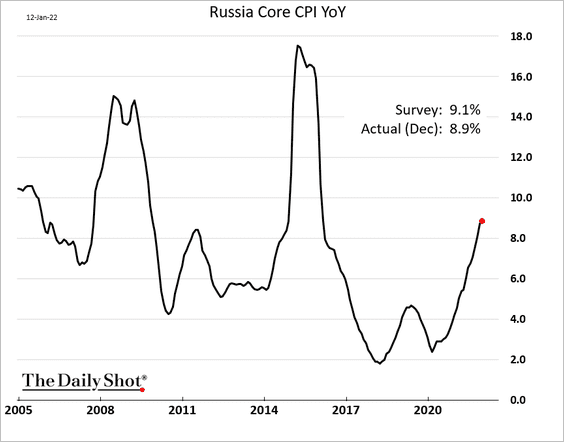
2. Russia’s core inflation was a bit lower than expected.
3. The betting markets see Lula winning this year’s election in Brazil.
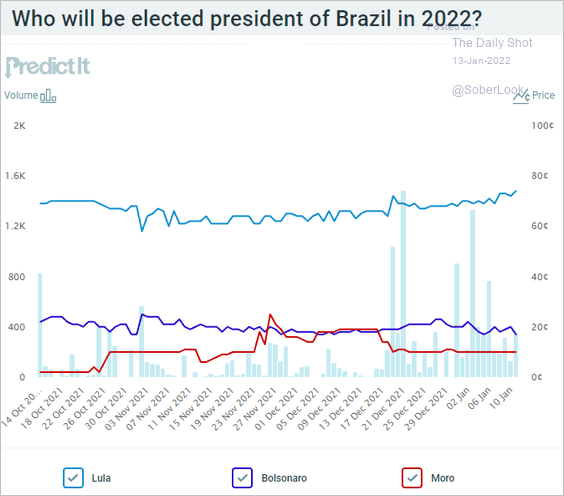 Source: @PredictIt
4. ETF flows have favored developed market equities over EM equities over the past six months. Could we see a reversal soon?
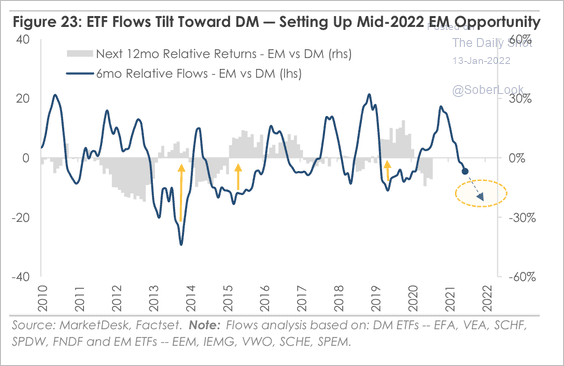 Source: MarketDesk Research
5. EM sovereign bond spreads have widened over the past few months as the market repriced credit risk higher.
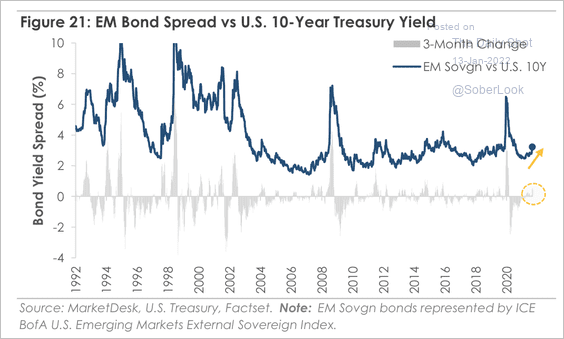 Source: MarketDesk Research
Back to Index
Cryptocurrency
1. The total market cap of cryptocurrencies has soared over the past two years.
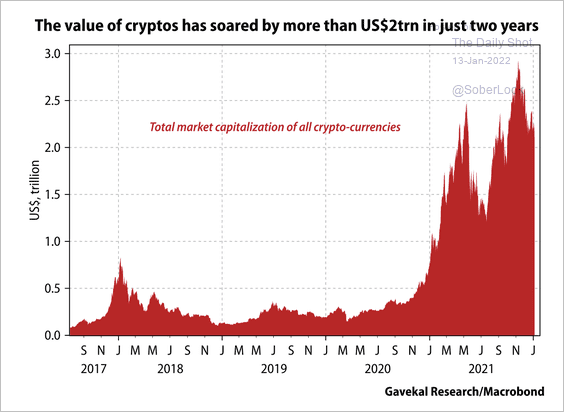 Source: Gavekal Research
2. Cryptocurrencies had a rough start to the year so far.
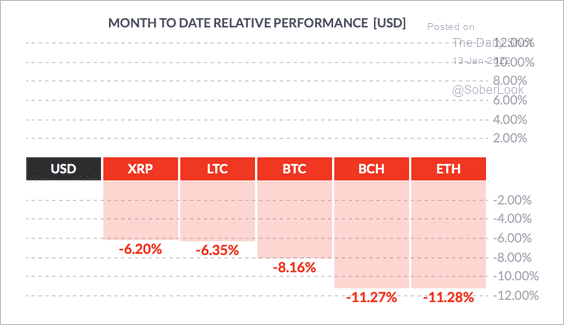 Source: FinViz
3. The chart below shows recent liquidations have been dominated by long BTC traders. If bitcoin enters a recovery phase, short traders could be vulnerable to liquidations.
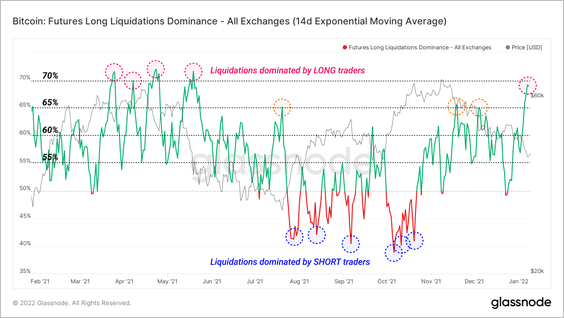 Source: Glassnode Read full article
4. Binance accounts for the largest share of BTC futures open interest among all exchanges, with FTX in second place.
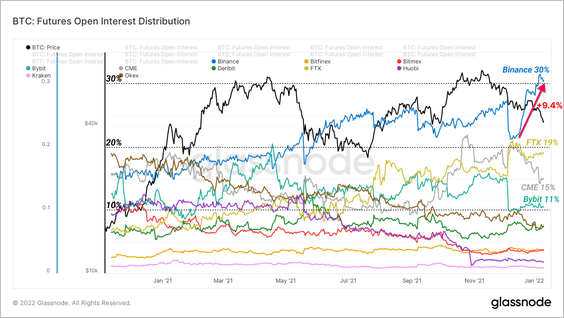 Source: Glassnode Read full article
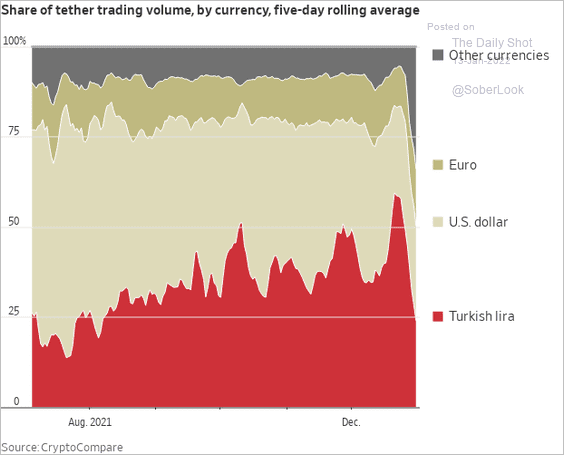
5. The lira’s massive devaluation created tremendous demand for crypto in Turkey.
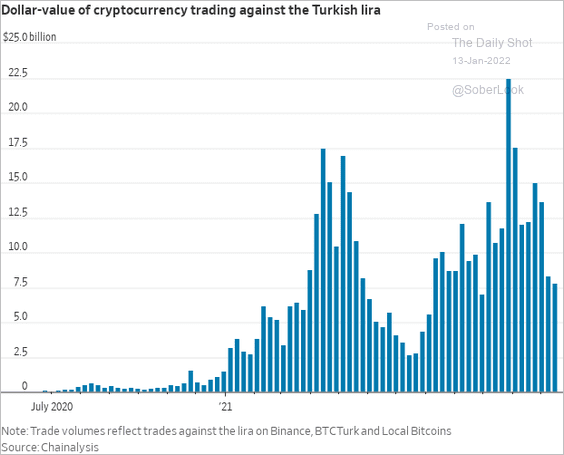 Source: @WSJ Read full article
 Source: @WSJ Read full article
——————–
6. More people are investing or planning to invest in crypto markets.
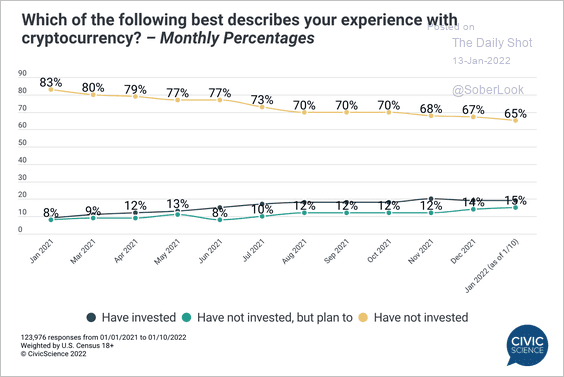 Source: @CivicScience
Back to Index
Commodities
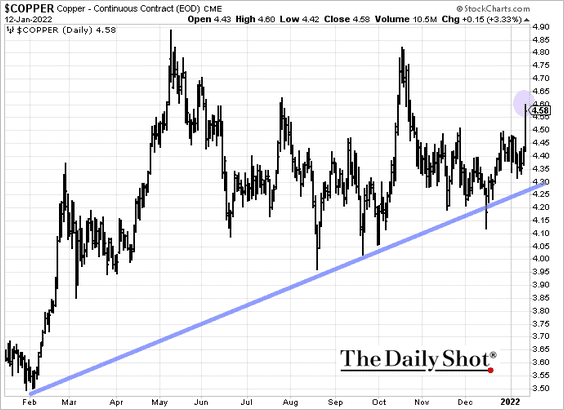
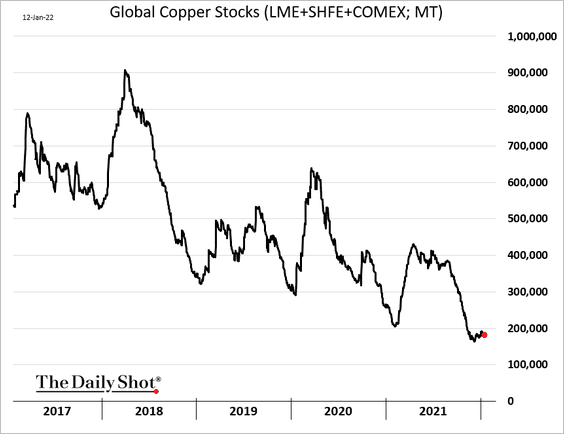
1. Copper is firmer amid tight inventories and China’s stimulus expectations.
——————–
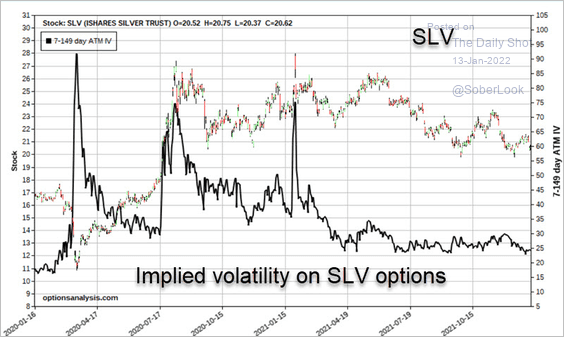
2. Silver is entering a seasonally strong period, which typically lasts through mid-February.
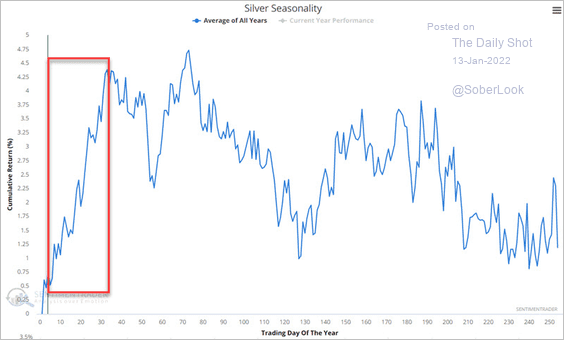 Source: SentimenTrader
Implied volatility for options on the iShares Silver Trust ETF (SLV) is at the low end of its historical range.
 Source: SentimenTrader
——————–
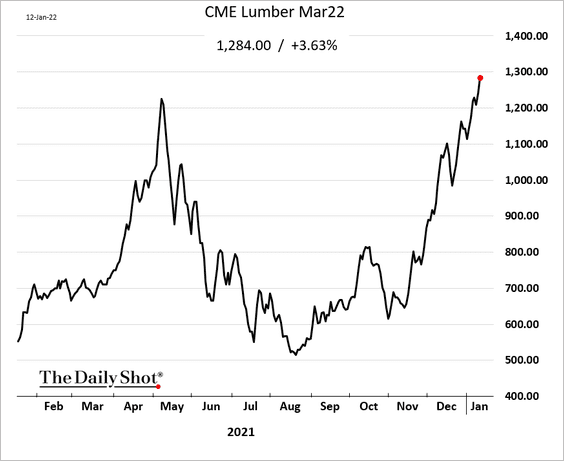
3. Lumber prices continue to climb. Here is the March contract.
 Source: Mortgage News Daily Read full article
Back to Index
Energy
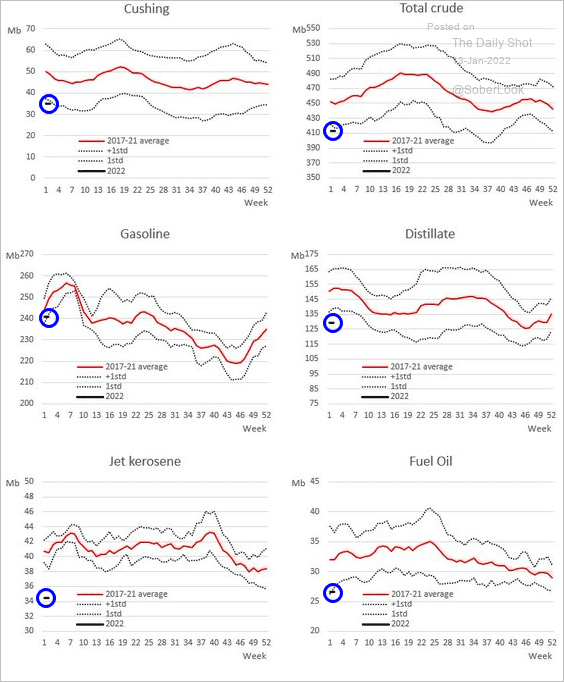
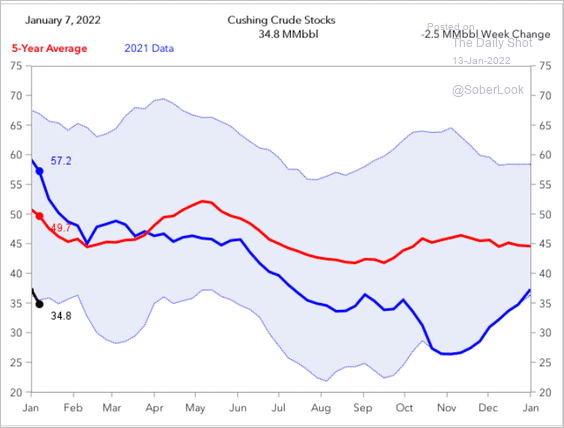
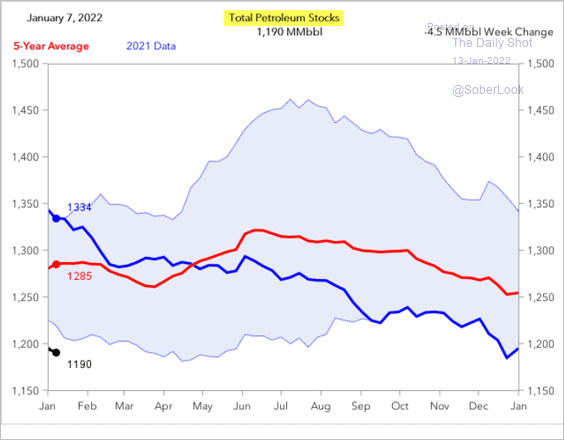
1. We are starting the year with tight crude oil and refined products inventories in the US (3 charts).
 Source: @Robert__Rennie
 Source: Fundamental Analytics
 Source: Fundamental Analytics
——————–
2. Tight supply was a key factor behind last year’s oil price rally …
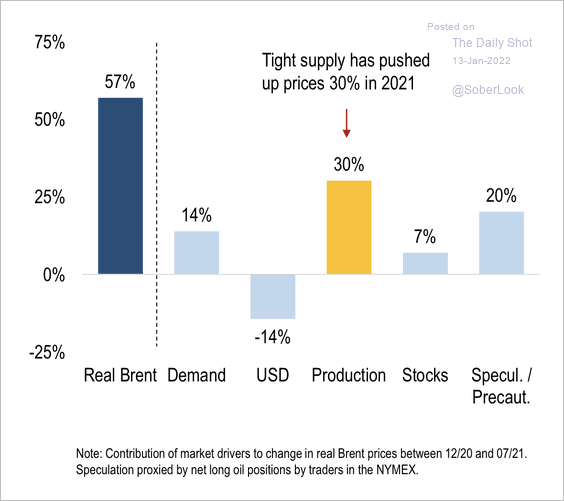 Source: Numera Analytics
…but the Q3 bull run was mostly speculative.
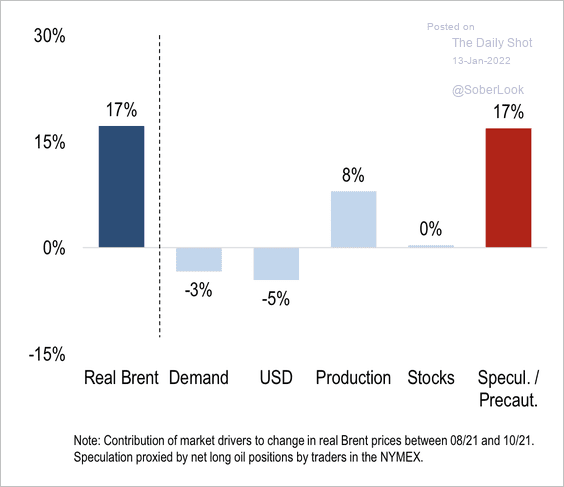 Source: Numera Analytics
——————–
3. The recovery in shale production has been slow.
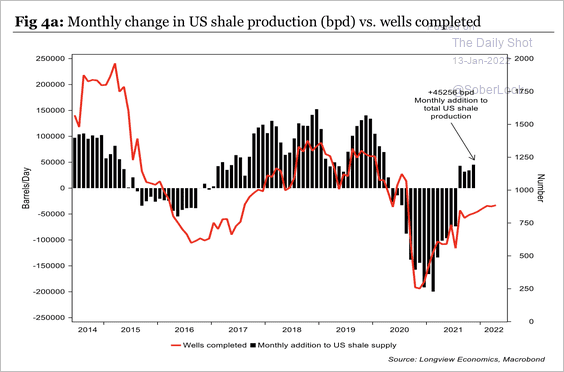 Source: Longview Economics
4. Analysts are watching Mideast rig efficiency. Lower output per rig could make it more challenging for OPEC to meet its quota.
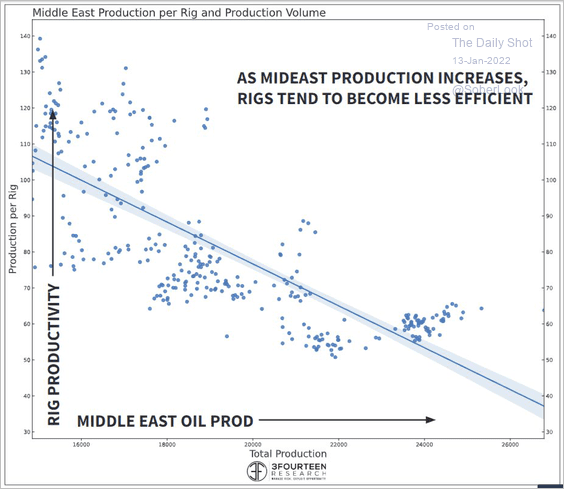 Source: @WarrenPies
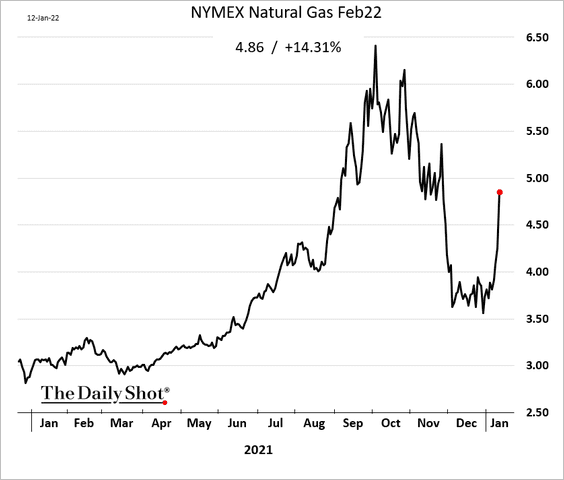
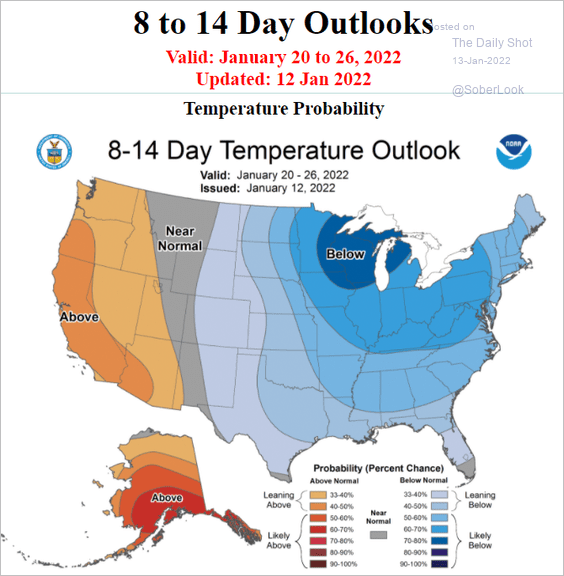
5. US natural gas surged this week.
 Source: NOAA
Back to Index
Equities
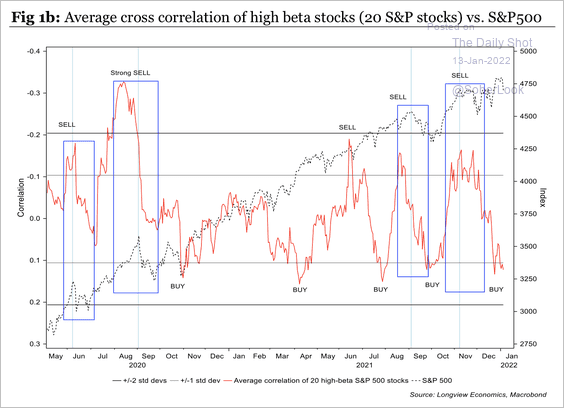
1. The average cross-correlation of high beta S&P 500 stocks has risen over the past few months, which typically precedes a market bounce.
 Source: Longview Economics
2. Here is a look at the past 106 times the Goldman Sachs Investment Strategy Group recommended clients to “stay invested.”
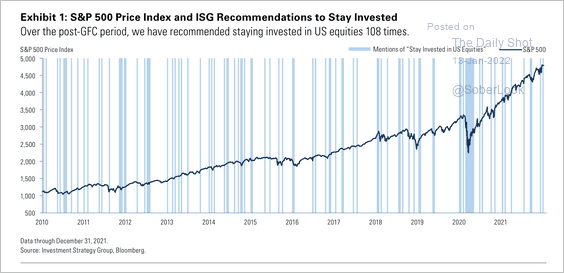 Source: Goldman Sachs
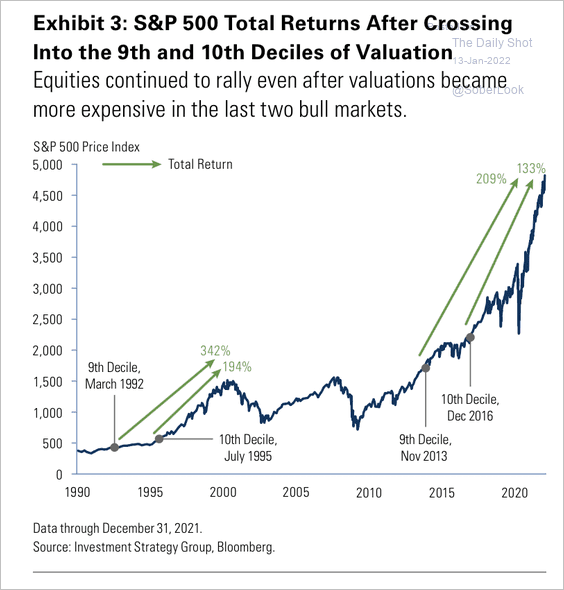
3. US equity valuations are abnormally high, which suggests lower returns going forward (2 charts).
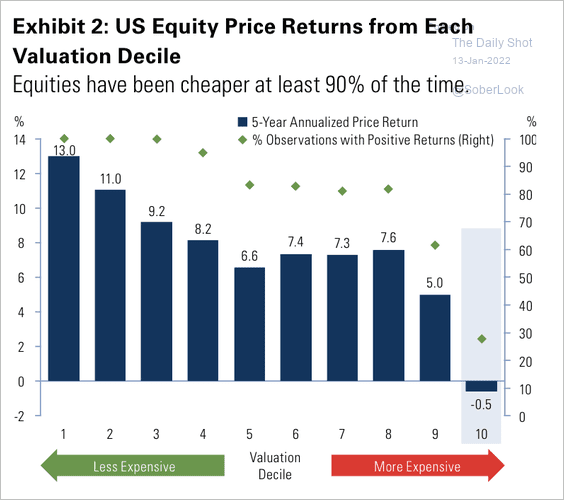 Source: Goldman Sachs
 Source: Goldman Sachs
——————–
4. US corporate margins are much higher than at the start of previous tightening cycles.
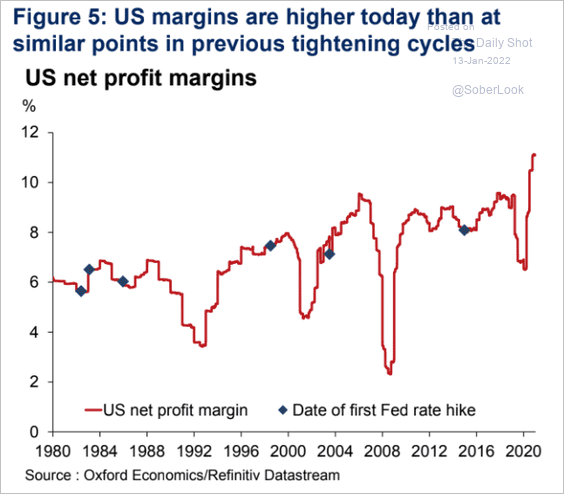 Source: Oxford Economics
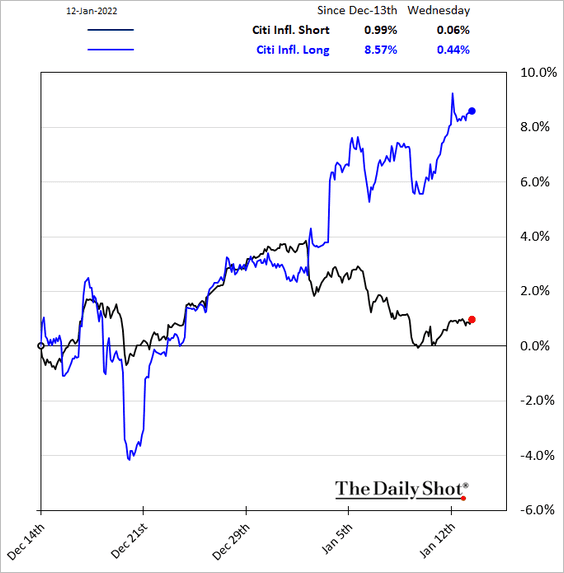
5. Companies that benefit from higher inflation have outperformed sharply this month.
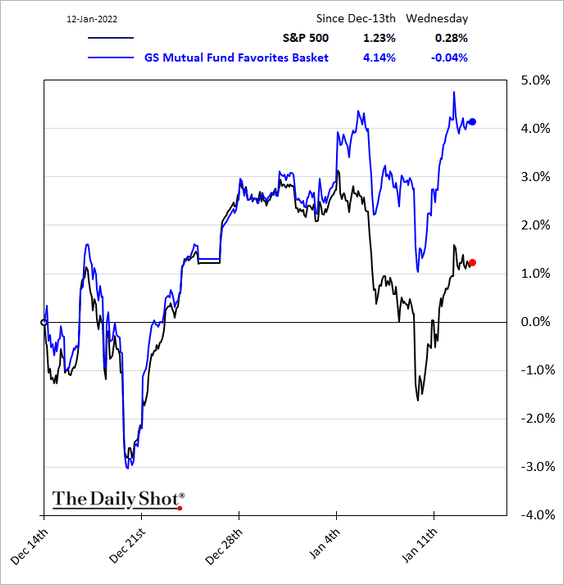
6. While stocks favored by hedge funds have been underperforming, that’s not the case for mutual funds.
7. Most actively-managed US funds underperformed their benchmarks last year.
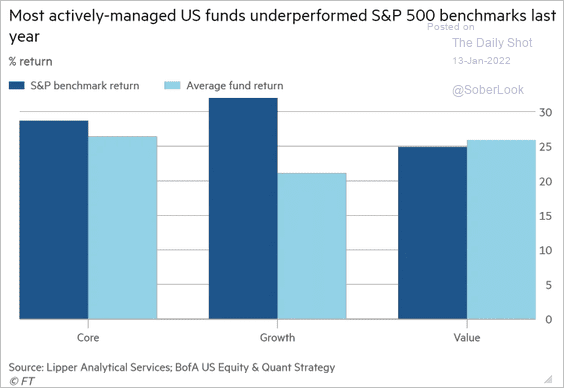 Source: @financialtimes Read full article
Back to Index
Credit
1. Middle-market lending activity surged last year.
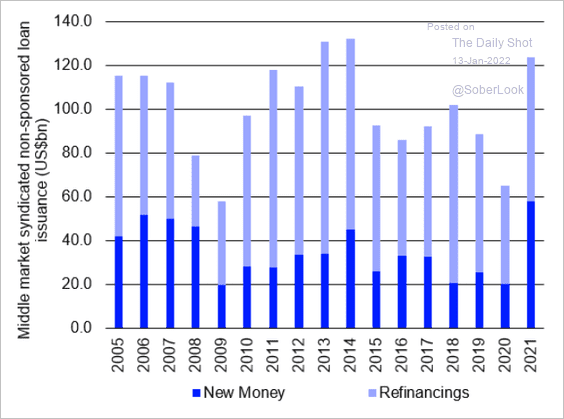 Source: @LPCLoans Read full article
2. Next, we have some data on M&A-related financing (from S&P Global Market Intelligence).
• Leverage (higher than 2007; smaller subordinated/mezz debt):
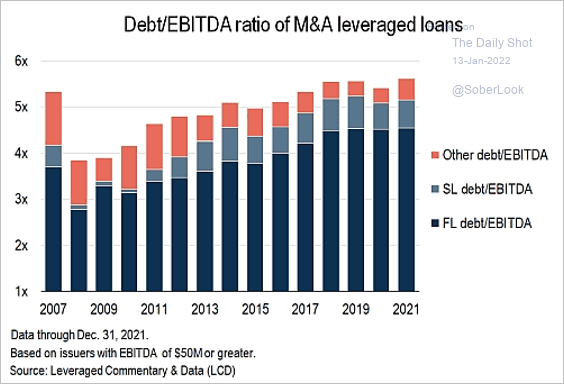 Source: S&P Global Market Intelligence
• Issuer ratings (worse than 2007, although fewer unrated deals):
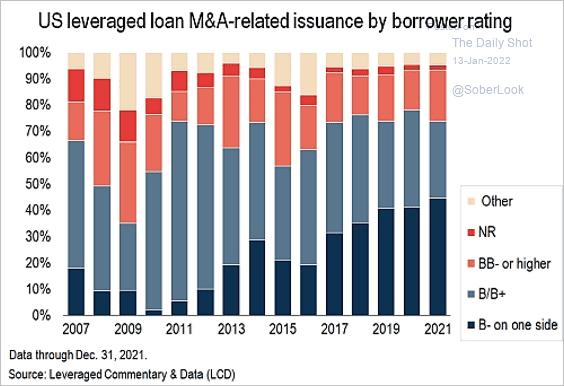 Source: S&P Global Market Intelligence
• Leverage distribution (worse than 2007):
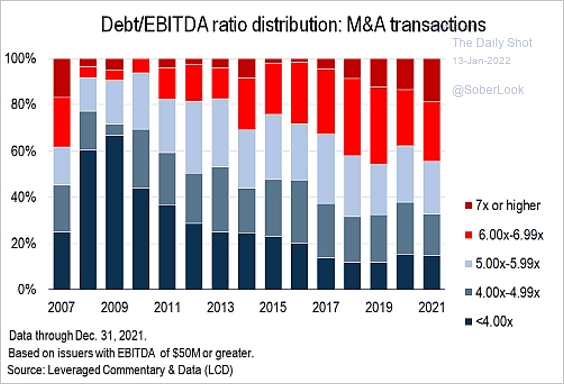 Source: S&P Global Market Intelligence
——————–
3. This chart shows yield by asset classes globally.
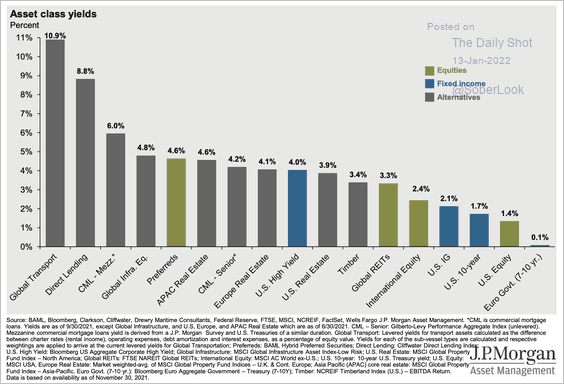 Source: J.P. Morgan Asset Management
Back to Index
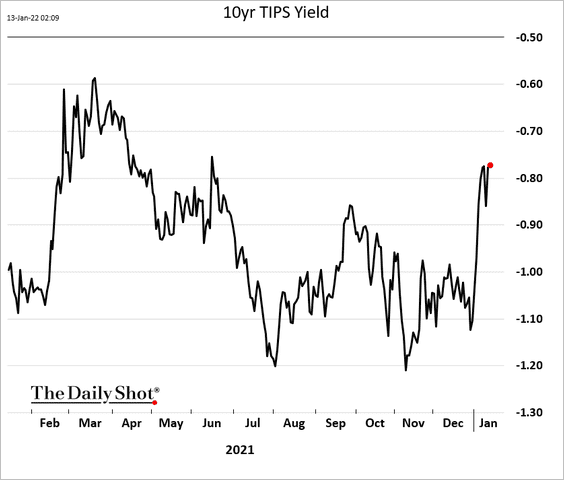
Rates
The recent increase in US real yields (TIPS yield) is holding.
Back to Index
Global Developments
1. The US dollar broke to the downside.
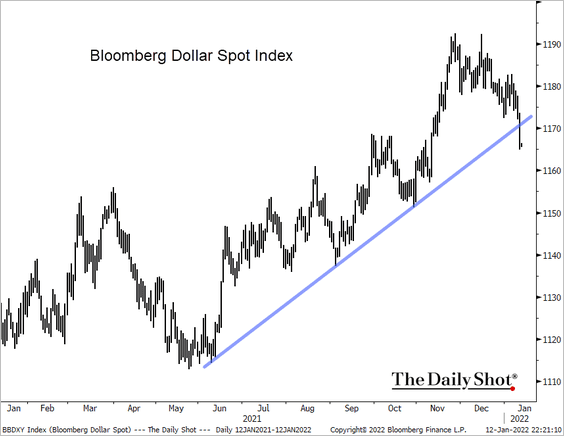 Source: @TheTerminal, Bloomberg Finance L.P.
2. This chart shows the US dollar’s reserve status (nations holding dollars in their F/X reserves).
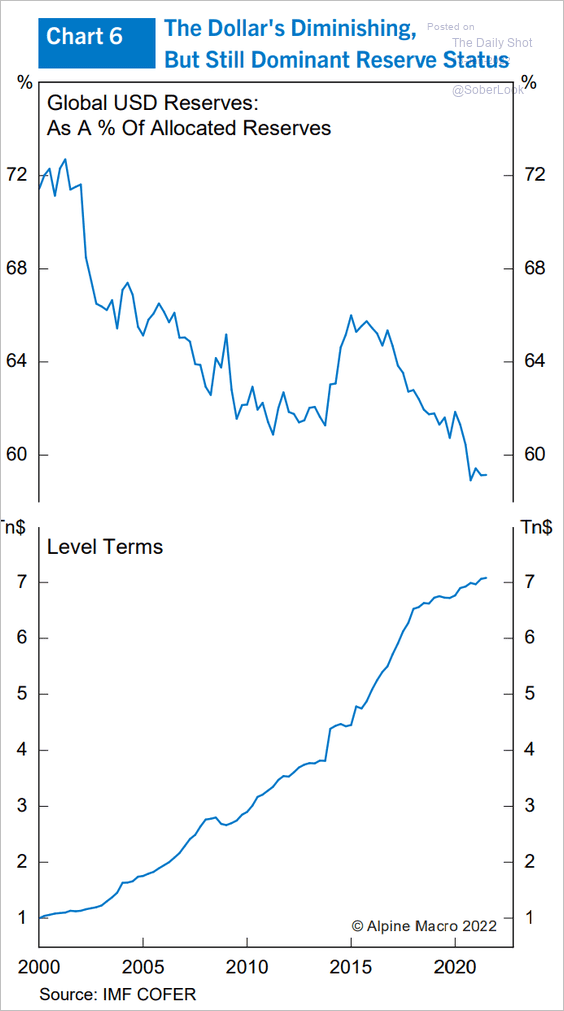 Source: Alpine Macro
3. Who were the economic winners and losers of the pandemic?
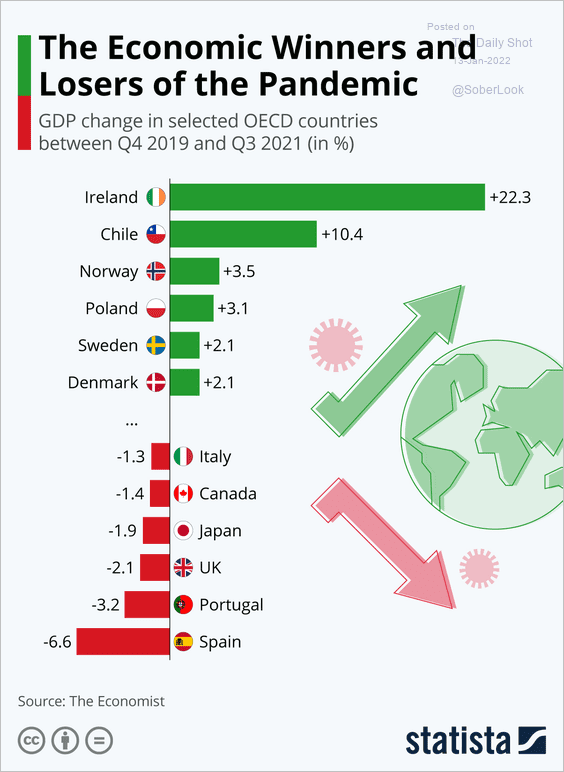 Source: Statista
4. Home prices are surging around the world.
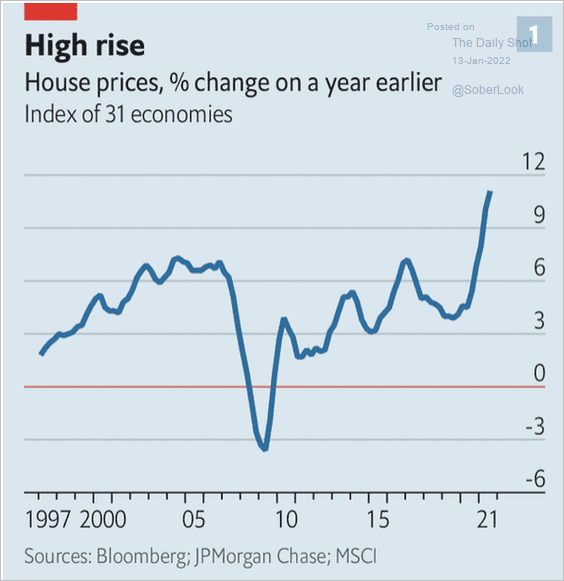 Source: The Economist Read full article
5. Finally, we have inflation rates across the OECD.
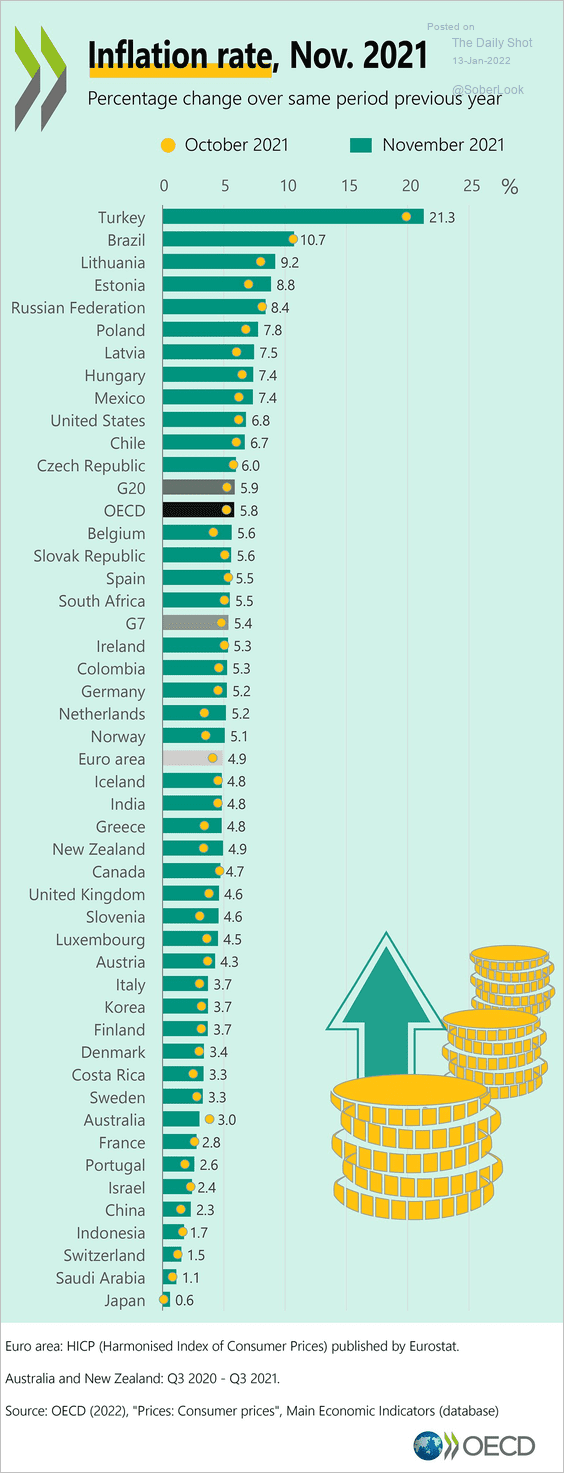 Source: @OECD_Stat Read full article
——————–
Food for Thought
1. How US households are using their child tax credits:
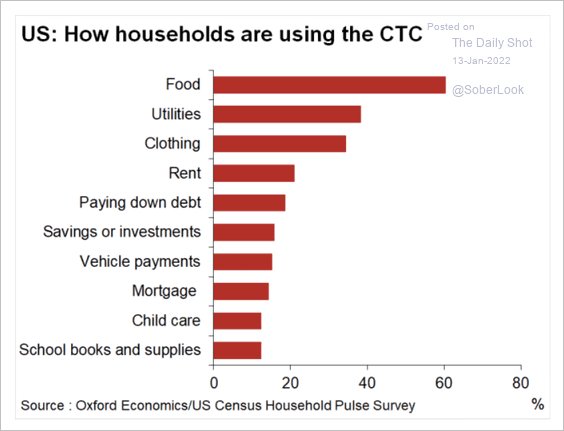 Source: Oxford Economics
2. Making room for home office:
 Source: @WSJ Read full article
3. Online sports betting demographics:
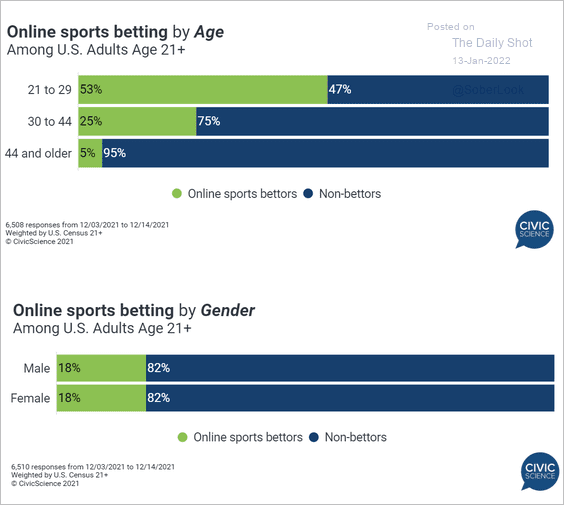 Source: @CivicScience Read full article
• Sports betting wager size and favorite websites:
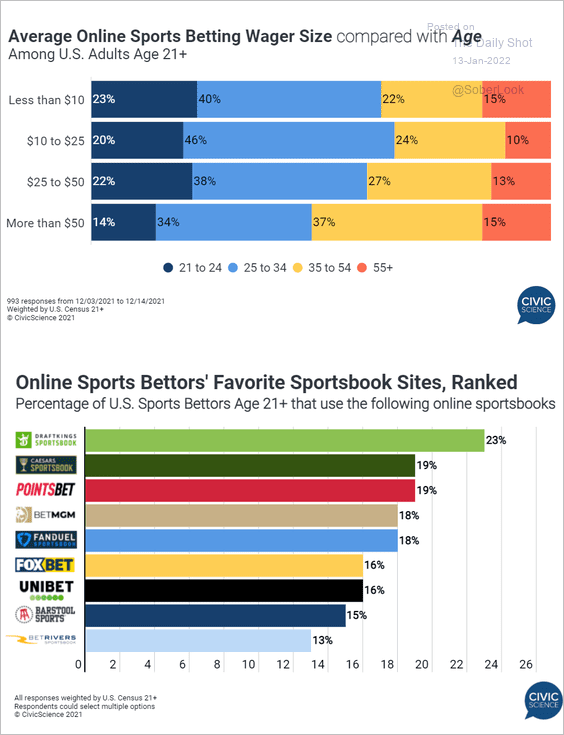 Source: @CivicScience Read full article
——————–
4. Mean and median bank account balance by age category:
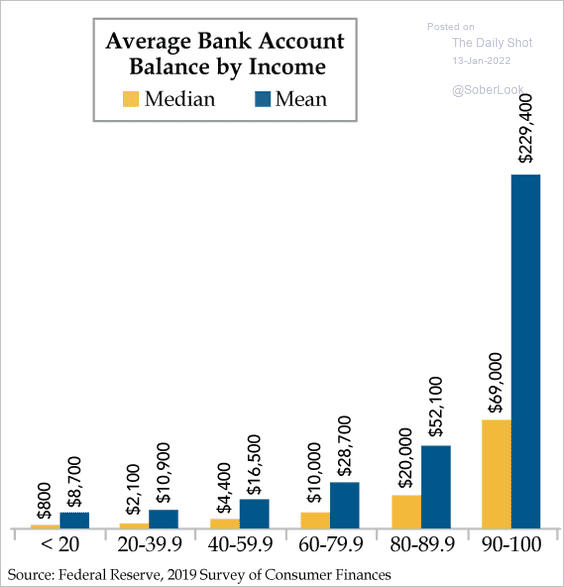 Source: The Daily Feather
5. Academic degrees of unicorn founders:
 Source: Ilya Strebulaev Read full article
6. Public sector corruption:
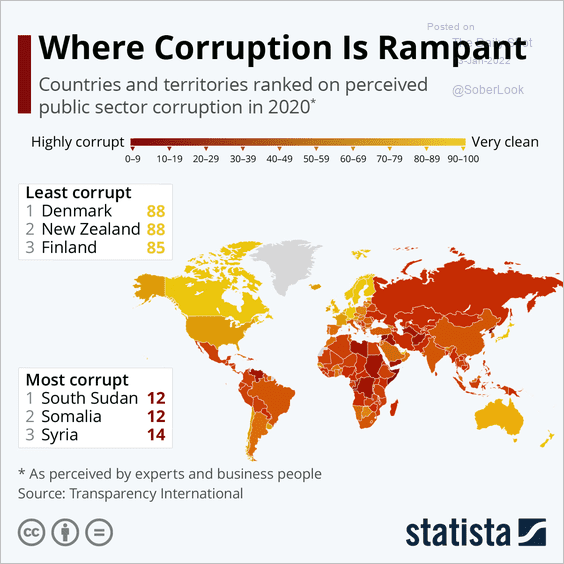 Source: Statista
7. Shift to legal cannabis in Canada:
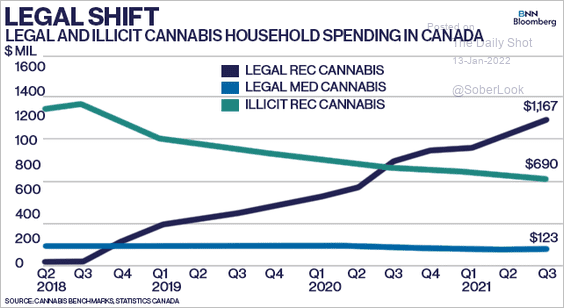 Source: @BNNBloomberg Read full article
8. Accelerating glacial melt:
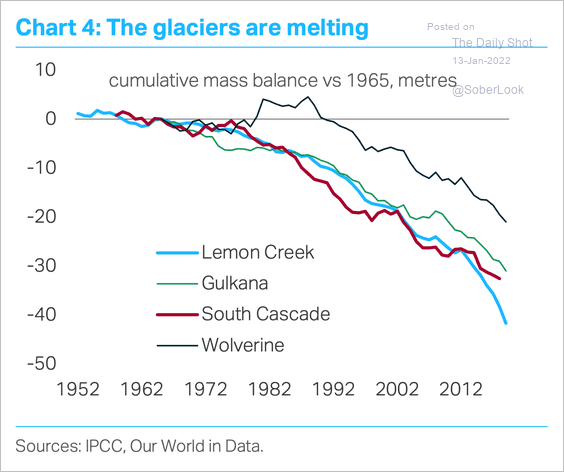 Source: TS Lombard
9. Most commonly spoken language aside from Spanish and English:
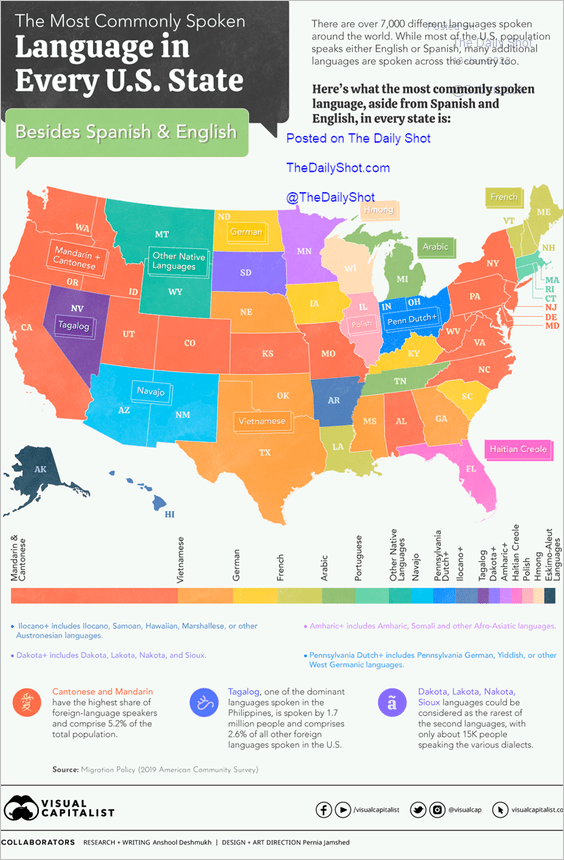 Source: Visual Capitalist Read full article
——————–
Back to Index