
The Daily Shot: 14-Jan-22
• The United States
• Canada
• The Eurozone
• Europe
• Asia – Pacific
• China
• Emerging Markets
• Cryptocurrency
• Commodities
• Energy
• Equities
• Rates
• Global Developments
• Food for Thought
The United States
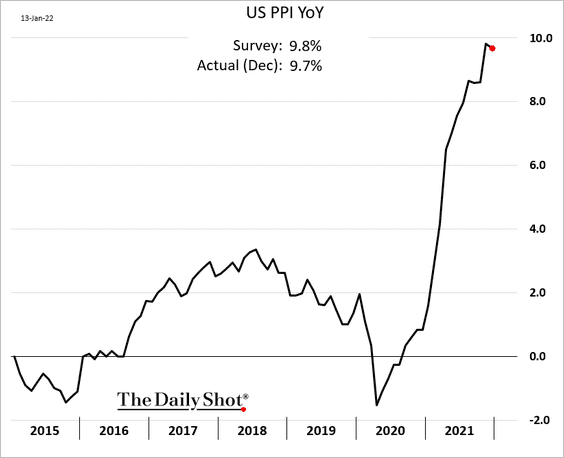
1. Let’s begin with some updates on inflation.
• The PPI report was mixed, with the headline figure ticking lower on a year-over-year basis (just below 10%).
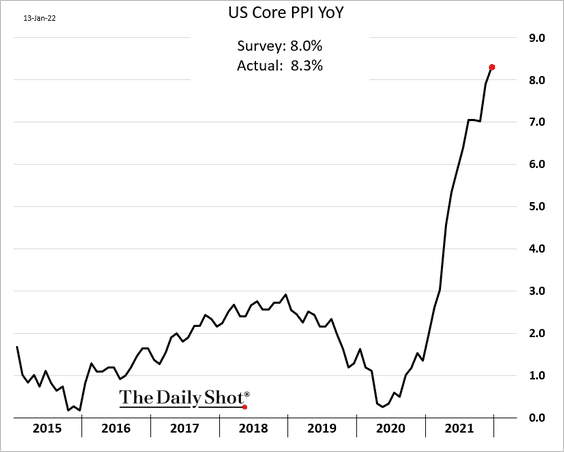
– The core PPI hit a new high.
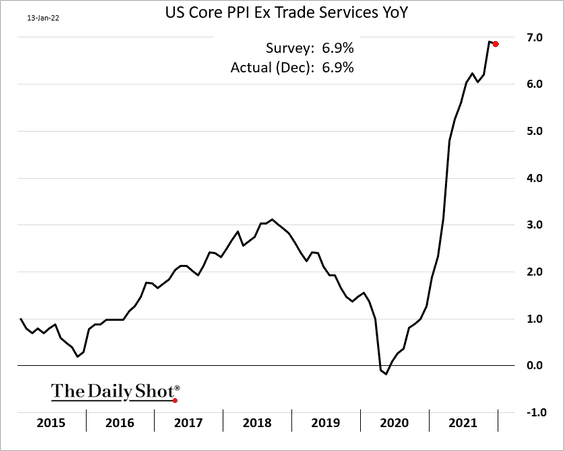
But the core PPI excluding trade services (business markups) seems to have leveled off.
– Unprocessed wholesale goods prices declined in December, suggesting that upstream cost pressures are starting to ease.
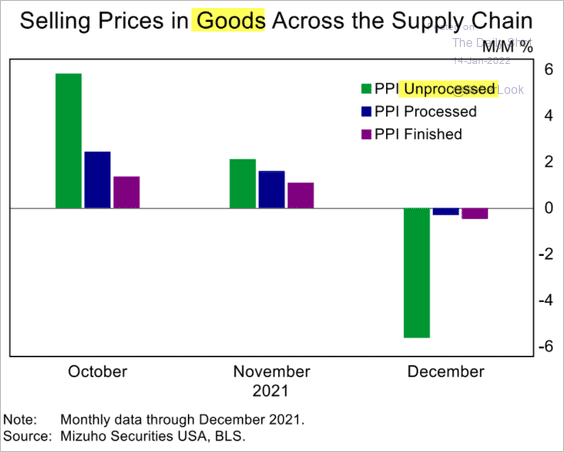 Source: Mizuho Securities USA
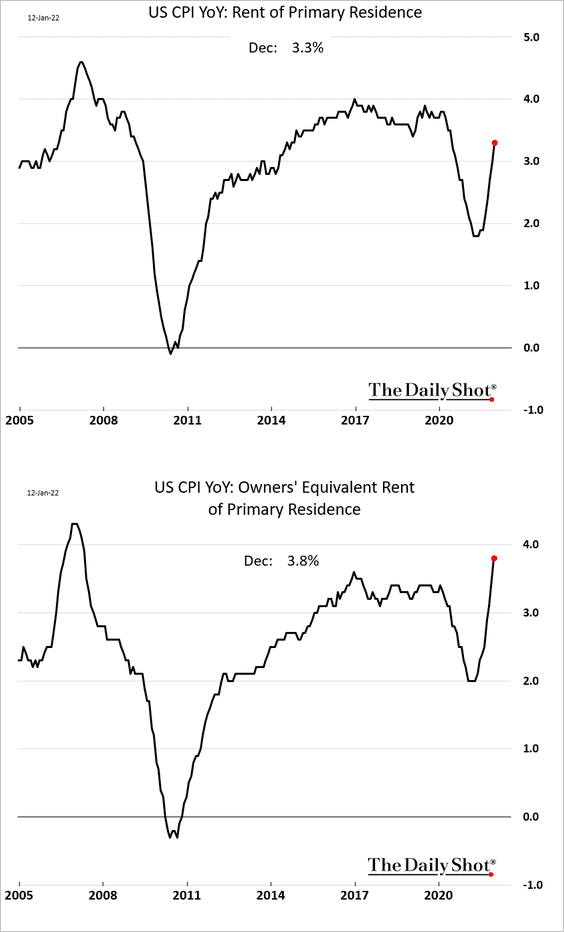
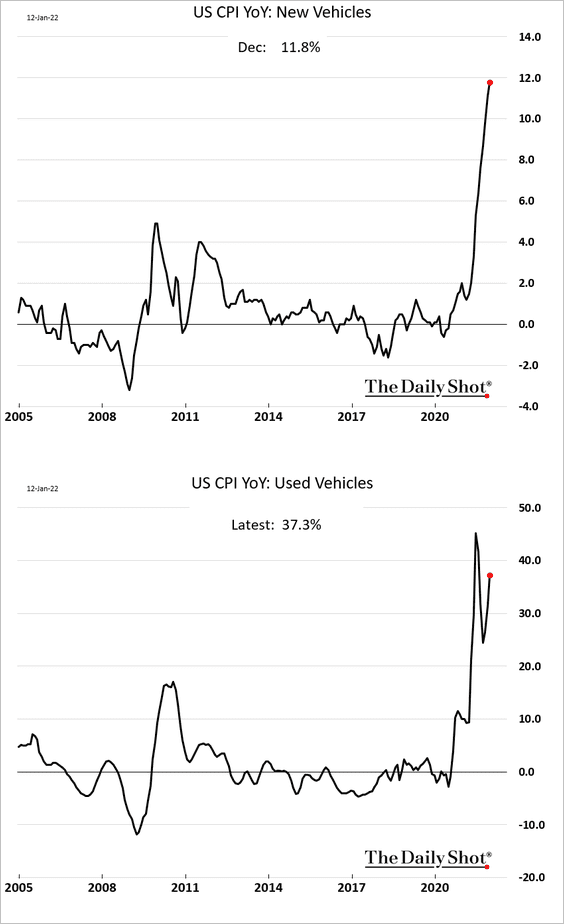
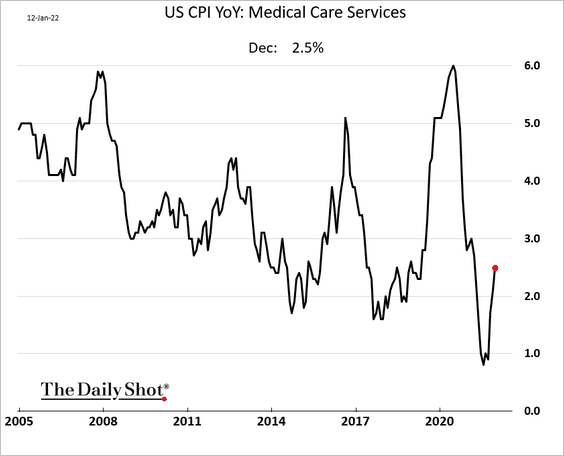
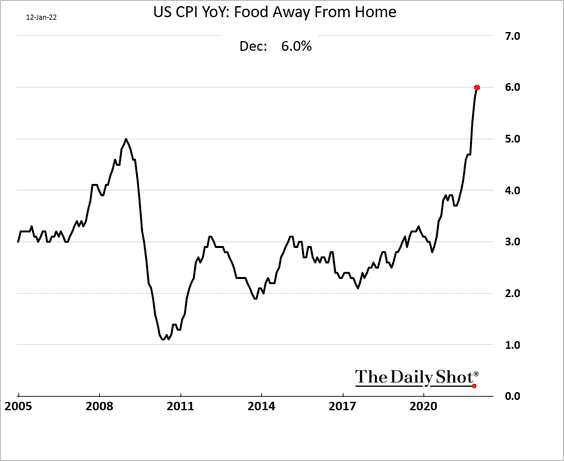
• Next, we have a select set of CPI trends (through December).
– Shelter:
– Vehicles:
– Medical care services:
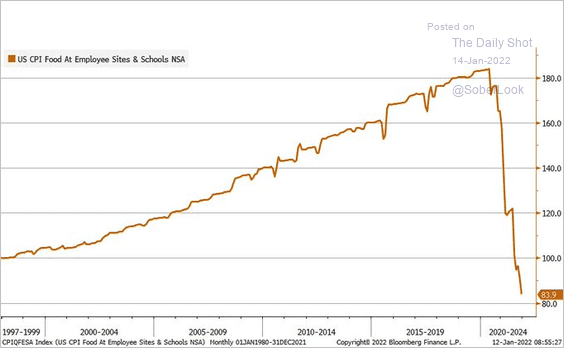
– Food away from home:
By the way, this chart shows the price index of food at employee sites and schools.
 Source: @LizAnnSonders
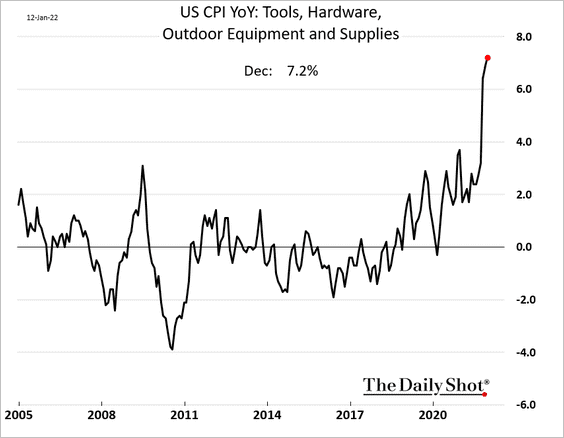
– Hardware:
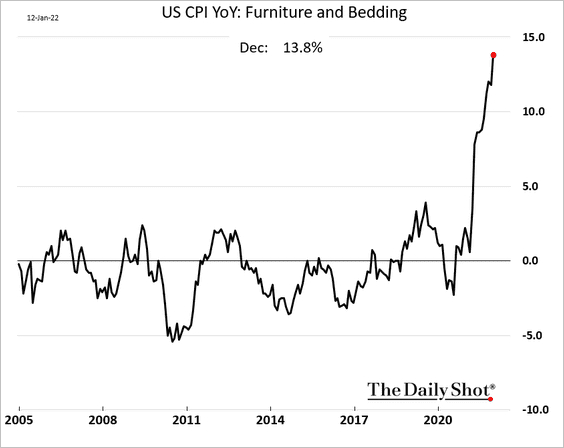
– Furniture:
• Owners’ equivalent rent (OER) inflation is expected to keep climbing.
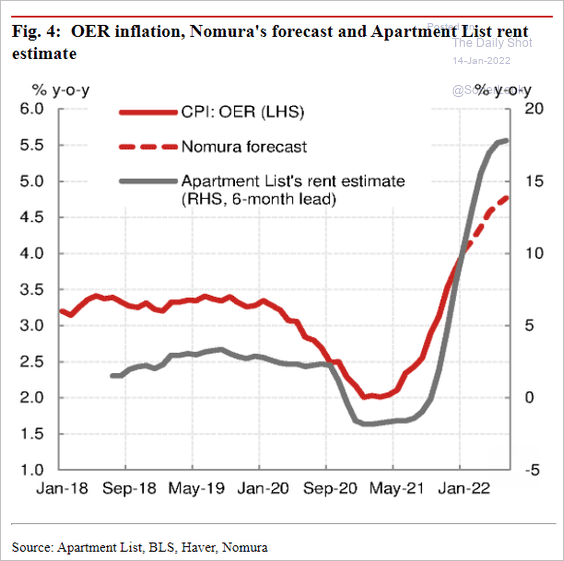 Source: Nomura Securities
OER price gains are coming from both large and small cities.
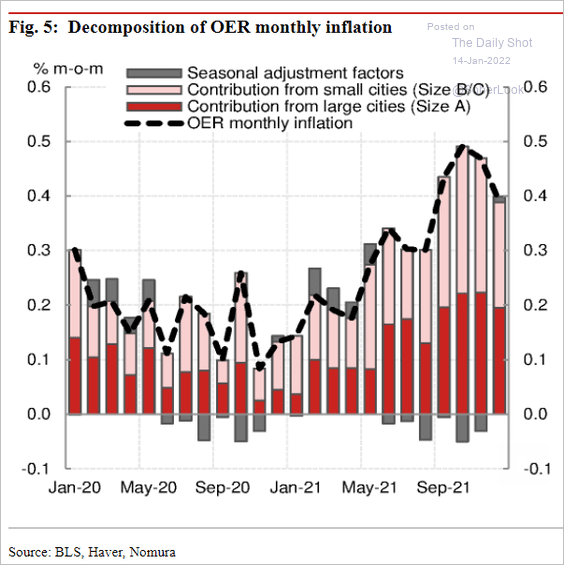 Source: Nomura Securities
• PCE inflation is yet to peak, according to Wells Fargo Securities. And even after consumer inflation moderates over the next couple of years, it is expected to hold above the Fed’s target.
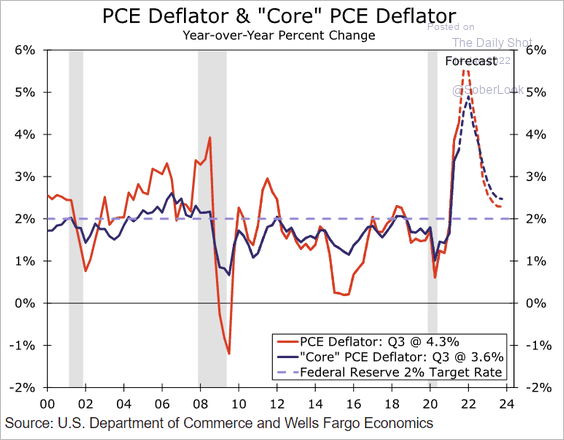 Source: Wells Fargo Securities
• For years, prices charged for products on the internet have been falling. That trend ended with the pandemic.
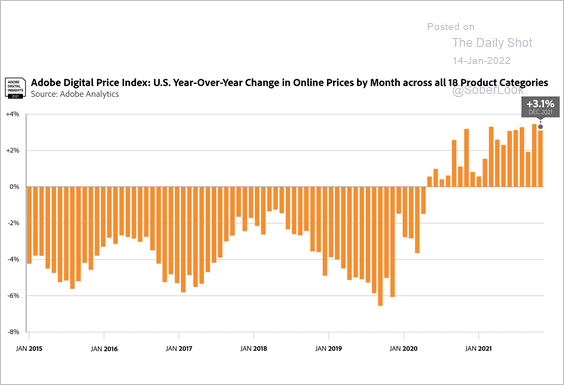 Source: Adobe Digital Price Index
——————–
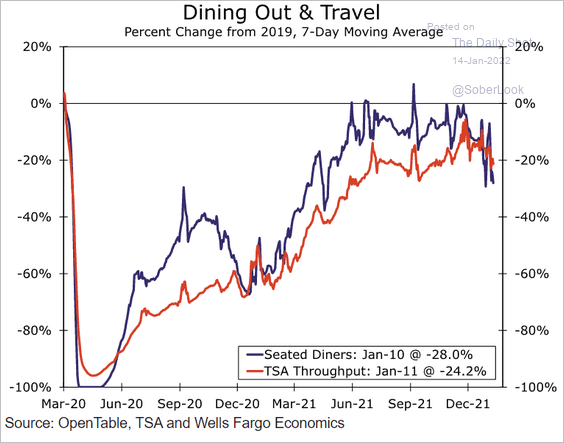
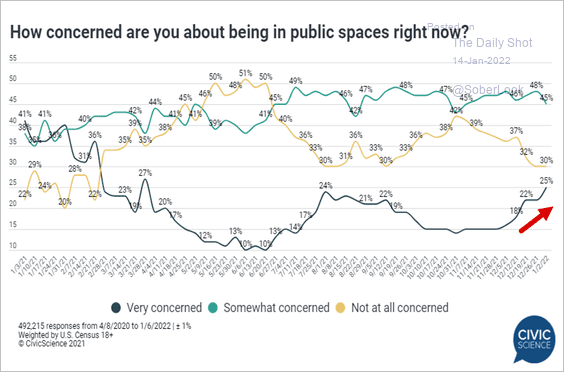
2. Initial jobless claims jumped at the start of the year …
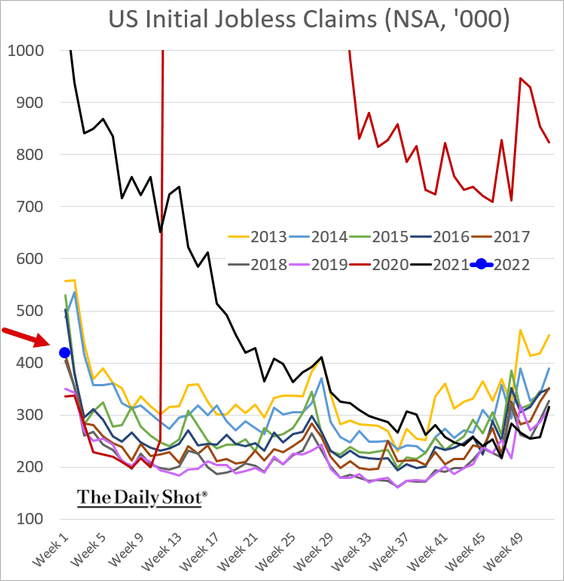
… as mobility weakens (2 charts).
 Source: Wells Fargo Securities
 Source: @CivicScience
——————–
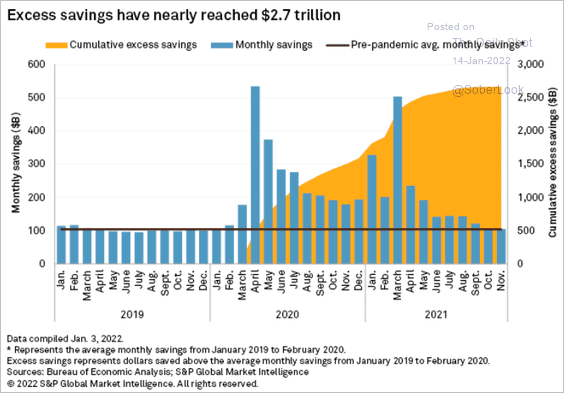
3. US excess savings have leveled off at nearly $2.7 trillion.
 Source: S&P Global Market Intelligence
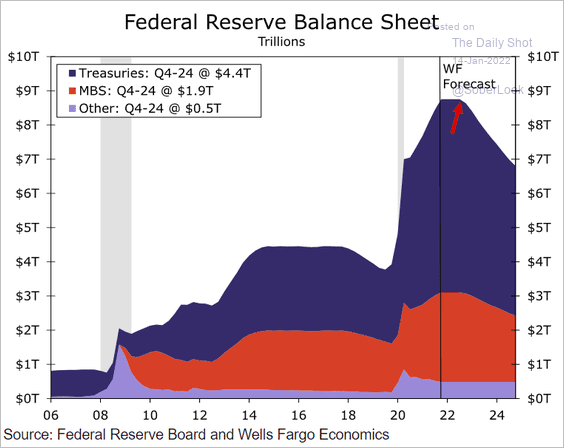
4. Wells Fargo expects the Fed’s balance sheet runoff to start in the fourth quarter of this year.
 Source: Wells Fargo Securities
Here is Deutsche Bank’s forecast for the Fed’s balance sheet as a percentage of GDP.
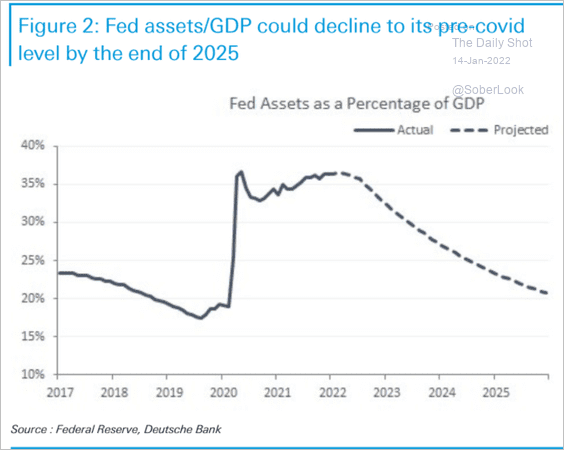 Source: Deutsche Bank Research
——————–
5. Mortgage rates continue to climb, …
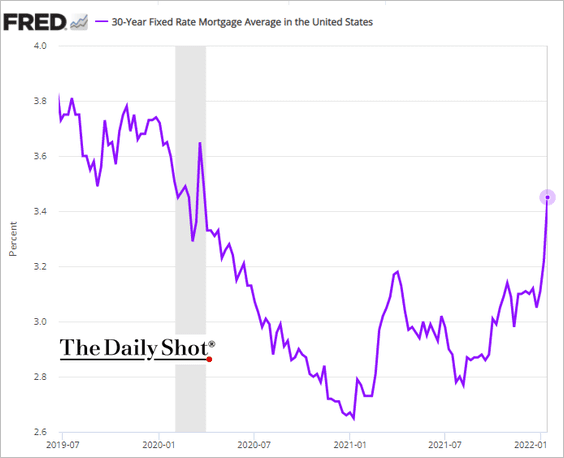
… which will depress loan refinancing activity (chart shows fewer mortgages that are worth refinancing).
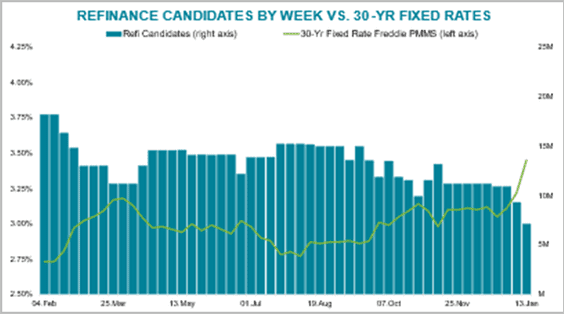 Source: Black Knight Technologies
——————–
6. US state and local tax receipts have been going to benefit payments rather than investment.
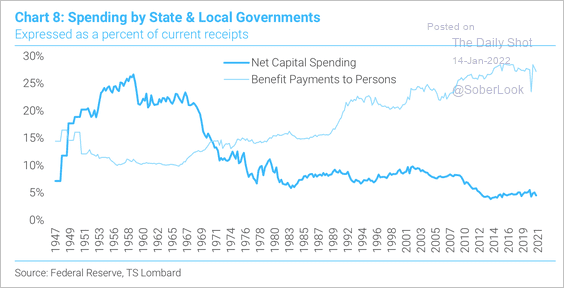 Source: TS Lombard
Back to Index
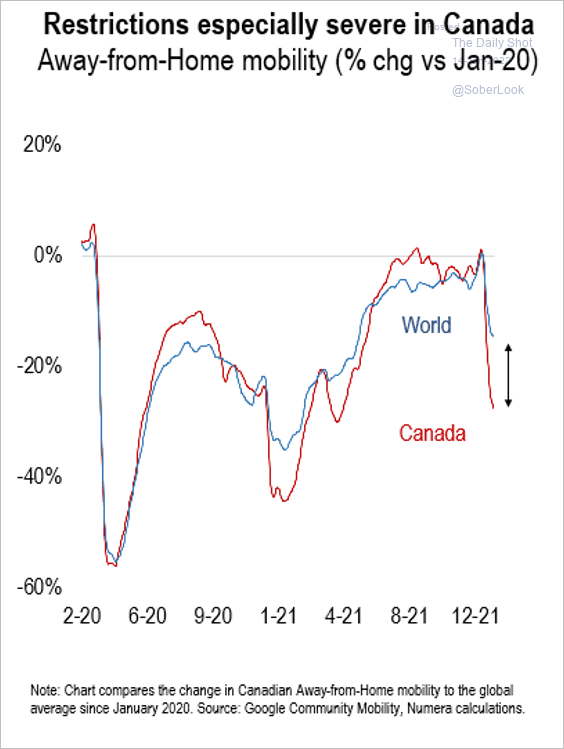
Canada
Mobility has been deteriorating faster than in the rest of the world.
 Source: Numera Analytics
Back to Index
The Eurozone
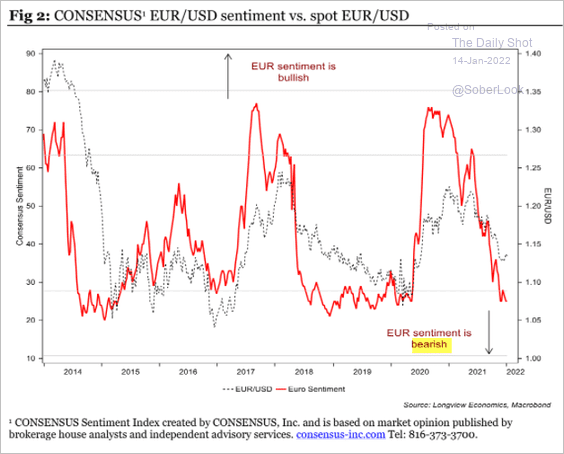
1. The euro has broken above its 50-day moving average.
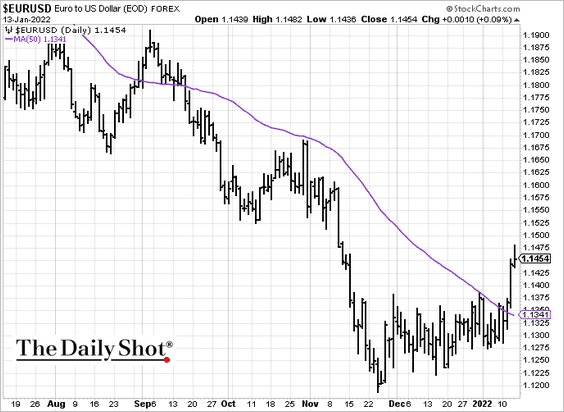
Sentiment on the euro has been soft, and we could see further short-covering.
 Source: Longview Economics
——————–
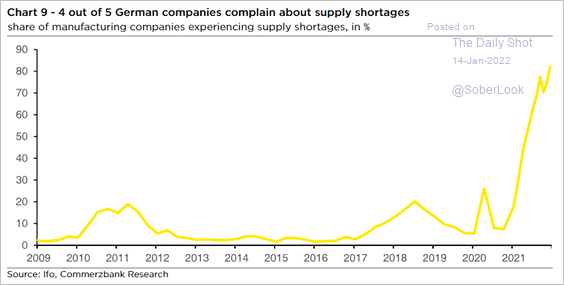
2. Supply shortages in Germany remain acute.
 Source: Commerzbank Research
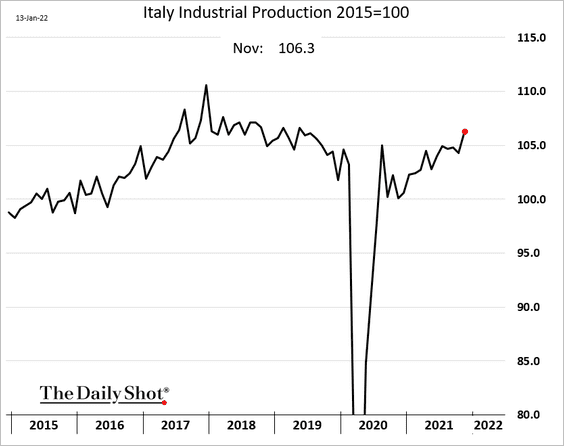
3. Italy’s industrial production surged in November.
But the retail sector has been hit by deteriorating mobility over the past few weeks.
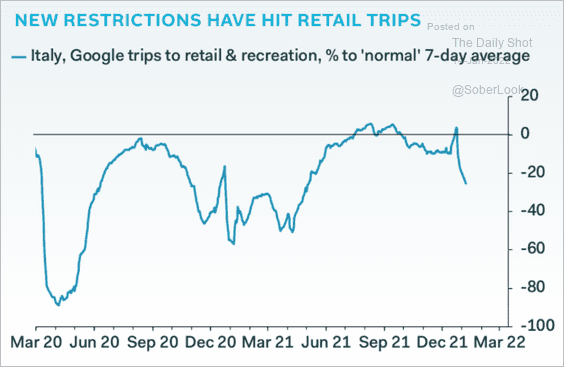 Source: Pantheon Macroeconomics
Back to Index
Europe
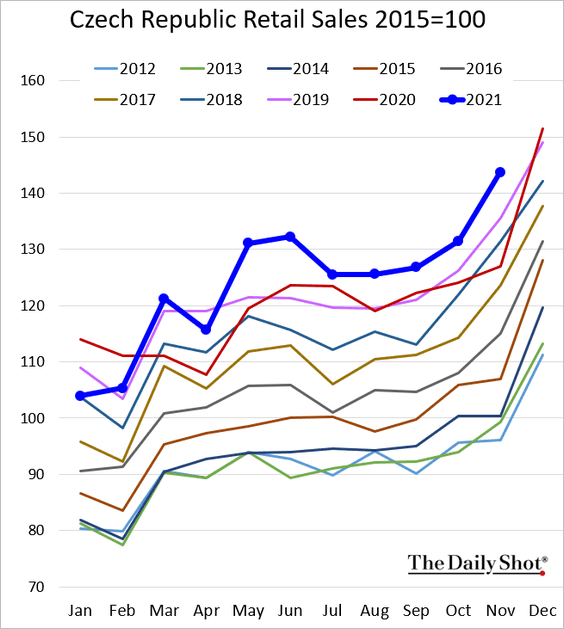
1. Czech retail sales have been holding well above 2019 levels.
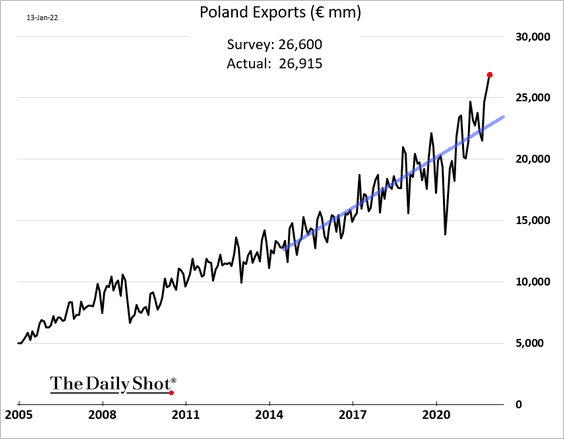
2. Poland’s exports hit a record high.
3. This chart shows employment and labor market slack in the EU.
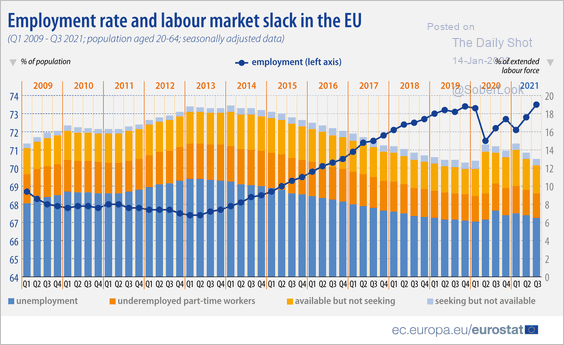 Source: Eurostat Read full article
Back to Index
Asia – Pacific
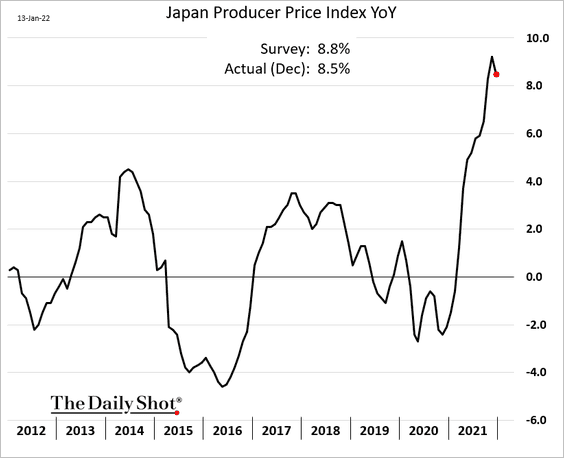
1. Japan’s PPI appears to have peaked.
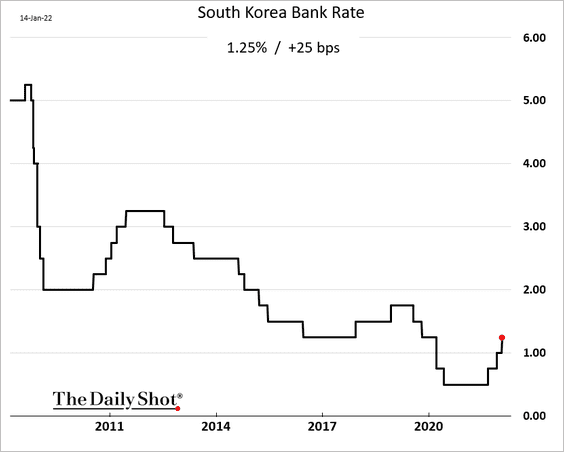
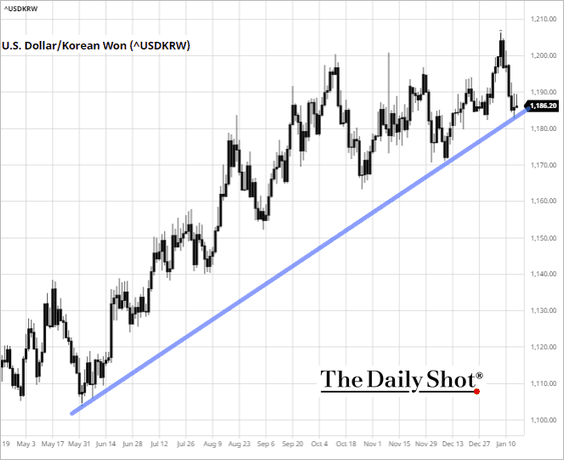
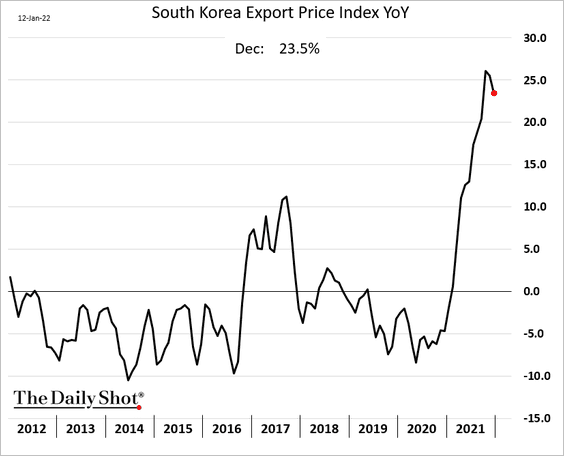
2. Next, we have some updates on South Korea.
• The central bank hiked rates as expected.
• Inflation has been elevated and is yet to peak.
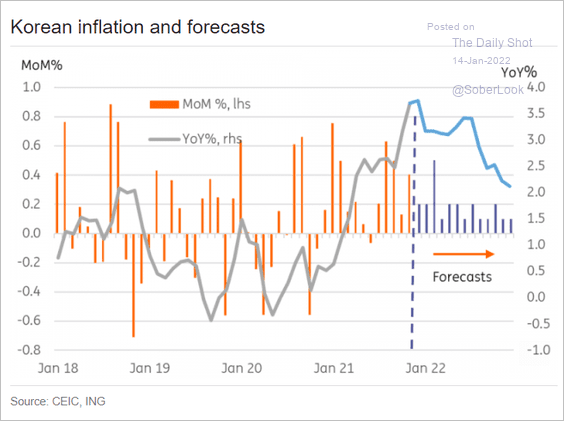 Source: ING
• The won is struggling to rebound as USD/KRW hits support.
• Export price gains appear to have peaked.
——————–
3. Australia’s housing credit growth remains exceptionally strong.
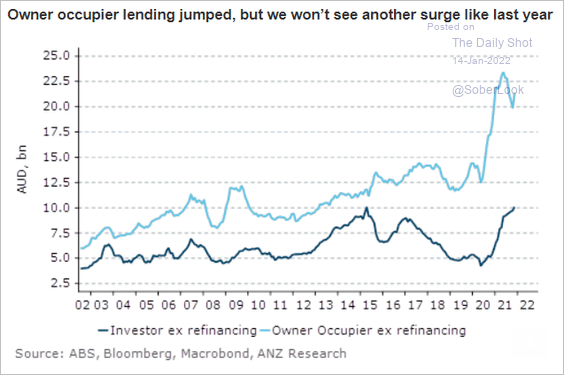 Source: ANZ Research
Home prices continue to climb.
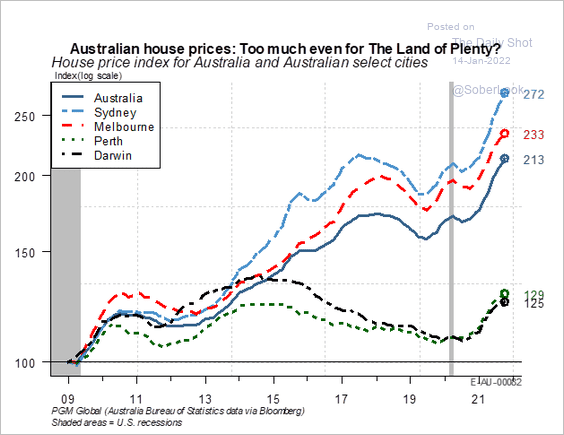 Source: PGM Global
Back to Index
China
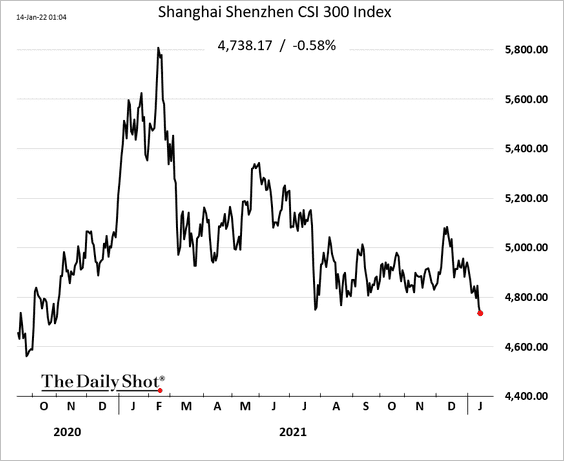
1. China’s benchmark stock index hit the lowest level since November of 2020.
2. The renminbi is pushing toward multi-year highs against the dollar.
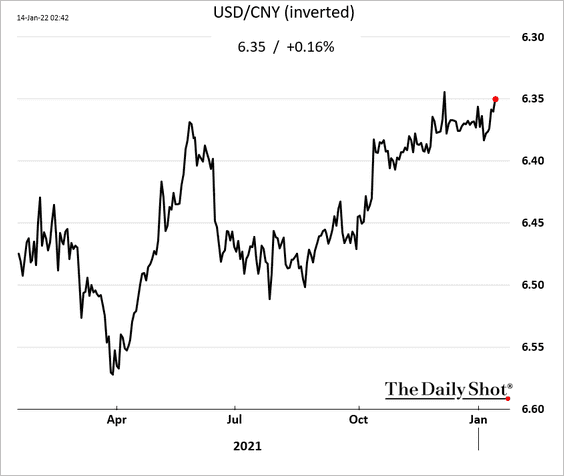
But Capital Economics expects the tightening China-US rate differential to put downward pressure on the currency.
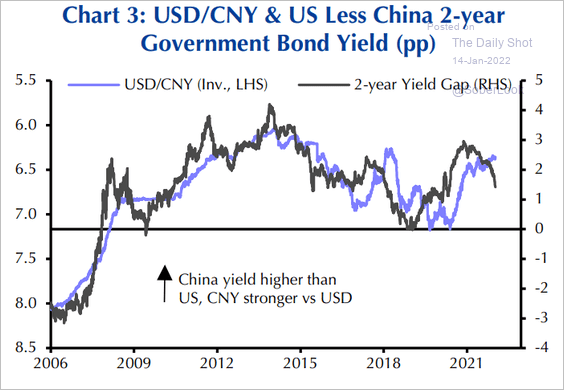 Source: Capital Economics
——————–
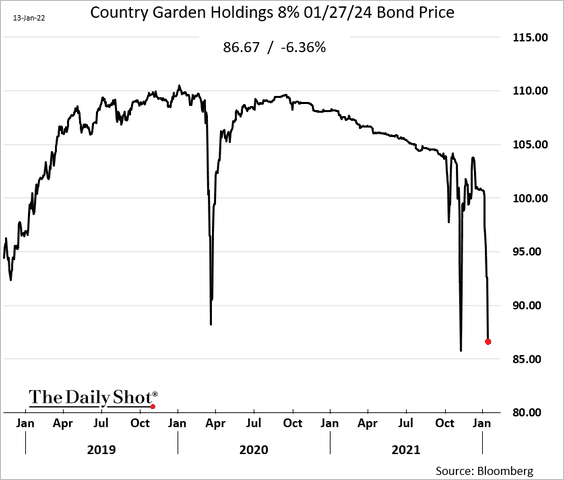
3. Country Garden is an investment-grade builder in China. Even some companies that are not excessively leveraged are spooking investors. Country Garden’s share price and bonds are tumbling.
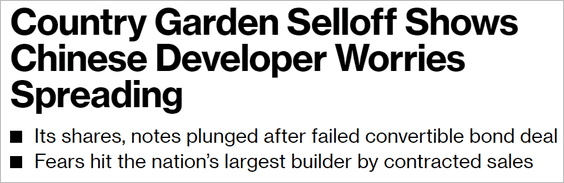
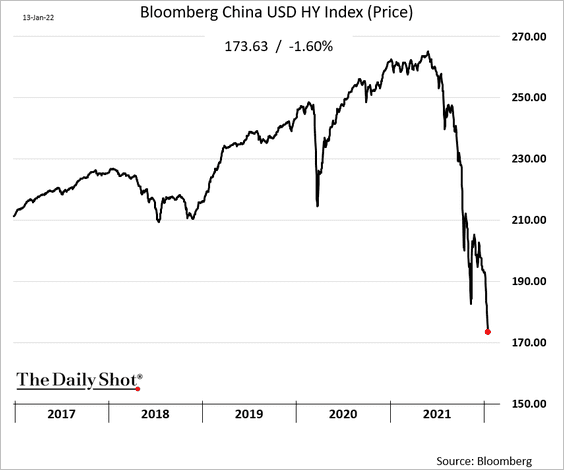
The index of dollar-denominated high-yield bonds continues to hit multi-year lows.
——————–
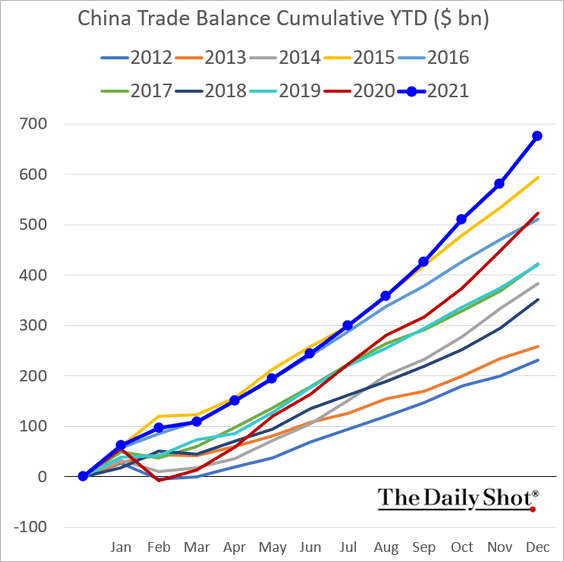
4. China’s exports hit a record high …
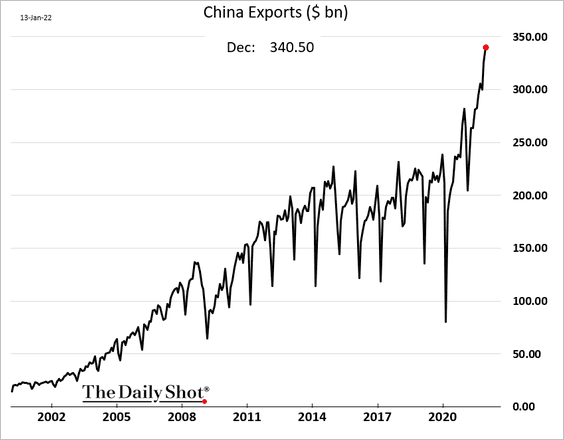
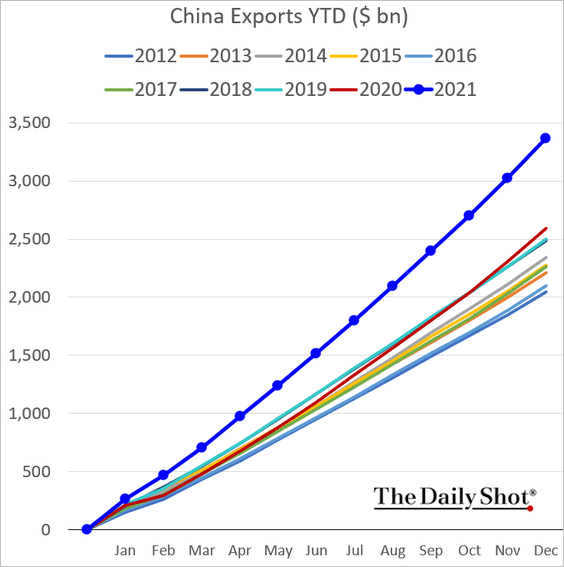
… and so has the trade surplus.
By the way, the spread between China’s reported exports to the US and the US-reported imports from China has flipped signs since the start of the pandemic.
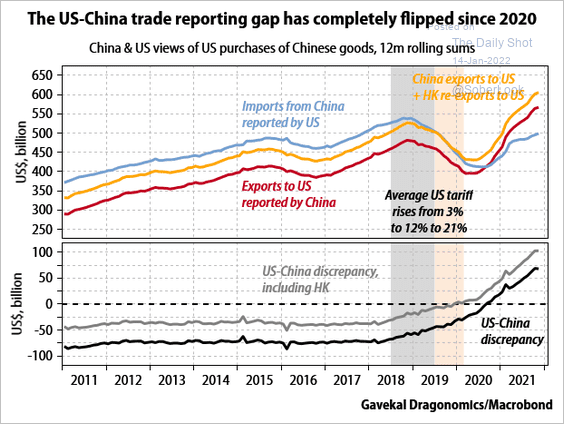 Source: Gavekal Research
——————–
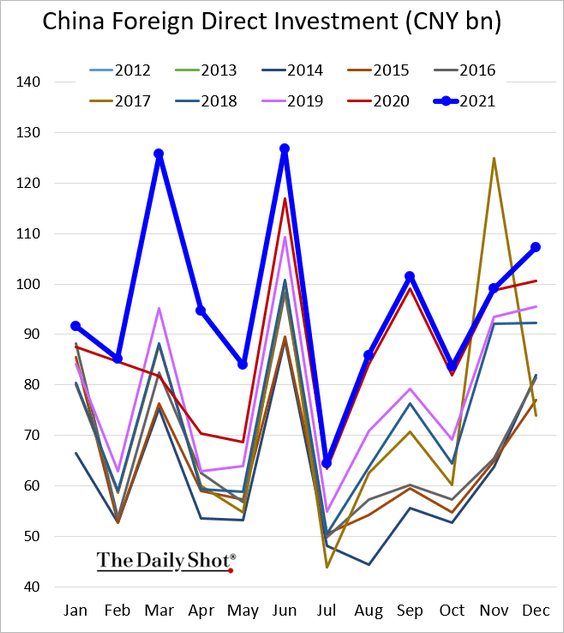
5. Foreign direct investment was strong in December.
This chart shows VC investments in China.
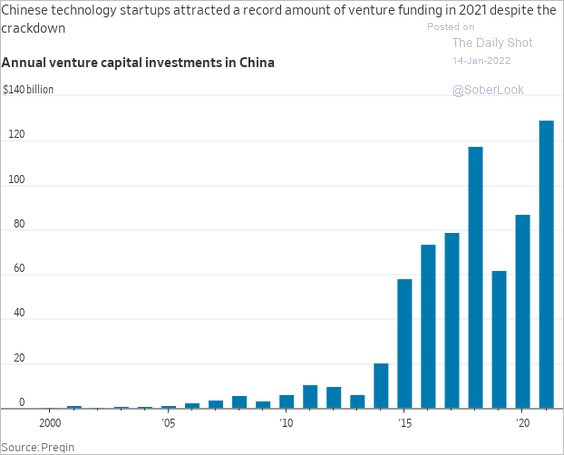 Source: @WSJ Read full article
Back to Index
Emerging Markets
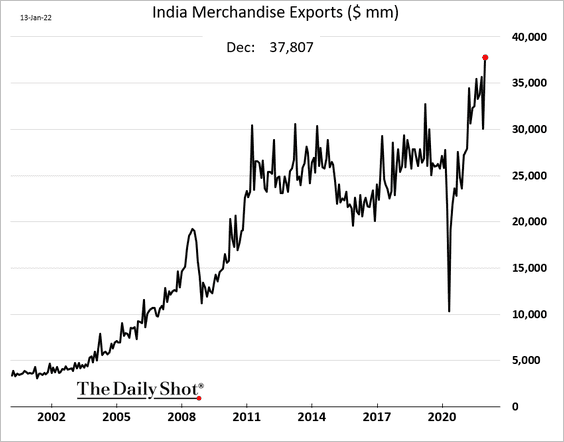
1. India’s exports hit a new high.
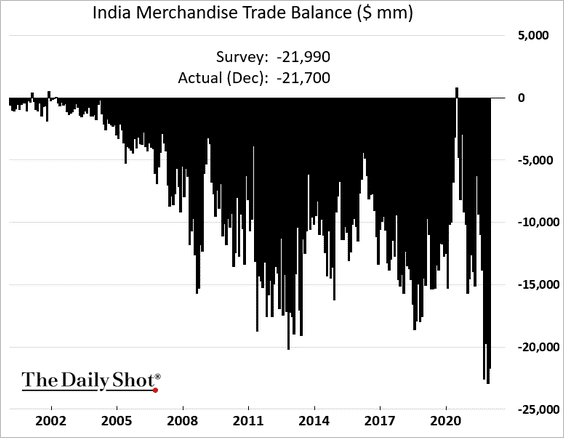
But the trade deficit remains near record levels amid elevated fuel prices.
——————–
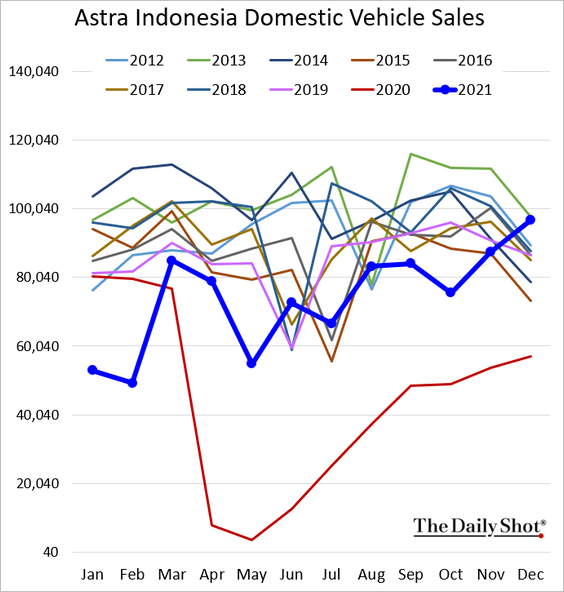
2. Indonesia’s vehicle sales have rebounded.
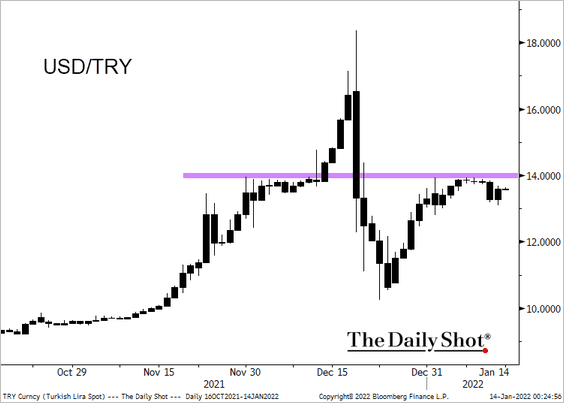
3. USD/TRY continues to test resistance at 14 to the dollar as the lira remains under pressure.
 Source: @TheTerminal, Bloomberg Finance L.P.
• Barclays expects Turkish CPI to peak at 50% year-over-year in June.
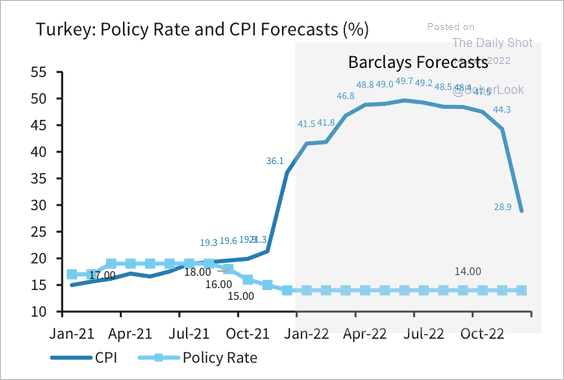 Source: Barclays Research
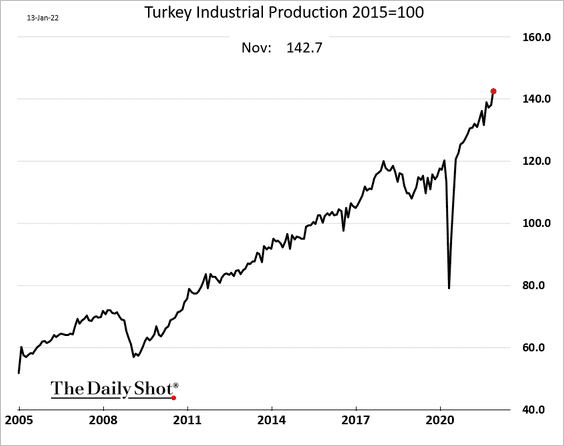
• Industrial production continues to climb.
——————–
4. EEM, the largest broad EM ETF is testing resistance.
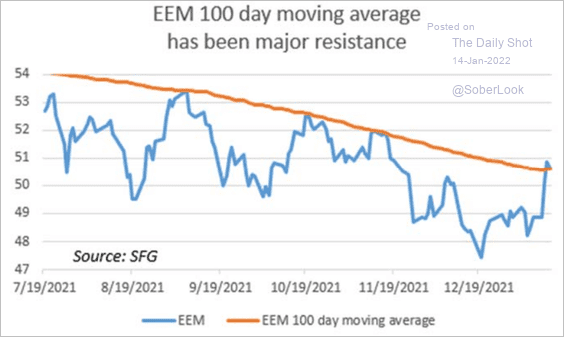 Source: Chris Murphy, Susquehanna International Group
5. Finally, we have the real effective change in EM currencies since 2013.
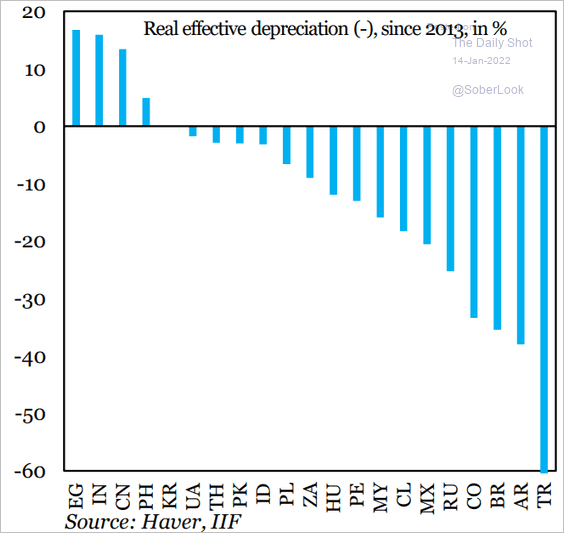 Source: IIF
Back to Index
Cryptocurrency
1. The front end of the bitcoin option volatility curve continues to decline. Some traders have been taking profits on calls around the $44K BTC spot level.
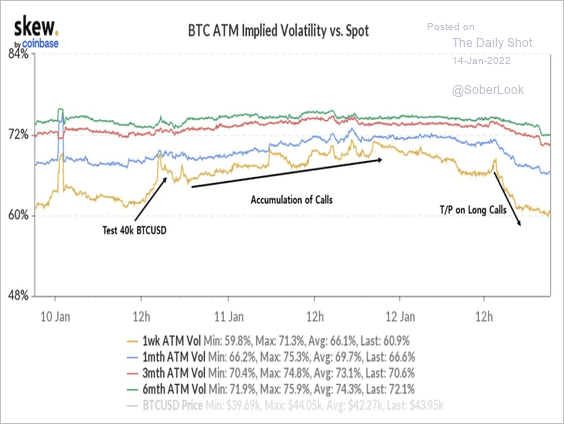 Source: Skew Read full article
2. Bitcoin’s average funding rate, or the cost of holding positions in perpetual futures, is slightly negative. If that persists, it could signal that BTC sellers will start to exit positions.
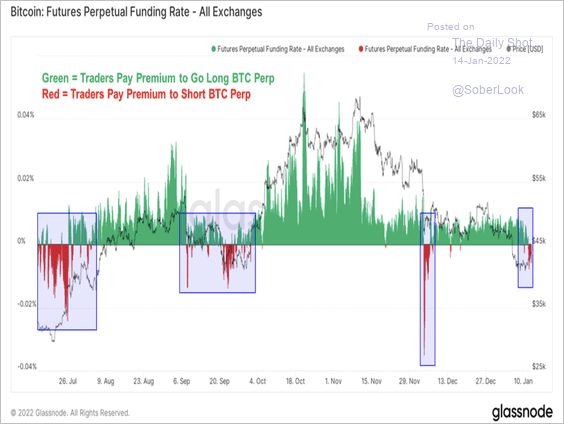 Source: @glassnode
3. The government of Pakistan wants to ban the use of cryptocurrencies.
 Source: CoinDesk Read full article
4. Virtual luxury homes anyone? It will cost you.
 Source: @jessefelder; CNBC Read full article
Back to Index
Commodities
1. Aluminum inventories are below the 5-year range.
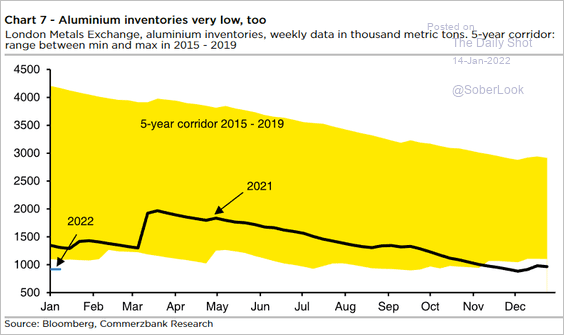 Source: Commerzbank Research
2. Industrial metals have been outperforming precious metals since mid-2020.
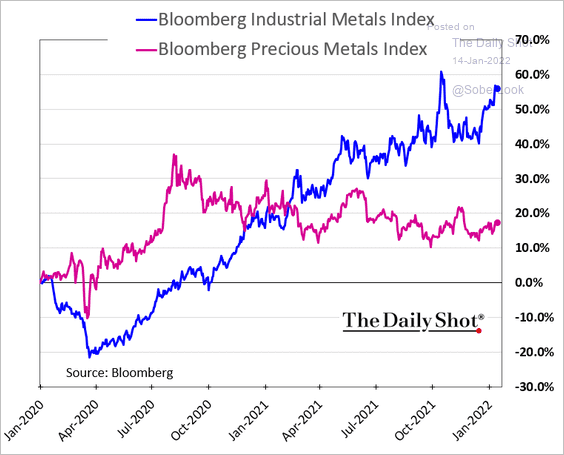 h/t @helloiamyvonne
Back to Index
Energy
1. Rising oil prices could be a drag on global liquidity as more capital is needed to fund the same amount of inventory, according to Gavekal.
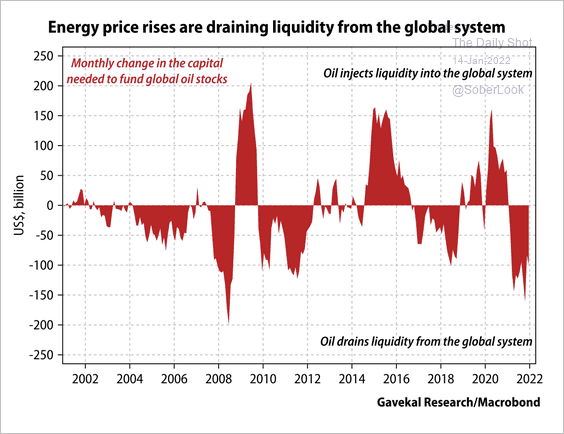 Source: Gavekal Research
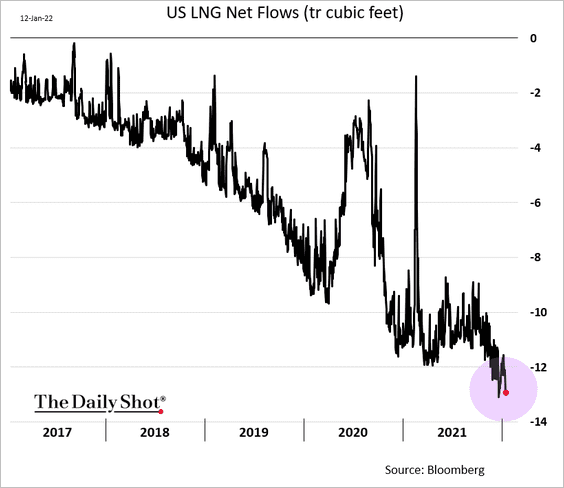
2. US LNG exports are near record highs (the chart shows “net imports”).
3. This chart shows US renewable energy supply.
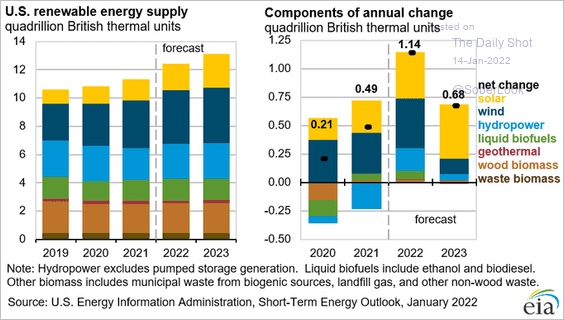 Source: @EIAgov Read full article
Back to Index
Equities
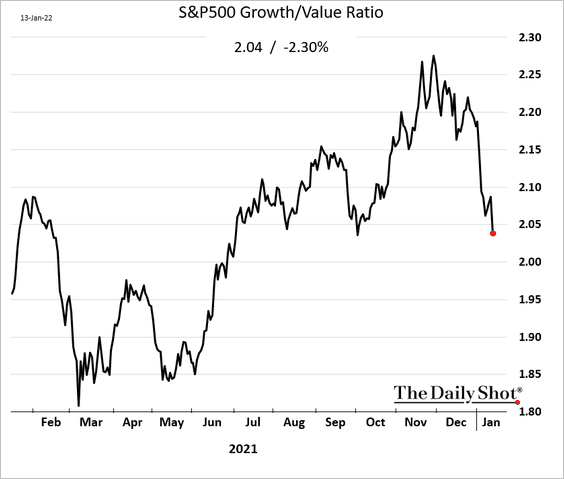
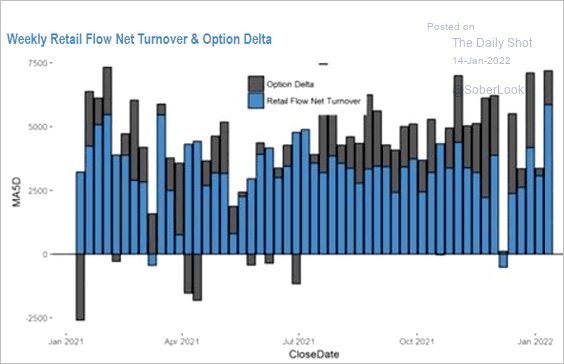
1. The rotation from growth to value continues.
• Retail investors have been plowing a great deal of money into the markets in recent days. But remarkably, in addition to the broad index ETFs, they’ve been buying value sector ETFs (according to JP Morgan Research). So this rotation is not limited to institutions.
 Source: JP Morgan Research; @themarketear
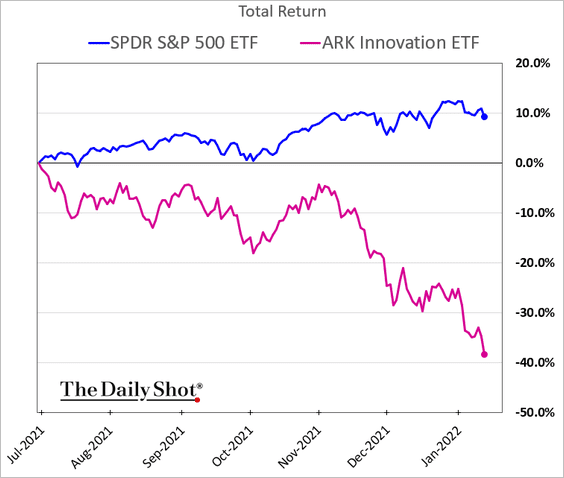
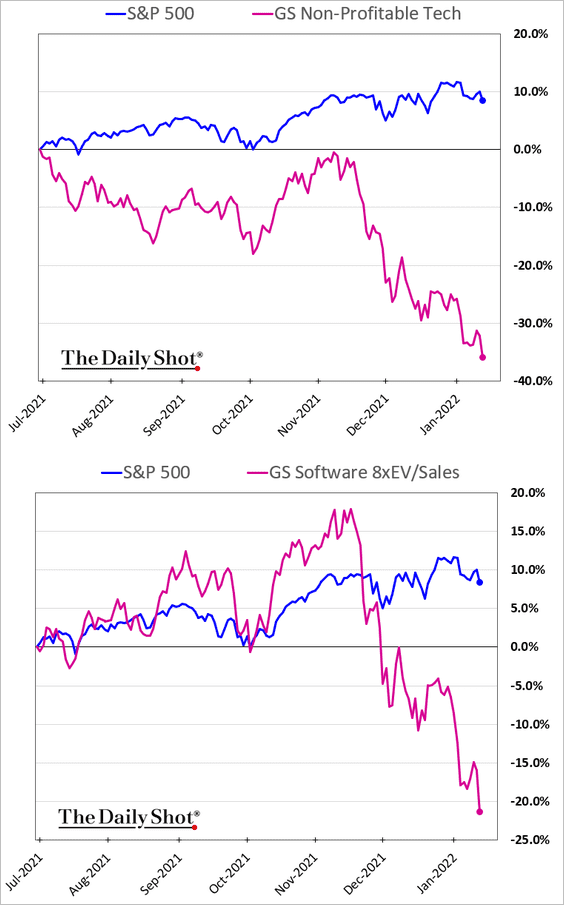
• The rotation out of speculative growth stocks has been particularly acute.
The second panel below shows Goldman’s index of high-multiple software stocks.
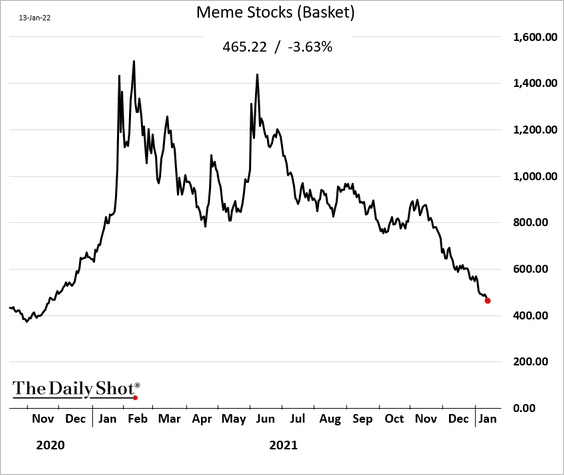
• The meme bubble continues to deflate.
——————–
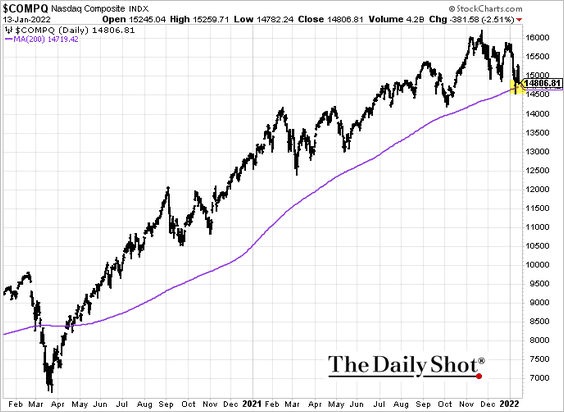
2. The Nasdaq Composite is once again testing support at the 200-day moving average.
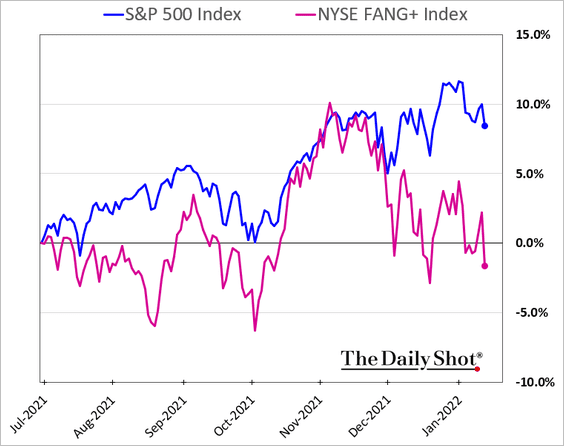
• Tech mega-caps have widened their underperformance.
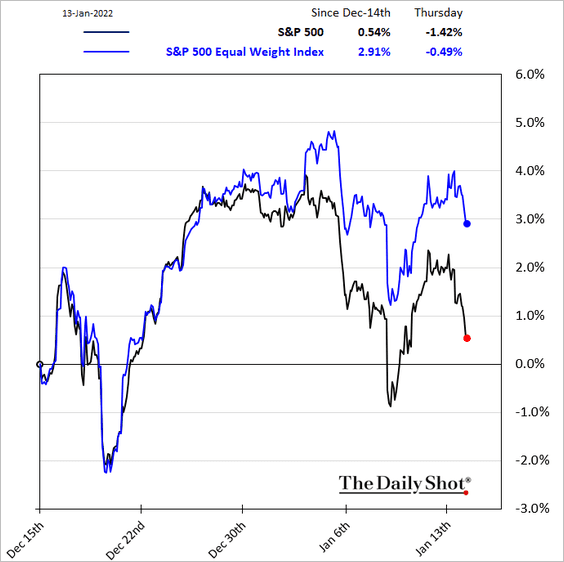
• As a result, the equal-weight index has outperformed in recent weeks.
——————–
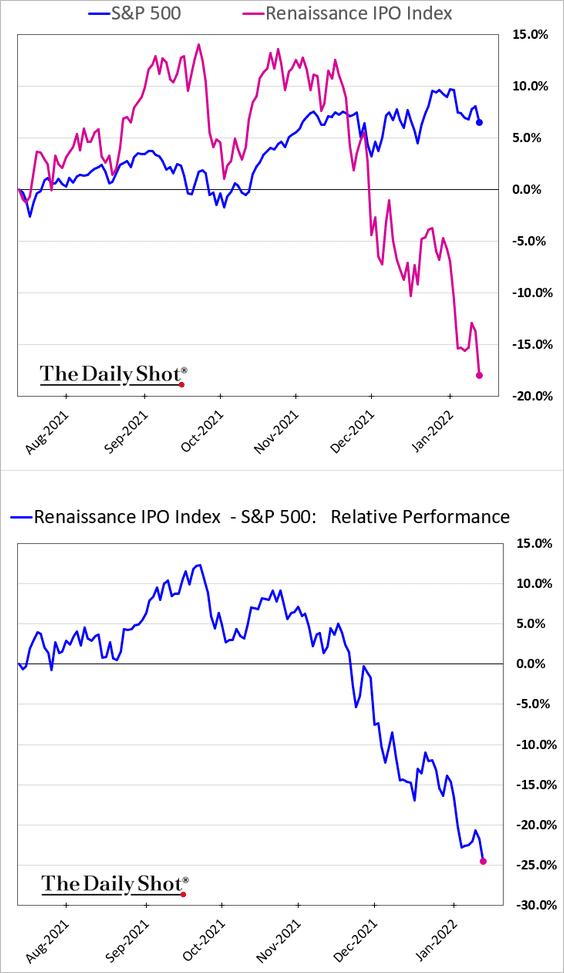
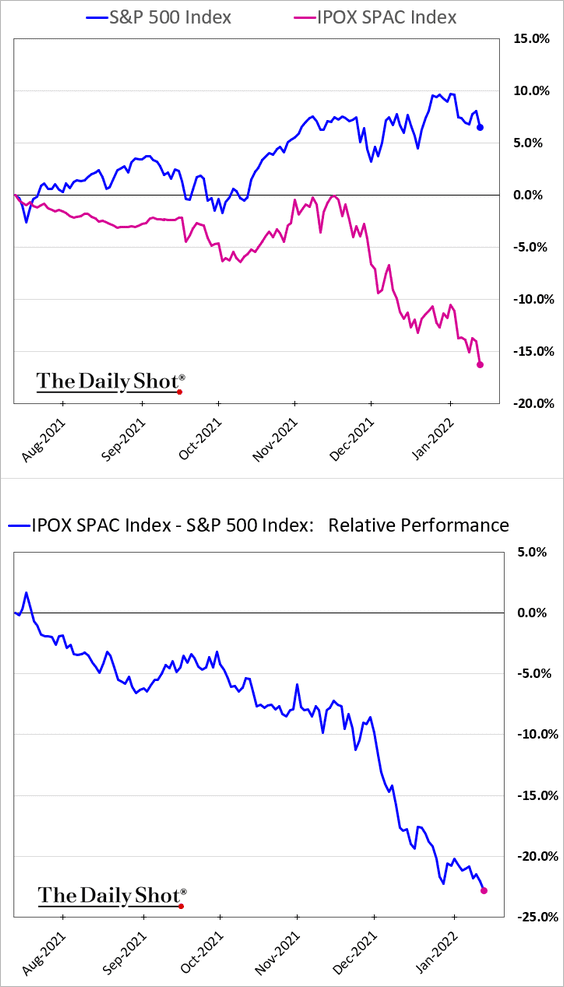
3. Given the poor performance over the past few months, it’s going to be much more challenging to launch new IPOs this year.
• Post-IPO companies:
• SPACs:
——————–
4. The S&P 500 real earnings yield hit another low.
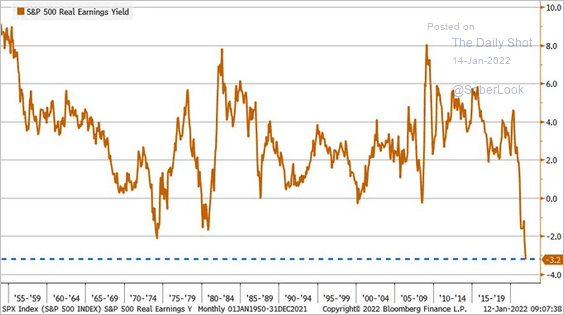 Source: @LizAnnSonders
Which sectors have a positive real earnings yield?
 Source: @SteveRattner
——————–
5. Typically, low/stable inflation has supported higher valuations.
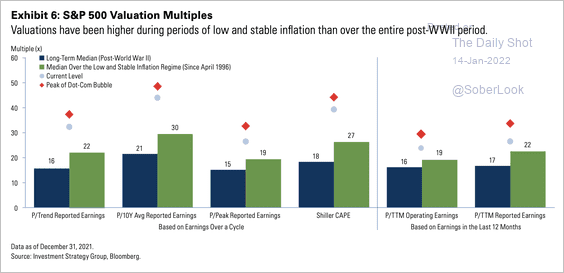 Source: Goldman Sachs
6. This chart shows return attributions for key markets globally over the past decade.
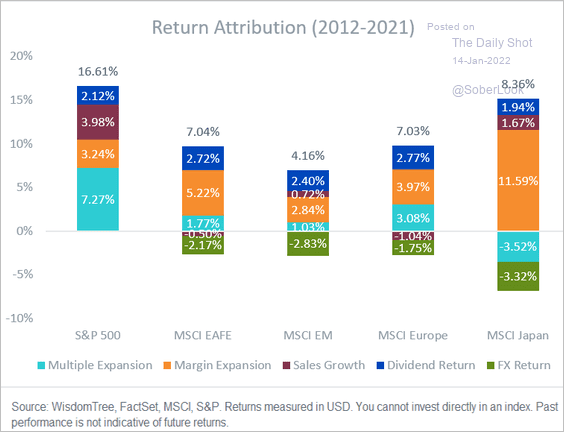 Source: @JeremyDSchwartz
Back to Index
Rates
1. Morgan Stanley estimates that quantitative tightening through 2025 will be the equivalent of 100-200 basis points worth of rate hikes.
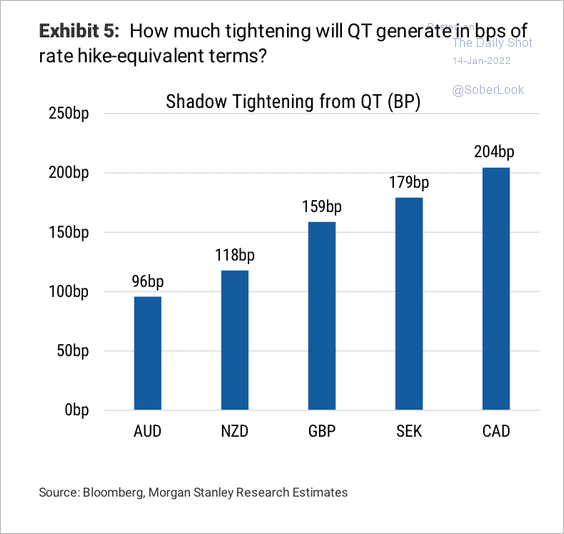 Source: Morgan Stanley Research
2. Tighter monetary policy could generate a steeper yield curve.
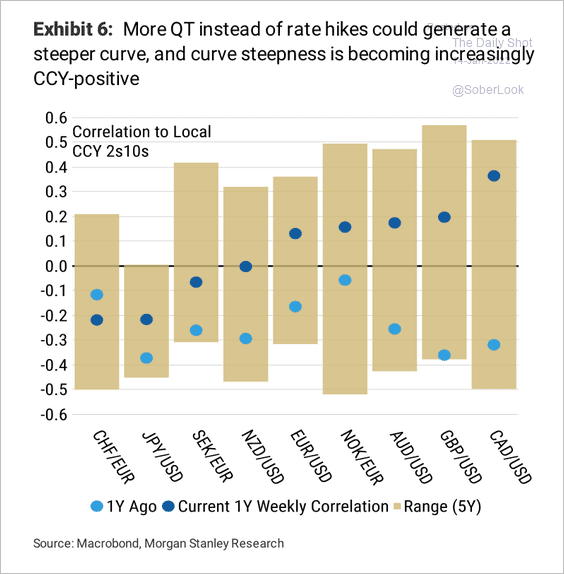 Source: Morgan Stanley Research
3. The Treasury market remains unconcerned about high inflation persisting over a longer period.
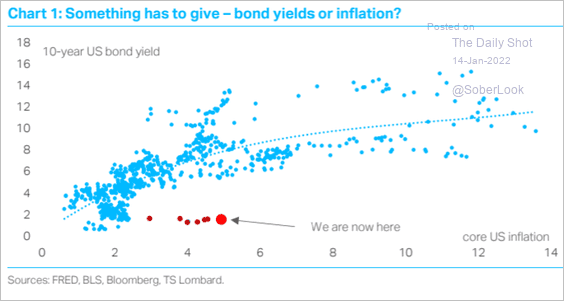 Source: TS Lombard
Back to Index
Global Developments
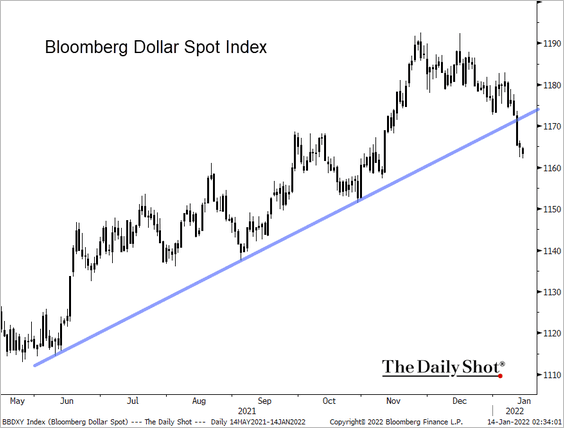
1. The US dollar remains under pressure.
• The dollar tends to rise in the weeks and months leading up to the first rate hike, and then subsequently weakens.
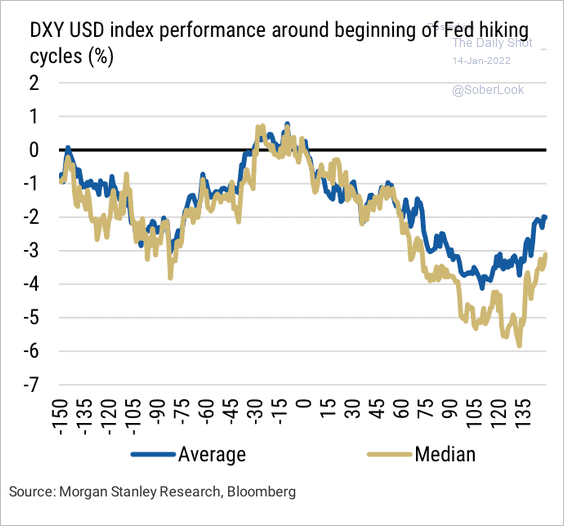 Source: Morgan Stanley Research
• Here is a forecast from Wells Fargo Securities.
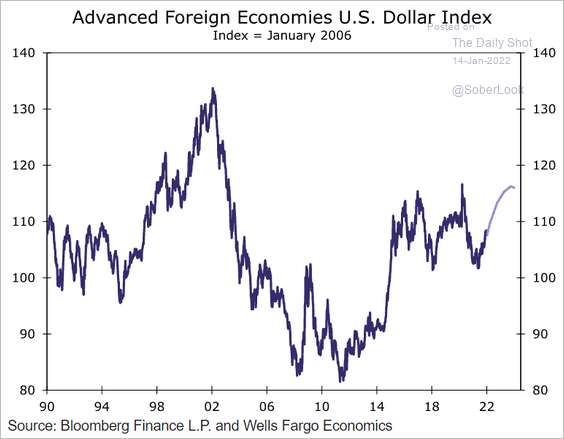 Source: Wells Fargo Securities
——————–
2. This chart shows household debt-to-disposable income in select economies.
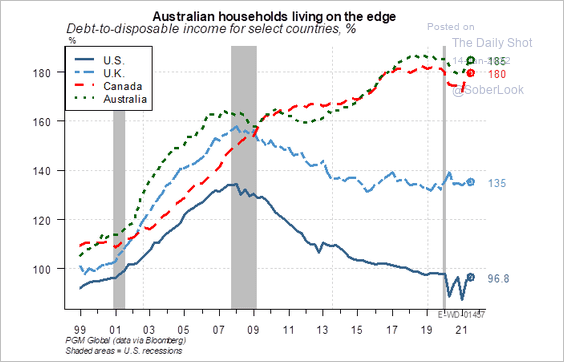 Source: PGM Global
3. Port blockages appear to have peaked.
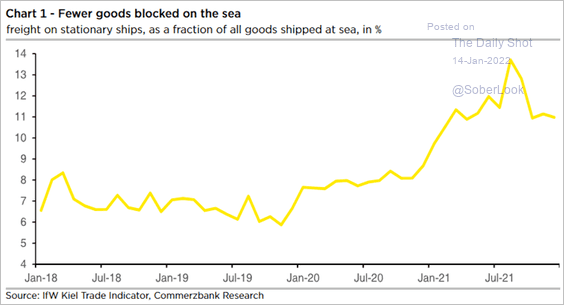 Source: Commerzbank Research
4. Will the growth in global exports benefit non-US company earnings?
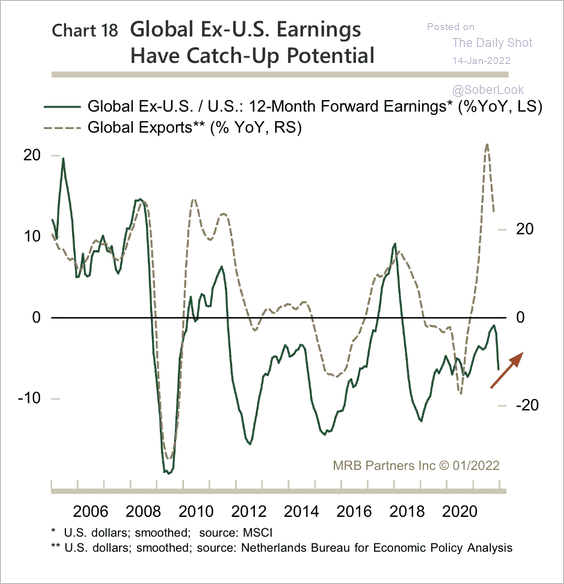 Source: MRB Partners
5. The global recovery is on track to eliminate spare capacity at a much faster pace than after prior recessions.
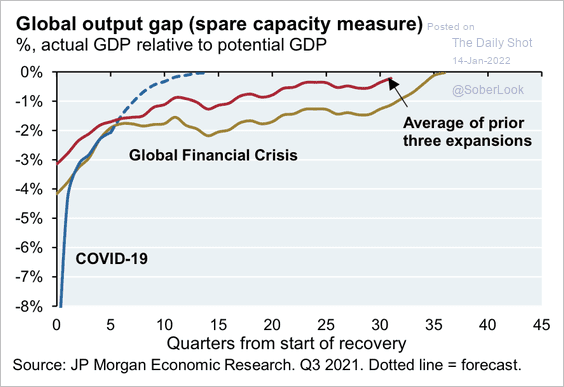 Source: J.P. Morgan Asset Management
——————–
Food for Thought
1. How industrial robots are used in the US:
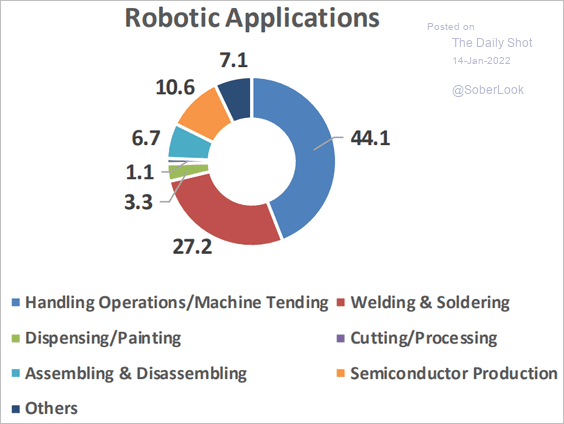 Source: Cornerstone Macro
2. Mobile apps spending and downloads:
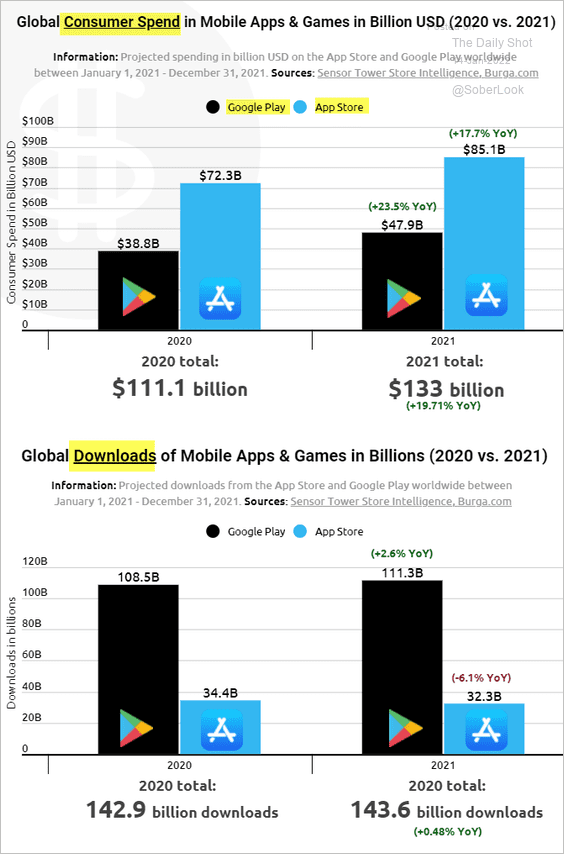 Source: BURGA Read full article
3. Market opportunity in cloud computing:
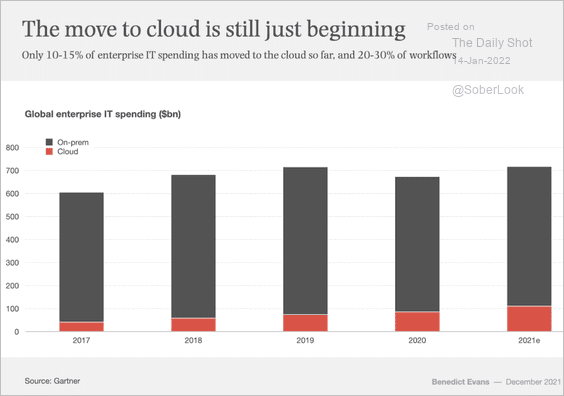 Source: Benedict Evans
4. EV sales:
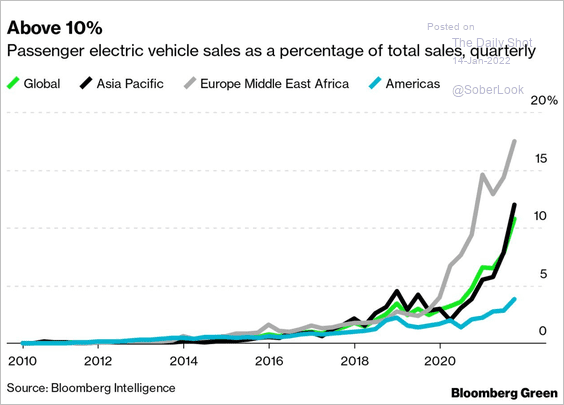 Source: @NatBullard Read full article
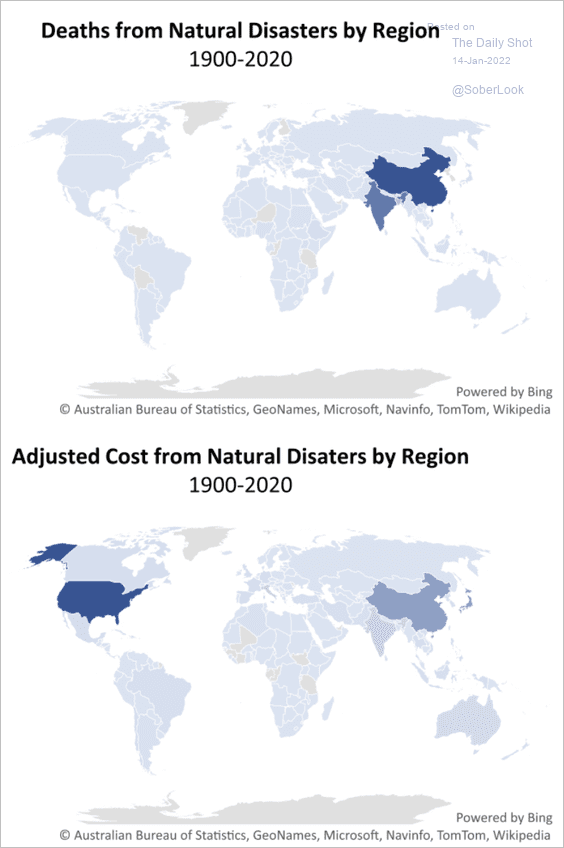
5. Deaths from natural disasters:
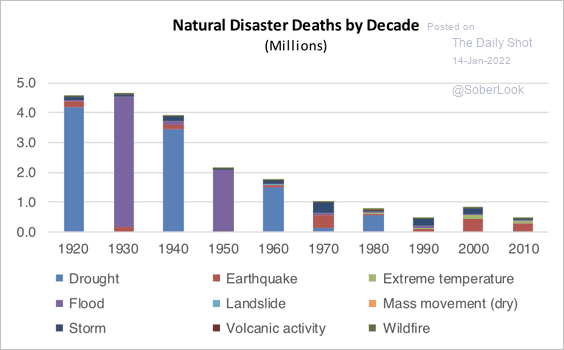 Source: Cornerstone Macro
 Source: Cornerstone Macro
——————–
6. The non-white population in the US:
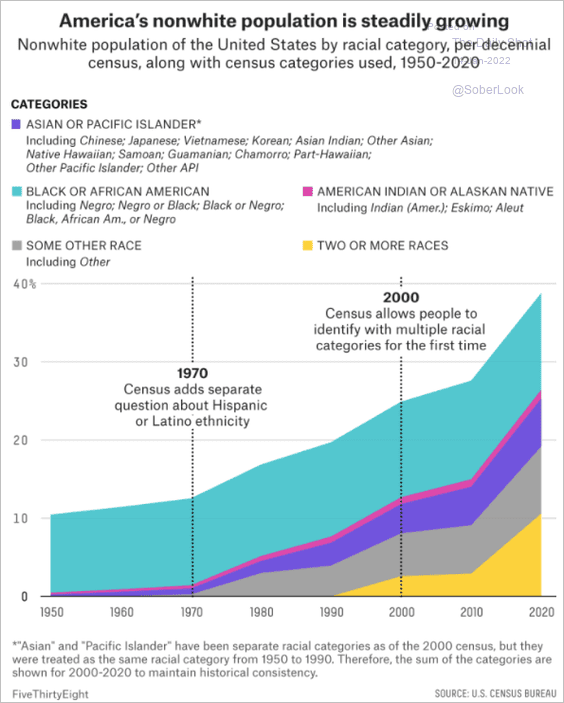 Source: FiveThirtyEight Read full article
7. US infrastructure spending:
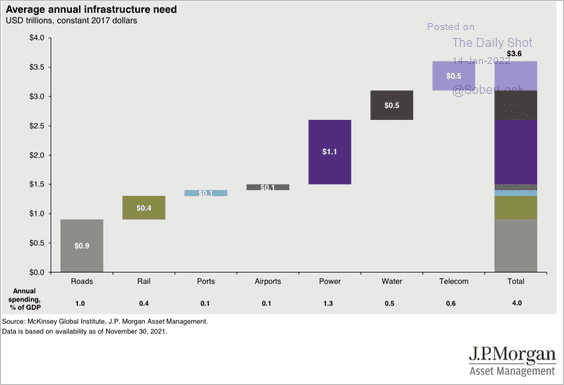 Source: J.P. Morgan Asset Management
8. The legal status of prostitution in the EU:
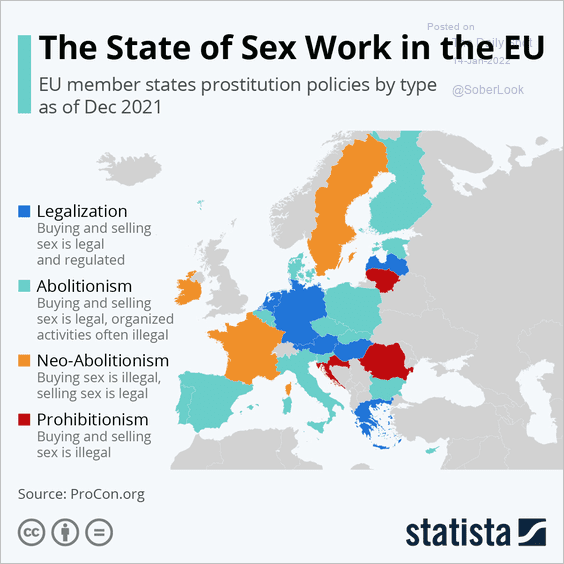 Source: Statista
——————–
Have a great weekend!
Back to Index