
The Daily Shot: 17-Jan-22
• Equities
• Credit
• Rates
• Energy
• Commodities
• Cryptocurrency
• China
• Asia – Pacific
• The Eurozone
• The United Kingdom
• The United States
• Global Developments
• Food for Thought
Equities
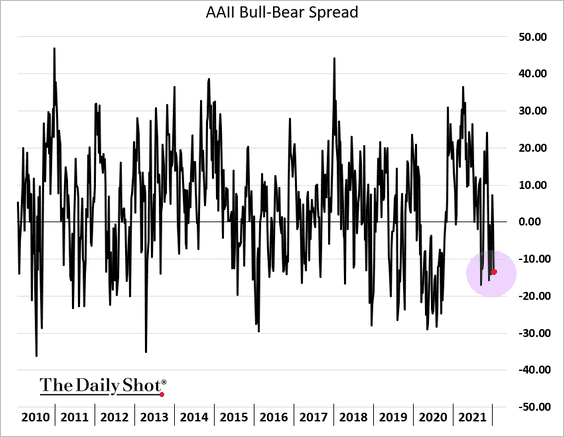
1. Market sentiment has been shifting toward more neutral levels as Fed rate hikes loom. The equity market froth we saw last year has come off.
• The AAII bull-bear spread is holding in negative territory.
• Here is Goldman’s sentiment indicator.
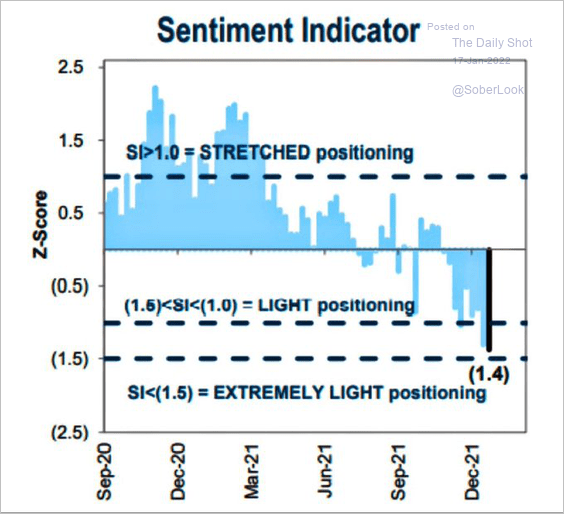 Source: Goldman Sachs; @WallStJesus
• Speculative assets have sold off sharply (2 charts).
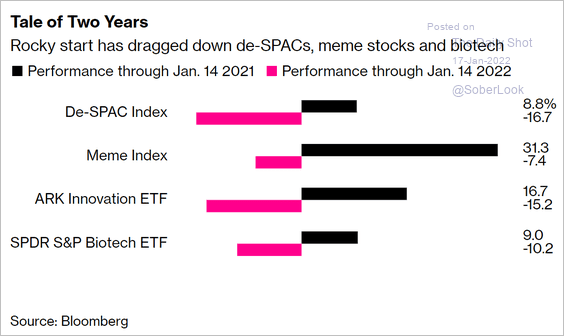 Source: Bloomberg Read full article
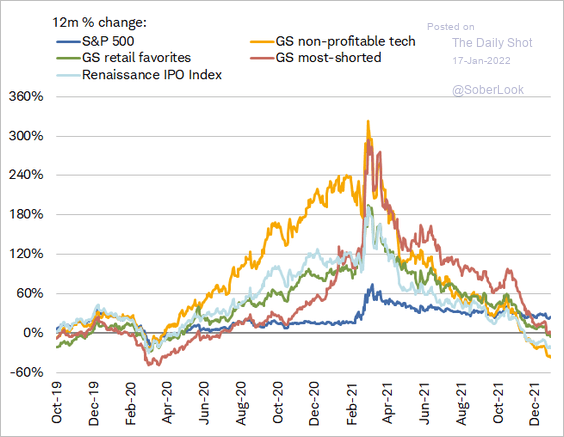 Source: Charles Schwab Read full article
• Deutsche’s consolidated equity positioning indicator is near the “neutral” level.
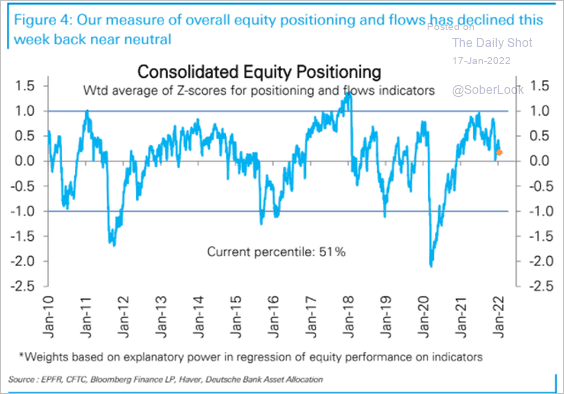 Source: Deutsche Bank Research
• CTAs have shifted into bearish mode.
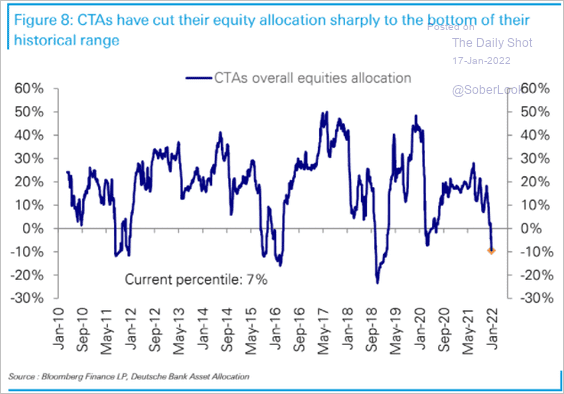 Source: Deutsche Bank Research
• Hedge funds have been cutting net exposure, although positioning remains well above pre-COVID levels.
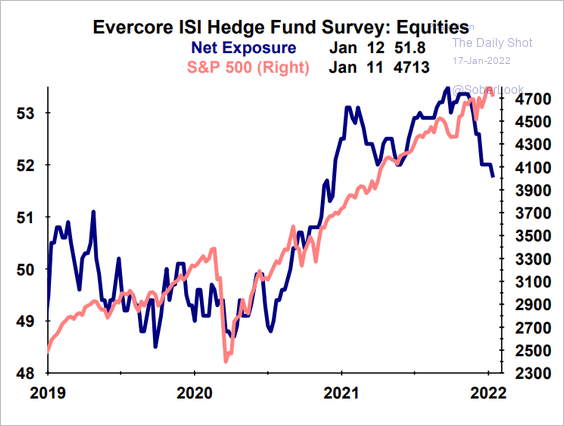 Source: Evercore ISI Research
• The put/call ratio is in neutral territory.
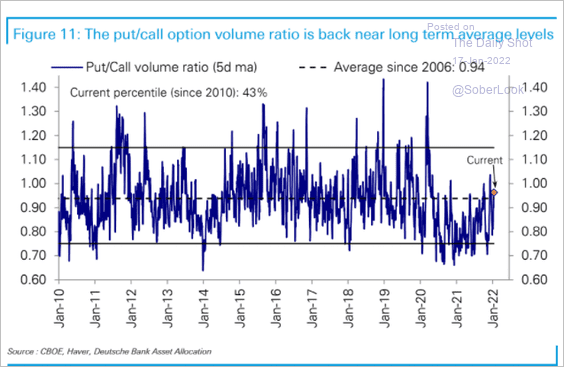 Source: Deutsche Bank Research
——————–
2. The value/growth relative performance continues to follow real yields.
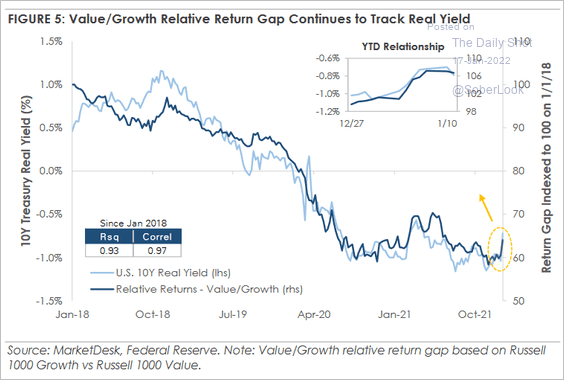 Source: MarketDesk Research
3. Bond yields tend to matter more for equities if earnings are being downgraded.
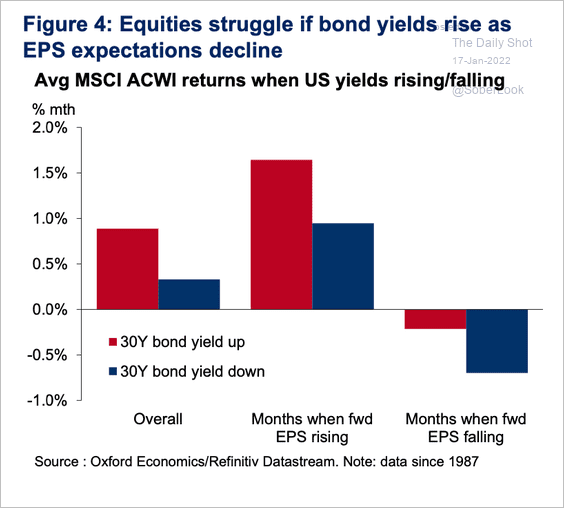 Source: Oxford Economics
4. Small caps’ earnings growth is expected to outperform large caps.
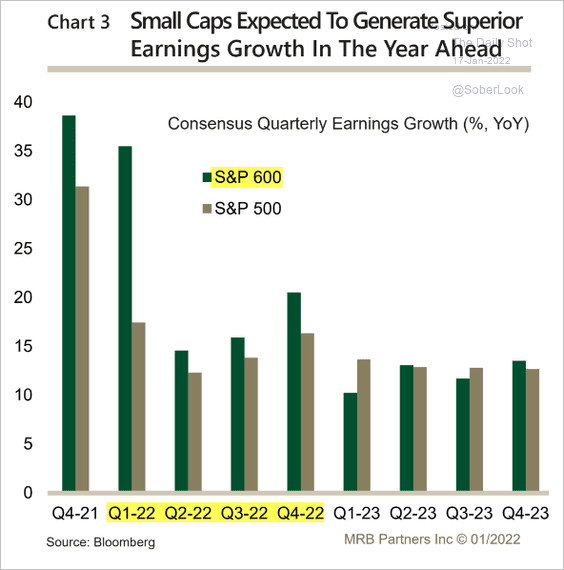 Source: MRB Partners
5. This chart shows sector concentrations for US stocks going back to 1800.
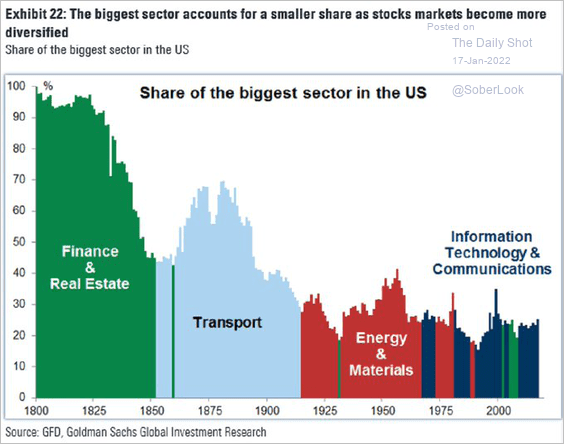 Source: Goldman Sachs; @markets Read full article
Back to Index
Credit
1. US high-yield spreads are near the lowest levels since 2007.
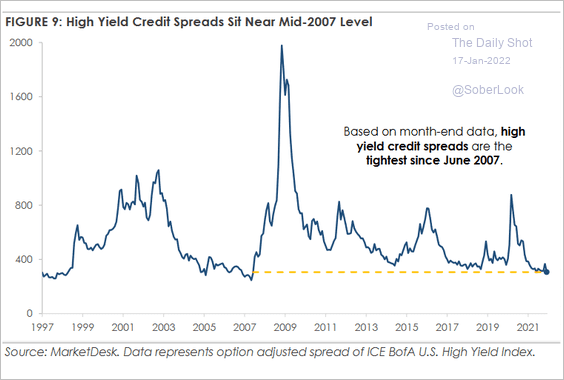 Source: MarketDesk Research
2. Corporate defaults have been dropping sharply and are forecast by BCA Research to stay low.
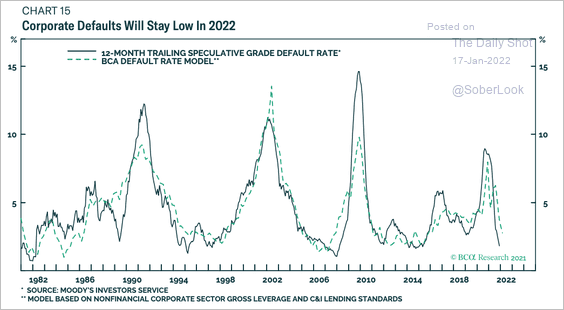 Source: BCA Research
This chart shows US mid-to-large company bankruptcies.
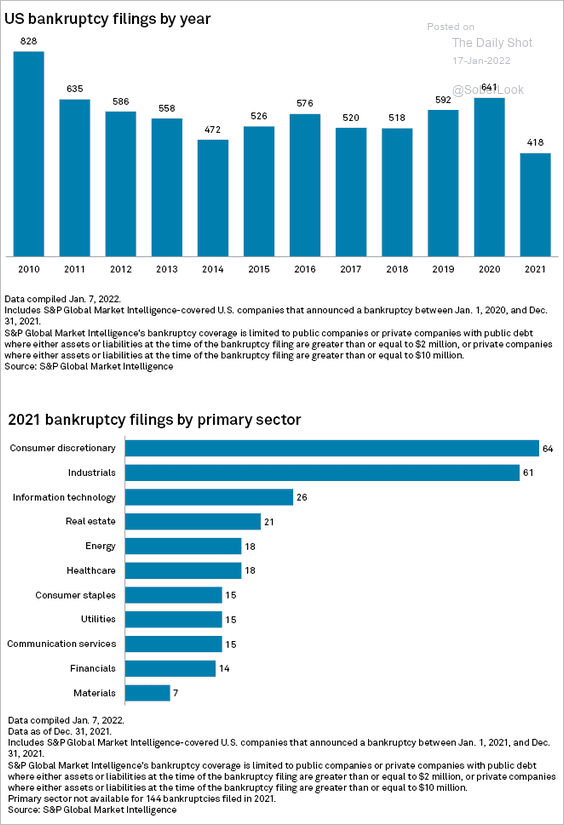 Source: S&P Global Market Intelligence
——————–
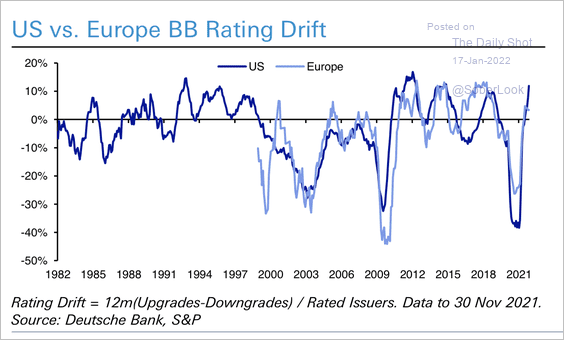
3. US and European B-rated and BB-rated corporate debt have seen positive rating drifts (upgrades vs. downgrades) over the past year (2 charts).
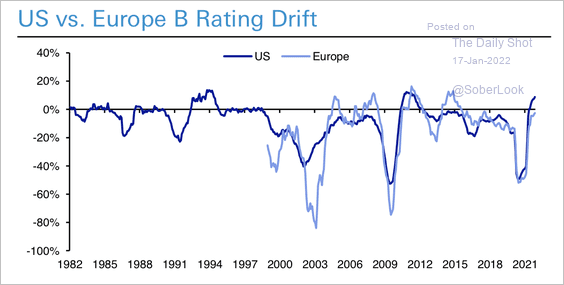 Source: Deutsche Bank Research
 Source: Deutsche Bank Research
——————–
4. US banks’ loan-to-deposit ratios are expected to rebound this year.
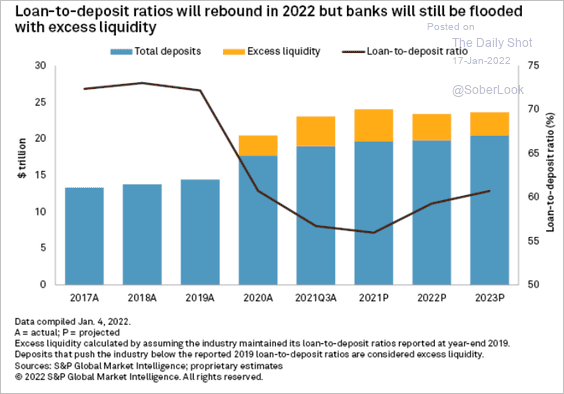 Source: S&P Global Market Intelligence
5. Single Asset Single Borrower debt deals have been increasingly popular in real estate credit.
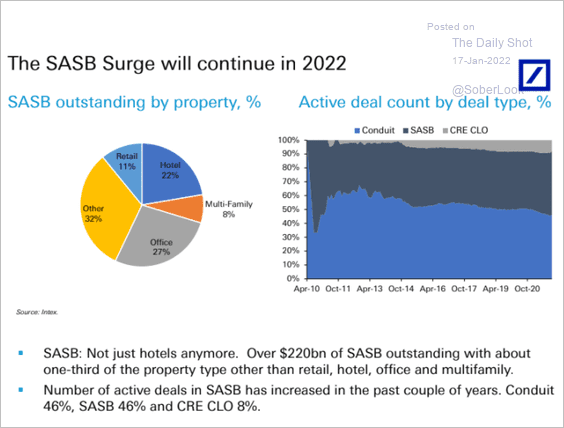 Source: Deutsche Bank Research
Back to Index
Rates
1. A substantial amount of Treasury debt will mature during the next few years. That could force the Fed to cap the dollar value of bonds it allows to roll off its balance sheet, according to Charles Schwab.
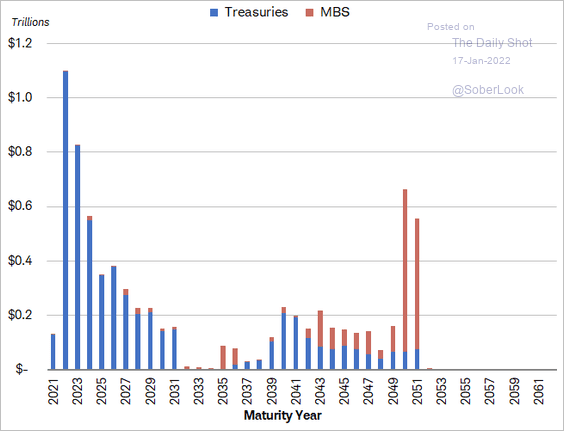 Source: Charles Schwab Read full article
2. Bond managers have been cutting their portfolio duration.
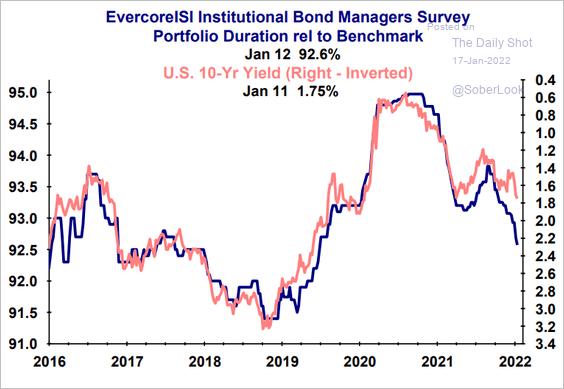 Source: Evercore ISI Research
Back to Index
Energy
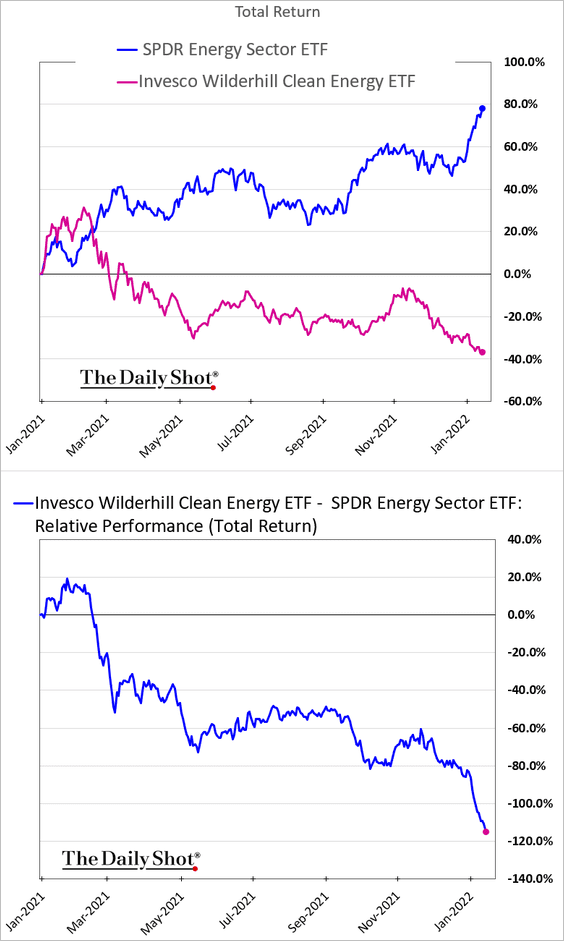
1. Clean energy stocks’ underperformance relative to traditional energy companies has blown out.
2. Global petroleum inventories continue to shrink (chart shows estimates vs. pre-COVID levels).
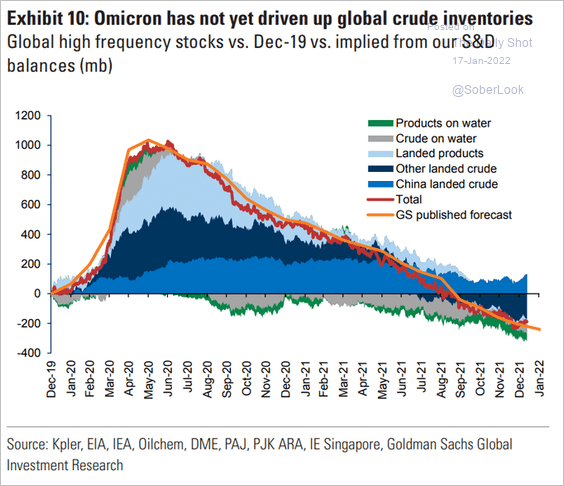 Source: Goldman Sachs; @TeddyVallee
Back to Index
Commodities
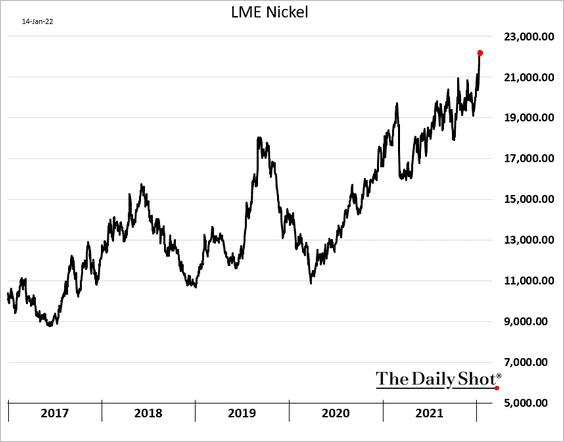
1. Nickel prices have been surging.
 Source: Swarajya Read full article
——————–
2. The copper breakout many have been expecting is yet to materialize.
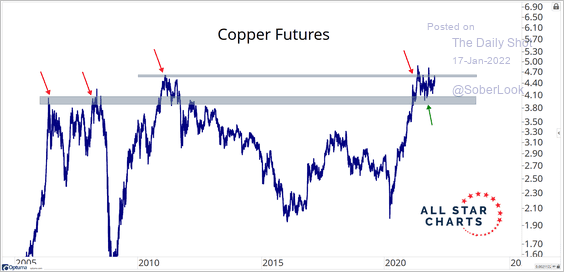 Source: @MebFaber
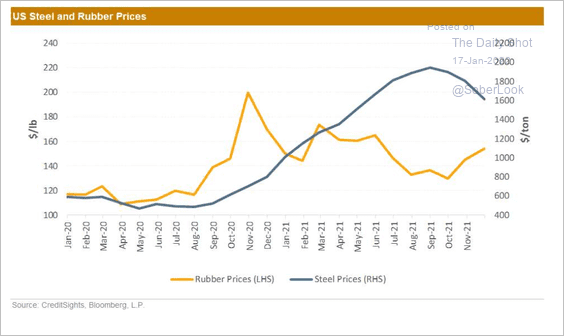
3. Key raw material prices for the automotive sector have risen strongly, with the pain only now starting to be felt by equipment manufacturers.
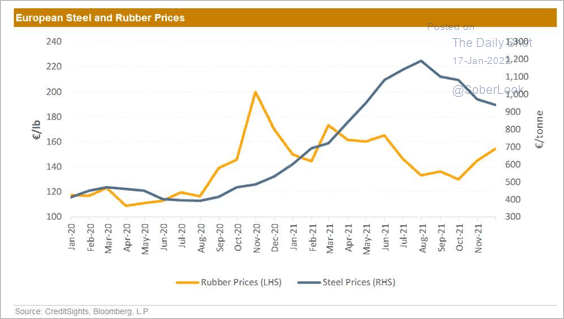 Source: CreditSights
 Source: CreditSights
——————–
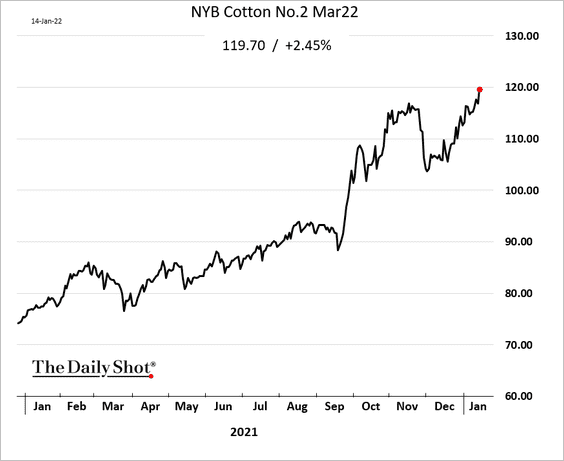
4. The March NY cotton futures contract has been surging.
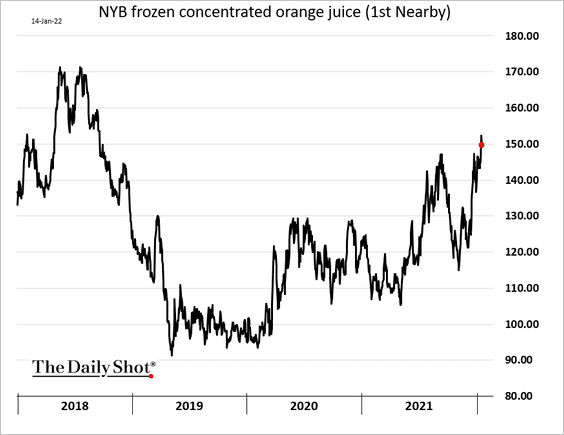
5. Falling production of Florida oranges is sending juice prices higher.
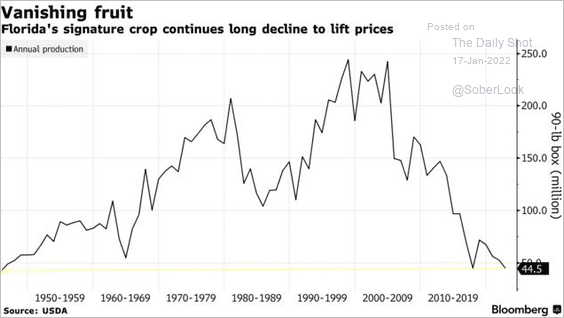 Source: @markets Read full article
Back to Index
Cryptocurrency
1. Bitcoin’s trading volume remains low, which can amplify price movements. So far, trading activity in both spot and derivative markets has been relatively quiet.
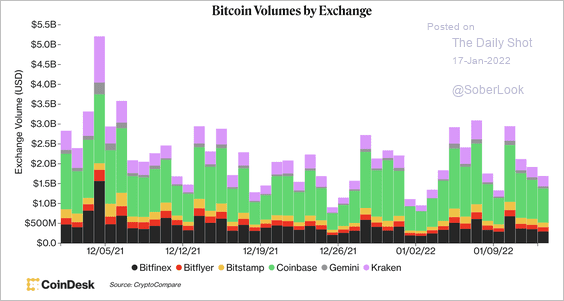 Source: CoinDesk Read full article
2. Open interest in bitcoin futures is down slightly since the last week of December.
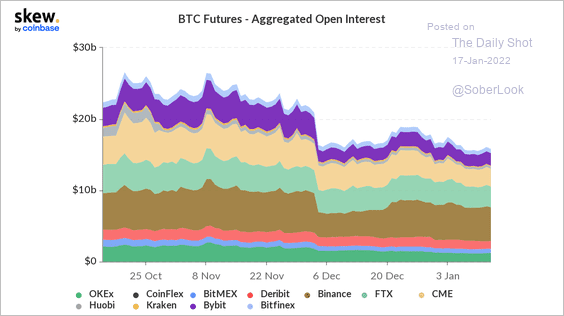 Source: Skew Read full article
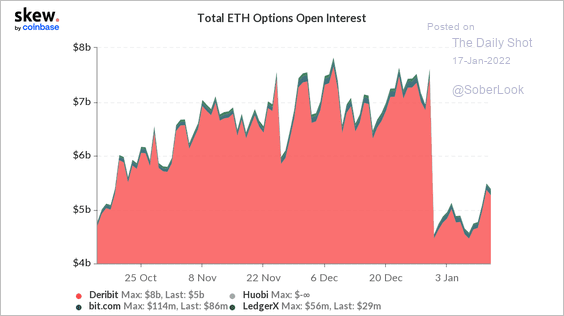
3. Options open interest in bitcoin and ether are down to where they were in early October (2 charts).
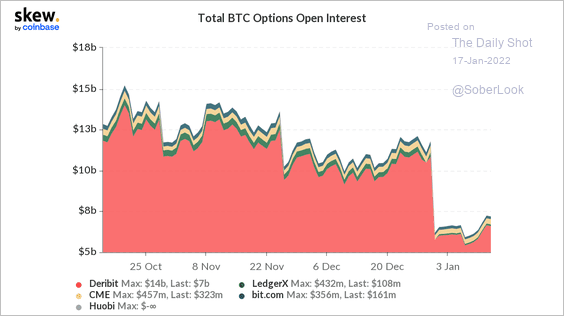 Source: @CoinbaseInsto
 Source: @CoinbaseInsto
——————–
4. Bitcoin implied volatility is also declining.
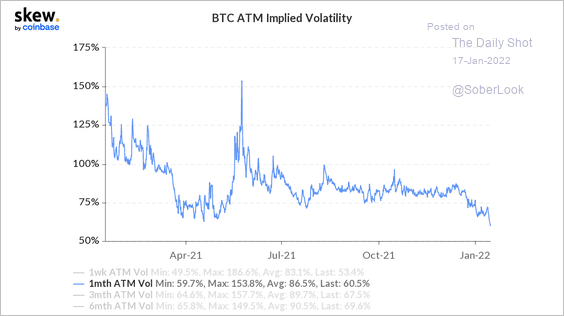 Source: @CoinbaseInsto
5. Bitcoin’s correlation to the S&P 500 has risen substantially since the start of the pandemic.
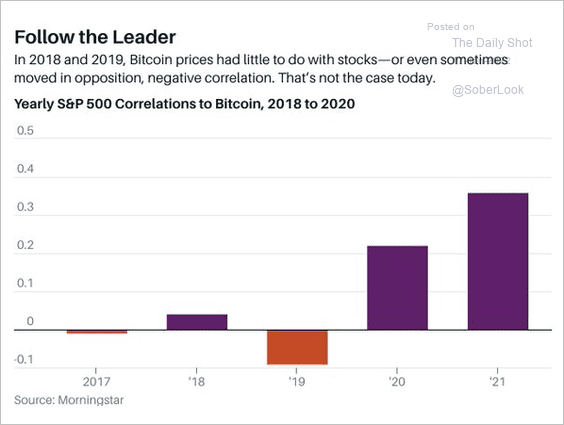 Source: @acemaxx, @barronsonline Read full article
6. Crypto-related job postings rose sharply last year.
 Source: CoinDesk Read full article
Back to Index
China
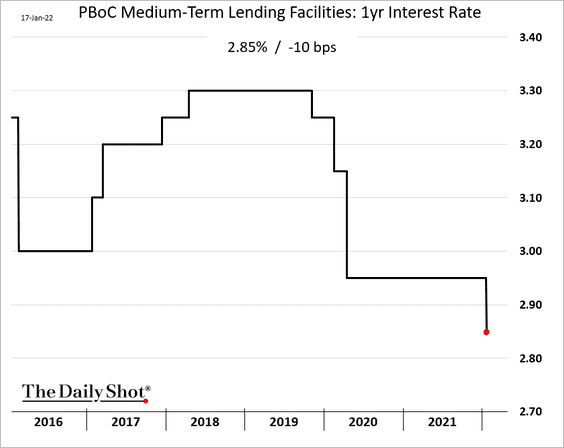
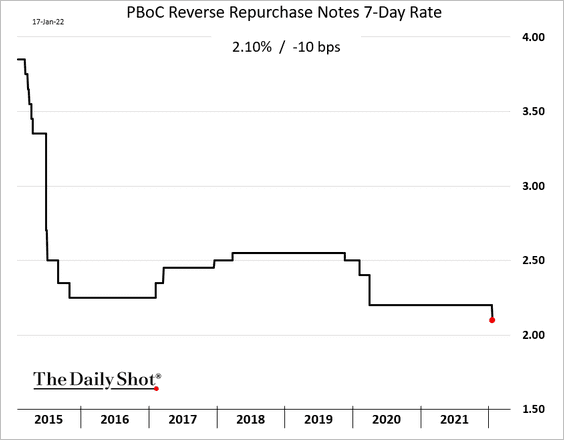
1. The PBoC cut rates amid concerns about slower growth ahead.
——————–
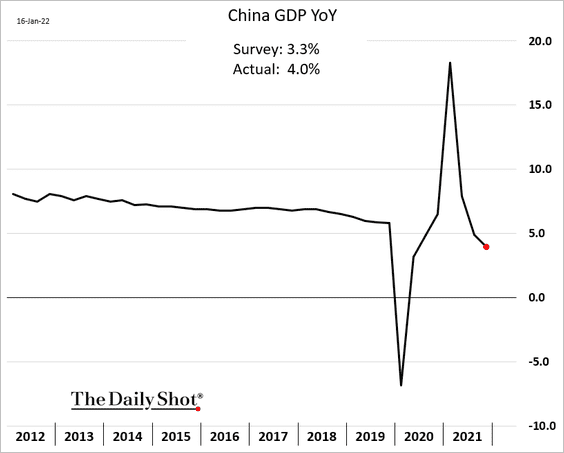
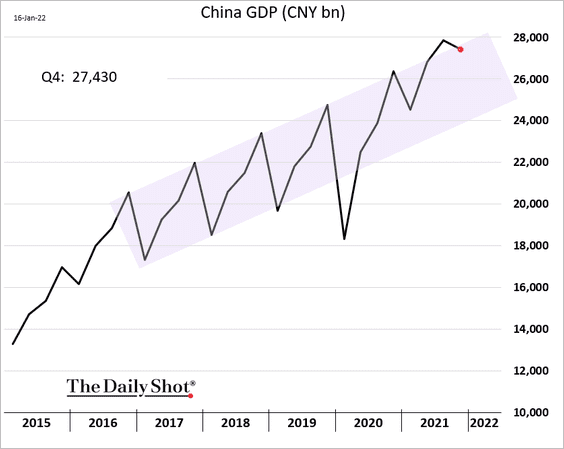
2. China’s 2021 GDP growth was stronger than expected.
The GDP level (not seasonally adjusted) is holding at the upper end of the pre-COVID trend.
——————–
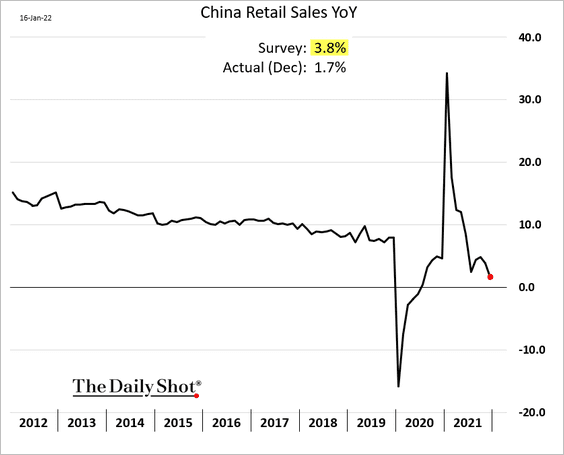
3. Industrial production firmed up in December.
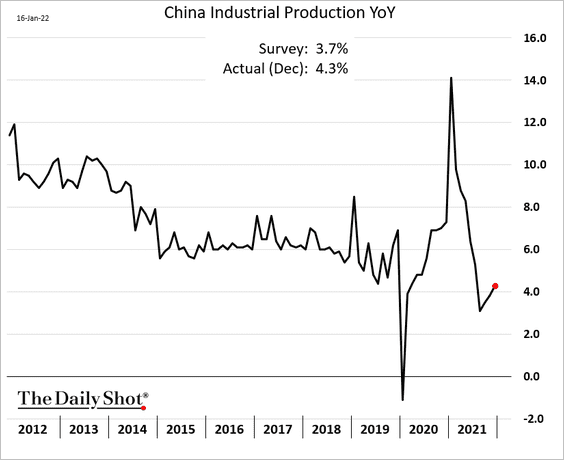
But retail sales growth continues to deteriorate as the pandemic takes a toll.
——————–
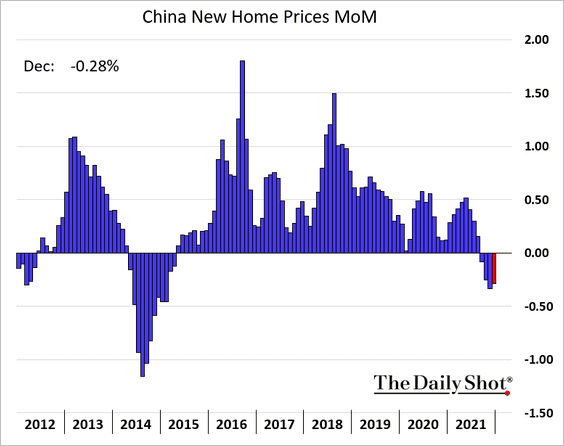
4. New home prices are still falling.
5. Developers’ debt collapse has accelerated, …
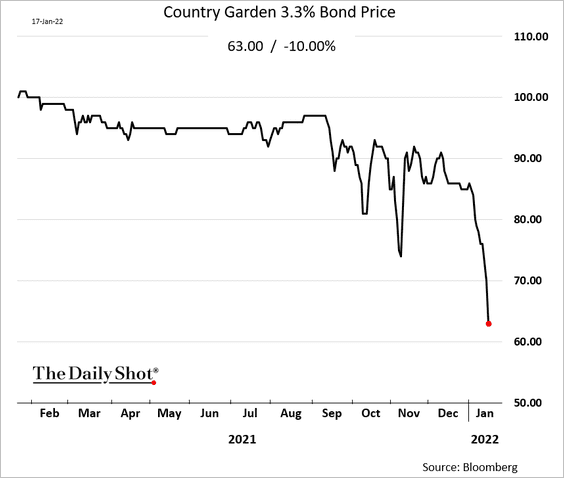
… as investors worry about the maturity wall.
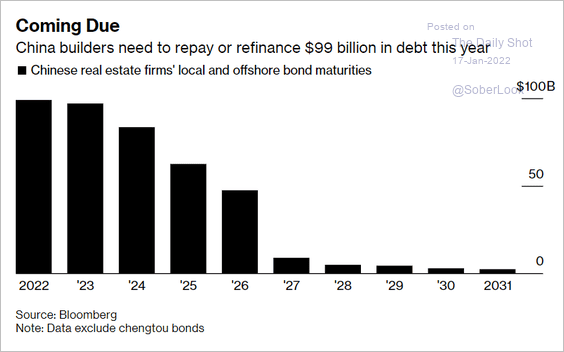 Source: @markets Read full article
——————–
6. Macau gaming stocks jumped as the new regulation turned out to be less draconian than expected.
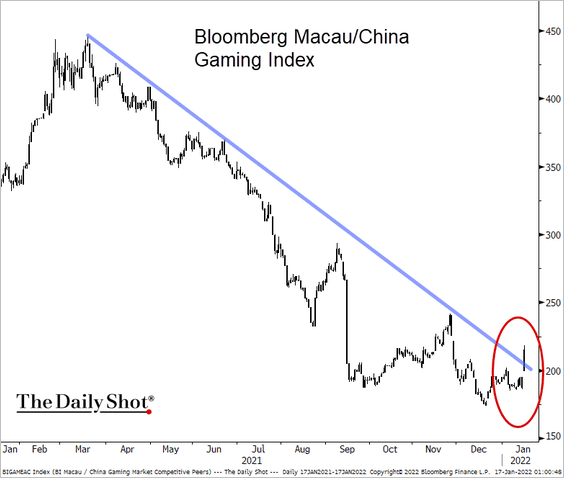 Source: @TheTerminal, Bloomberg Finance L.P., h/t Abhishek Vishnoi
 Source: IAG Read full article
Back to Index
Asia – Pacific
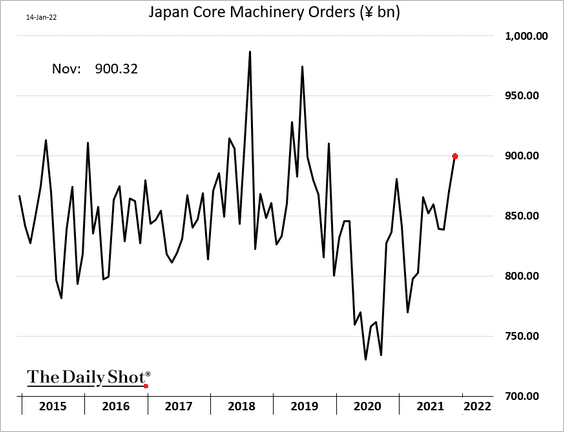
1. Japan’s machinery orders are rebounding.
2. Australia’s banking sector net-interest margins have been tight.
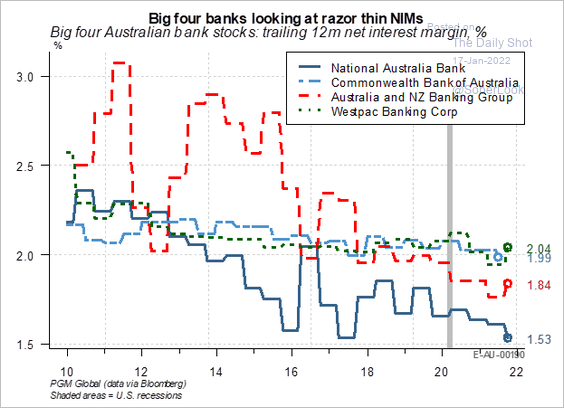 Source: PGM Global
Back to Index
The Eurozone
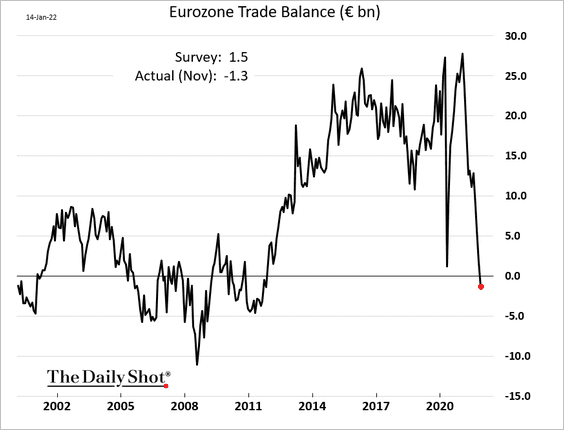
1. The euro-area trade balance swung into deficit for the first time in a decade amid sharply higher energy prices.
Goods exports to the US are expected to slow this year.
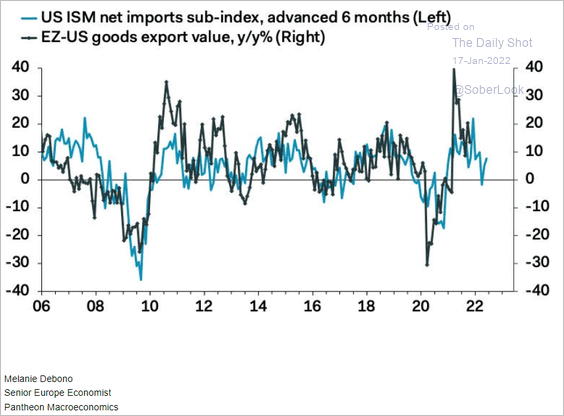 Source: Pantheon Macroeconomics
——————–
2. For the largest Eurozone economies, the pandemic-era ECB debt purchases absorbed much of the new issuance.
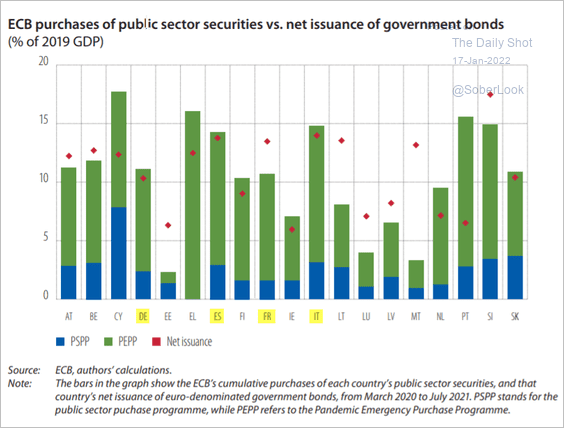 Source: EIB Read full article
QE has left European bond markets with a much lower free float.
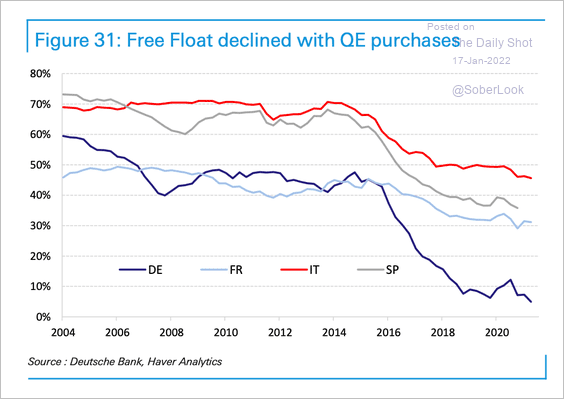 Source: Deutsche Bank Research
——————–
3. Monetary policy in the Eurozone and US is a long way from being tight.
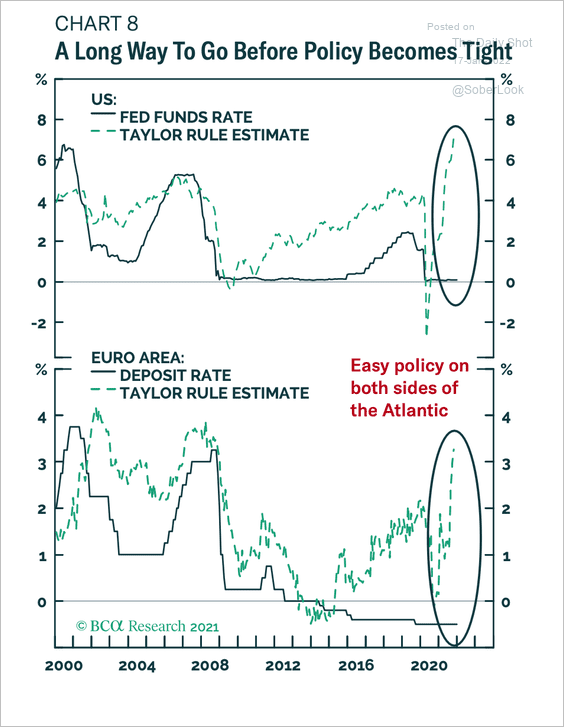 Source: BCA Research
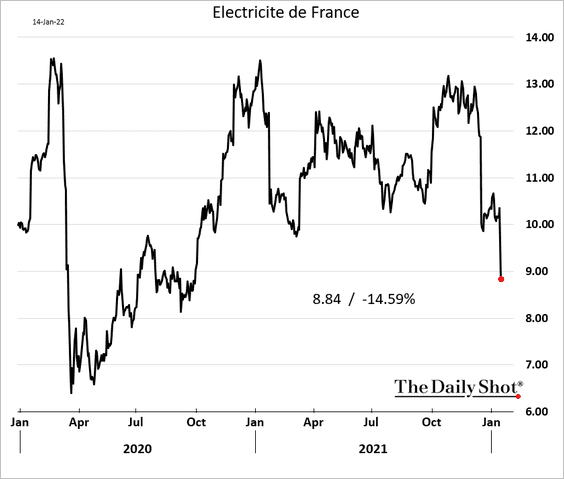
4. France’s power company shares tumbled as the government caps price increases.
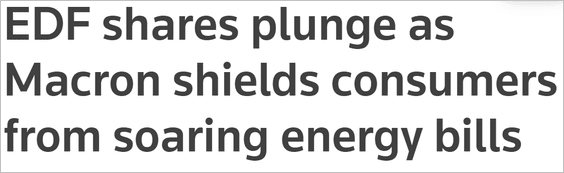 Source: Reuters Read full article
Back to Index
The United Kingdom
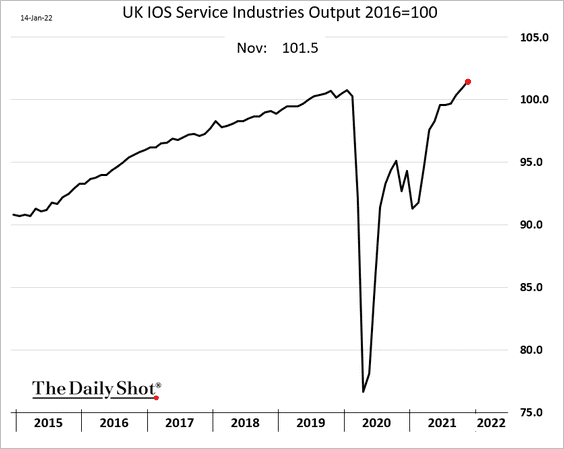
1. The GDP has fully recovered, as the November growth estimate topped forecasts.
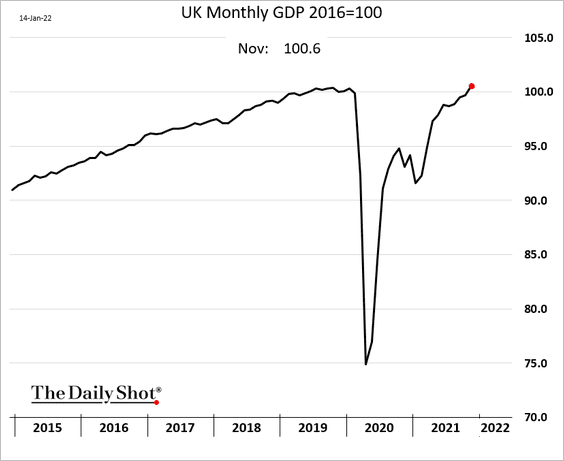
There was better than expected growth in manufacturing as well as services.
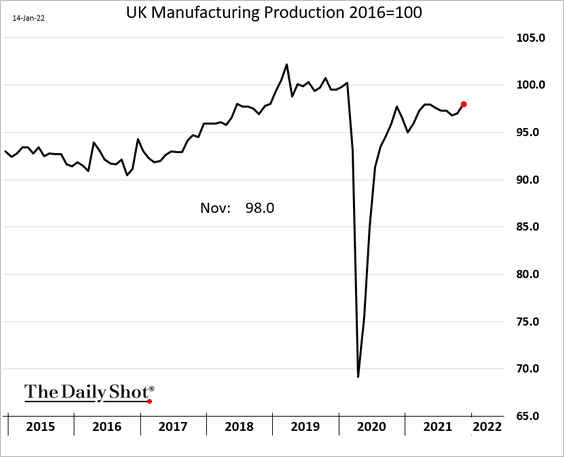
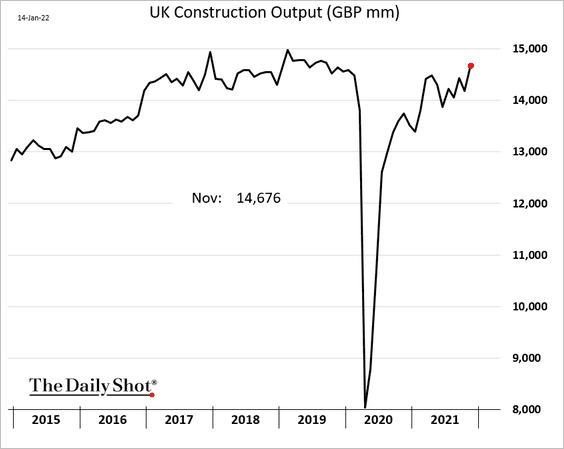
Construction output surged as well.
——————–
2. Trade swung into a large surplus, but the “underlying” trade deficit widened due to soaring energy prices (erratics = ships, aircraft, precious stones, silver, and nonmonetary gold).
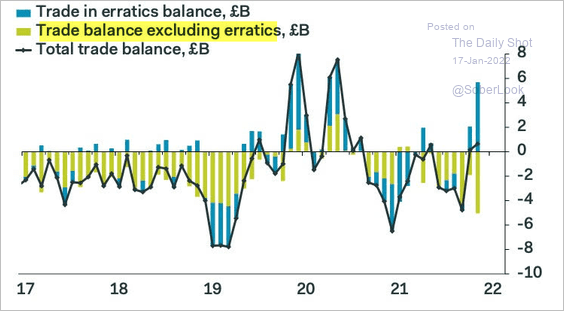 Source: Pantheon Macroeconomics
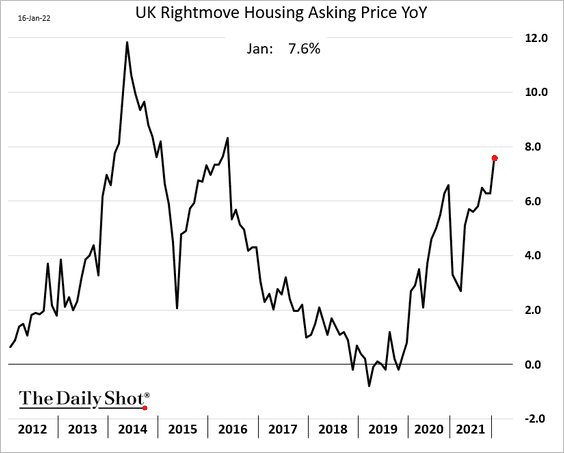
3. Home price appreciation accelerated in January.
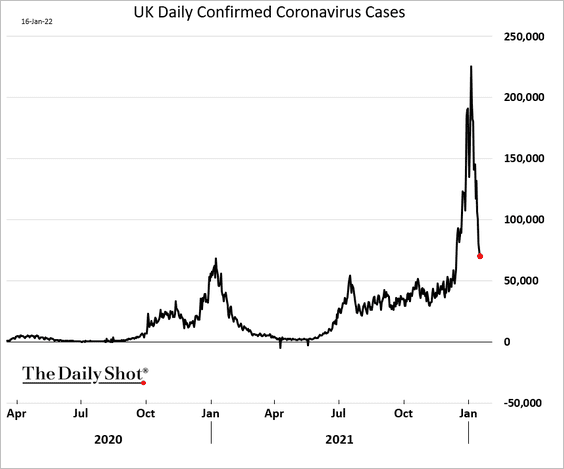
4. COVID cases are tumbling.
Back to Index
The United States
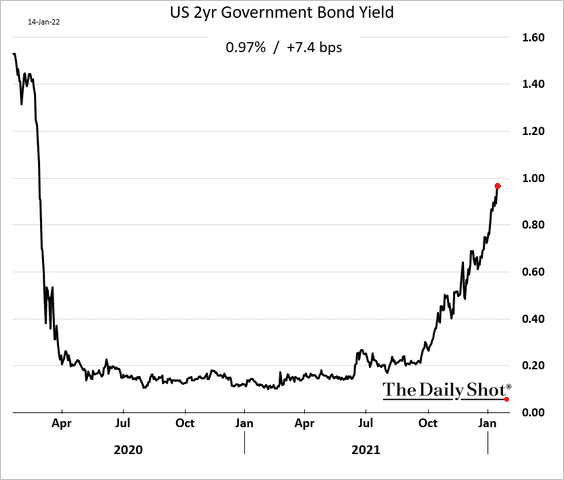
1. Short-term Treasury yields continue to climb.
The trend doesn’t bode well for factory activity growth.
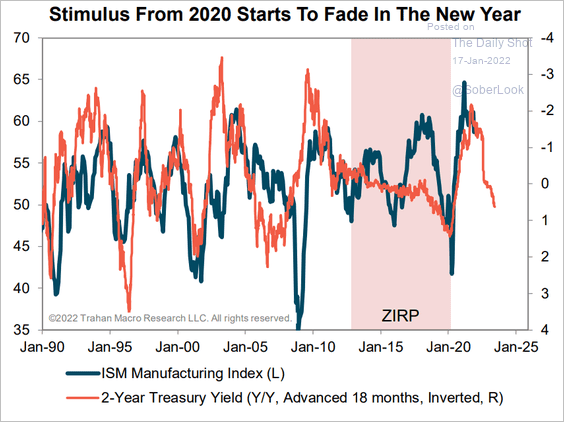 Source: Trahan Macro Research
——————–
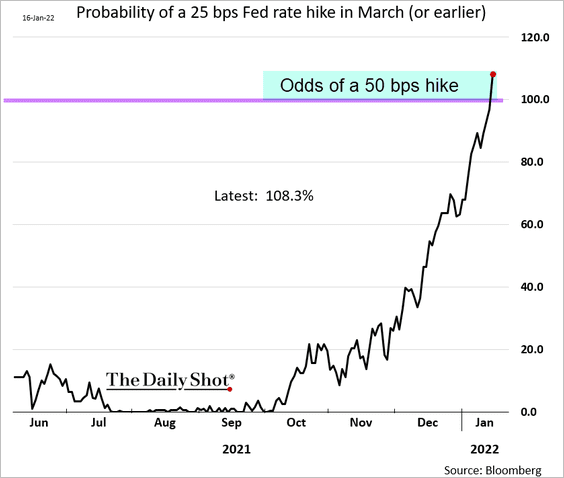
2. The March Fed rate hike is now fully priced in.
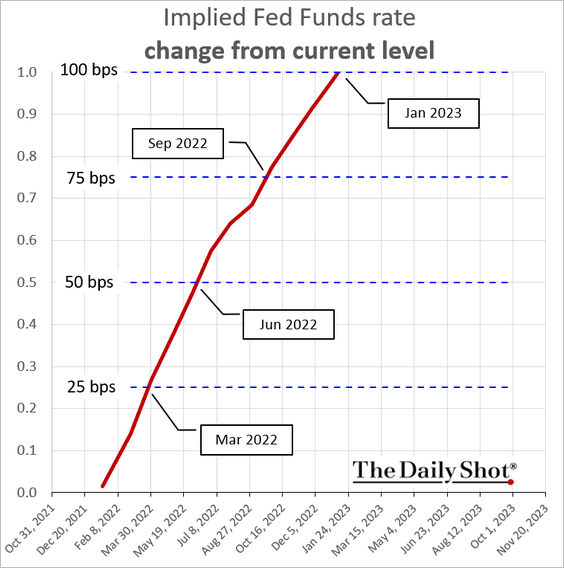
In fact, the probability measure climbed above 100%. How is that possible? The market is pricing in the possibility of a 50 bps increase rather than 25 bps.
 Source: Bloomberg Read full article
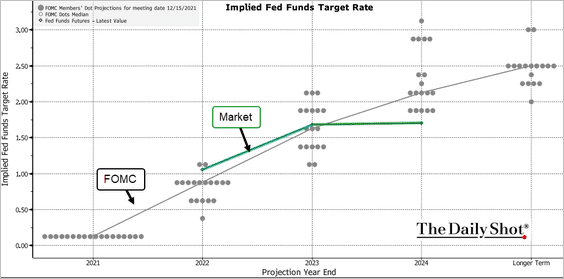
The market is now above the FOMC’s dot plot for the 2022 rate increases. But the market sees rate hikes slowing in 2024 (vertical lines indicate year-end).
 Source: @TheTerminal, Bloomberg Finance L.P.
——————–
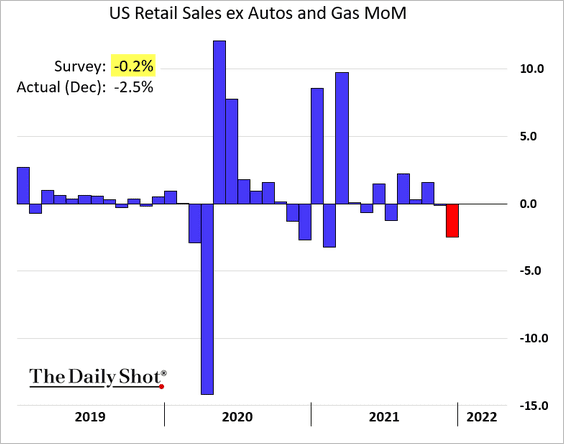
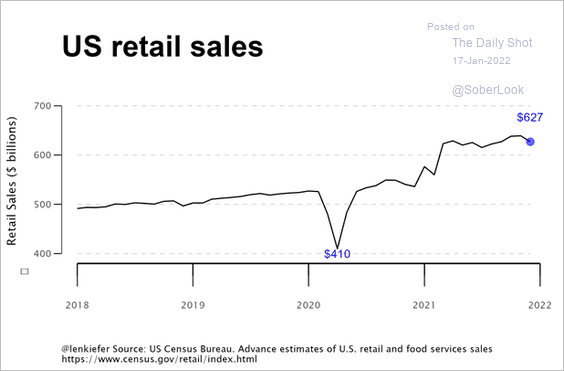
3. Retail sales unexpectedly tumbled in December (month-over-month).
 Source: @lenkiefer
 Source: CNBC Read full article
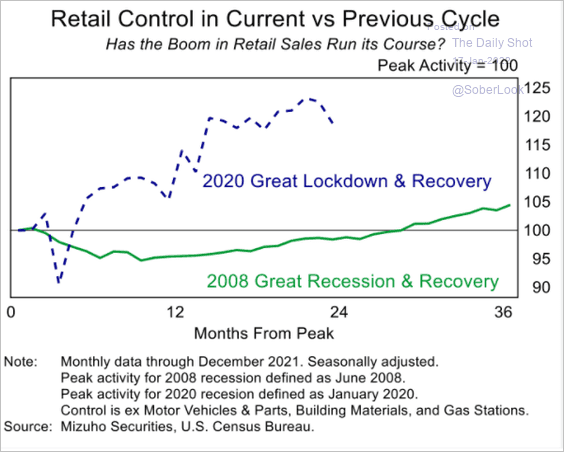
Here is a comparison to the post-2008 rebound.
 Source: Mizuho Securities USA
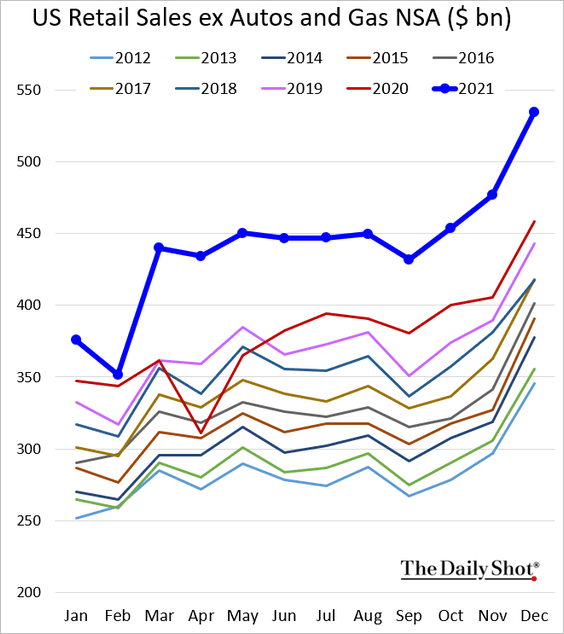
To be sure, without the seasonal adjustments, retail sales hit a record high. But the December gains weren’t as strong as they typically are at that time of the year.
——————–
4. The U. Michigan consumer sentiment index declined in January amid concerns about inflation.
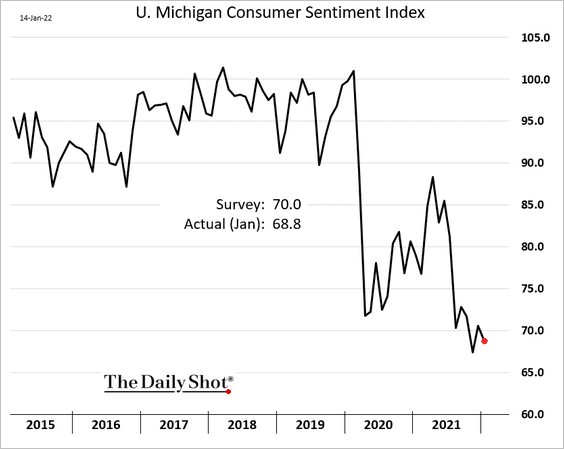
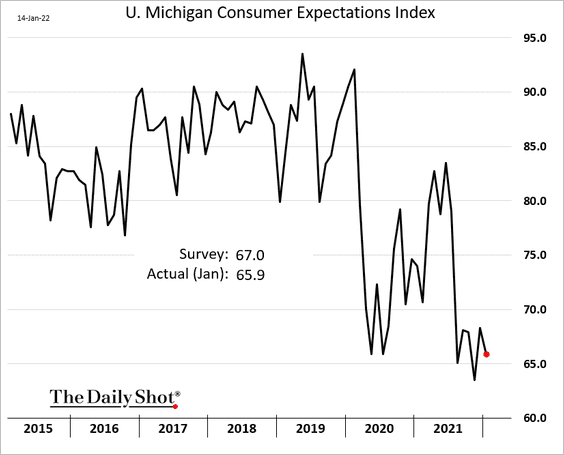
We will have more updates on the U. Michigan report tomorrow.
——————–
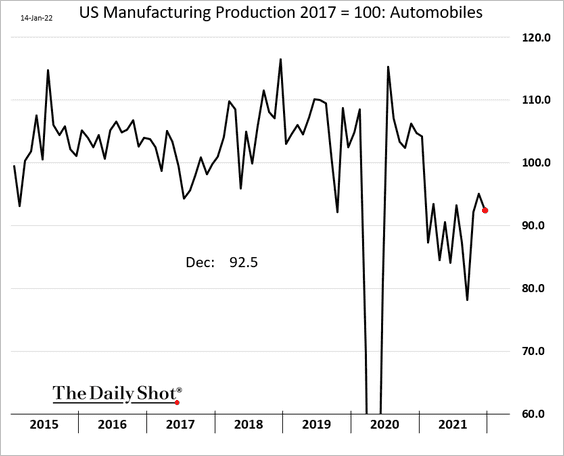
5. Industrial production ticked lower in December …
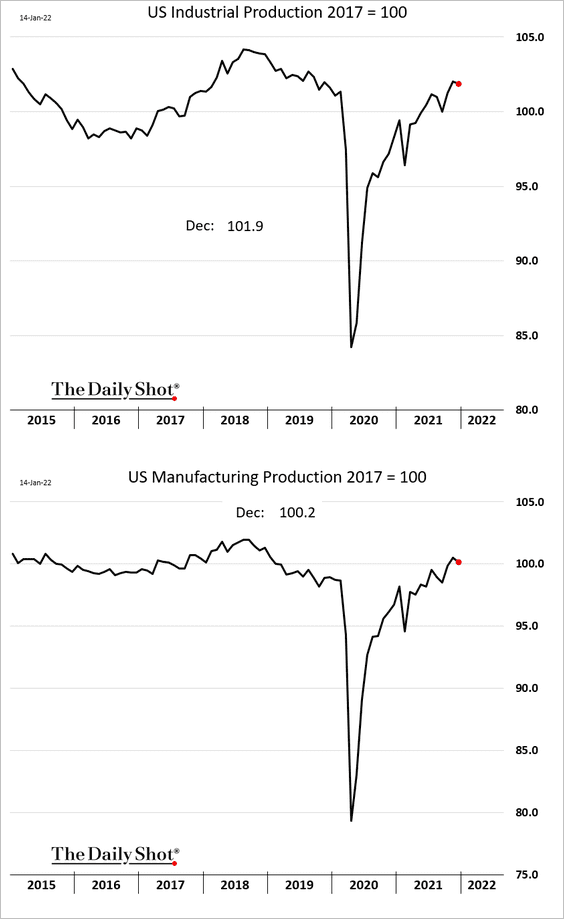
… as vehicle output slowed.
——————–
6. The combination of softer retail sales and industrial production sent the Citi Economic Surprise Index below zero again.
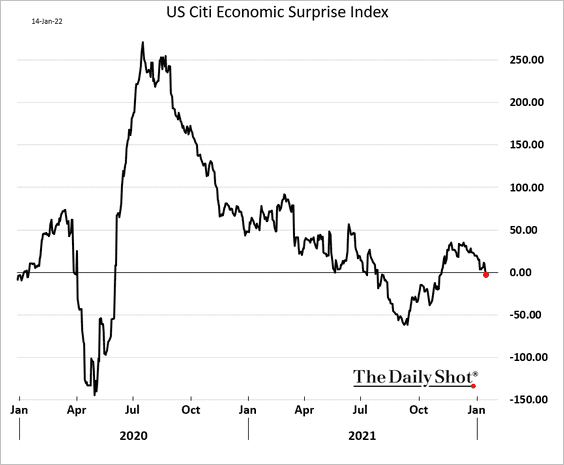 Source: Citi
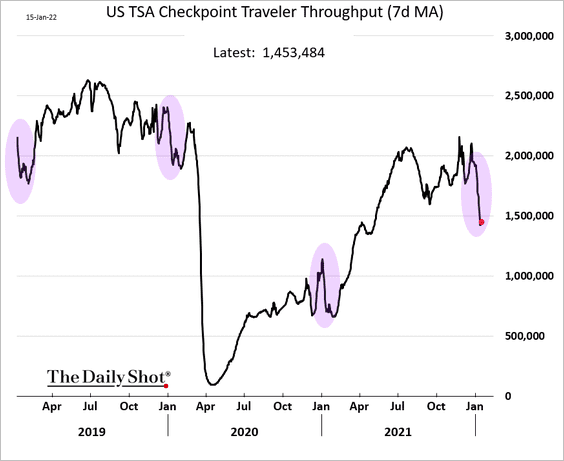
7. High-frequency indicators point to reduced mobility.
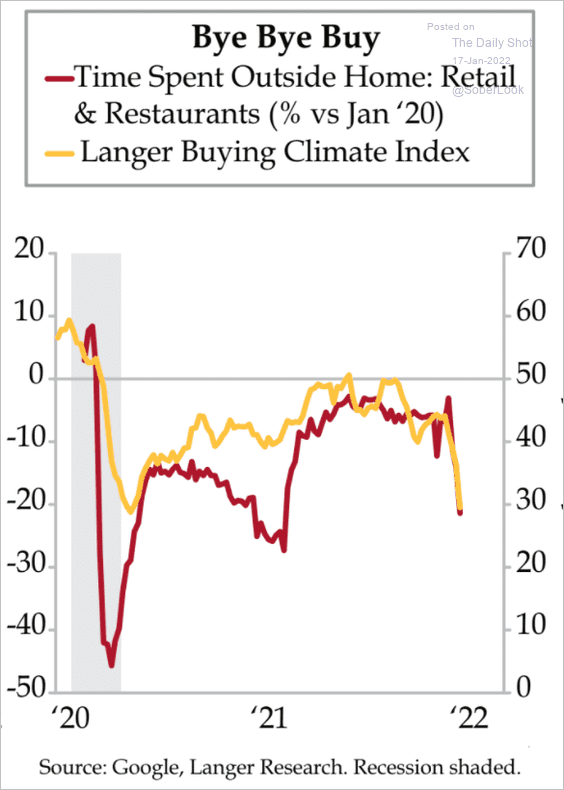 Source: The Daily Feather
While air travel usually declines this time of the year, the 2022 drop has been more severe.
Back to Index
Global Developments
1. Global bonds have sold off sharply in January.
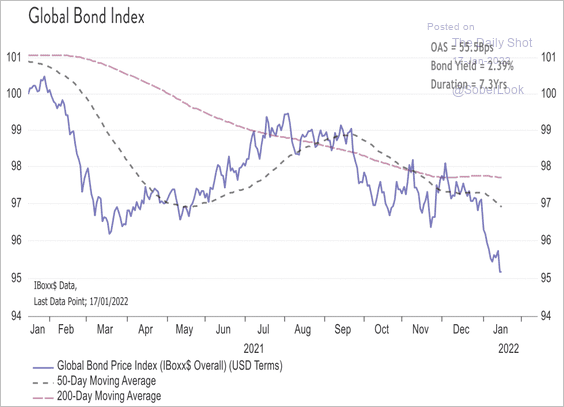 Source: Acorn Macro Consulting Ltd.
Only Germany now has a negative 10yr yield.
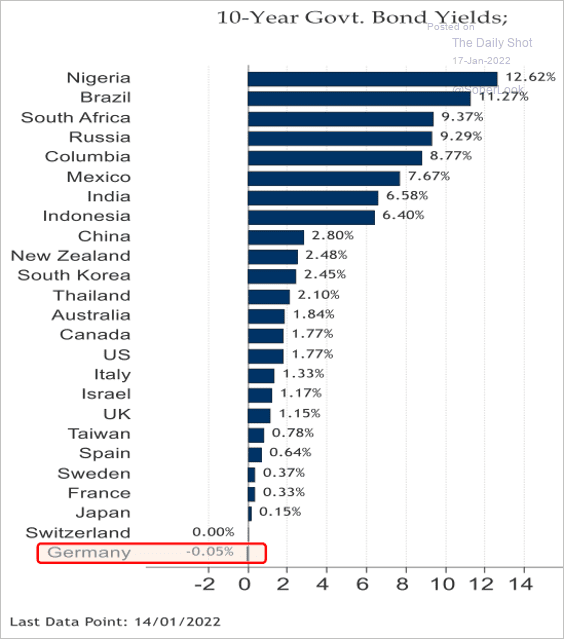 Source: Acorn Macro Consulting Ltd.
——————–
2. Covid lockdown equity winners have decoupled from covid cases.
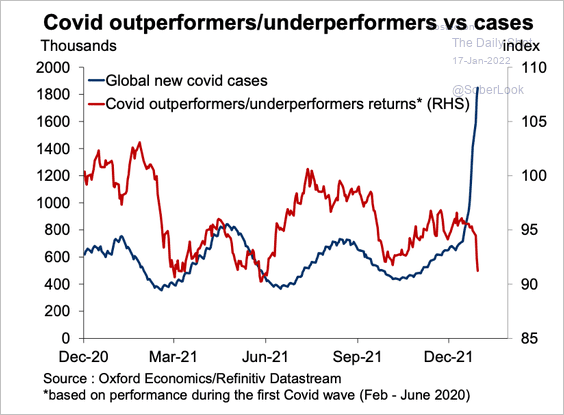 Source: Oxford Economics
3. The pandemic has reset real estate occupancy.
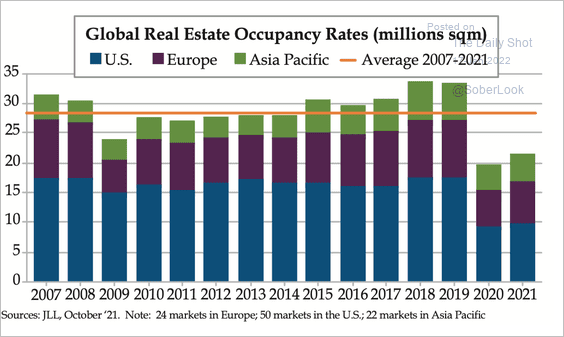 Source: The Weekly Quill
——————–
Food for Thought
1. Office occupancy rates in the US:
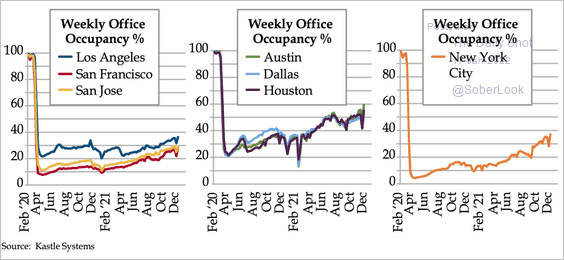 Source: The Weekly Quill
2. Projected employment and GDP growth for US cities:
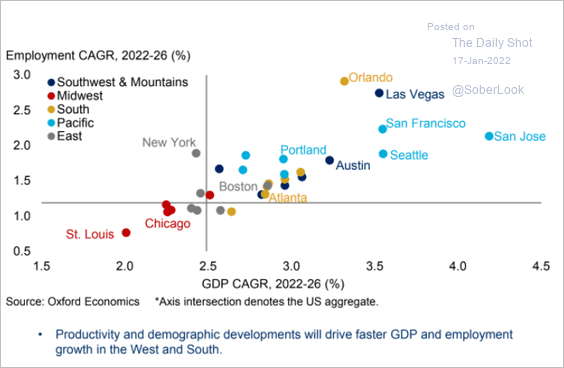 Source: Oxford Economics
3. Having children:
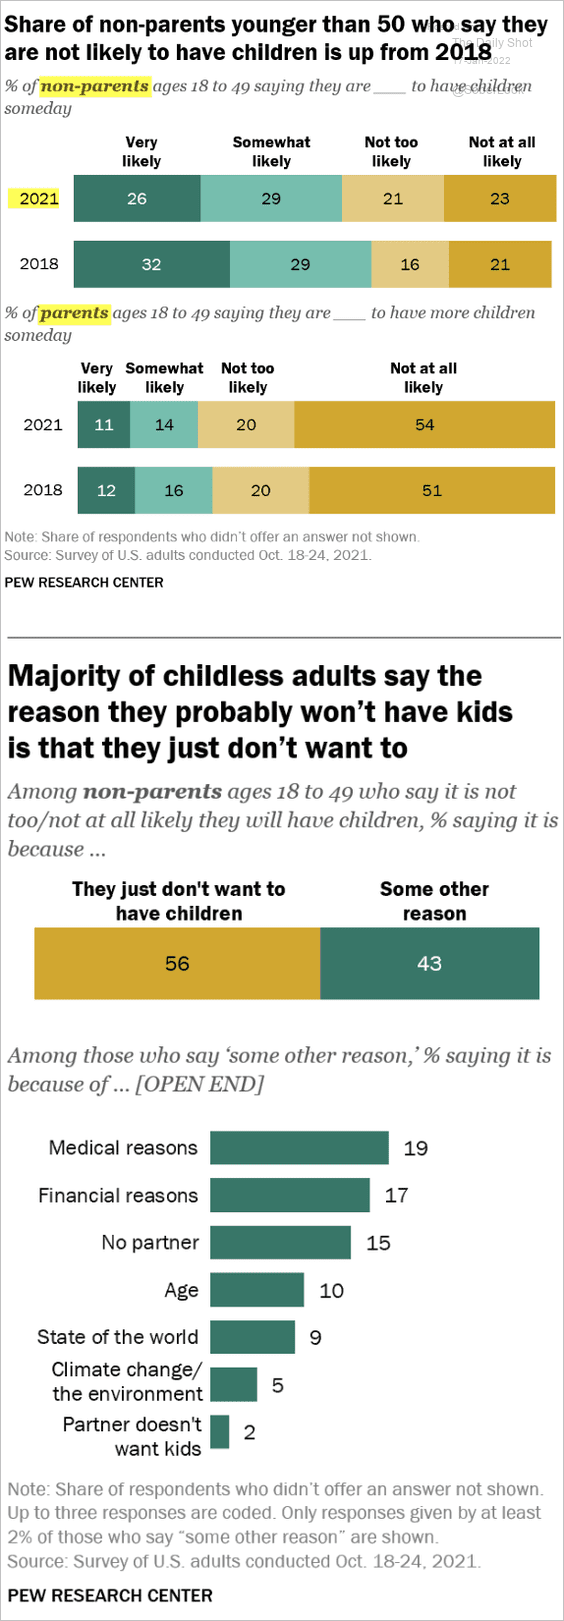 Source: Pew Research Center Read full article
4. Cost of attending a private university vs. median household income:
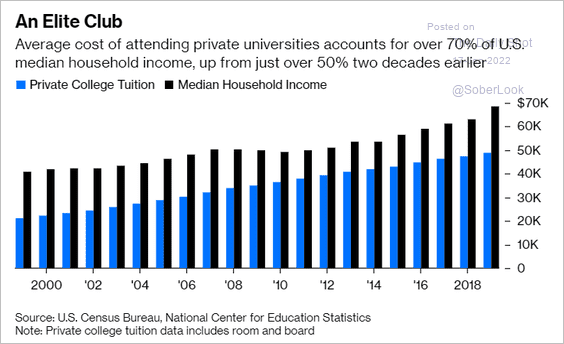 Source: Bloomberg Read full article
5. US hospitals filling up:
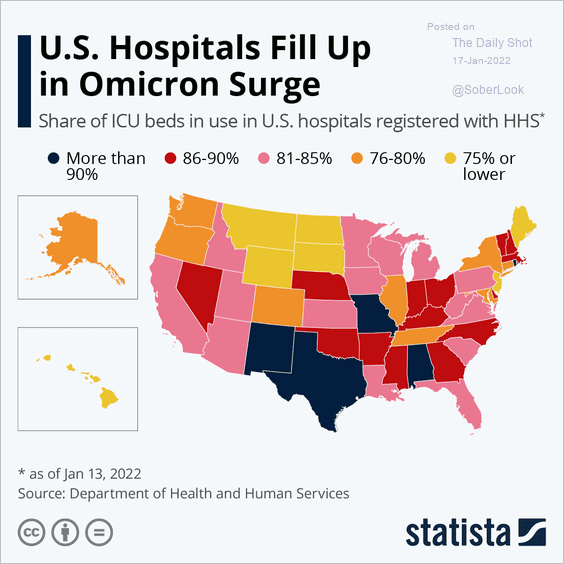 Source: Statista
6. Some US industries hurt by the lack of unauthorized migrants:
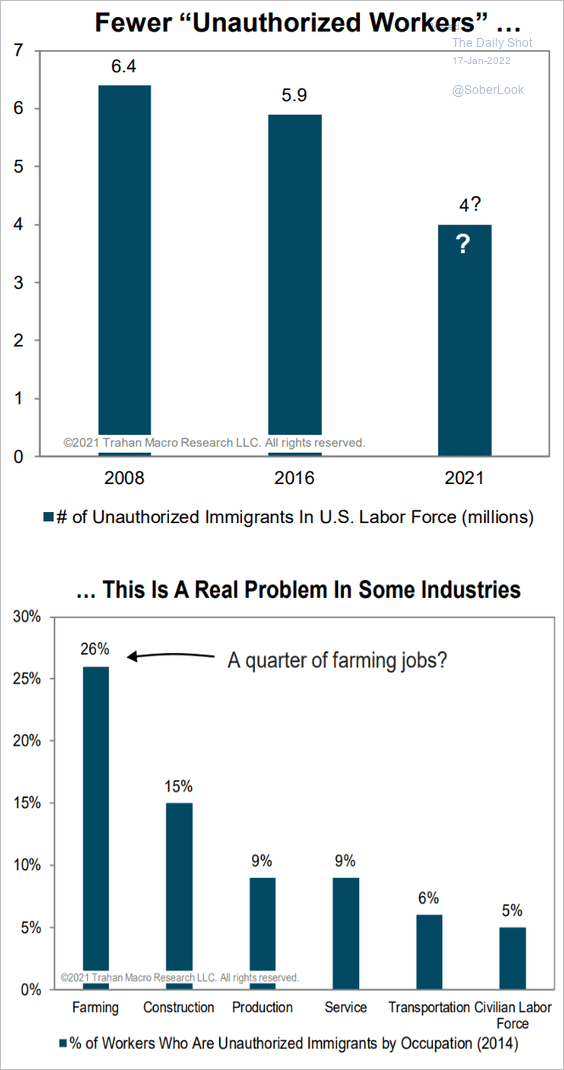 Source: Trahan Macro Research
7. US gun ownership:
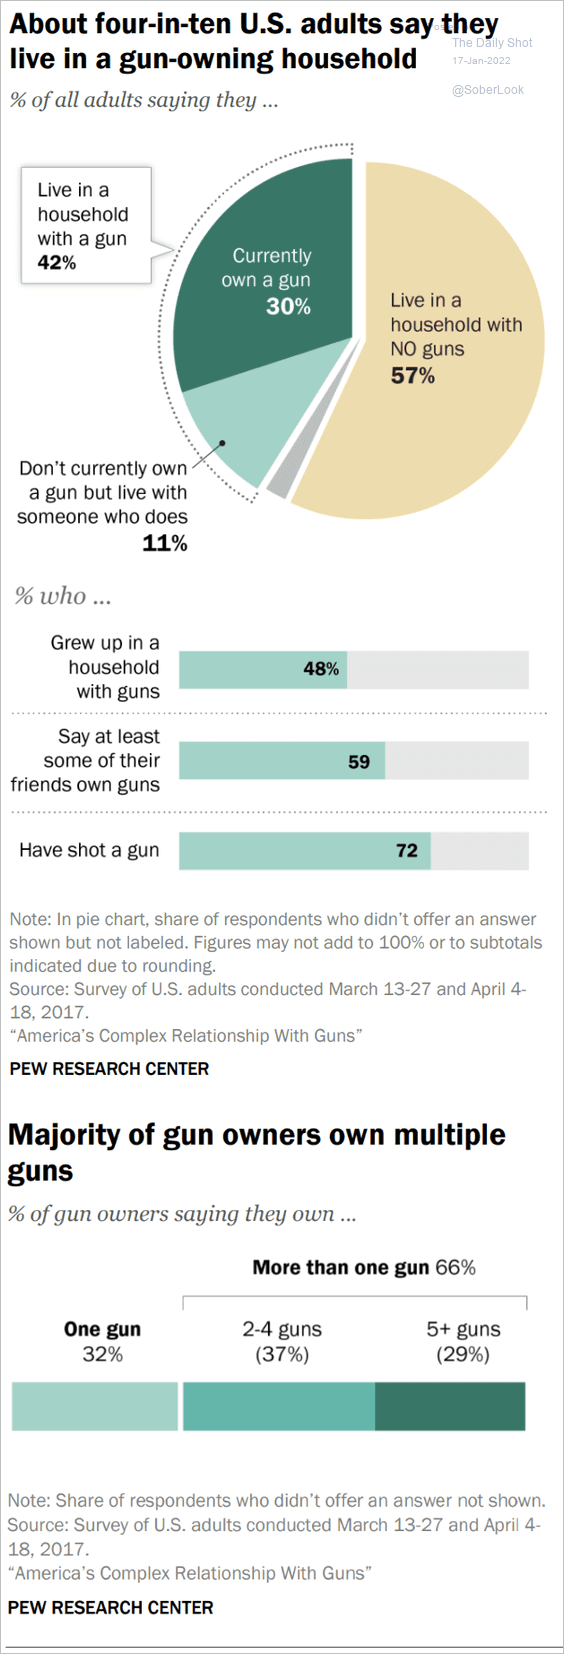 Source: Pew Research Center Read full article
8. US Latino voters:
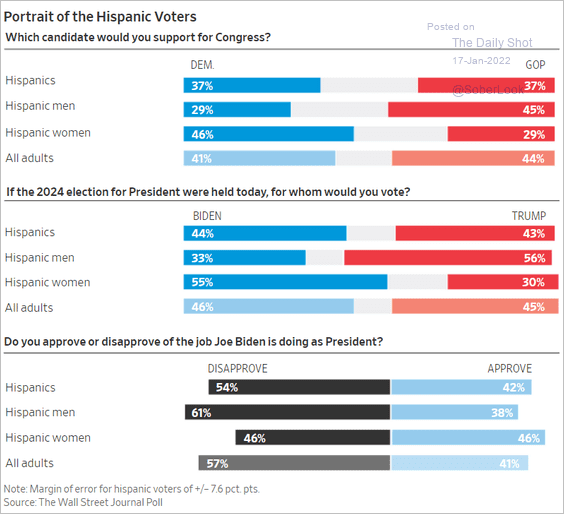 Source: @WSJ Read full article
9. The timeline of the life of Martin Luther King Jr., highlighting interesting/lesser-known facts about the civil rights leader:
 Source: Infojini Read full article
——————–
Back to Index