The Daily Shot: 18-Jan-22
• The United States
• Canada
• The United Kingdom
• The Eurozone
• Europe
• Asia – Pacific
• China
• Emerging Markets
• Cryptocurrency
• Energy
• Equities
• Rates
• Food for Thought
The United States
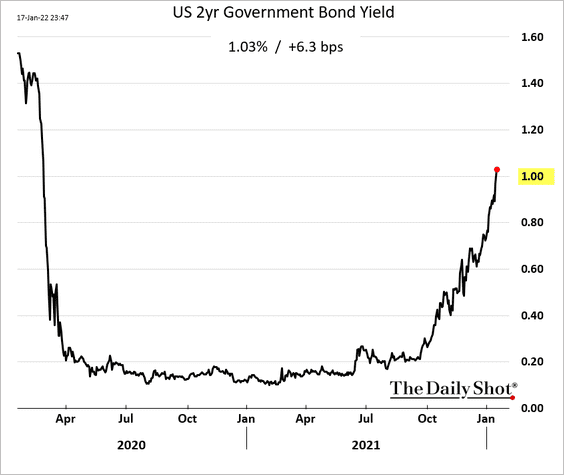
1. The 2-year Treasury yield broke above 1% as the market prices in faster rate hikes ahead.
• A 1% increase this year is now fully priced in.
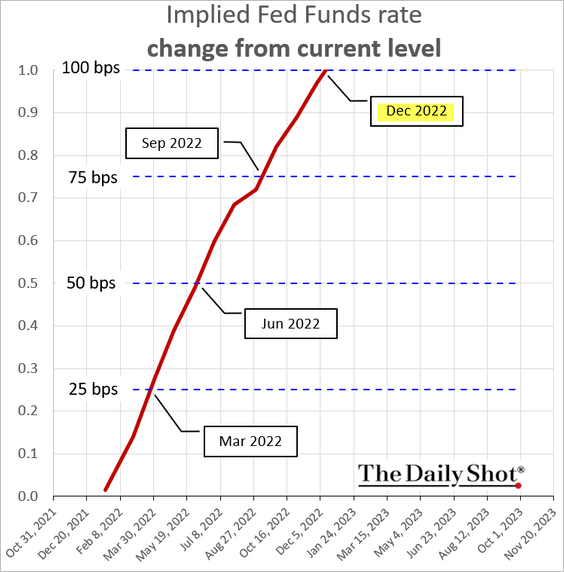
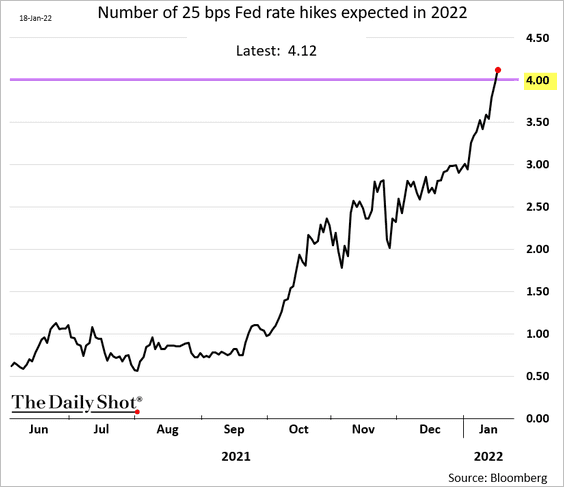
• And the market is starting to price in the possibility of more than four rate increases (or one 50 bps and three 25 bps hikes).
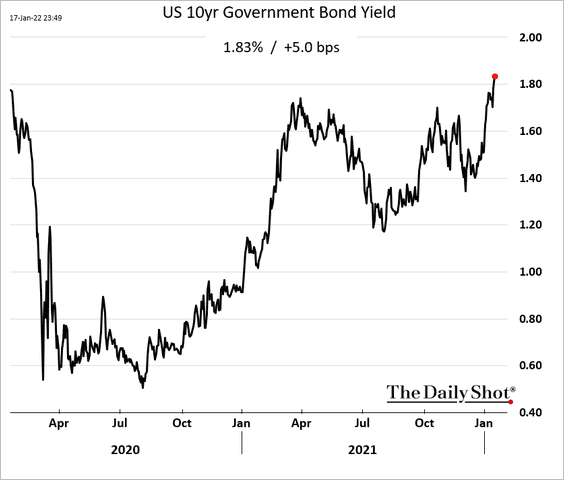
• Longer-dated Treasury yields are rising as well.
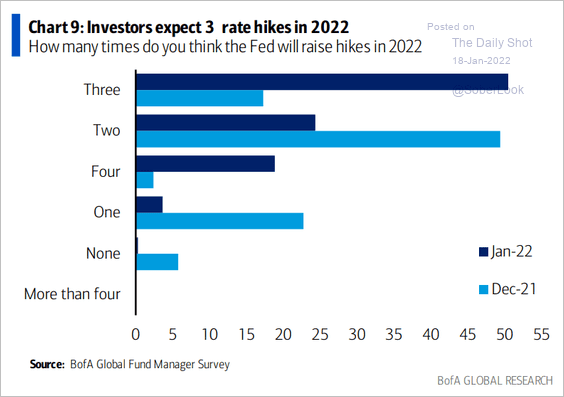
• Most fund managers expect three rate increases this year, according to a survey from BofA.
 Source: BofA Global Research
——————–
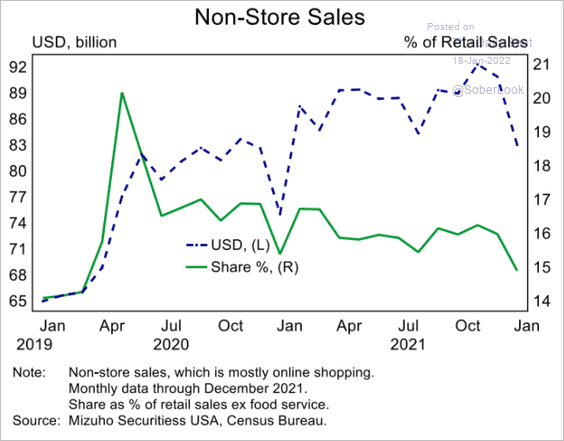
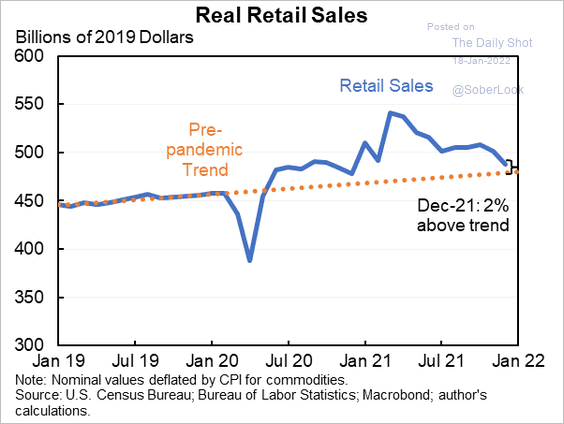
2. Next, we have some more data on the December retail sales report.
• Internet sales dropped sharply as holiday shopping got shifted to earlier months to avoid shipping delays.
 Source: Mizuho Securities USA
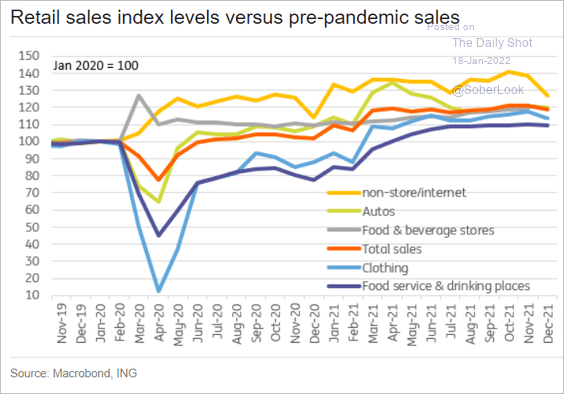
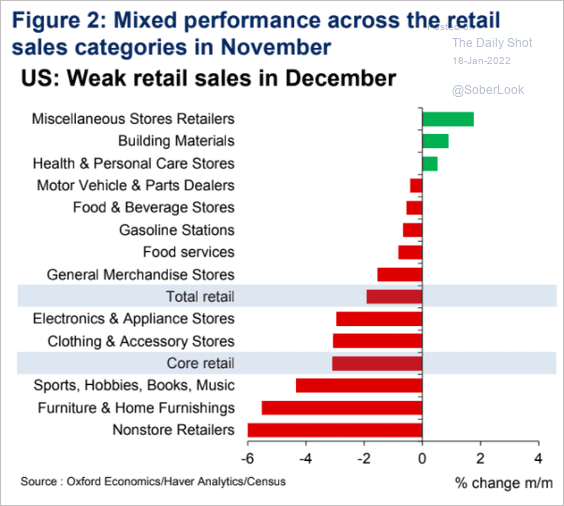
• Here is the breakdown by sector (2 charts):
 Source: ING
 Source: Oxford Economics
• Real retail sales are back to their pre-pandemic trend.
 Source: @jasonfurman
——————–
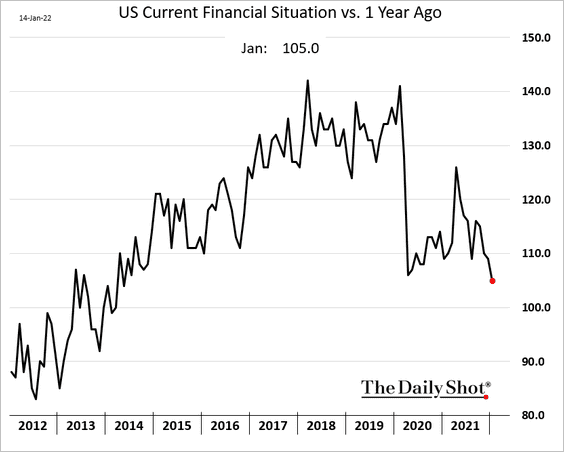
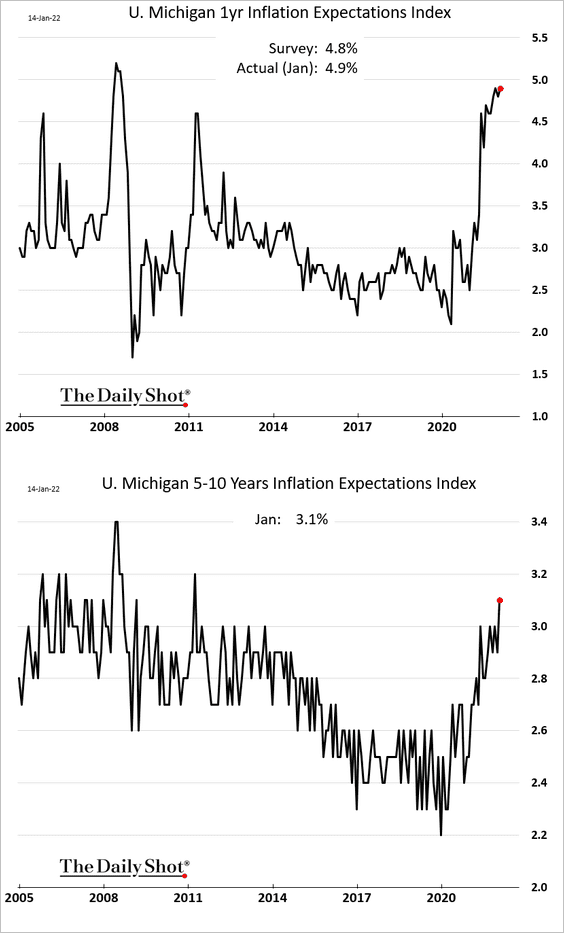
3. The U. Michigan current financial situation index dropped to the lowest point since 2014 due to inflation concerns.
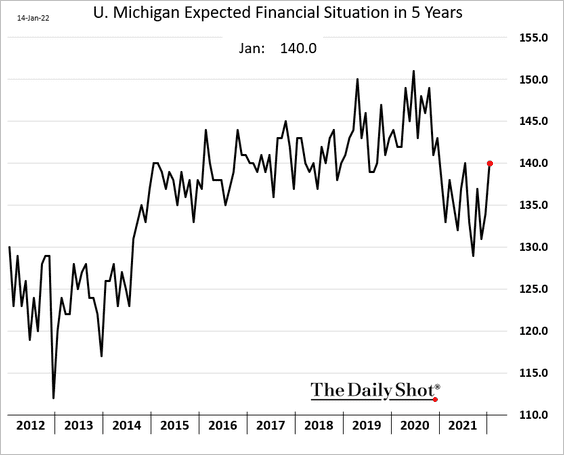
But longer-term expectations improved this month.
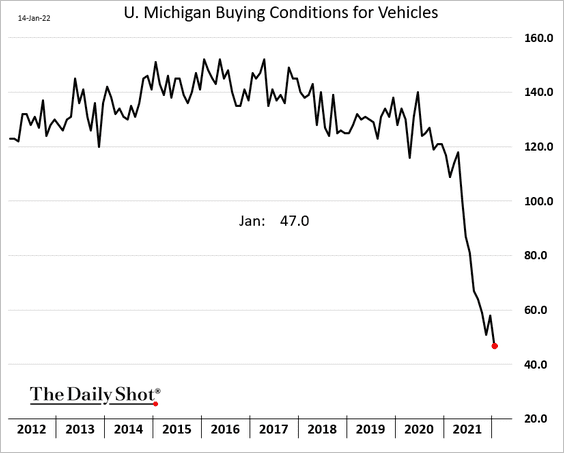
• Buying conditions for vehicles hit a multi-year low.
• Inflation expectations rose.
Will moderation in energy and “food at home” CPI ease inflation expectations?
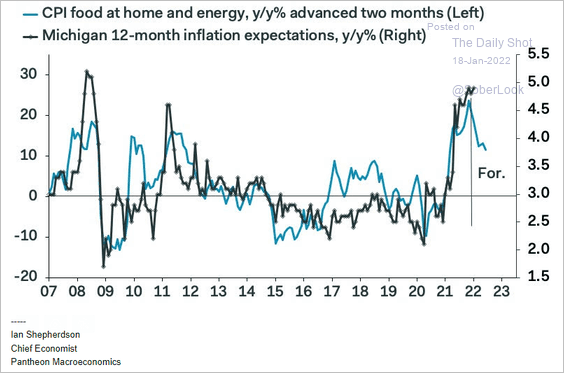 Source: Pantheon Macroeconomics
——————–
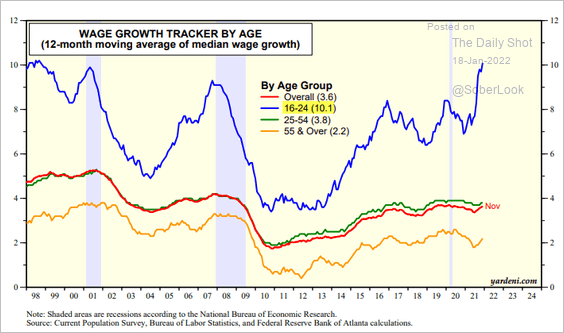
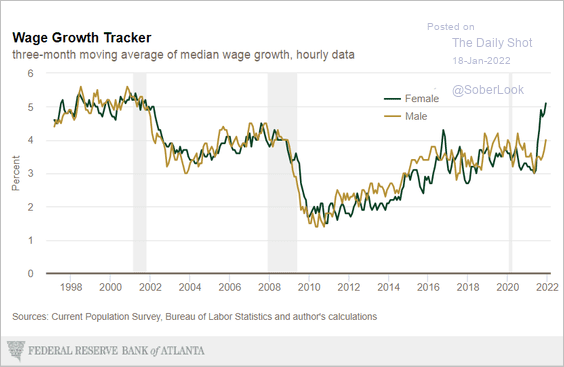
4. The Atlanta Fed’s wage growth tracker hit the highest level in two decades.
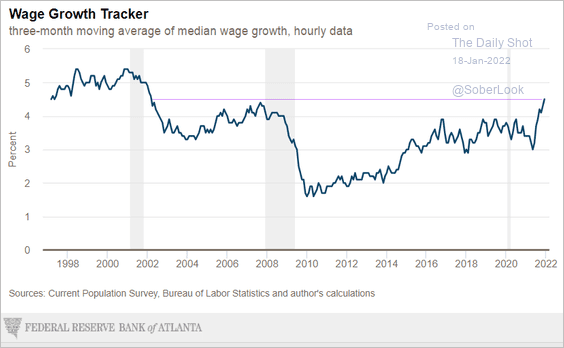
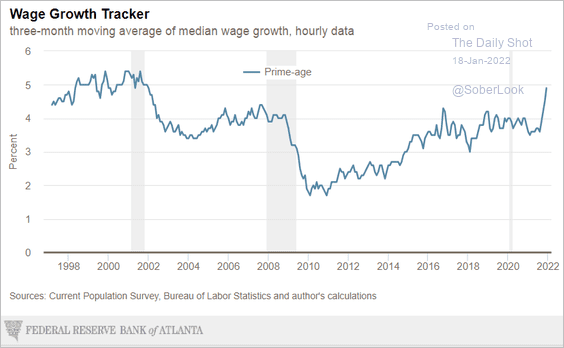
Here are some of the sub-indices.
• Prime-age workers:
• Wage growth by age:
 Source: Yardeni Research
• Wage growth for women and men:
——————–
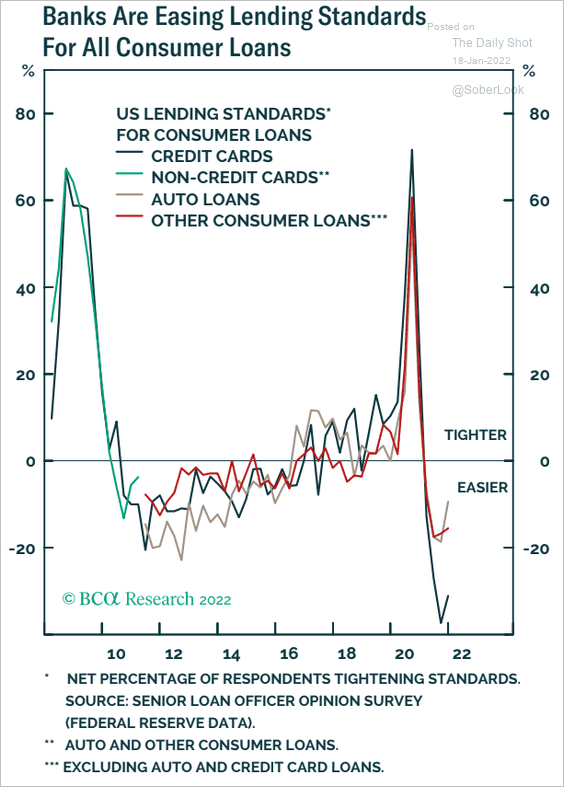
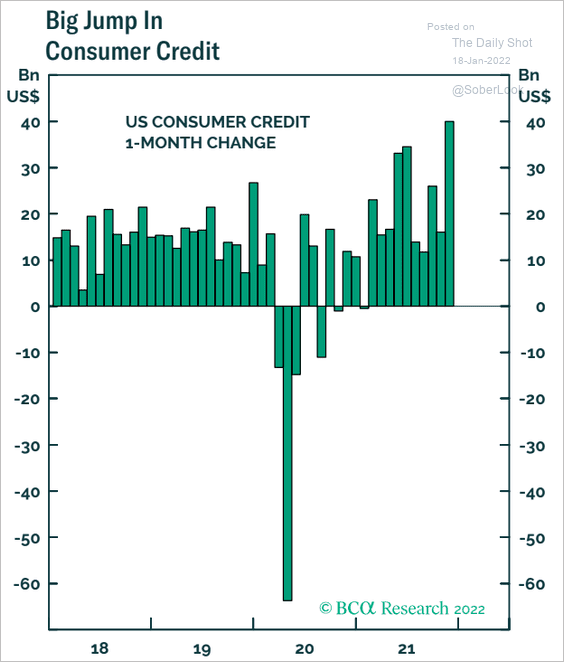
5. Now let’s take a look at some trends in consumer credit.
• Banks have been easing lending standards:
 Source: BCA Research
• Consumer credit is growing as card usage picks up.
 Source: BCA Research
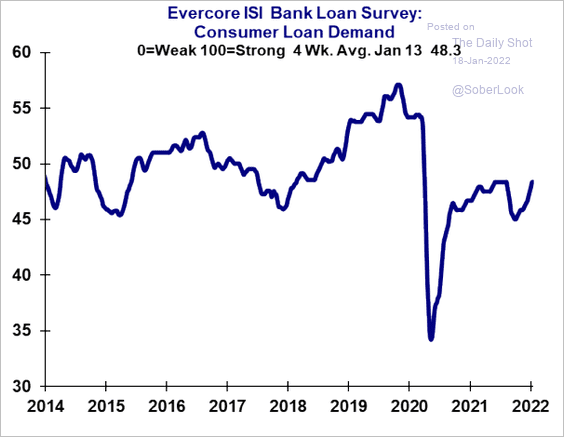
• But consumer loan demand remains well below pre-COVID levels.
 Source: Evercore ISI Research
——————–
6. Finally, here are some updates on supply bottlenecks.
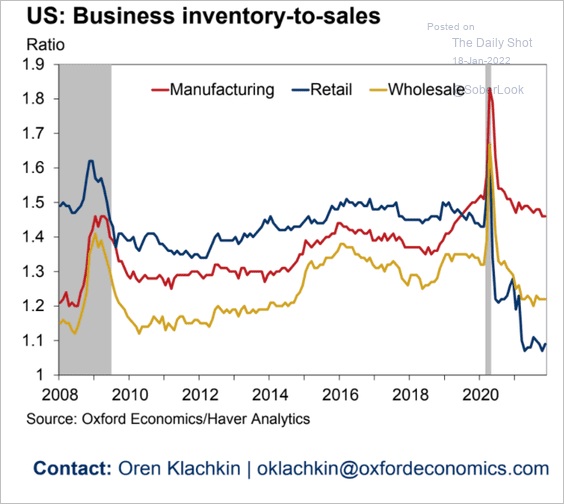
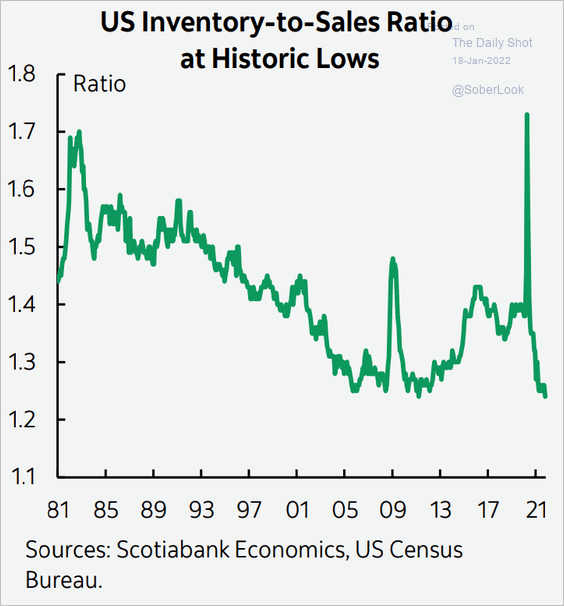
• Inventories-to-sales ratios remained depressed in November (2 charts).
 Source: Oxford Economics
 Source: Scotiabank Economics
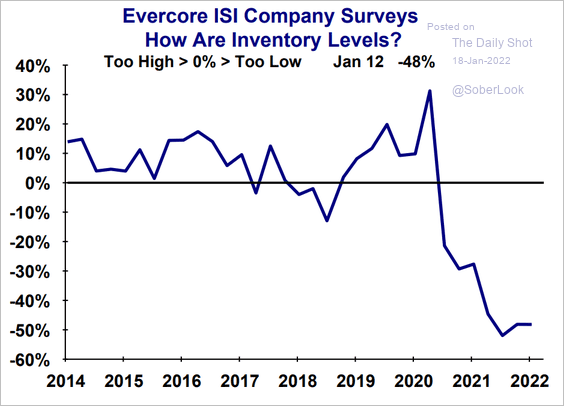
• And according to a survey from Evercore ISI Research, there hasn’t been much improvement in many industries since then.
 Source: Evercore ISI Research
• The West Coast ports remained clogged up.
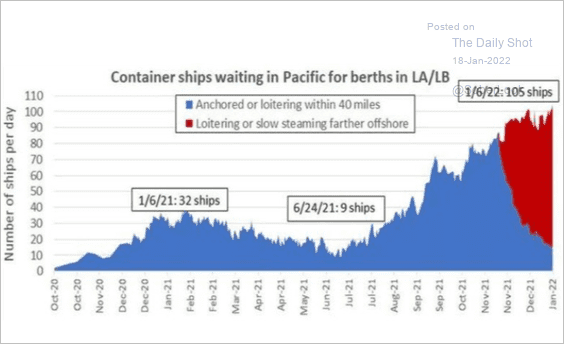 Source: HSBC, Syz Group
• When will supply chain issues ease?
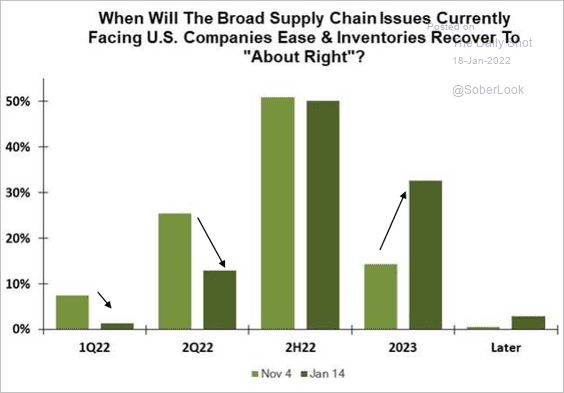 Source: Evercore ISI Research
Back to Index
Canada
1. Will we see a BoC hike next week? The market is pricing in a 70%+ probability of such an outcome.
 Source: Bloomberg Read full article
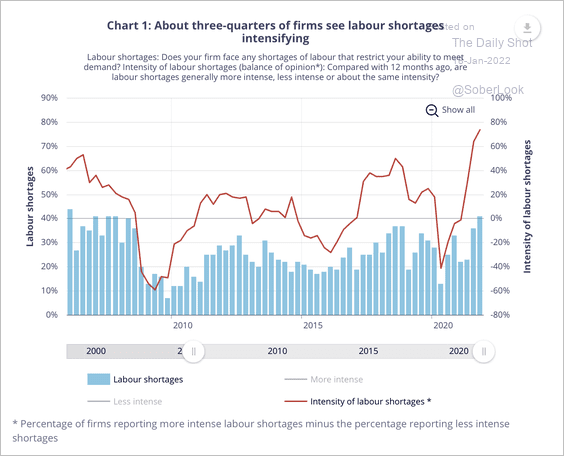
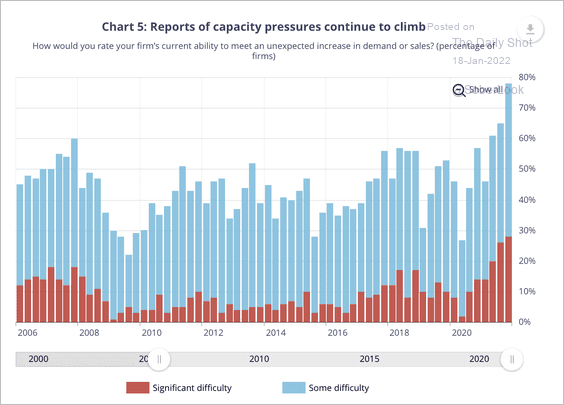
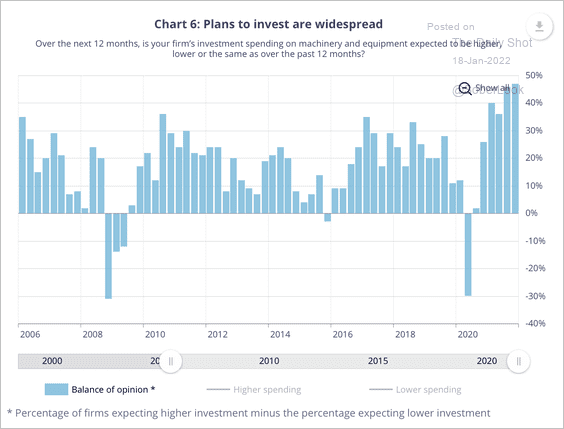
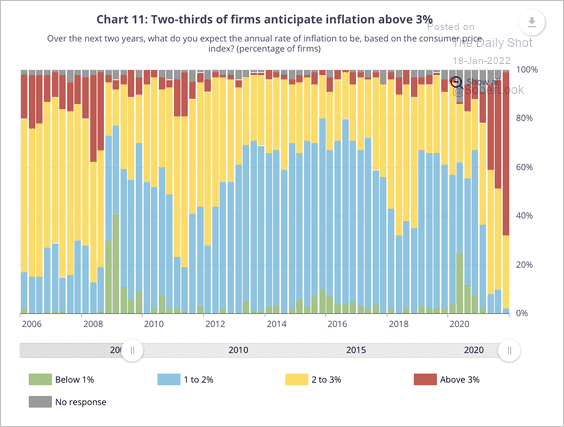
2. The BoC business outlook indicator hit a new high last quarter.
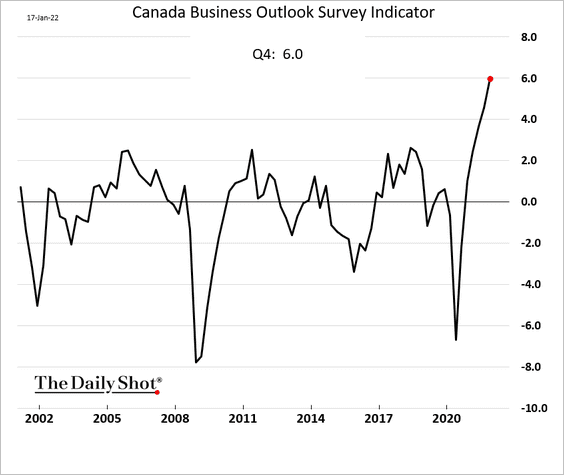
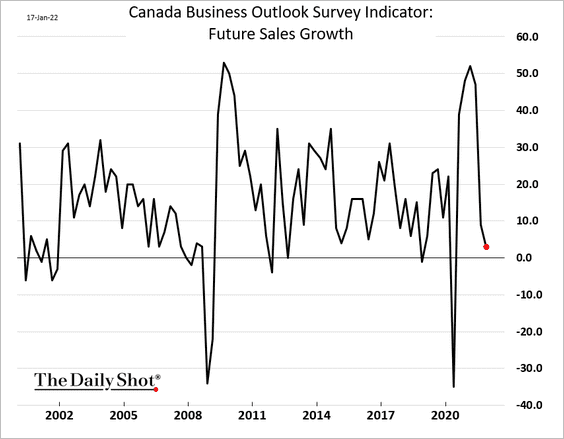
But sales growth expectations have been moderating.
• More businesses are reporting intense labor shortages over the past year, which is placing upward pressure on wages.
 Source: Bank of Canada Read full article
• More than three-quarters of firms said they would have difficulty meeting an unexpected increase in demand.
 Source: Bank of Canada Read full article
• Strong demand and capacity pressures support solid investment intentions.
 Source: Bank of Canada Read full article
• Inflation expectations are elevated – no longer seen as transitory.
 Source: Bank of Canada Read full article
——————–
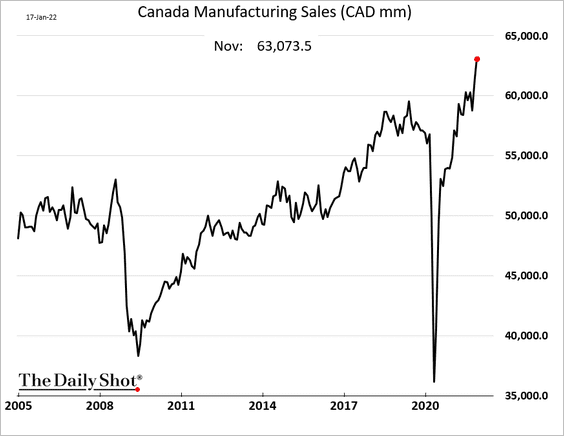
3. Manufacturing sales hit a record high in November.
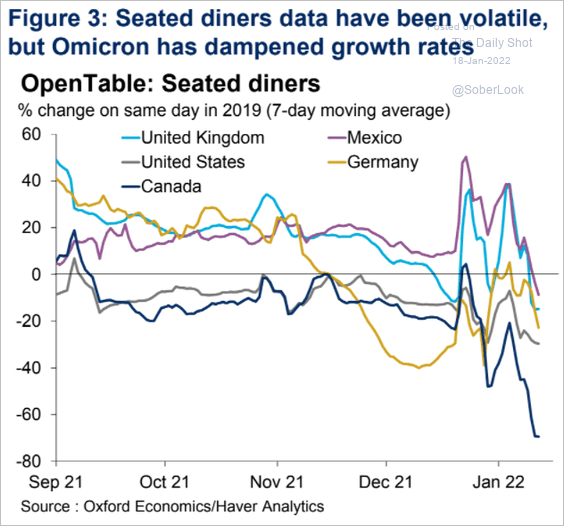
4. Canada’s omicron-driven drop in mobility has been more severe than in other economies.
 Source: Oxford Economics
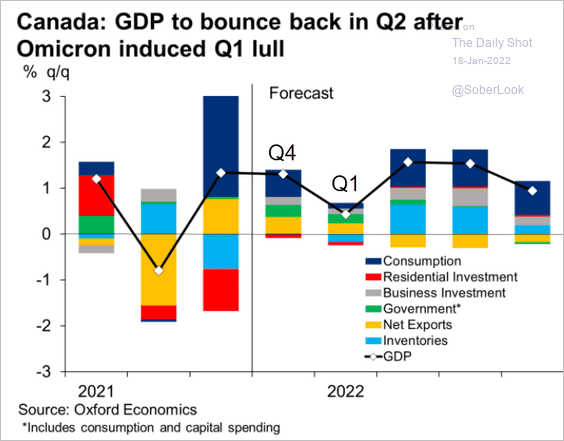
As a result, the nation’s GDP growth will slow this quarter. But according to Oxford Economics, the economy will rebound in Q2.
 Source: Oxford Economics
——————–
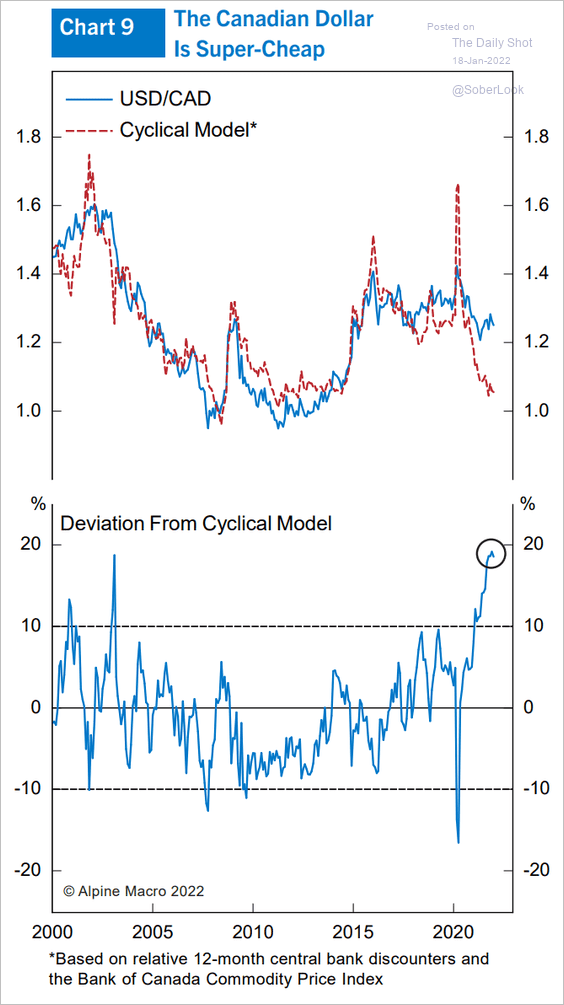
5. The Canadian dollar is cheap, according to Alpine Macro (chart shows USD as expensive relative to CAD).
 Source: Alpine Macro
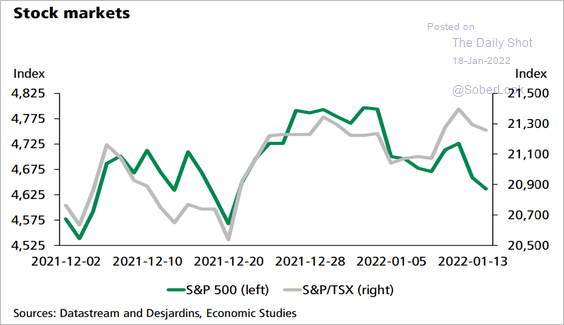
6. Canadian stocks have been outperforming the US recently as growth sectors slump and energy prices climb.
 Source: Desjardins
Back to Index
The United Kingdom
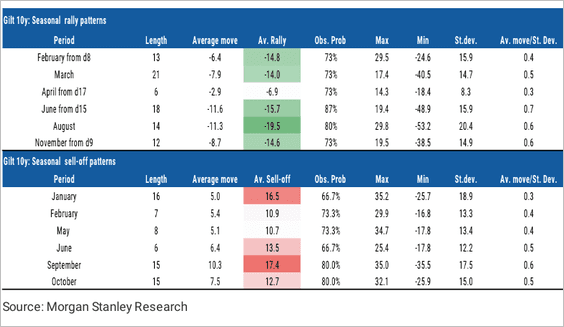
1. Higher 10-year gilt yields are supported by January seasonality.
 Source: Morgan Stanley Research
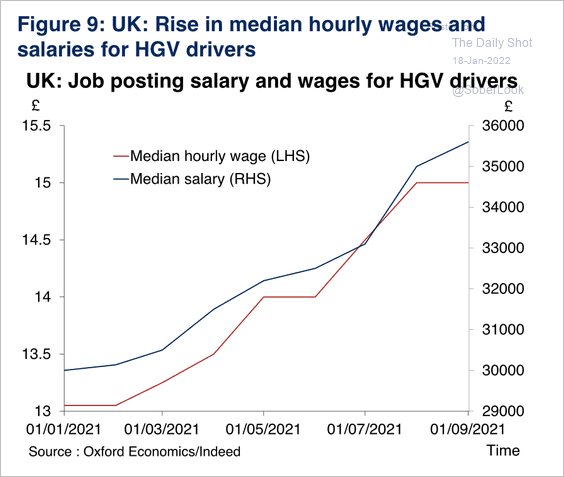
2. Haulage companies have raised pay to attract more applicants.
 Source: Oxford Economics
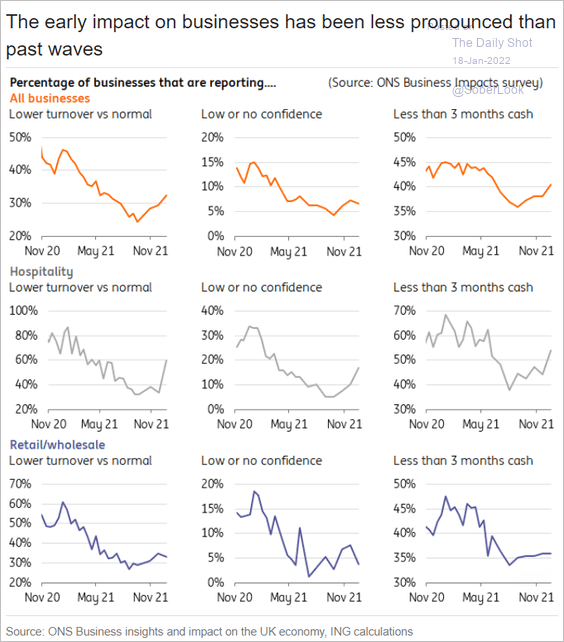
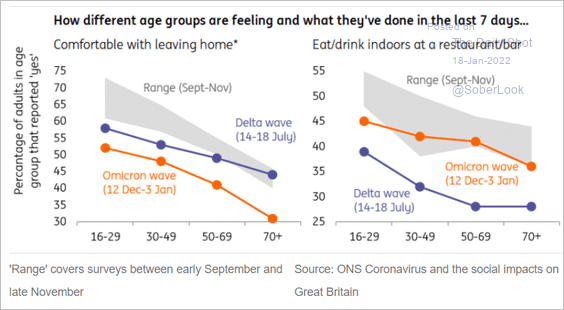
3. Omicron’s impact on businesses has been less severe than during previous COVID waves.
 Source: ING
Here are some mobility indicators by age.
 Source: ING
Back to Index
The Eurozone
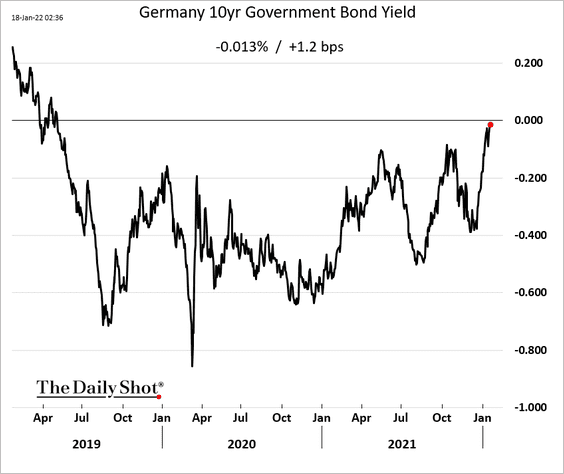
1. The 10yr Bund yield is about to move into positive territory.
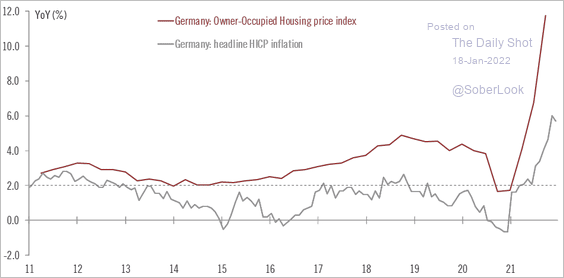
2. German home price appreciation accelerated last year.
 Source: @fwred
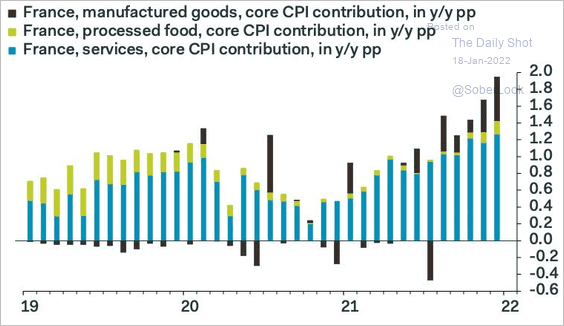
3. This chart shows the key contributions to French consumer inflation.
 Source: Pantheon Macroeconomics
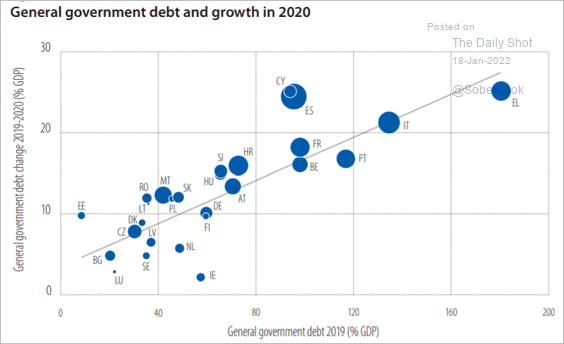
4. Next, we have the pandemic-era government debt growth vs. debt levels (as a share of GDP).
 Source: EIB Read full article
Back to Index
Europe
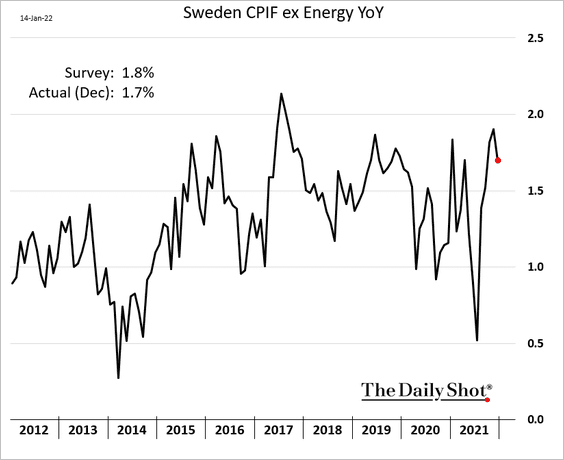
1. Sweden’s CPI is holding below 2%.
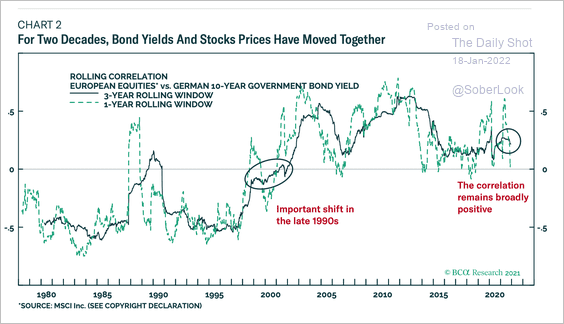
2. Since the 1990s, European shares have moved positively with bond yields.
 Source: BCA Research
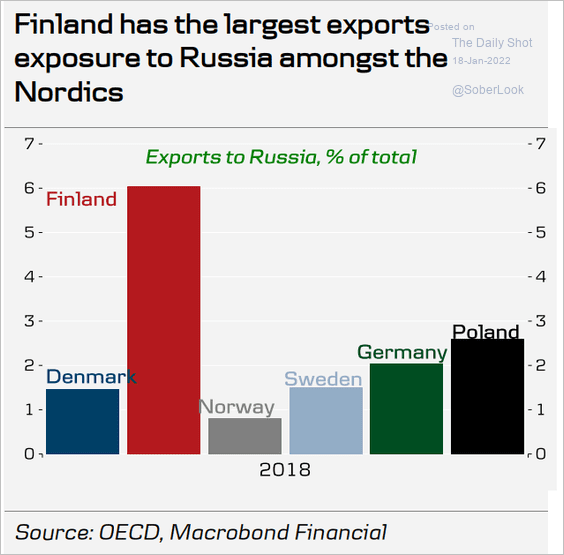
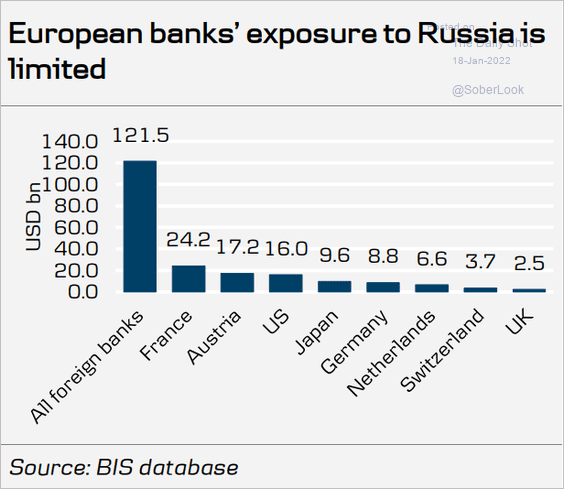
3. What is Western Europe’s exposure to Russia?
• Exports:
 Source: Danske Bank
• Bank credit:
 Source: Danske Bank
Back to Index
Asia – Pacific
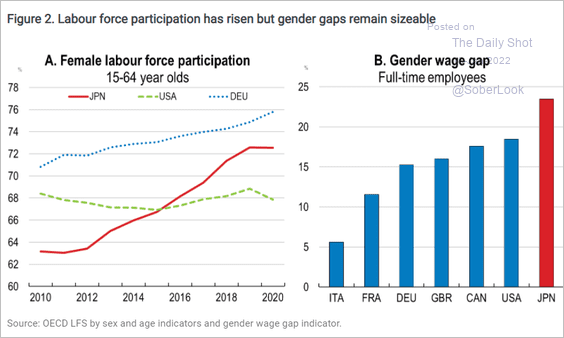
1. Here is Japan’s female labor force participation and the wage gap.
 Source: OECD Read full article
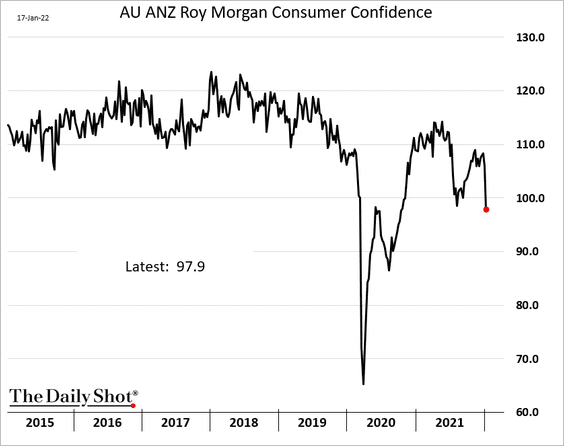
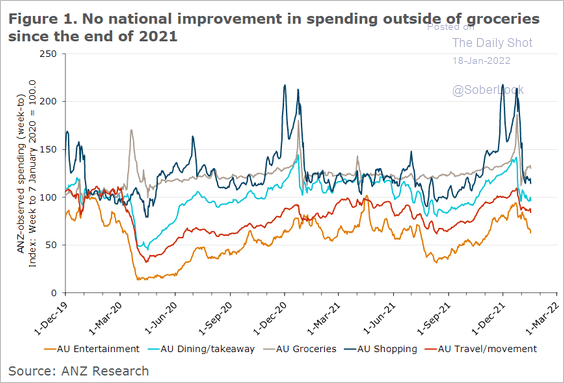
2. Next, we have some updates on Australia.
• Consumer confidence (sharp deterioration as omicron surged):
• Retail spending:
 Source: ANZ Research
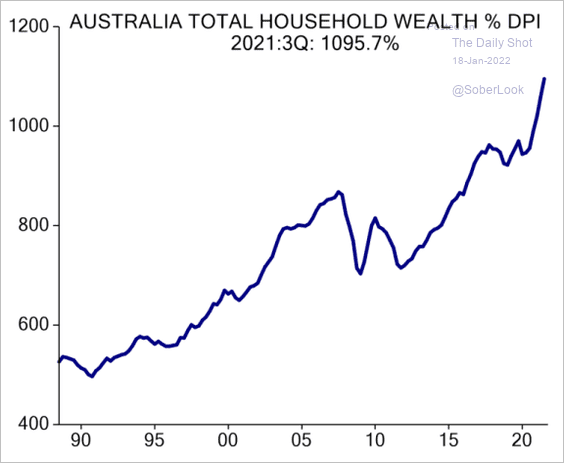
• Household wealth as a share of disposable income:
 Source: Evercore ISI Research
Back to Index
China
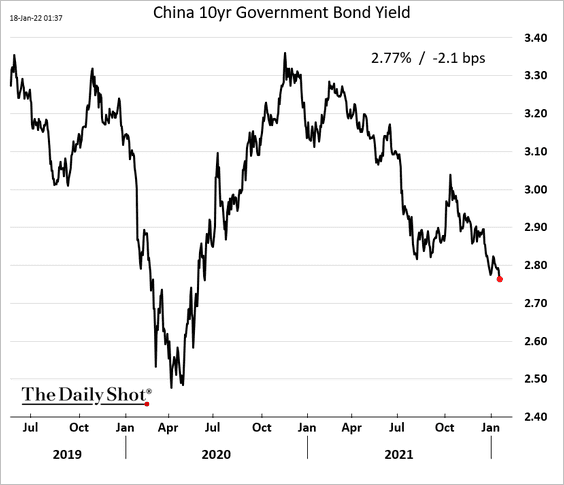
1. China’s bond yields continue to fall, …
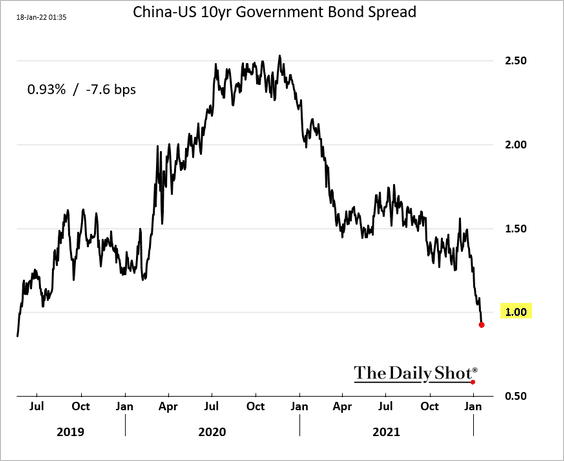
… with the China-US 10-year spread dipping below 1% for the first time since 2019, as monetary policies diverge.
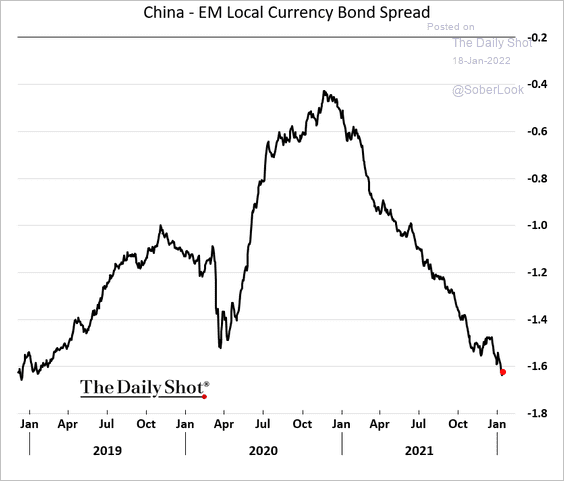
Here is the China-EM local currency bond spread.
 h/t @karllesteryap
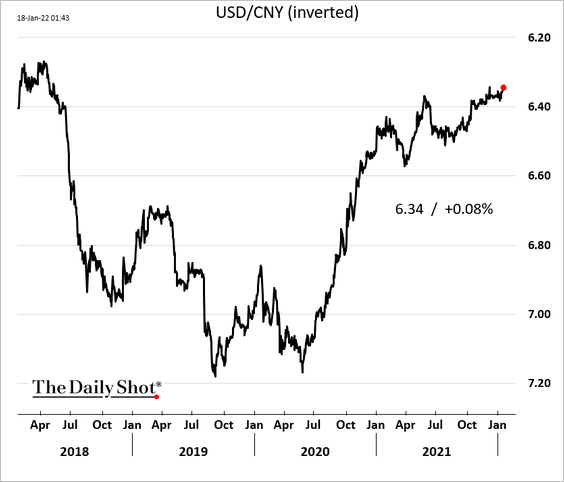
And yet, the renminbi is near the highest level vs. USD since 2018.
——————–
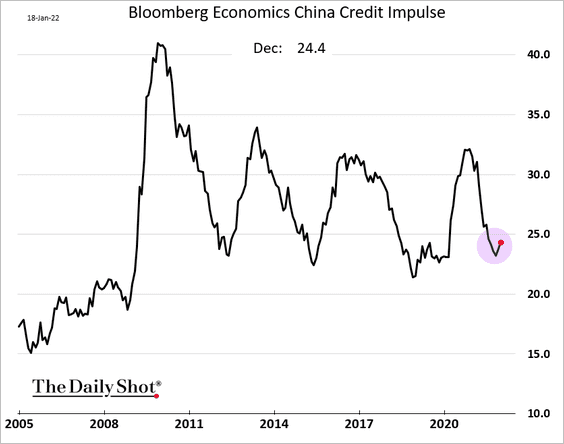
2. China’s credit impulse has bottomed.
 Source: Bloomberg
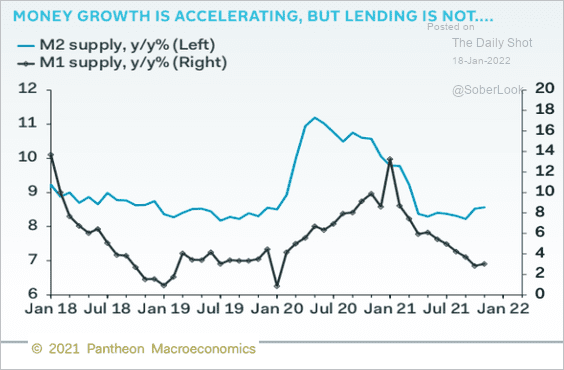
Government debt issuance has been propping up credit expansion.
 Source: Pantheon Macroeconomics
——————–
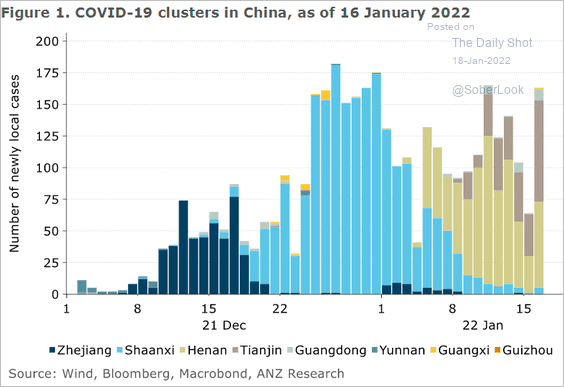
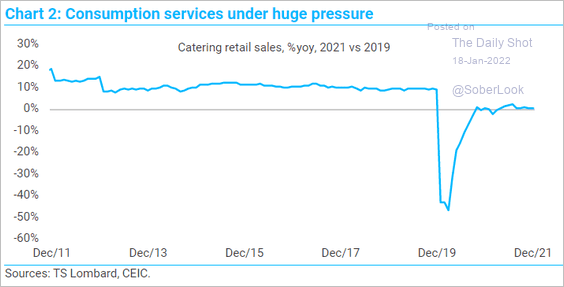
3. COVID clusters continue to pop up, …
 Source: ANZ Research
… which is a drag on consumer-facing businesses.
 Source: TS Lombard
——————–
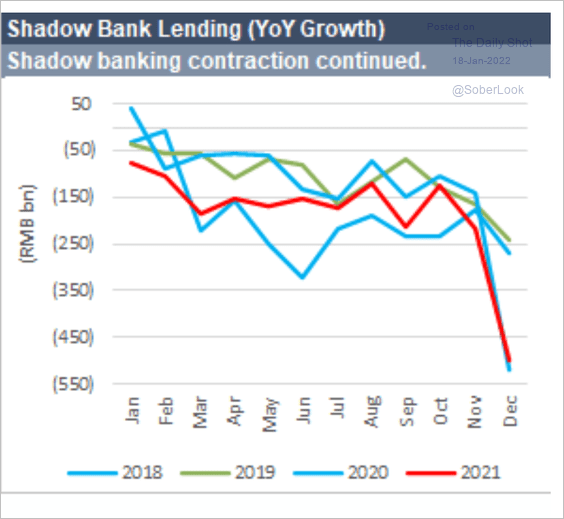
4. Chinese shadow bank lending continues to contract.
 Source: CreditSights
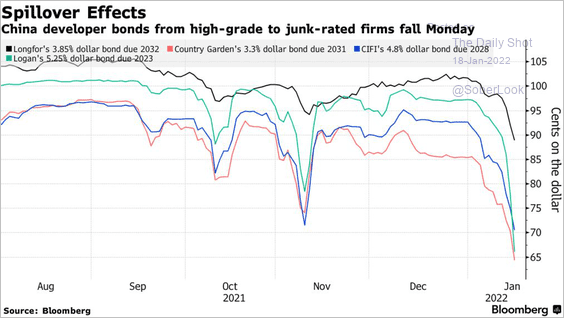
5. Developers’ bonds remain under pressure.
 Source: @markets Read full article
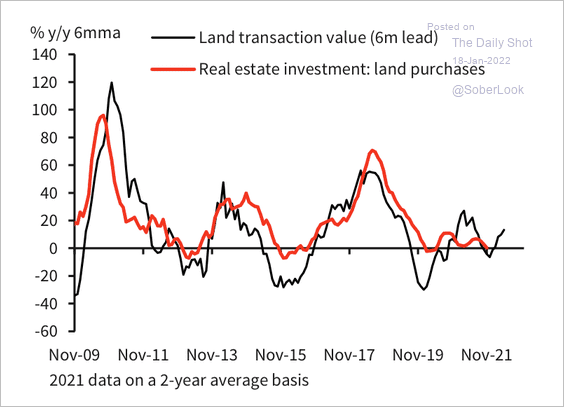
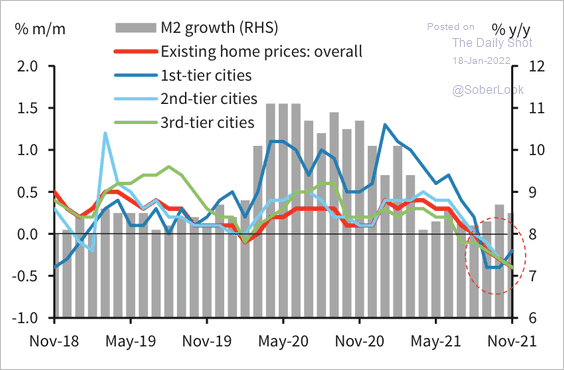
But land transactions are starting to improve.
 Source: Barclays Research
The decline in home prices has narrowed in tier-1 cities.
 Source: Barclays Research
——————–
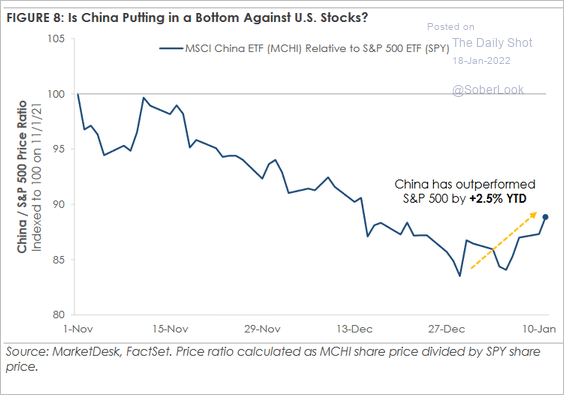
6. Has China’s stock market bottomed relative to the US?
 Source: MarketDesk Research
Back to Index
Emerging Markets
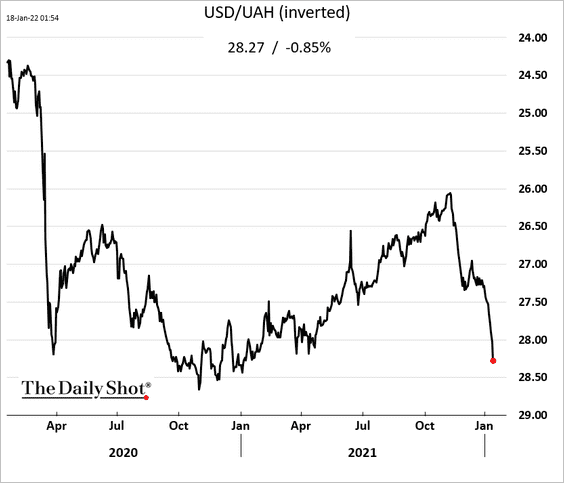
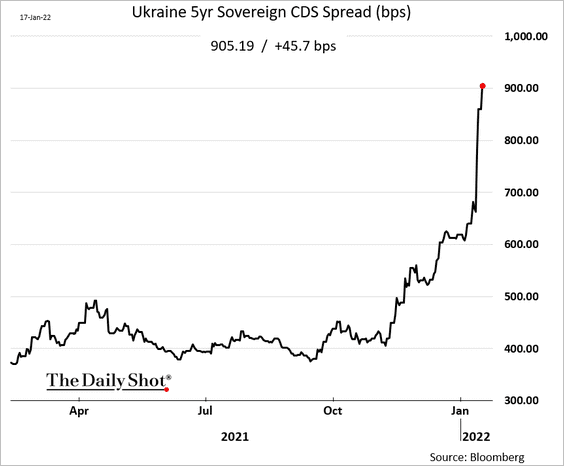
1. The market is pricing in a higher risk of a Russia-Ukraine military conflict.
• Ukraine’s currency (the hryvnia):
• Ukraine’s sovereign CDS spread:
• Russian bond spread relative to other EM debt:
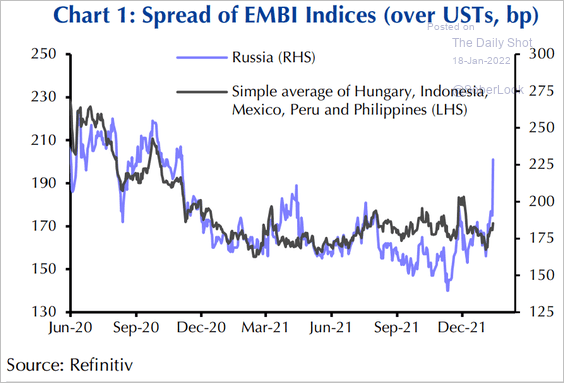 Source: Capital Economics
——————–
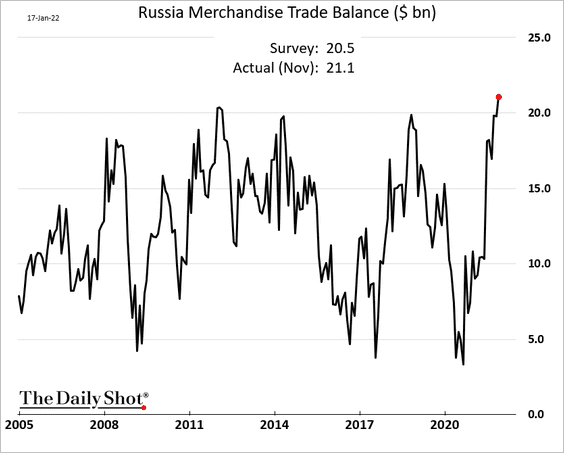
2. Russia’s trade surplus hit a record high as energy prices surge.
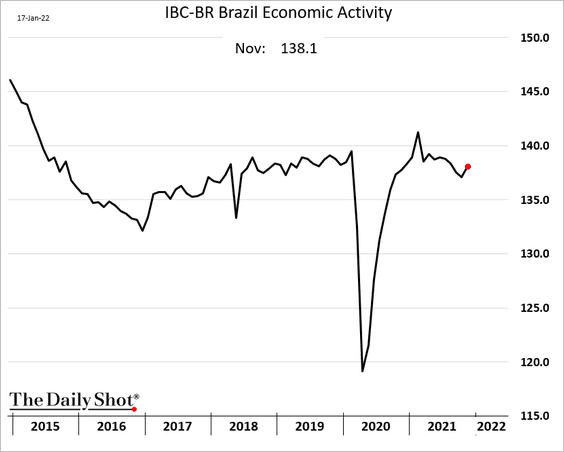
3. Brazil’s economic activity improved in November.
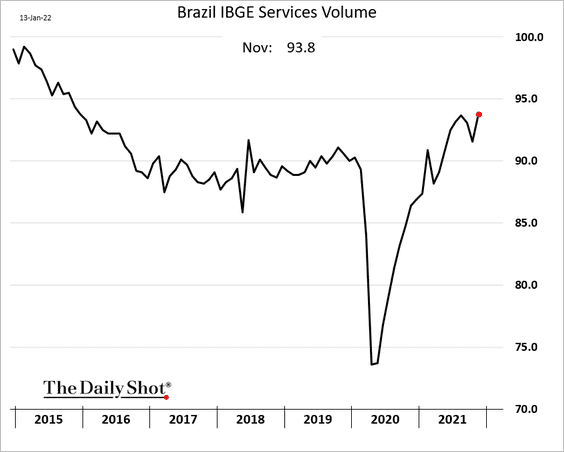
Service output hit a multi-year high.
——————–
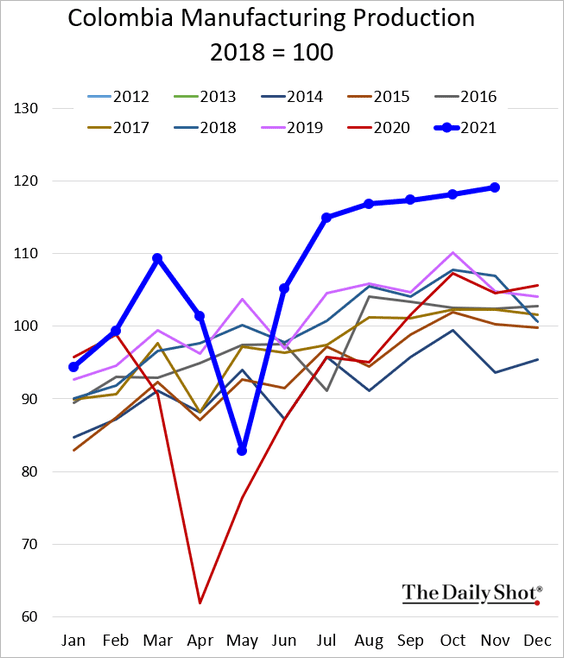
4. Colombia’s manufacturing production continues to hit record highs.
Back to Index
Cryptocurrency
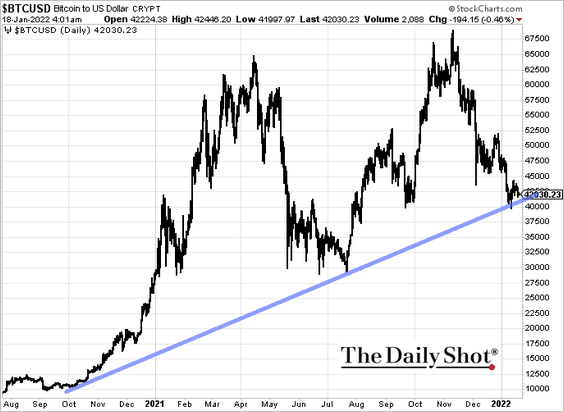
1. Bitcoin continues to hold support.
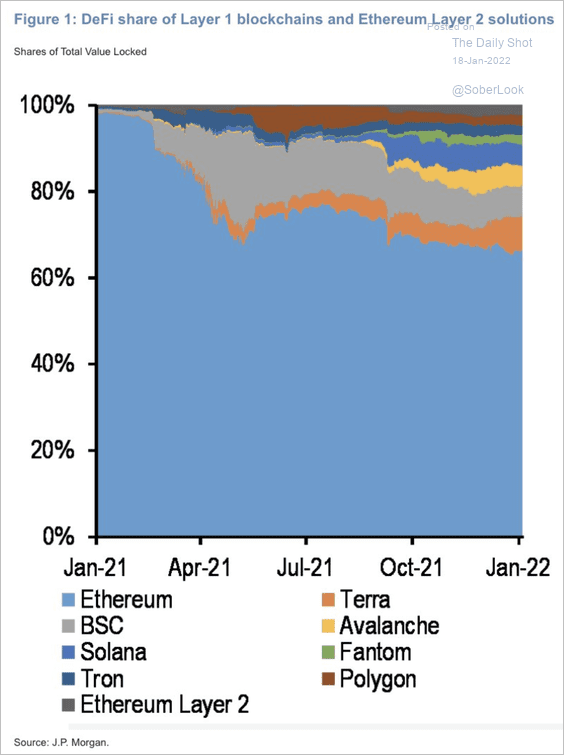
2. Growing demand for decentralized finance (DeFi) services on the Ethereum blockchain has fueled a series of upgrades and new solutions.
 Source: JP Morgan Research
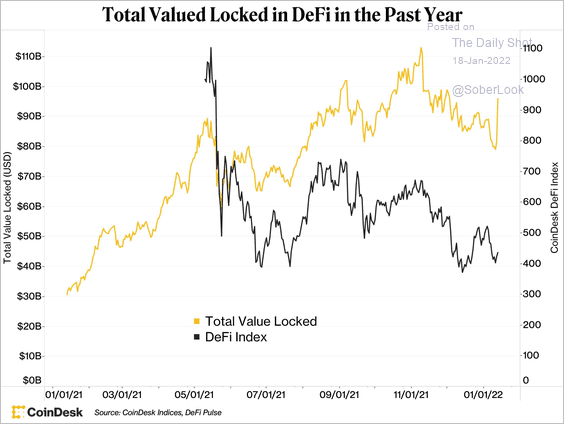
3. Total value locked in DeFi is rising despite the retreat in related crypto prices.
 Source: CoinDesk
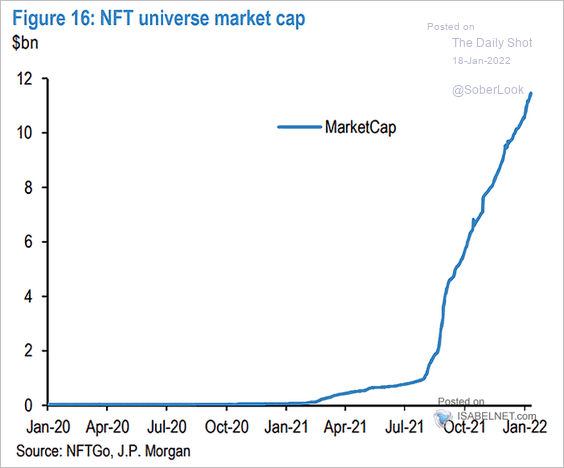
4. This chart shows the total NFT market cap.
 Source: @ISABELNET_SA, @jpmorgan
Back to Index
Energy
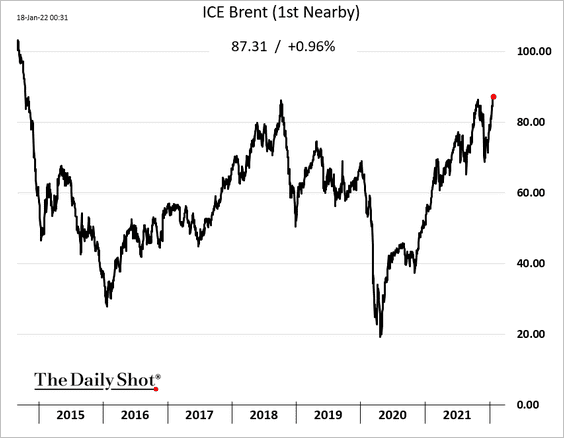
1. Brent futures are near the highest level since 2014.
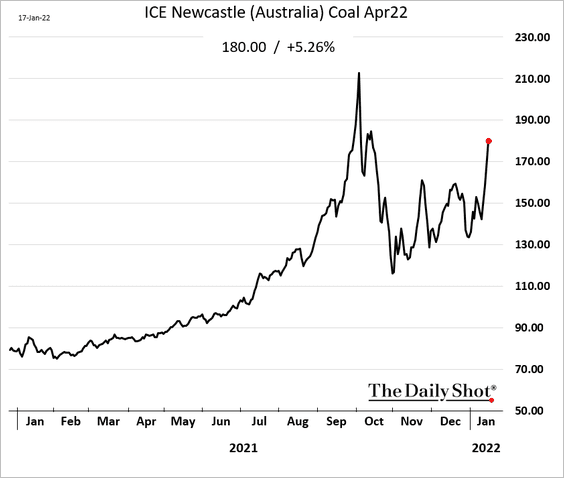
2. Coal prices have been surging.
 h/t Walter
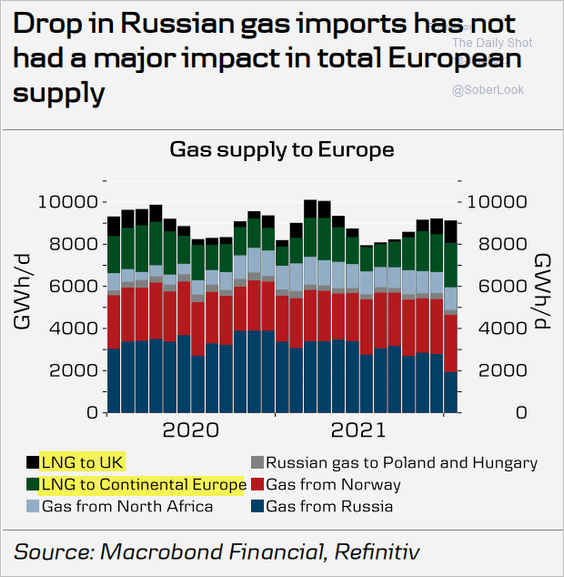
3. Europe has been able to replace lost natural gas imports from Russia with LNG.
 Source: Danske Bank
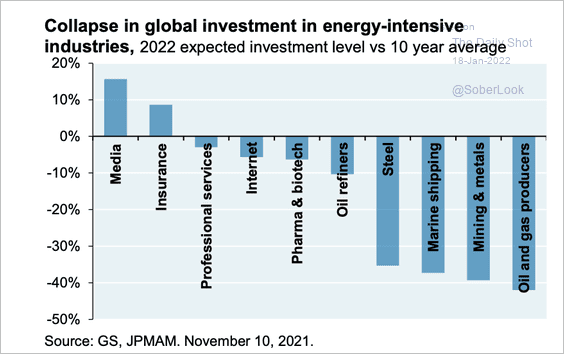
4. Energy-intensive industries have seen the biggest drop in investment.
 Source: J.P. Morgan Asset Management
Back to Index
Equities
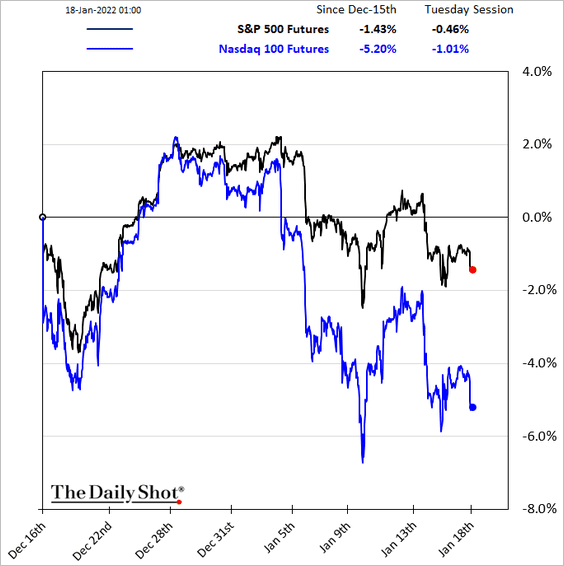
1. US real yields are surging …
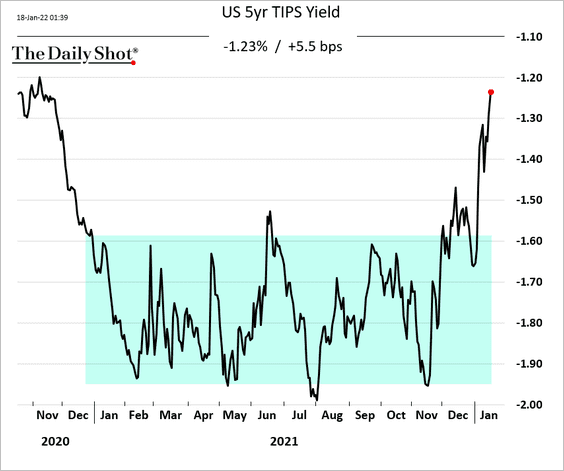
… and putting pressure on stocks this morning.
——————–
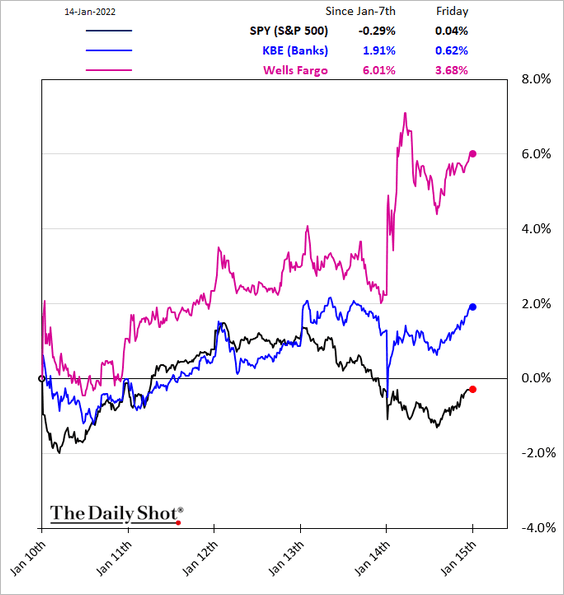
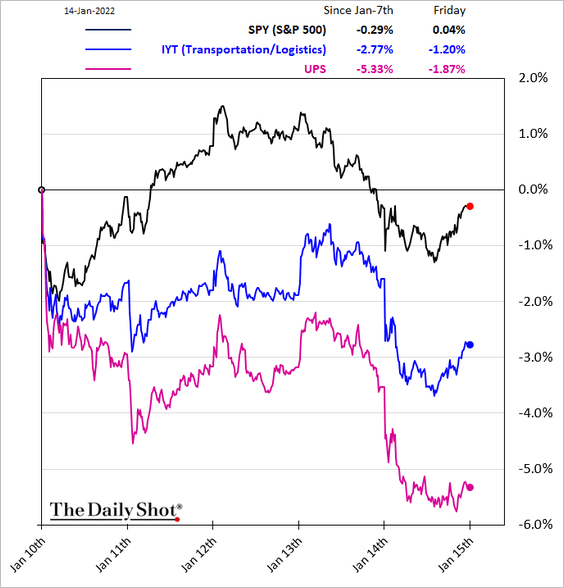
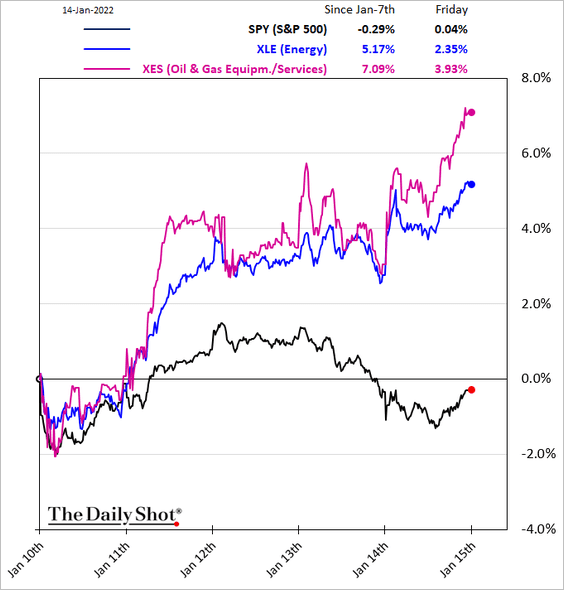
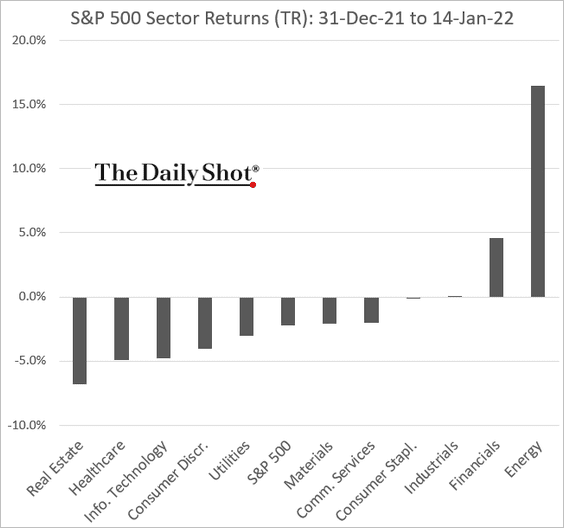
2. Next, let’s take a look at some sector trends.
• Banks:
• Transportation/logisitcs:
• Energy:
• Month-to-date performance by sector:
• Which sectors are month-to-date winners and losers globally?
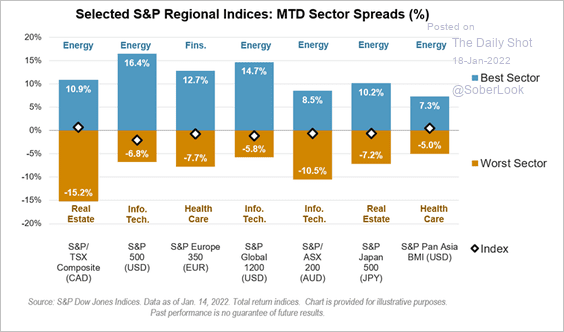 Source: S&P Global Market Intelligence
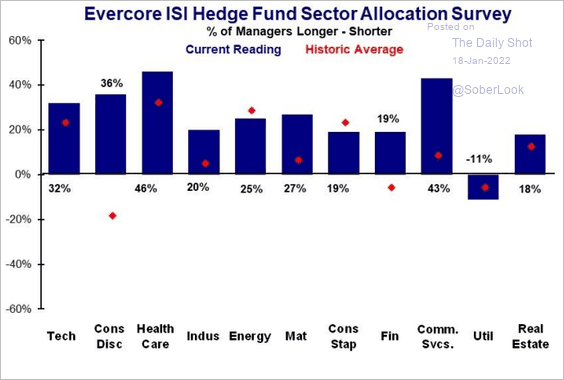
• Hedge funds’ sector allocations relative to historical averages:
 Source: Evercore ISI Research
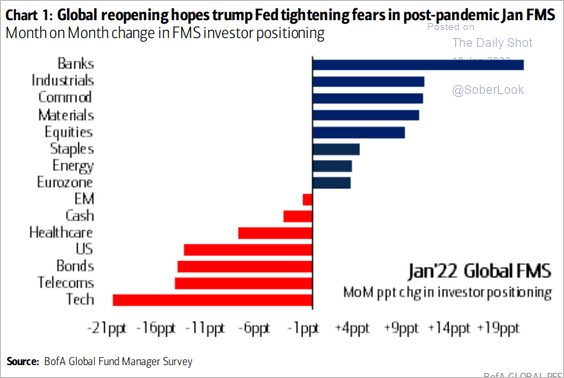
• Fund managers’ positioning changes (risk-on!):
 Source: BofA Global Research
——————–
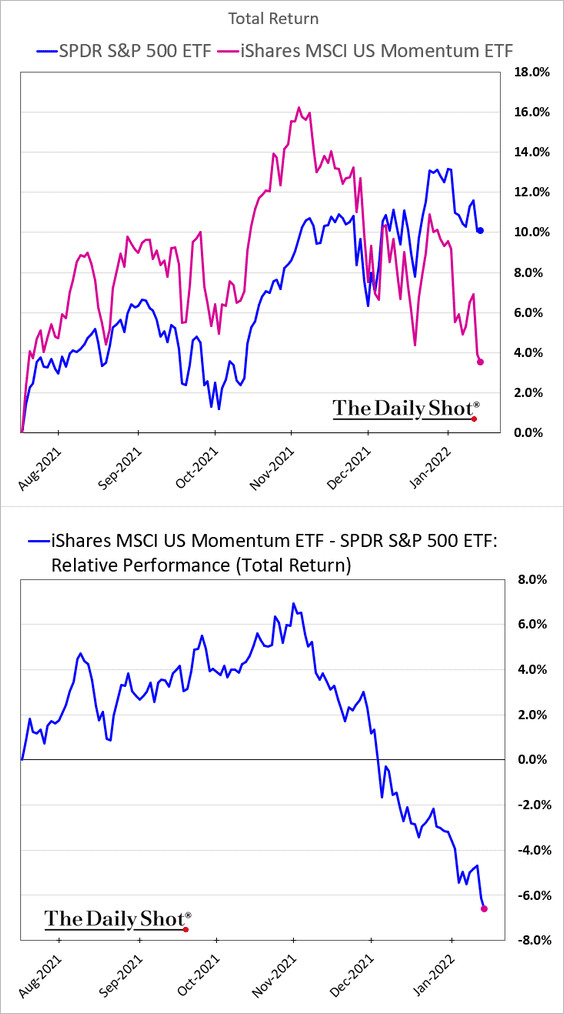
3. The momentum factor underperformance, which started in November, continues to widen.
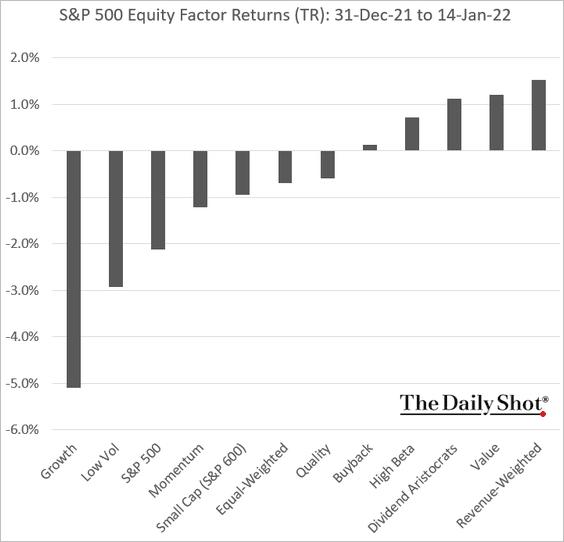
Here is the month-to-date performance by equity factor:
——————–
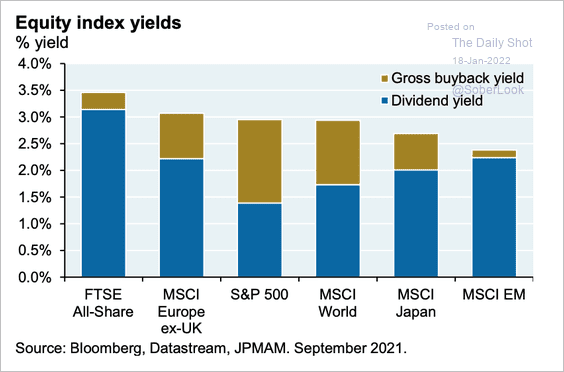
4. This chart compares equity yields (both dividend and gross buyback) of the major global equity markets.
 Source: J.P. Morgan Asset Management
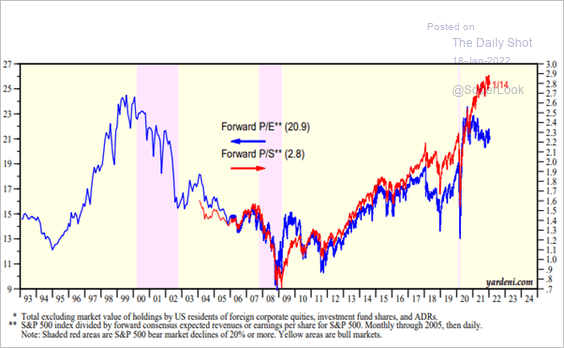
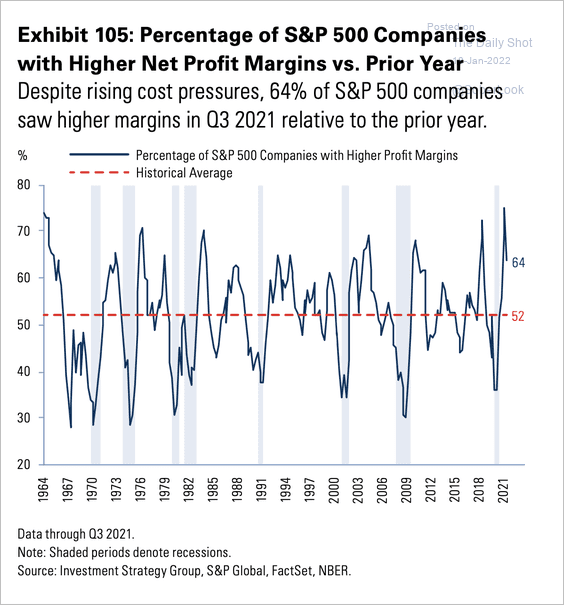
5. The S&P 500 forward price-to-earnings and price-to-sales ratios have diverged as corporate margins surged.
 Source: Yardeni Research
Underappreciated operating leverage from strong sales growth has meant that the majority of firms are able to offset rising cost pressures and see expanding margins.
 Source: Goldman Sachs
——————–
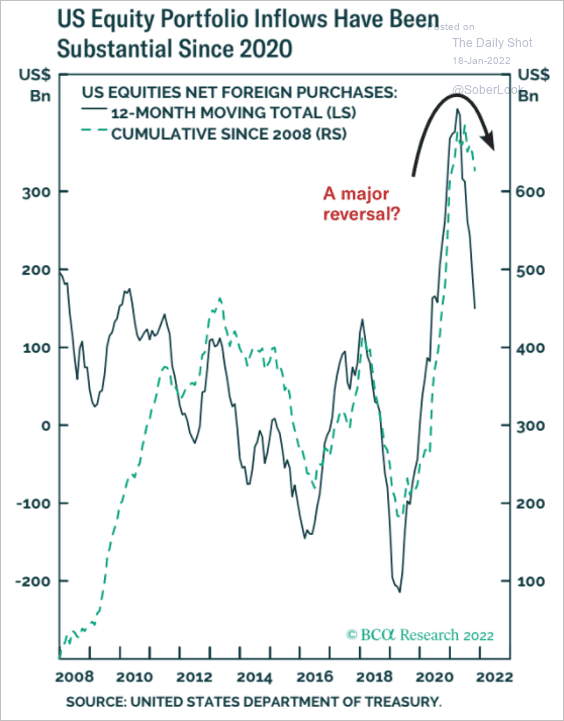
6. Foreign inflows into US equity markets appear to have peaked.
 Source: BCA Research
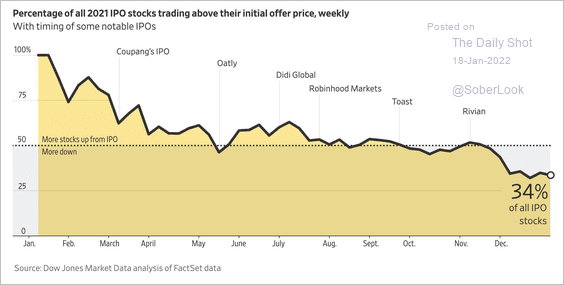
7. What percentage of 2021 IPOs trade above the initial offer price?
 Source: @WSJGraphics Read full article
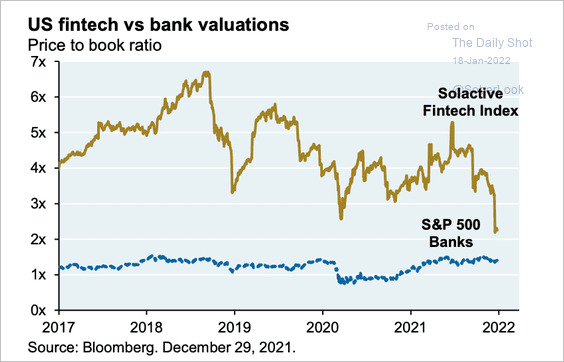
8. Are fintech valuations converging with bank valuations?
 Source: J.P. Morgan Asset Management
Back to Index
Rates
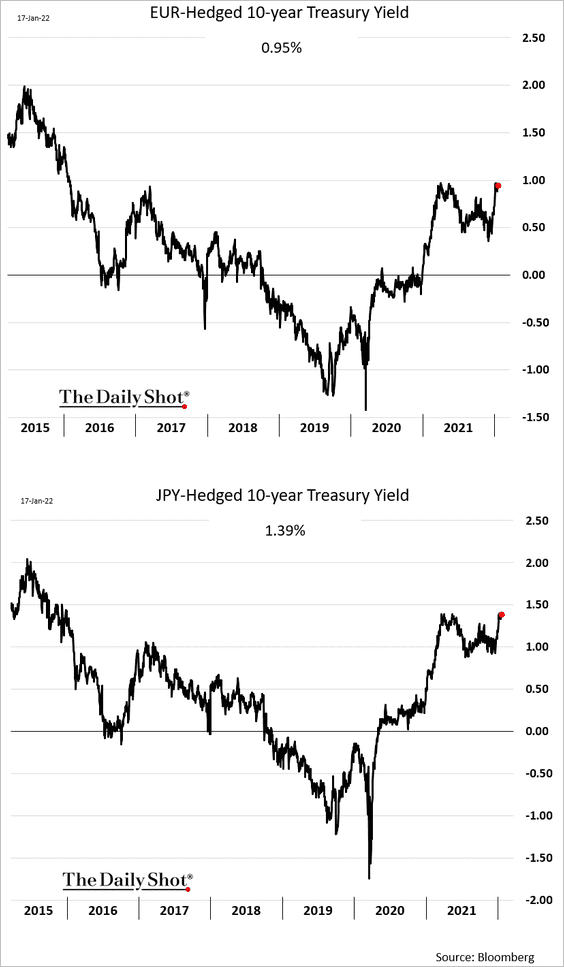
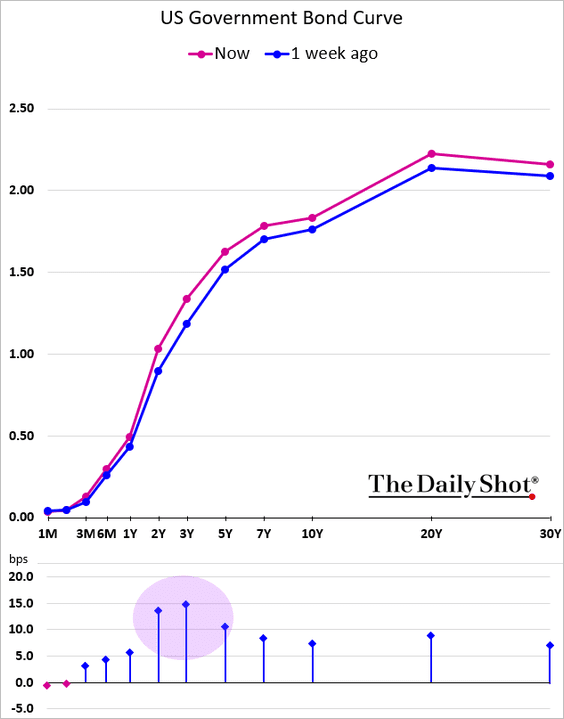
1. Non-US buyers of Treasuries get a relatively attractive yield even on a currency-hedged basis. With the Bund still below zero, getting paid 1% on Treasuries should be appealing.
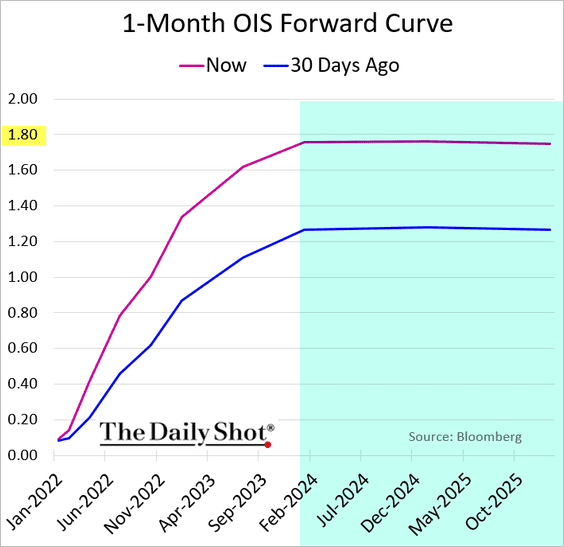
2. The market expects the Fed to be done hiking rates by the end of next year. Many economists disagree.
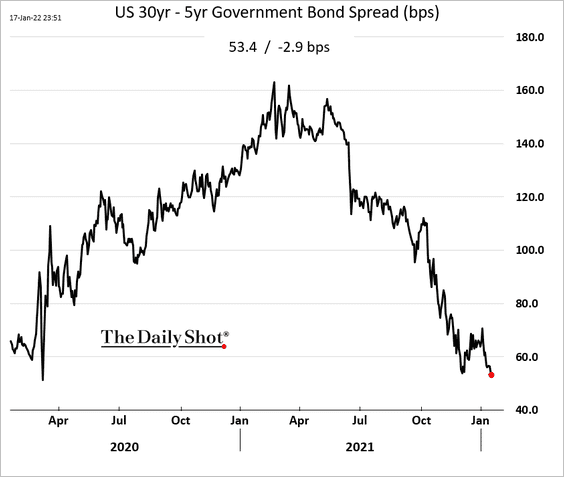
3. The Treasury curve continues to flatten at the longer end.
——————–
Food for Thought
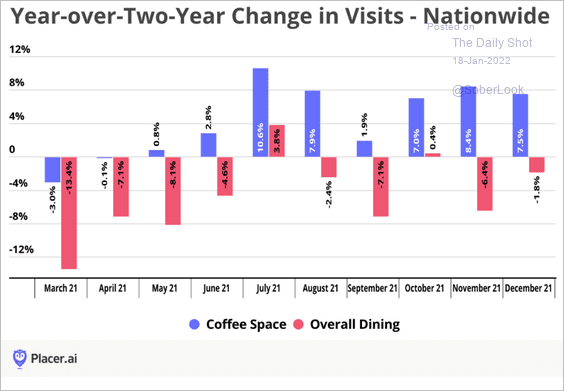
1. Coffee shops outperforming the overall dining sector:
 Source: Placer.ai
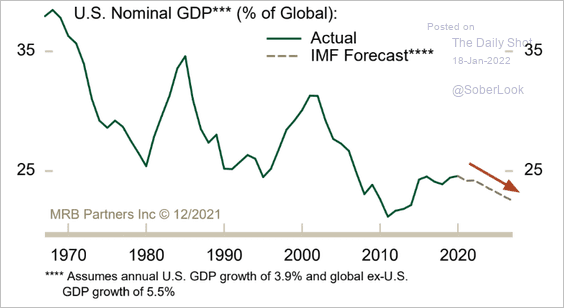
2. The US economy as a share of global GDP:
 Source: MRB Partners
3. Share of the global population living in a democracy:
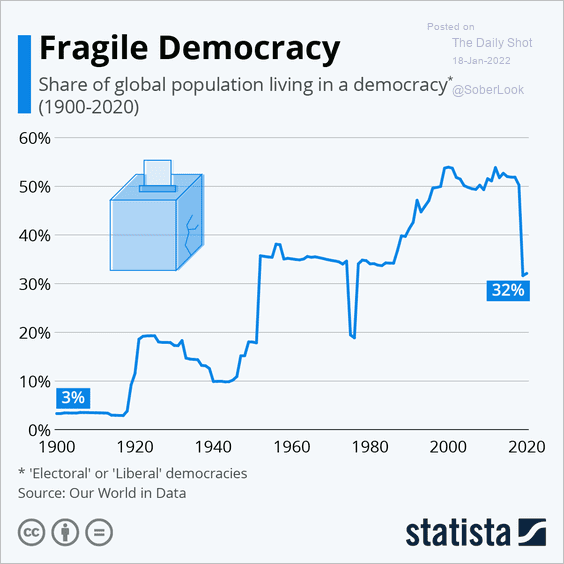 Source: Statista
4. Russia’s vs. Ukraine’s military forces:
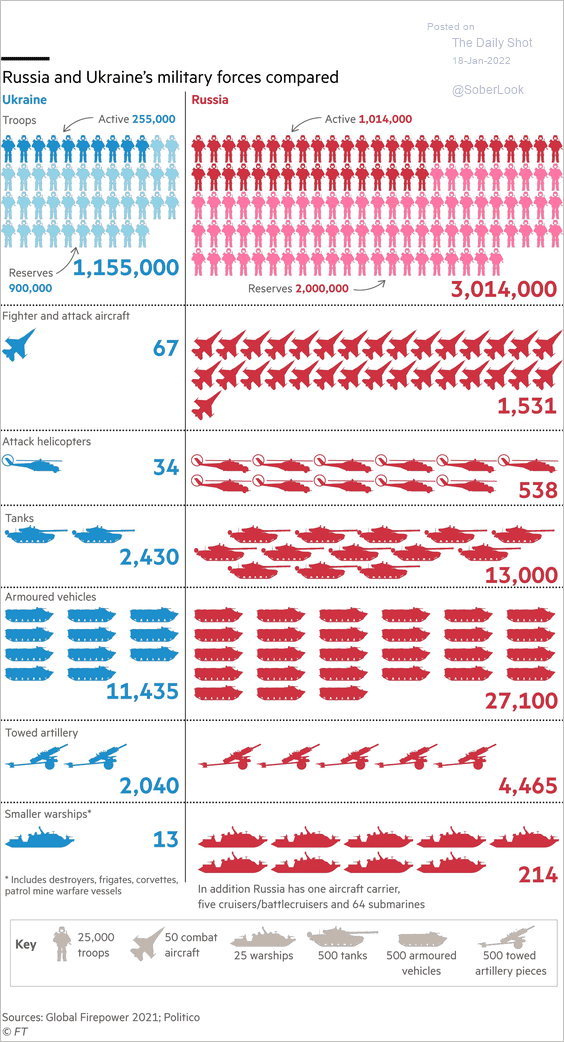 Source: @financialtimes Read full article
5. The current arsenal against COVID:
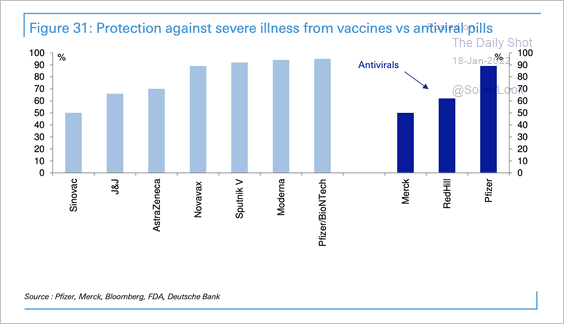 Source: Deutsche Bank Research
6. Abortion trends in the US:
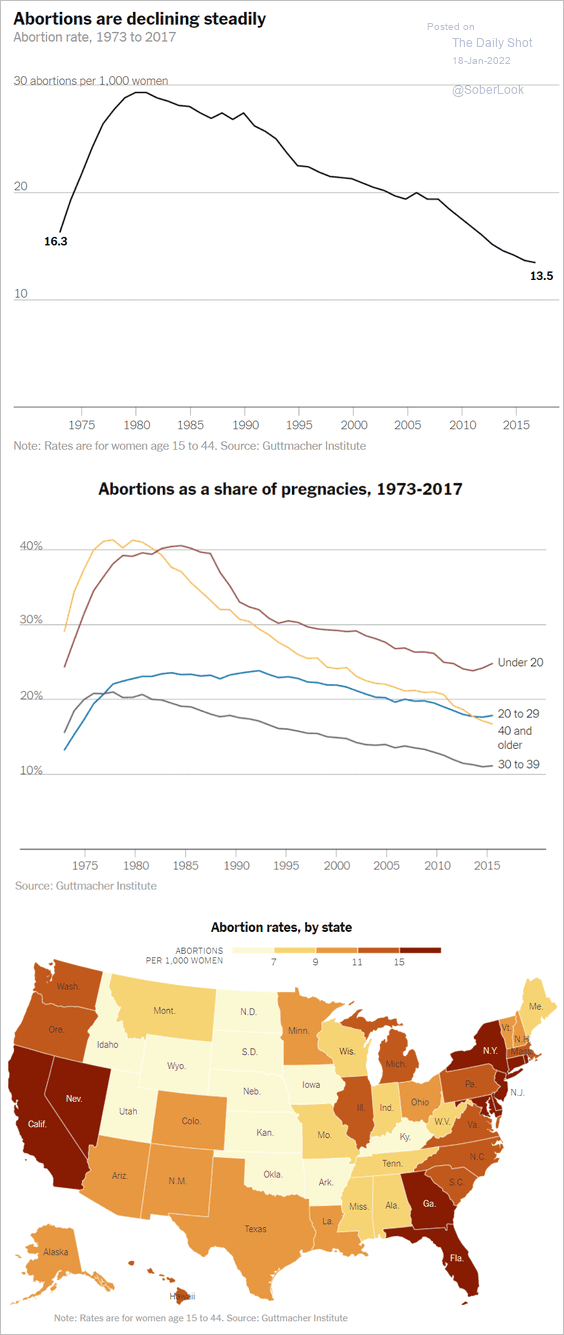 Source: The New York Times Read full article
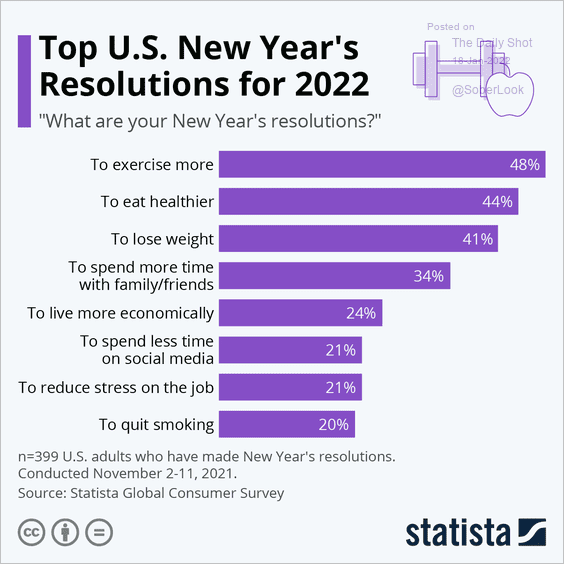
7. The 2022 New Year’s resolutions:
 Source: Statista
——————–
Back to Index
