
The Daily Shot: 28-Jan-22
• The United States
• Canada
• The United Kingdom
• The Eurozone
• Europe
• Asia – Pacific
• China
• Emerging Markets
• Cryptocurrency
• Commodities
• Energy
• Equities
• Alternatives
• Credit
• Rates
• Global Developments
• Food for Thought
The United States
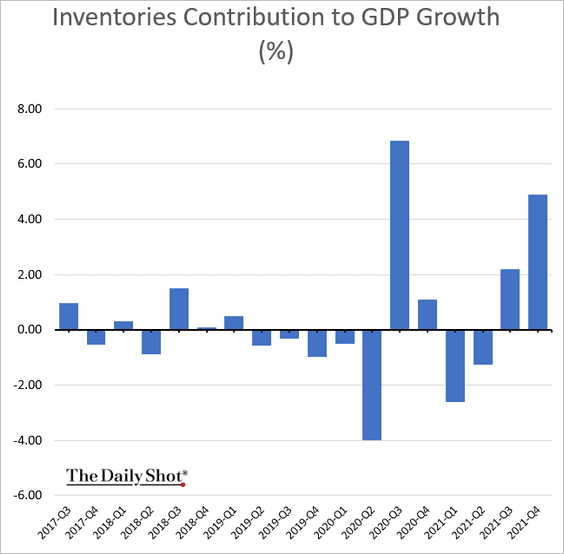
1. The fourth-quarter GDP growth topped expectations. However, over 70% of the increase was due to companies building inventories.
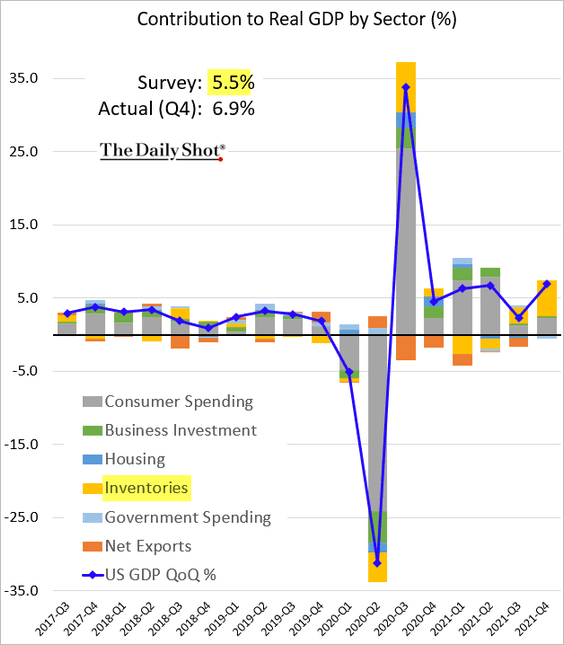
It remains to be seen if the demand will be strong enough to quickly absorb this increase.
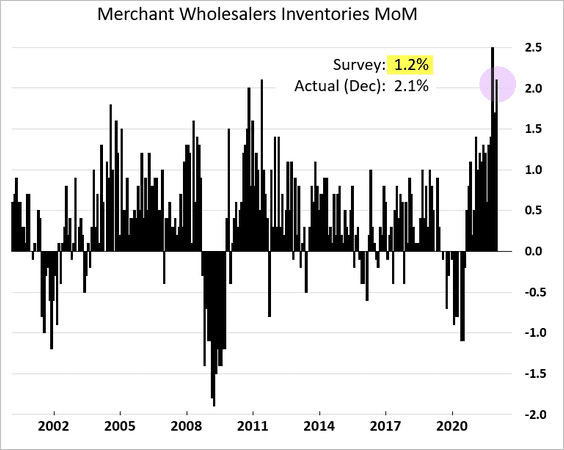
Yesterday, we saw the December surge in retail inventories (chart). Wholesale inventories have been rising quickly as well.
• Business investment growth was modest.
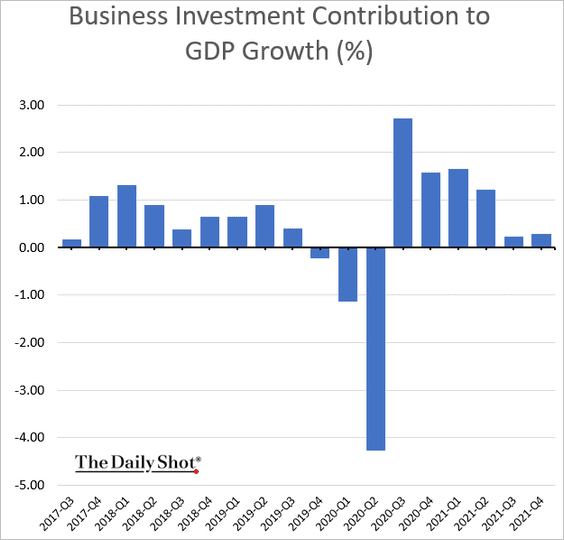
Structures continue to weigh on total business investment.
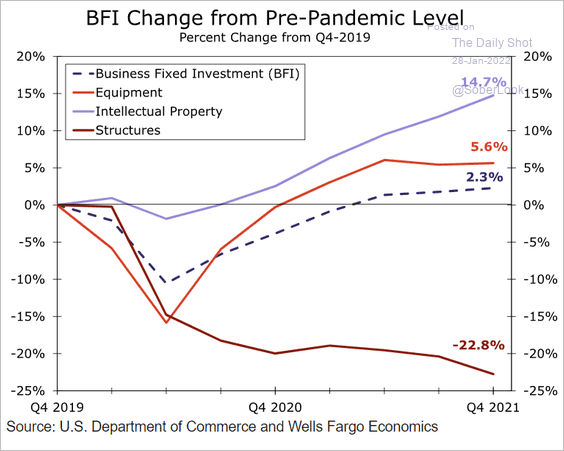 Source: Wells Fargo Securities
• The GDP rebound for the whole year was the strongest in decades.
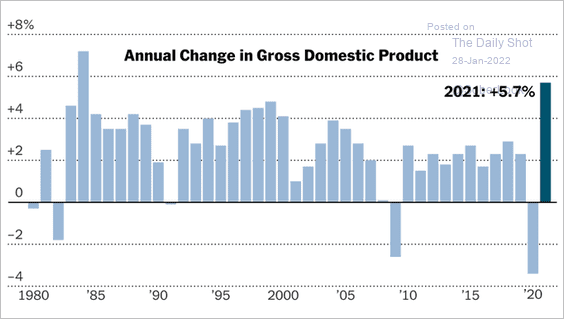 Source: @nytimesbusiness, @talmonsmith
Wells Fargo is forecasting robust growth for 2022 and 2023.
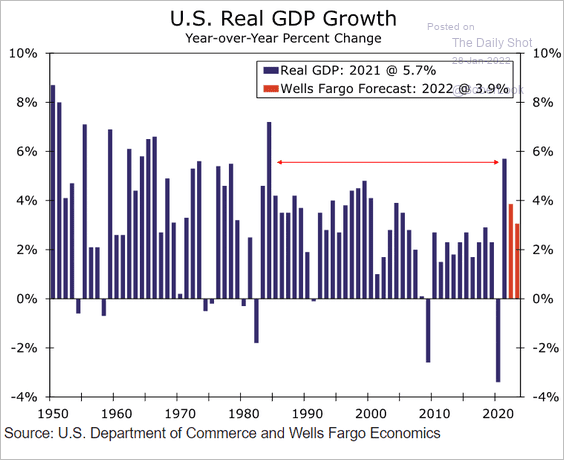 Source: Wells Fargo Securities
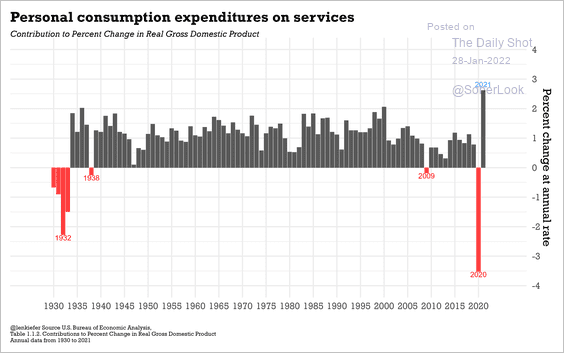
• Consumer spending growth was exceptionally strong last year (2 charts).
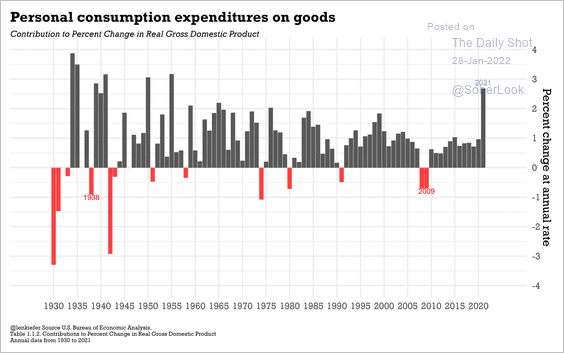 Source: @lenkiefer
 Source: @lenkiefer
• Residential investment increased by most since 2006.
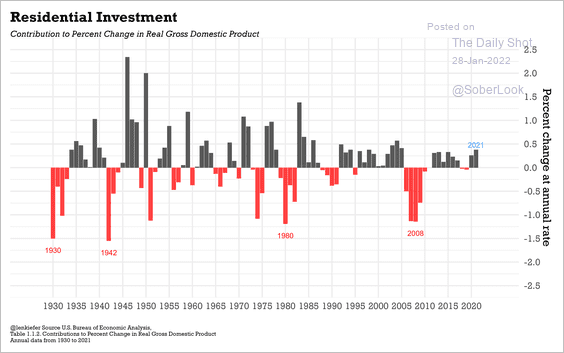 Source: @lenkiefer
• Here are the GDP components relative to their pre-COVID trend.
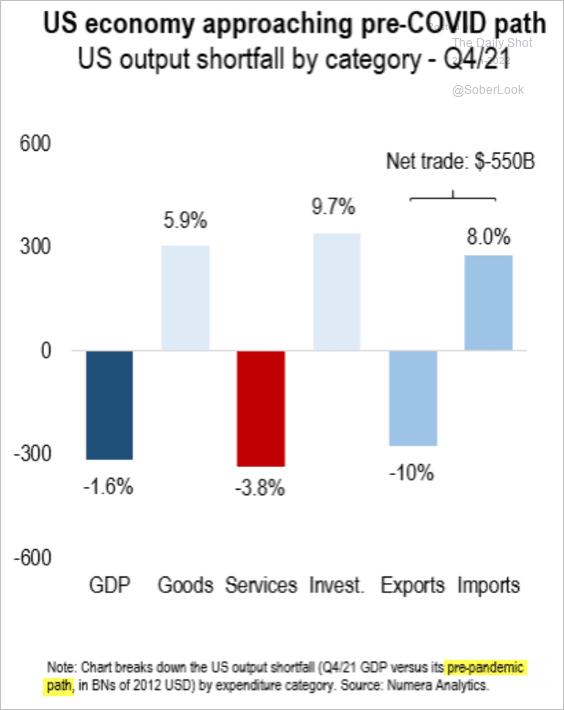 Source: @NumeraAnalytics
• The nominal GDP is now well above its pre-pandemic trend. But due to high inflation, real GDP is not quite there yet.
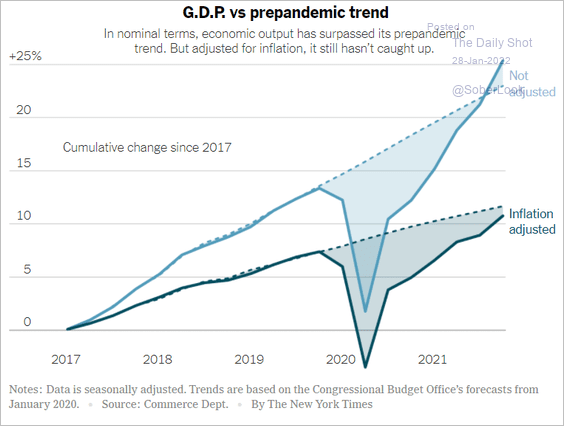 Source: The New York Times Read full article
——————–
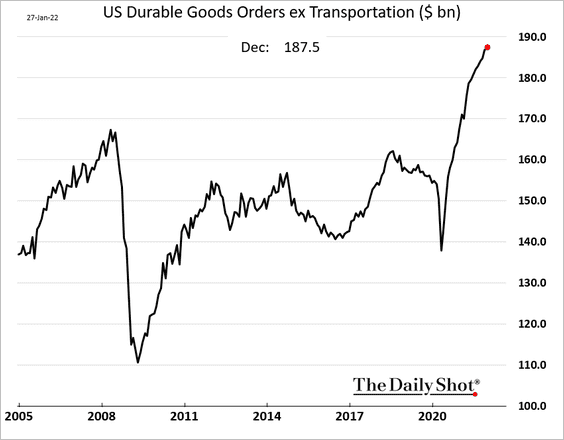
2. Durable goods orders were robust in December, …
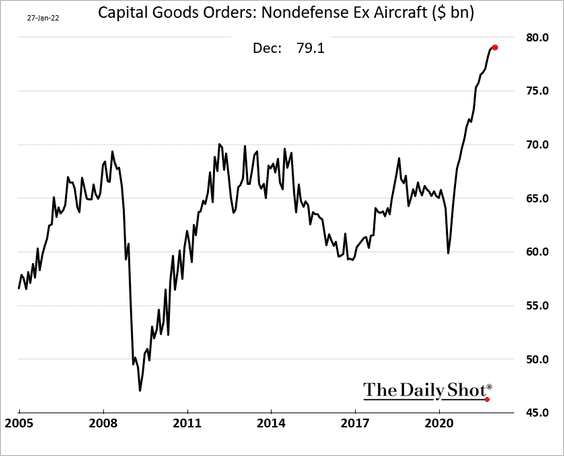
… but capital goods orders appear to have peaked for now.
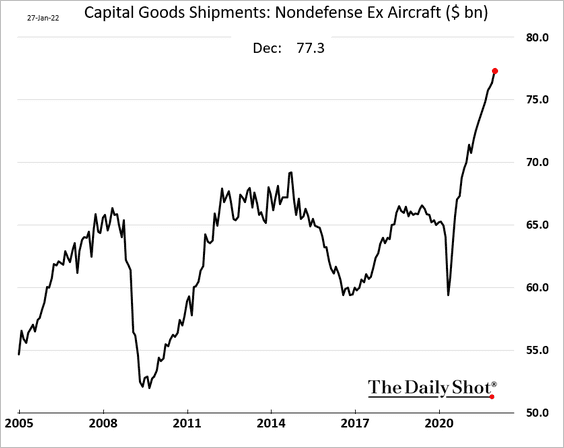
Nonetheless, capital goods shipments continued to surge.
——————–
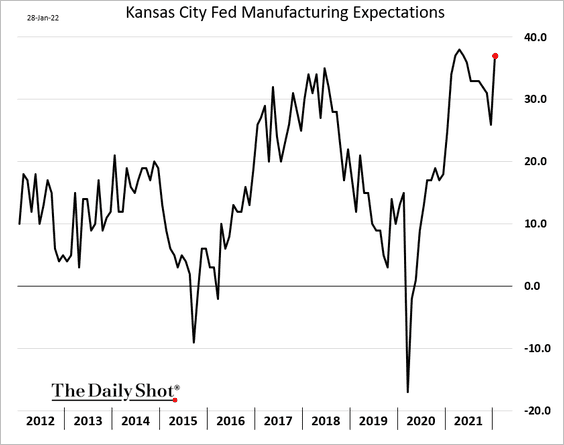
3. The Kansas City Fed’s regional manufacturing index ticked higher this month, …
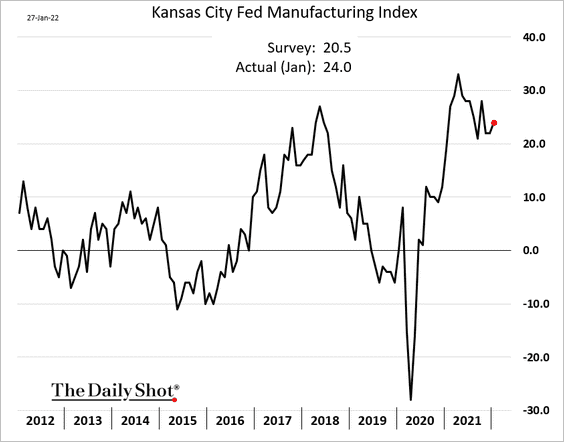
… driven by rising optimism about future business activity.
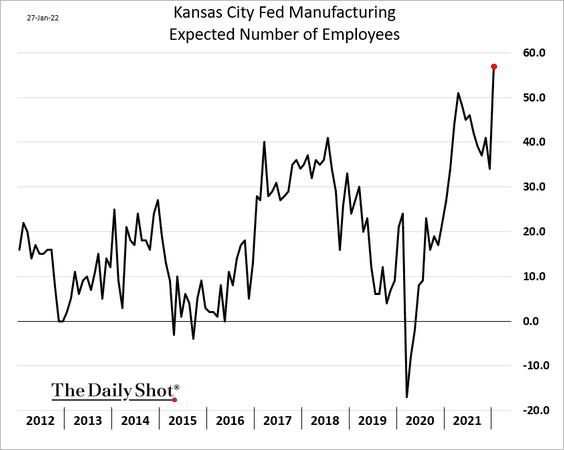
• Hiring expectations surged.
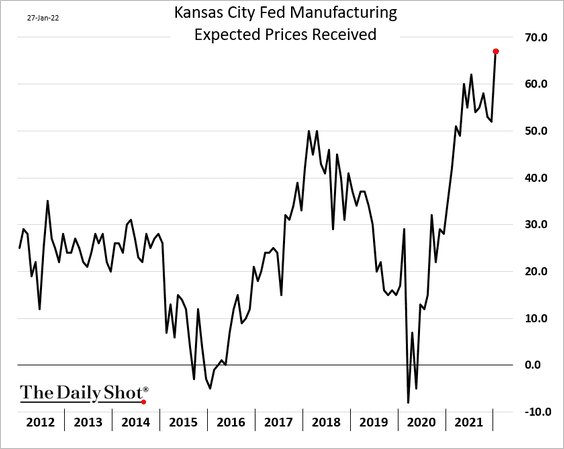
• And manufacturers are increasingly planning to boost prices.
——————–
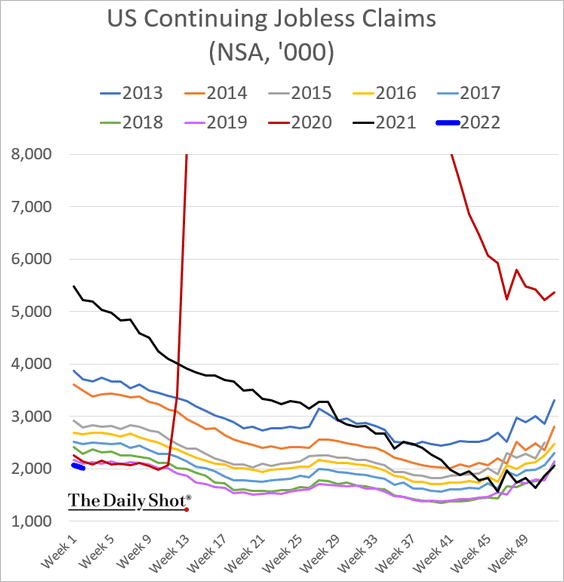
4. Initial jobless claims dipped below last year’s levels (very low for this time of the year).
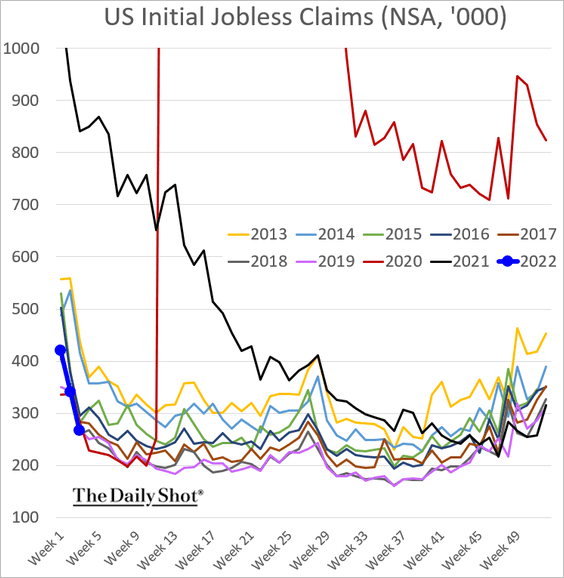
Continuing claims are at multi-year lows.
——————–
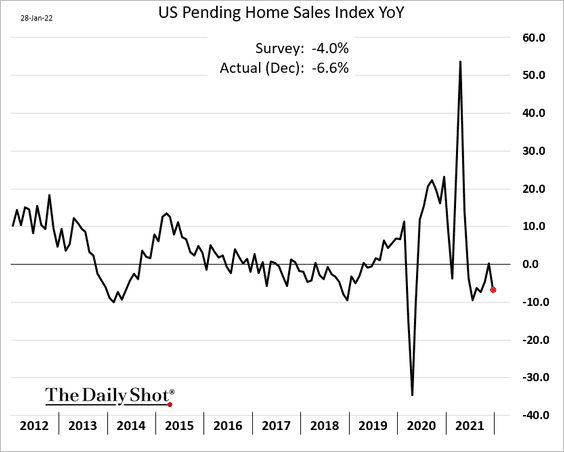
5. Pending home sales declined more than usual in December.
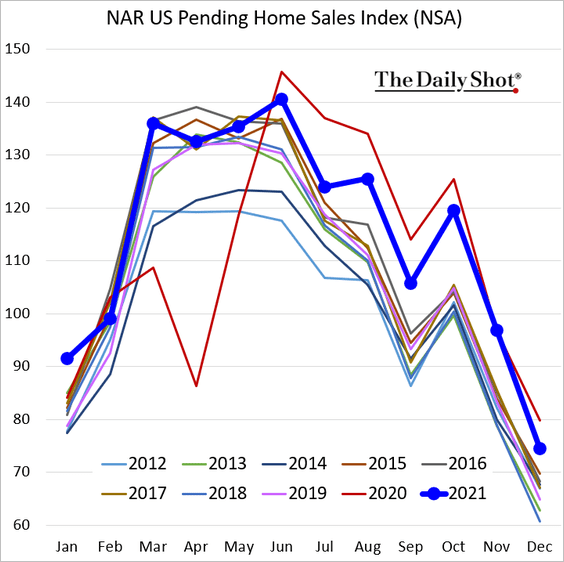
Below is the year-over-year chart.
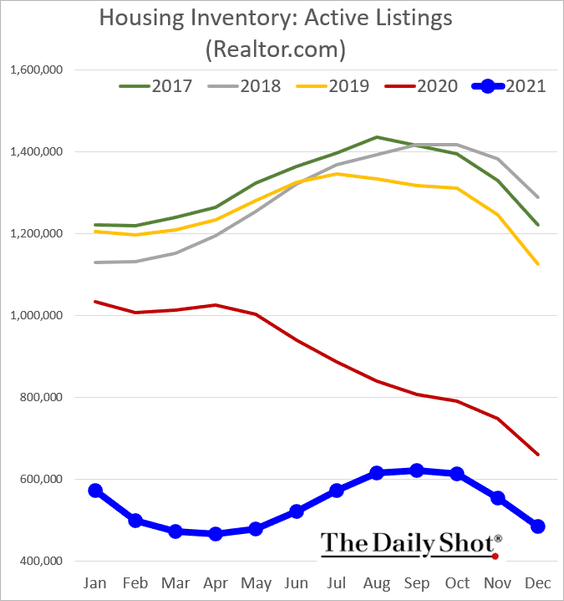
Exceptionally low housing inventories continue to be a drag on sales.
 Source: MarketWatch Read full article
——————–
6. Market pricing for the 2022 Fed rate increases is now well above the FOMC’s dot plot. However, the market is also starting to price an overshoot (a policy mistake) by the Fed, with some probability that the central bank may be forced to cut rates in 2024.
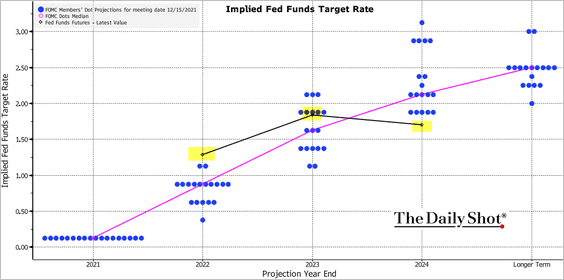 Source: @TheTerminal, Bloomberg Finance L.P.
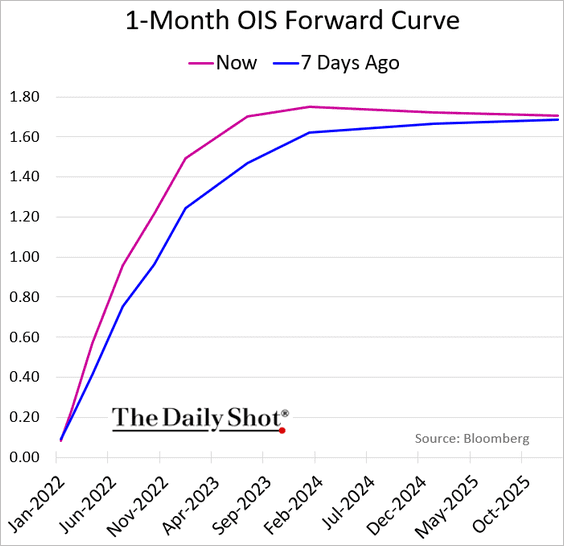
Here is the forward OIS curve (market expectations for short-term rates).
——————–
7. Here is the distribution of household wealth gains by income bracket since the start of the pandemic.
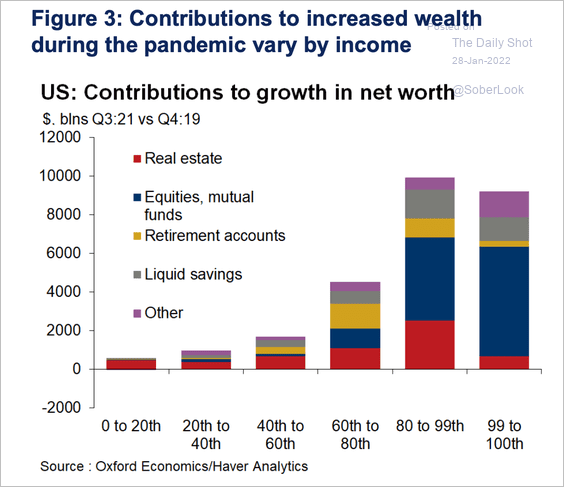 Source: Oxford Economics
Back to Index
Canada
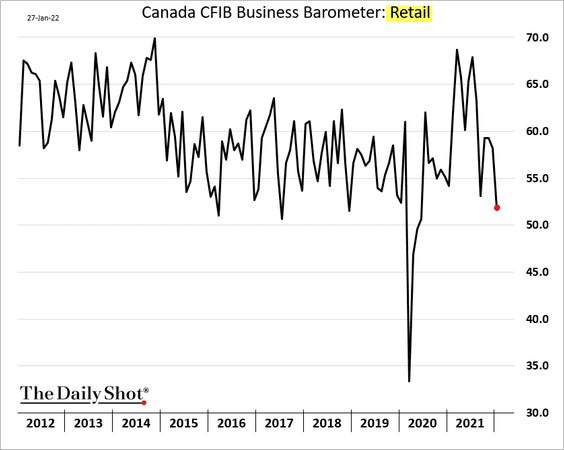
1. The CFIB small/medium-size business activity index declined sharply this month …
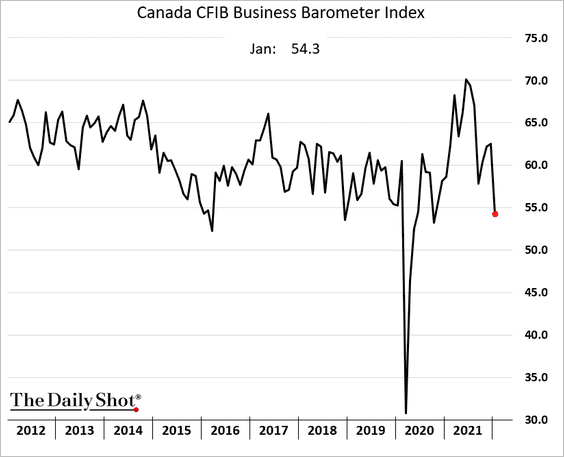
… as omicron takes a toll.
——————–
2. In contrast with the US, the market repriced Canadian rate hike expectations lower after the BoC meeting.
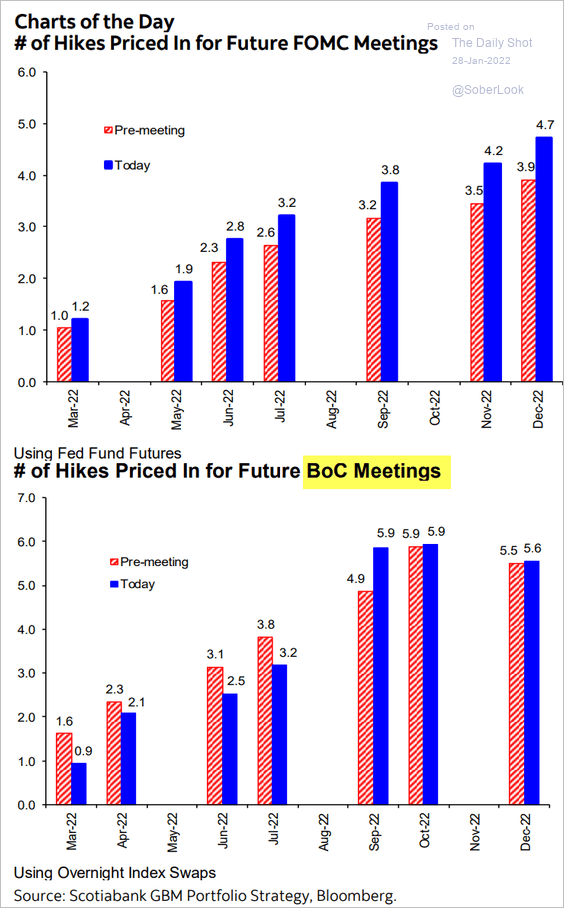 Source: Hugo Ste-Marie, Portfolio & Quantitative Strategy Global Equity Research, Scotia Capital
Back to Index
The United Kingdom
1. The CBI report showed softer retail sales this month.
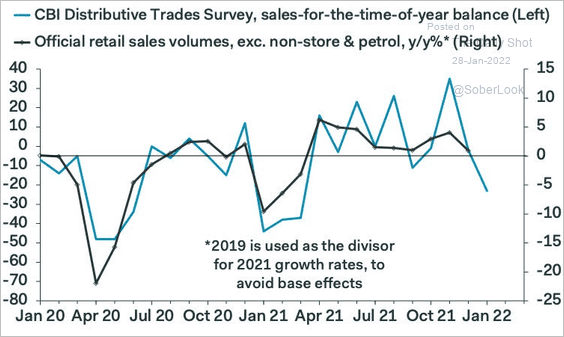 Source: Pantheon Macroeconomics
 Source: Reuters Read full article
——————–
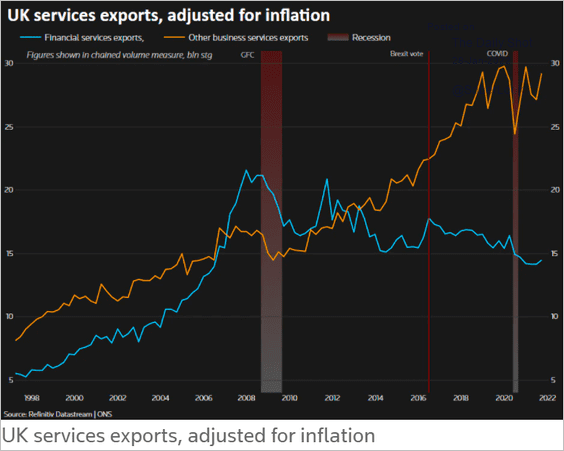
2. Financial services exports have been lagging since the financial crisis.
 Source: Reuters Read full article
Back to Index
The Eurozone
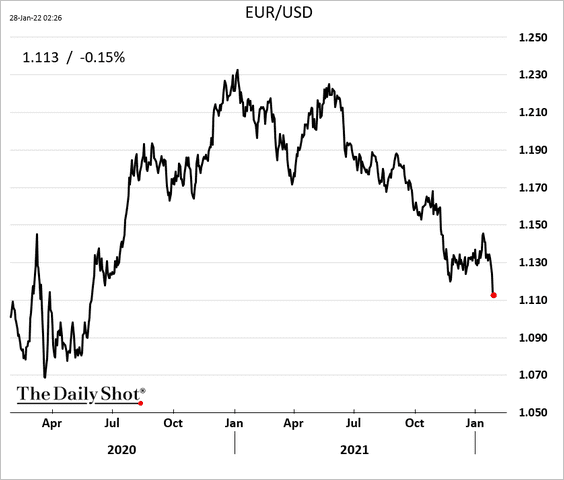
1. The euro has been under pressure as the Fed turns very hawkish.
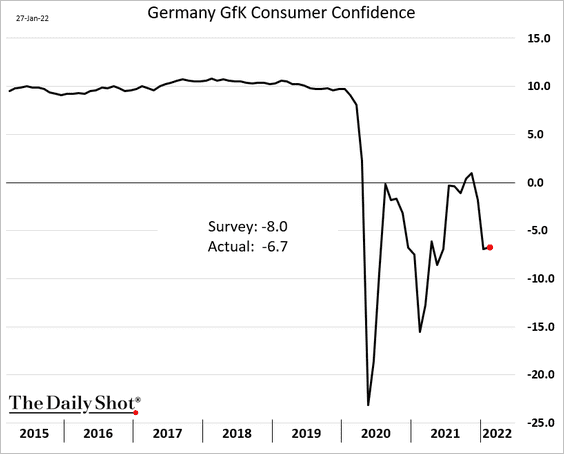
2. German consumer confidence unexpectedly ticked higher this month.
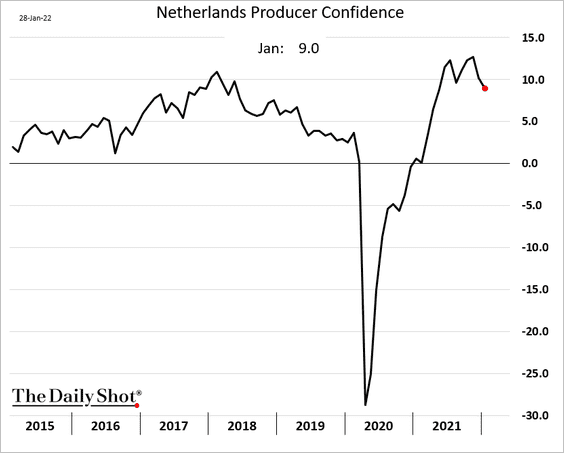
3. Dutch producer confidence continues to moderate.
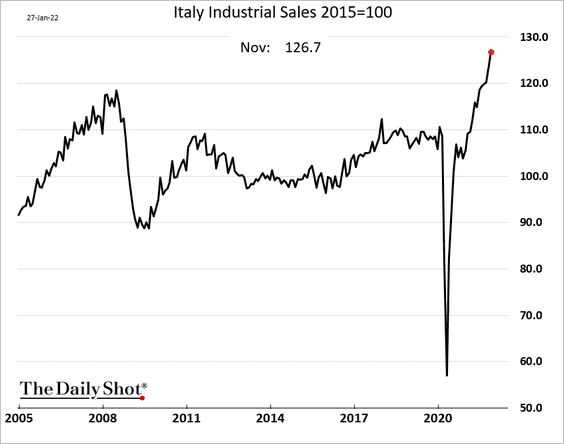
4. The surge in Italian industrial activity has been remarkable.
5. Spain’s unemployment hit the lowest level since 2008.
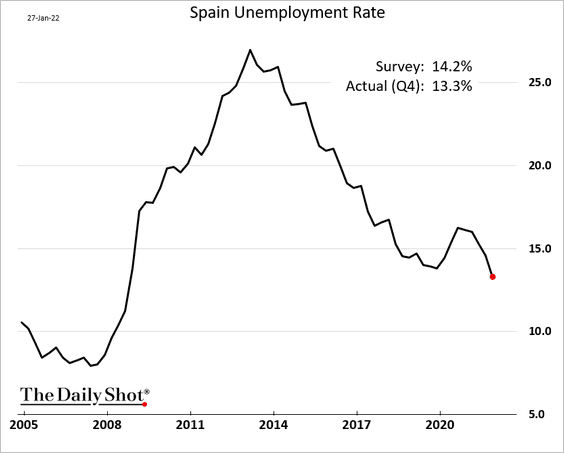
 Source: The Local Read full article
——————–
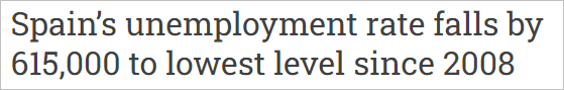
6. Euro-area business investment has been lagging other economies.
 Source: IIF
Back to Index
Europe
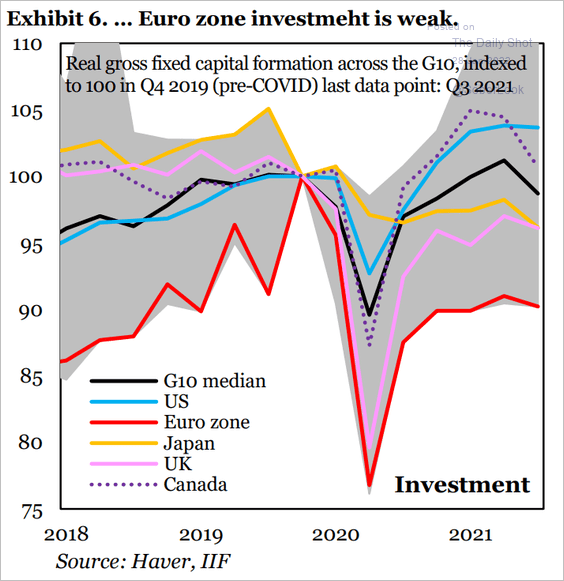
1. The stock market volatility hasn’t spread to European credit.
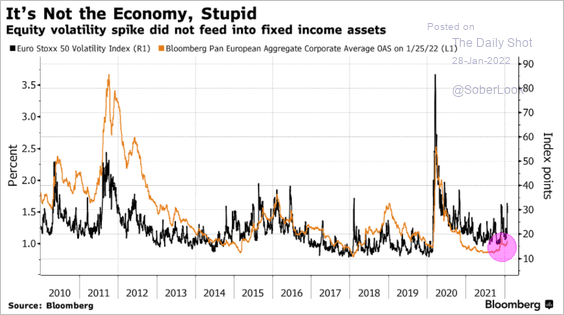 Source: @mikamsika Read full article
2. This chart shows the EU’s agricultural employment in 2000 and 2019.
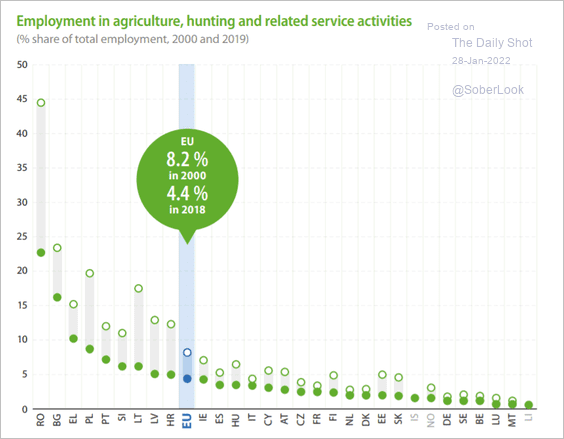 Source: Eurostat Read full article
Back to Index
Asia – Pacific
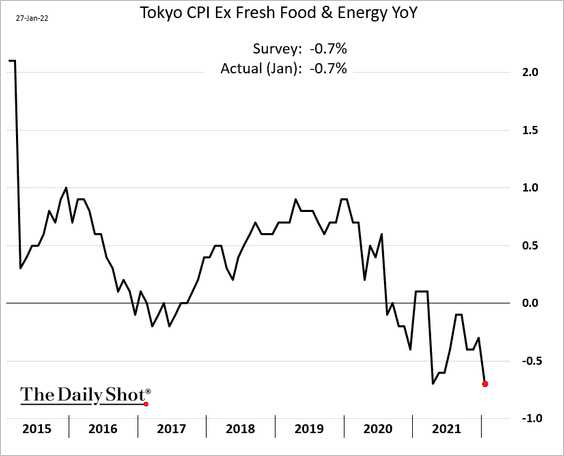
1. Tokyo’s core inflation continues to suggest that outside of energy components, Japan is facing disinflation.
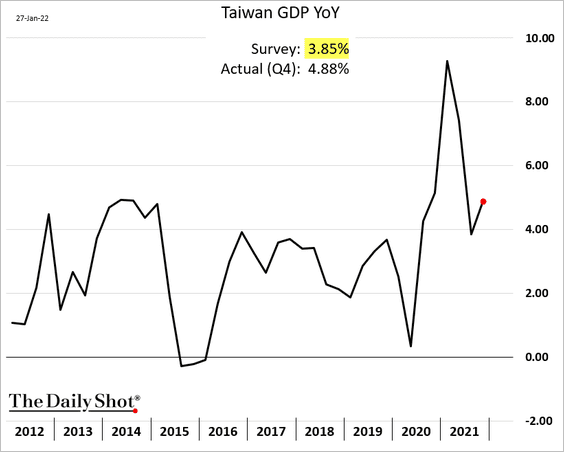
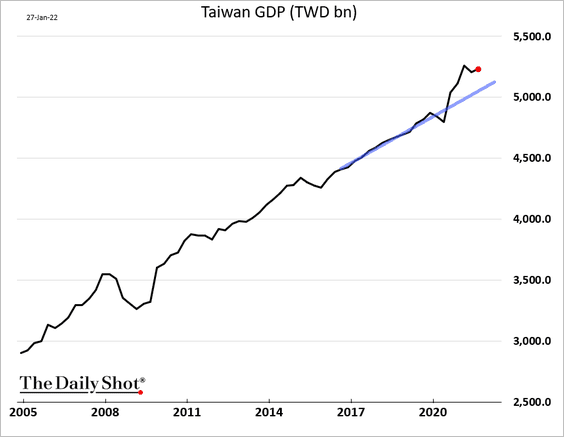
2. Taiwan’s GDP surprised to the upside.
• Year over year:
• GDP level:
Taiwan’s manufacturing growth remained stable this month.
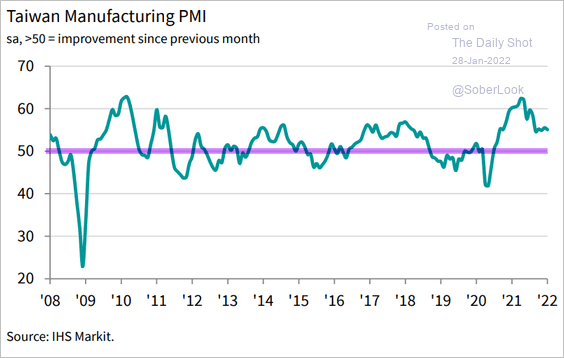 Source: IHS Markit
——————–
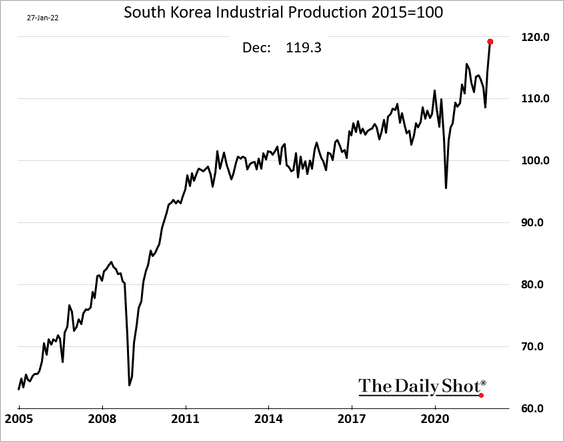
3. South Korea’s industrial production surged going into the year-end.
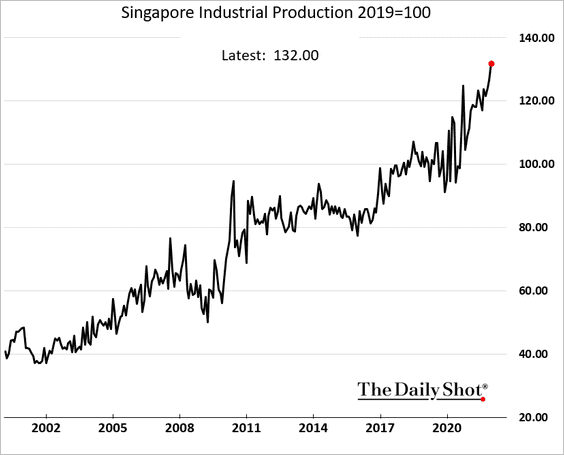
4. Singapore’s industrial production also hit a record high.
5. New Zealand’s consumer confidence remains depressed.

Back to Index
China
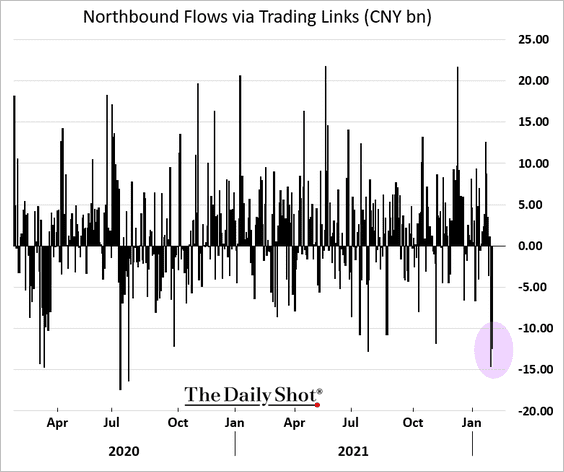
1. The stock market selloff continues, …
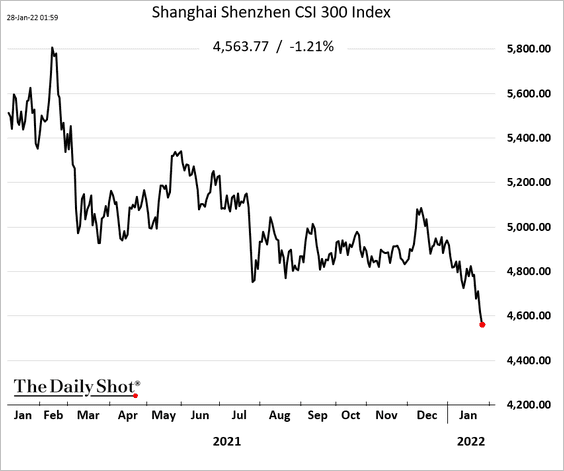
… as Hong Kong and international investors pulled capital out.
——————–
2. Weak confidence could pressure corporate earnings.
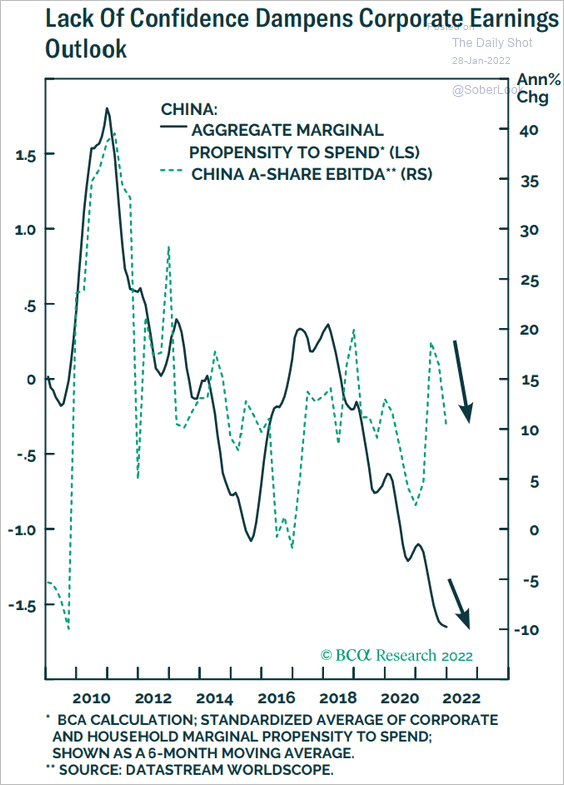 Source: BCA Research
The PPI-CPI gap also points to weak industrial profits ahead.
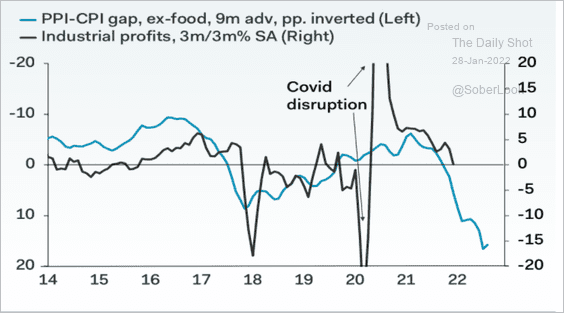 Source: Pantheon Macroeconomics
——————–
3. Chinese households’ excess deposits are now 18% of total retail sales.
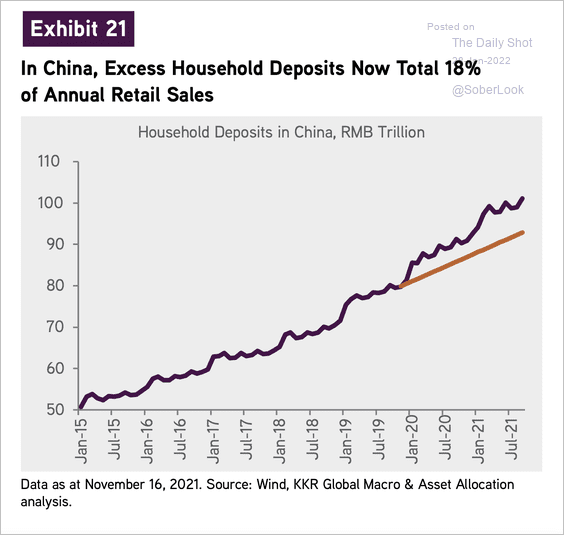 Source: KKR
4. Hong Kong’s exports hit a record high.

Back to Index
Emerging Markets
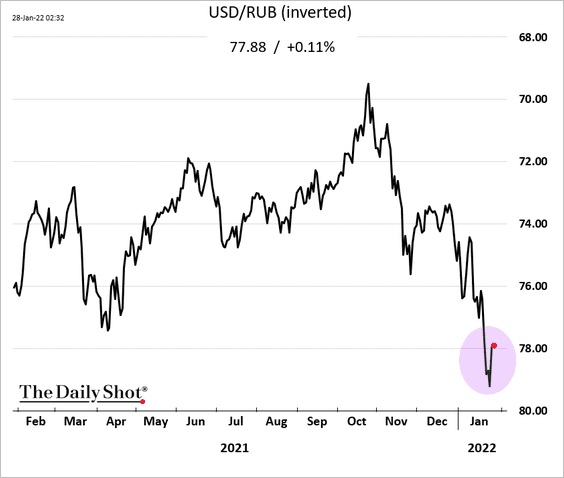
1. The ruble appears to have stabilized amid hopes for a peaceful resolution.
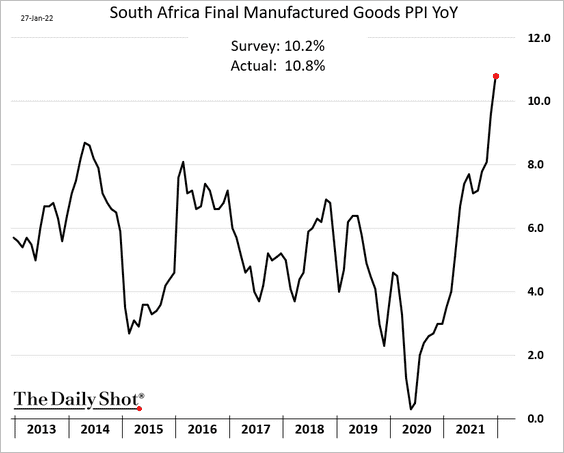
2. South Africa’s central bank increased rates again, …
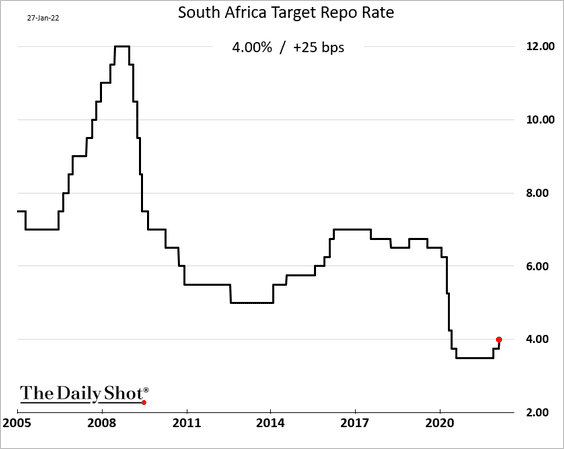
… as inflation climbs.
——————–
3. India’s business activity is back in growth territory, according to the World Economics SMI report.
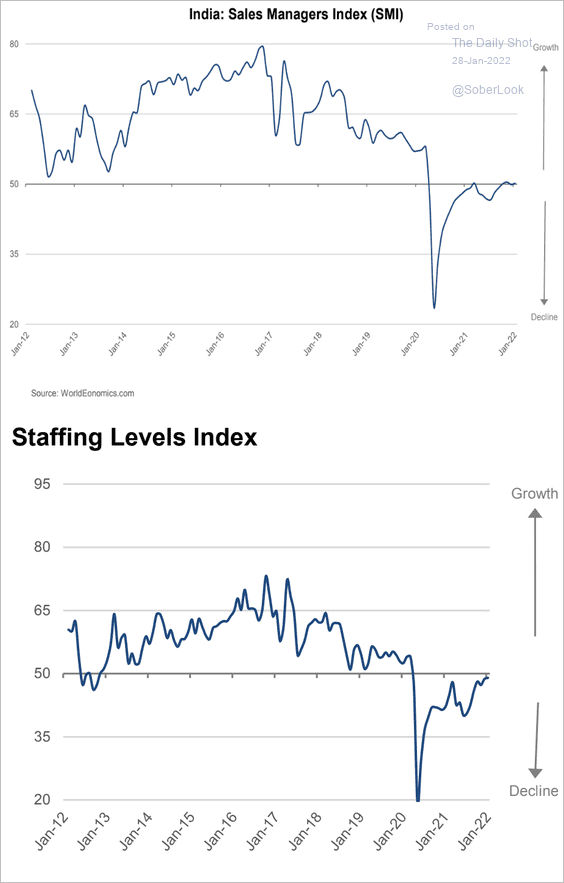 Source: World Economics
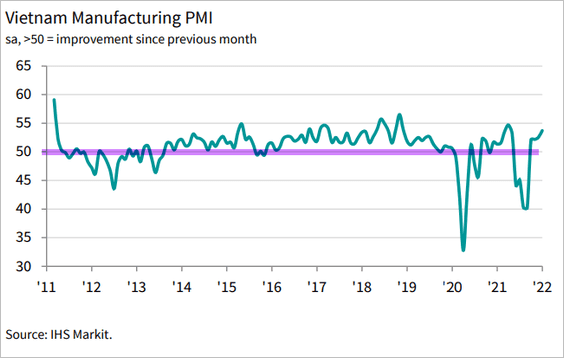
4. Next, we have some updates on Vietnam.
• Manufacturing PMI (strengthening growth in January):
• GDP per capita:
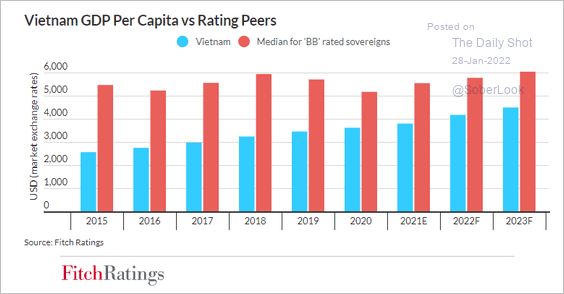 Source: Fitch Ratings
• Low-end tech exports:
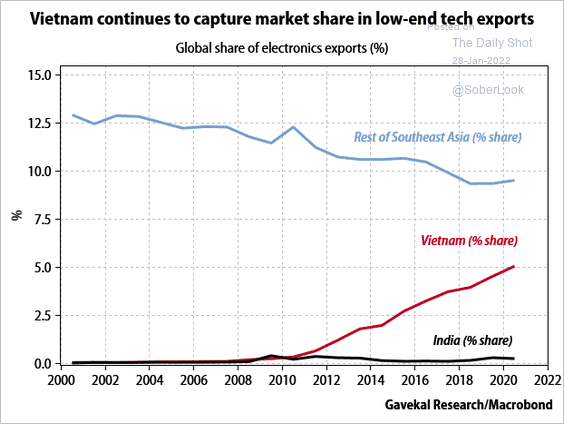 Source: Gavekal Research
• Vaccination rate over time:
 Source: Fitch Ratings
——————–
5. Valuation has been a key long-term driver of EM relative equity returns.
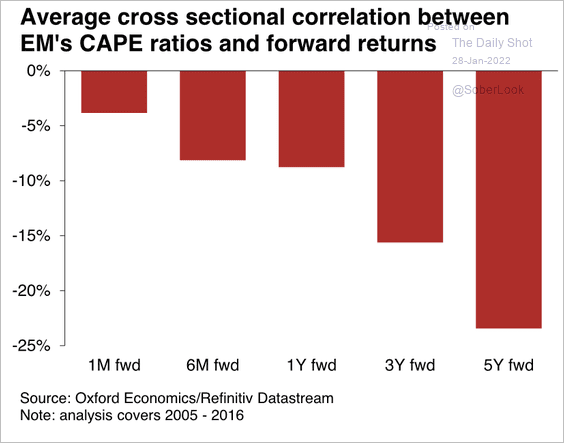 Source: Oxford Economics
Back to Index
Cryptocurrency
1. The uptick in bitcoin’s spot trading volume has faded over the past two days.
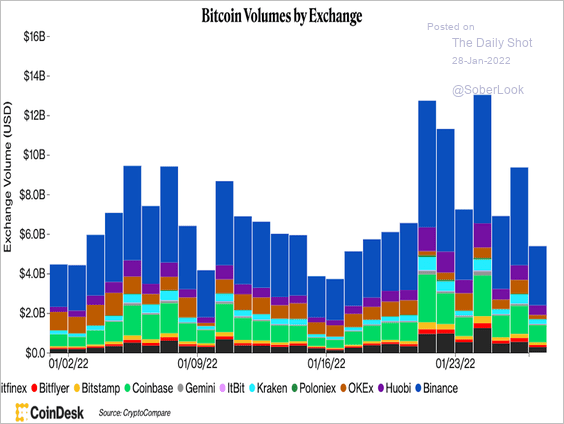 Source: CoinDesk Read full article
2. More volatility is expected as $2 billion worth of BTC options are set to expire on Friday. Sentiment is mixed, and the max pain price (strike price with the most options contracts) is at $42K.
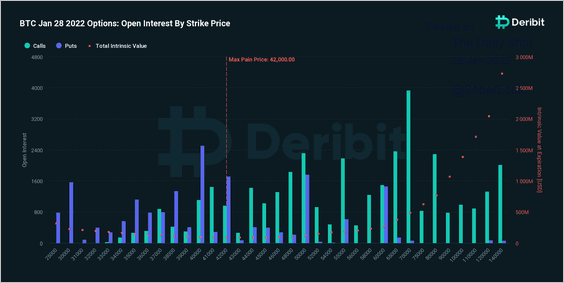 Source: @DeribitExchange
 Source: CoinDesk Read full article
——————–
3. Fidelity is entering the metaverse.
 Source: Bloomberg Read full article
4. Next, we have some updates on crypto activity in Africa.
• Market size:
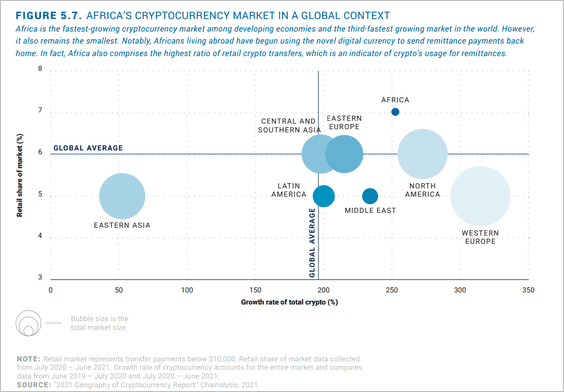 Source: Brookings Read full article
• Flows:
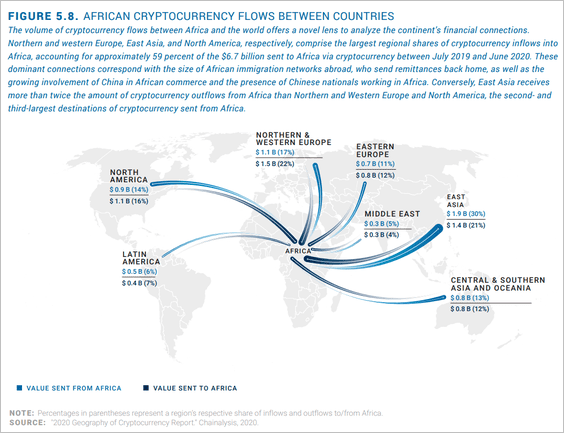 Source: Brookings Read full article
• Crypto use for remittance payments:
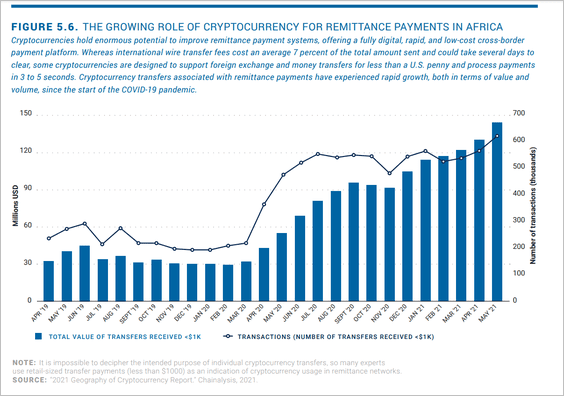 Source: Brookings Read full article
• Crypto as a hedge against currency devaluation:
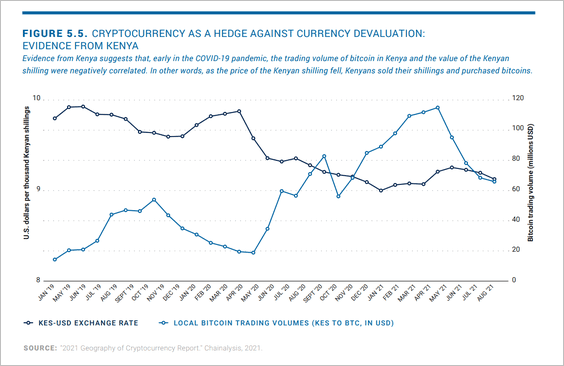 Source: Brookings Read full article
——————–
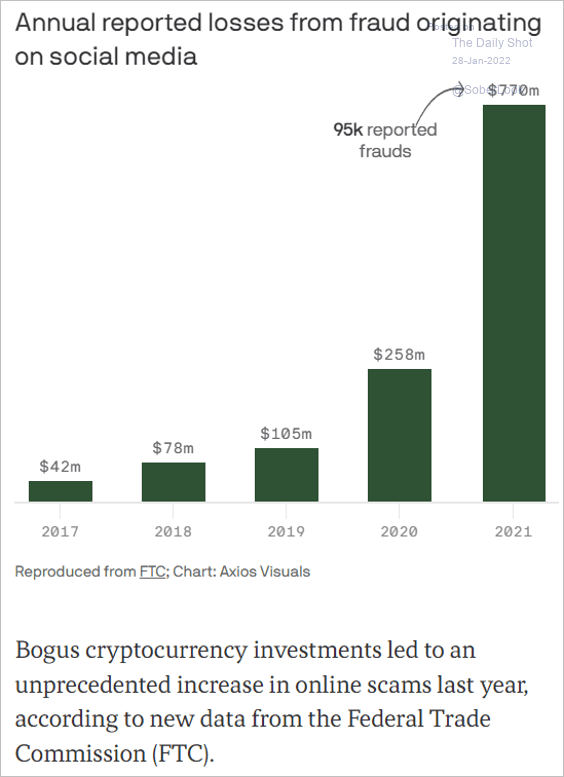
5. Crypto fraud originating on social media has surged.
 Source: @axios Read full article
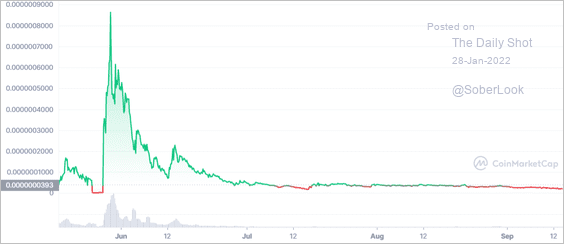
6. EthereumMax, a cryptocurrency pumped by Kim Kardashian and Floyd Mayweather, has lost about 97% of its value. Investors have filed a class-action lawsuit against the two celebs.

 Source: CoinMarketCap Read full article
Back to Index
Commodities
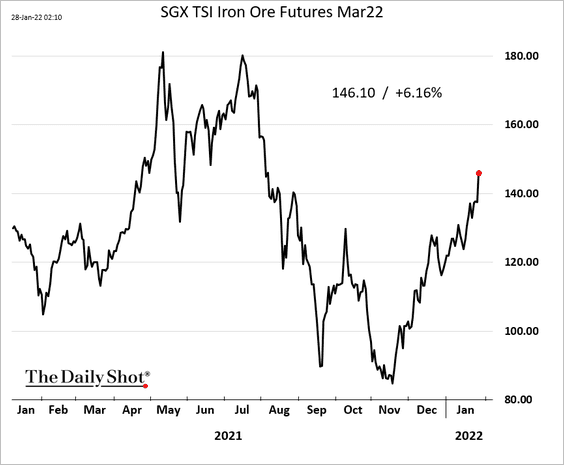
1. Iron ore is surging.
2. The rise in real rates will result in higher capital costs, which could weigh on industrial commodities, including energy, according to Cresset.
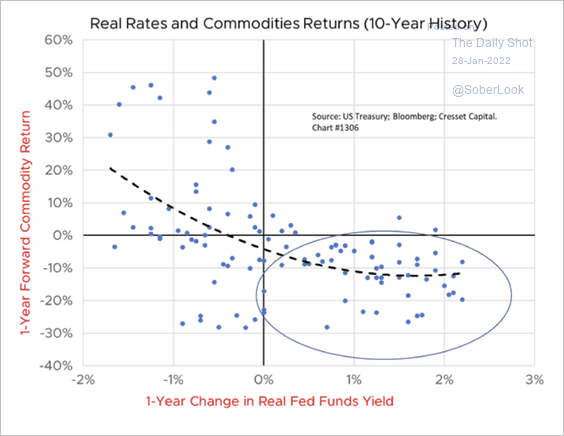 Source: Jack Ablin, Cresset Wealth Advisors
3. Nickel prices appear overbought as inventory levels are near extreme lows.
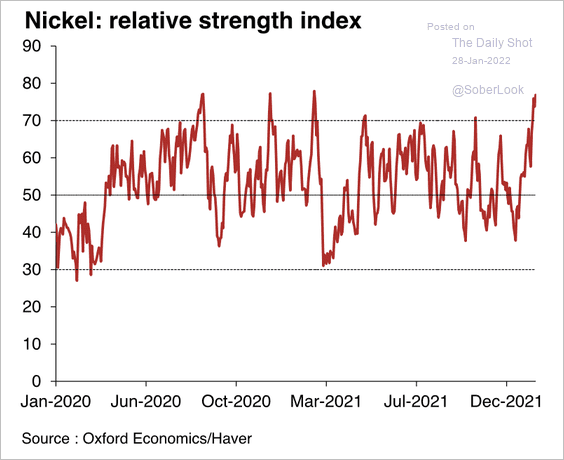 Source: Oxford Economics
4. Oxford Economics expects a more robust supply response over the next two years, which could lead to lower metal prices.
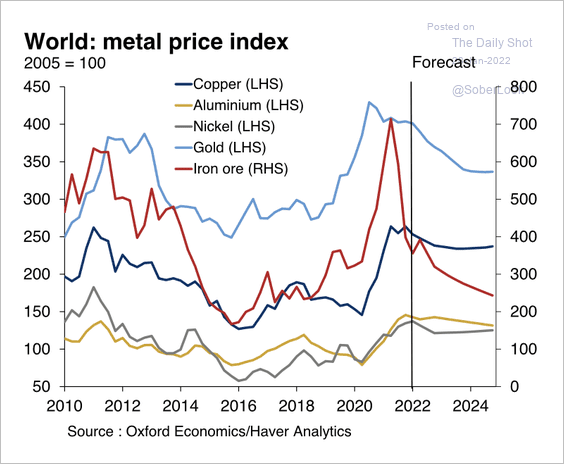 Source: Oxford Economics
5. This chart shows the Russian share of global metals production.
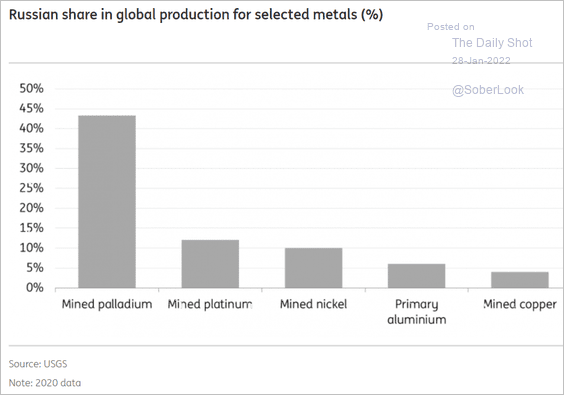 Source: ING
Back to Index
Energy
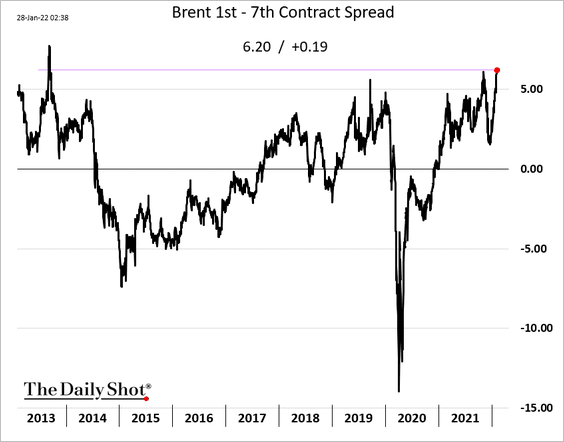
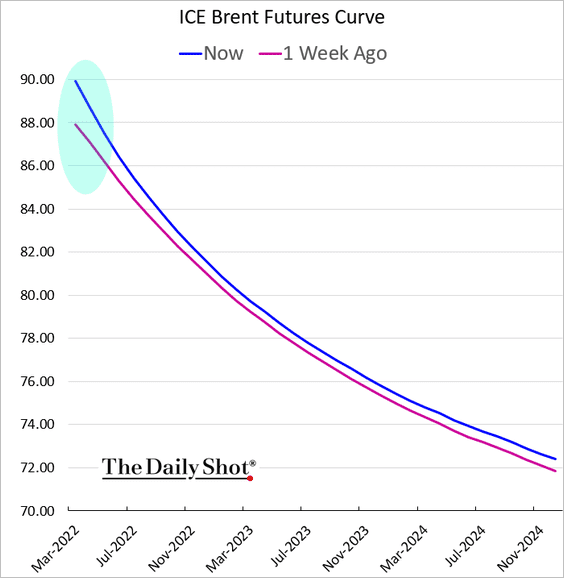
1. Brent backwardation hit a multi-year high amid tight supplies.
——————–
2. US distillates inventories are at multi-year lows for this time of the year, …
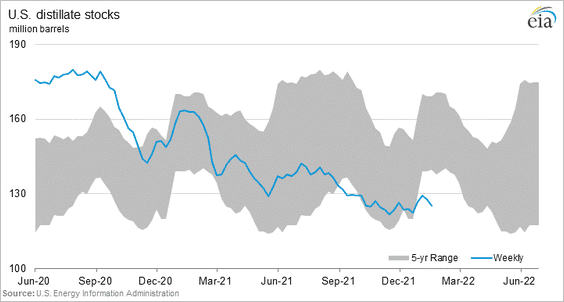
… as demand surges. Distillates include diesel and jet fuel.
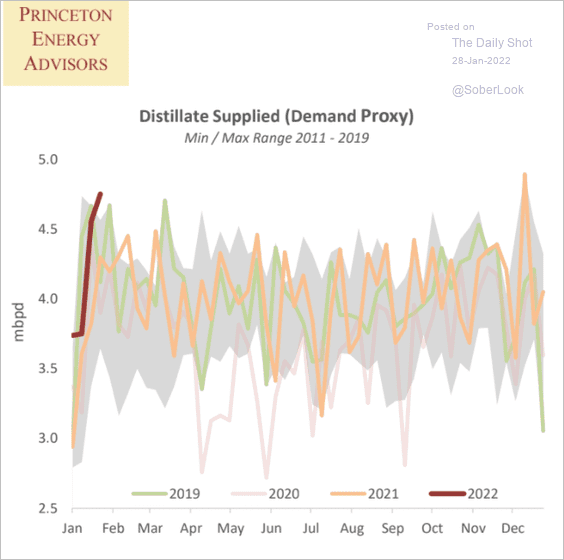 Source: Princeton Energy Advisors
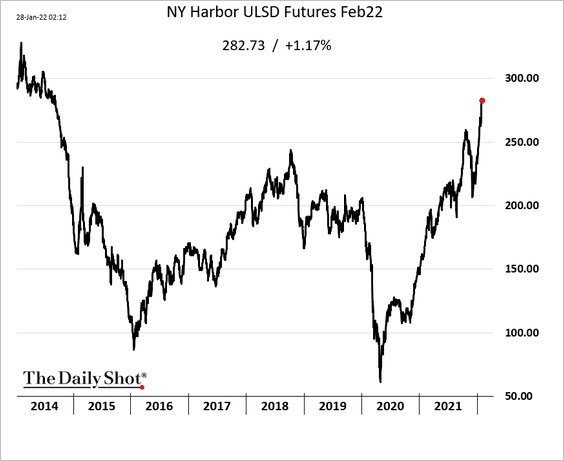
Prices are surging (chart shows low-sulfur diesel futures).
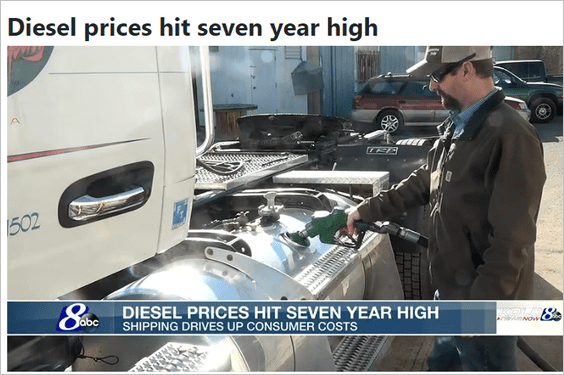 Source: ABC Read full article
——————–
3. US refinery runs have been soft.
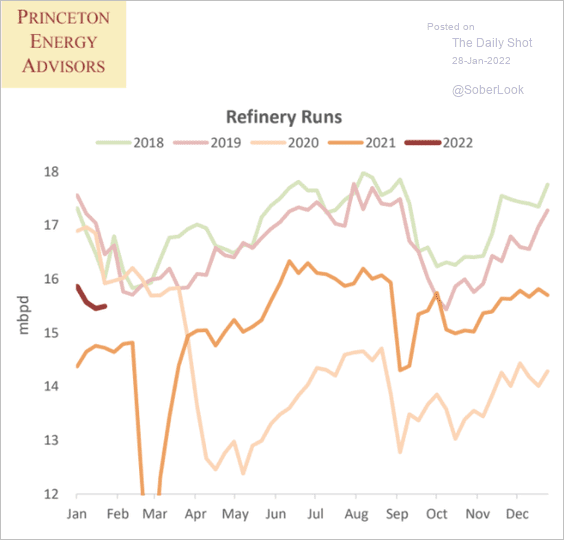 Source: Princeton Energy Advisors
4. Next, we have some updates on the European energy crisis.
• Gas inventories:
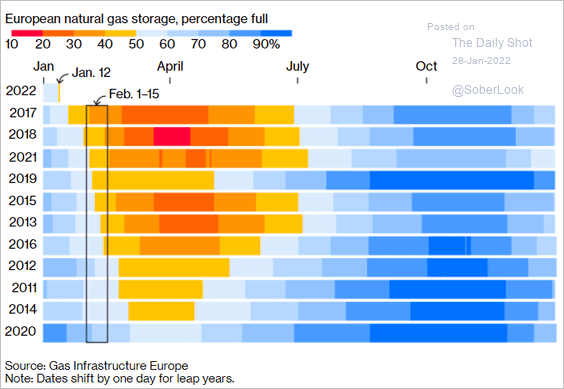 Source: Bloomberg Read full article
• Russian gas exports by destination:
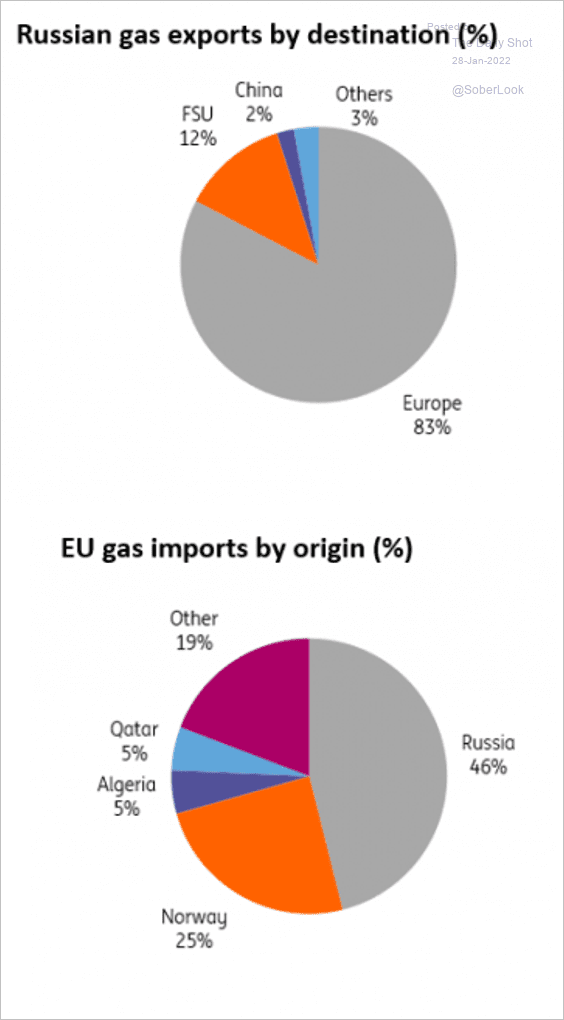 Source: ING
• European countries’ dependence on Russian gas:
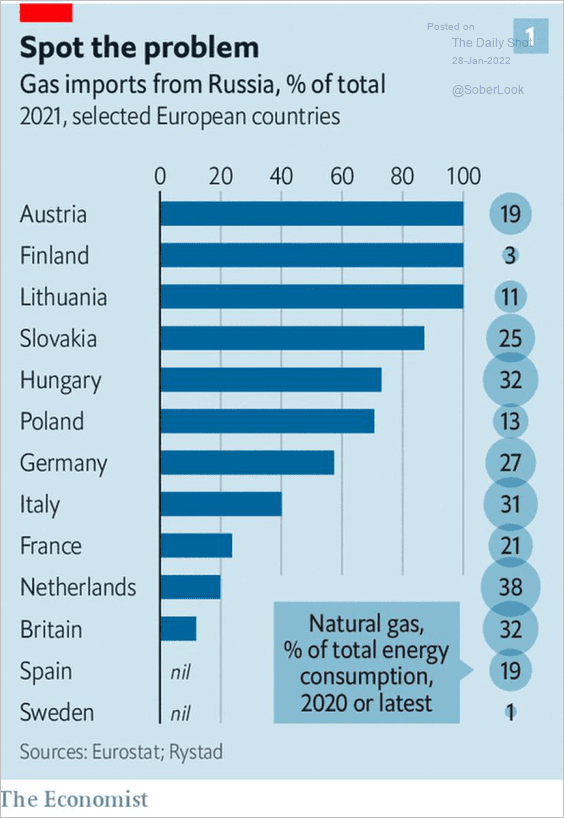 Source: @ericlchaney, @TheEconomist
• Global LNG export capacity growth:
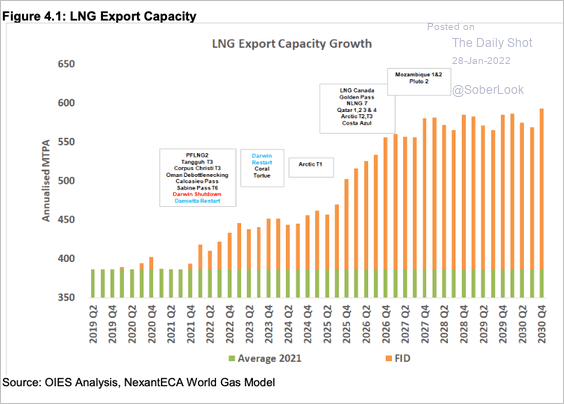 Source: Oxford institute for Energy Studies
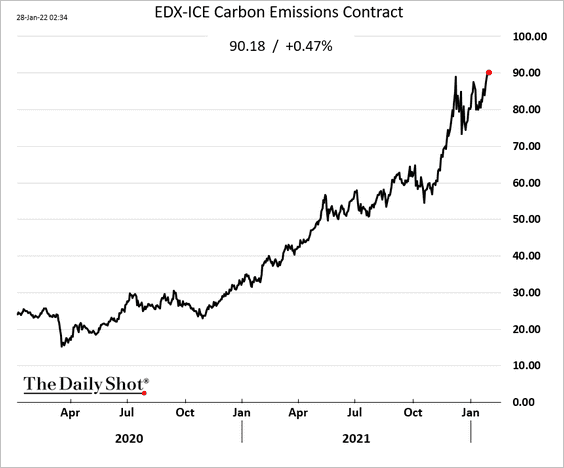
5. European carbon emissions contract prices are hitting new highs. Limited natural gas supplies force companies to burn more coal and offset their emissions using these contracts.
Back to Index
Equities
1. Valuations are approaching pre-COVID levels (which of course doesn’t mean stocks are cheap).
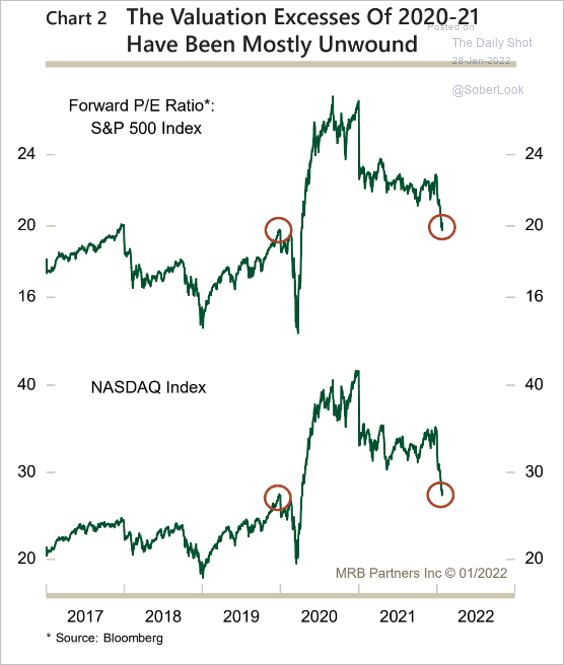 Source: MRB Partners
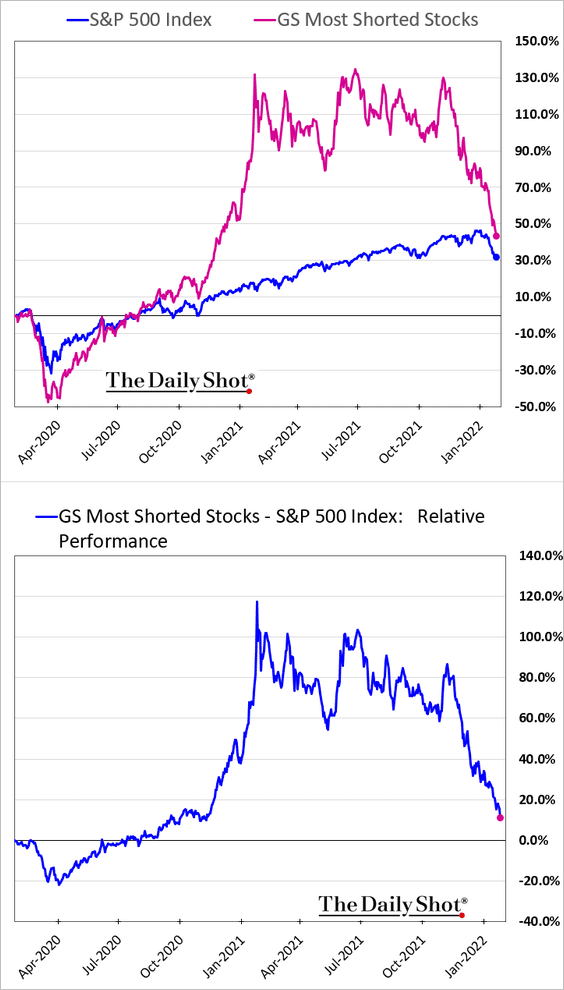
2. One useful indicator of the Reddit crowd’s positioning is the universe of most shorted stocks. Reddit’s WallStreetBets and other groups dispatched their army of followers to buy these stocks to generate a short squeeze. They did, sending US short interest to multi-decade lows. But these retail investors were left holding the bag, and the unwind has been ongoing for several months.
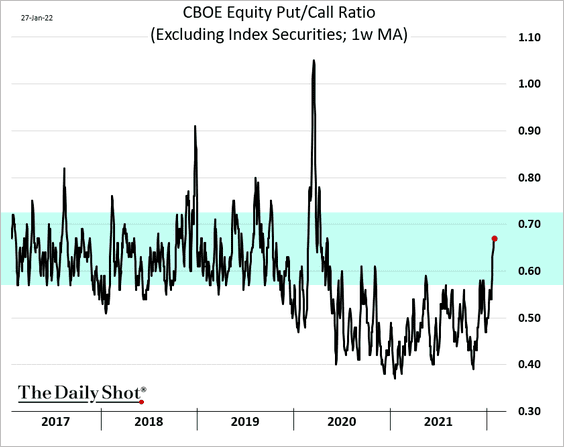
3. The put-call ratio is back inside the pre-COVID range.
4. The SPAC rout has been severe, …
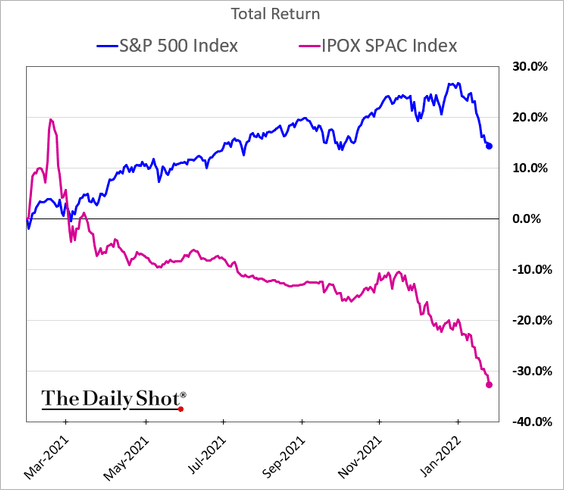
… resulting in many deals getting pulled.
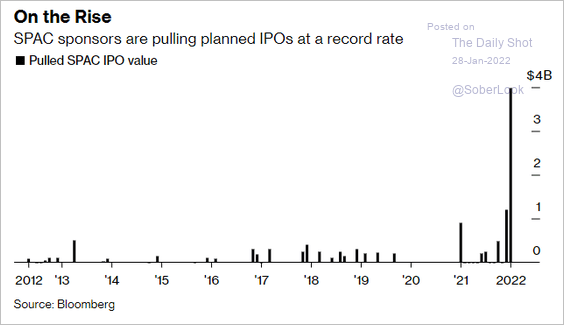 Source: Bloomberg Read full article
——————–
5. The S&P beats-misses spread has weakened, which has been adding pressure to equity markets.
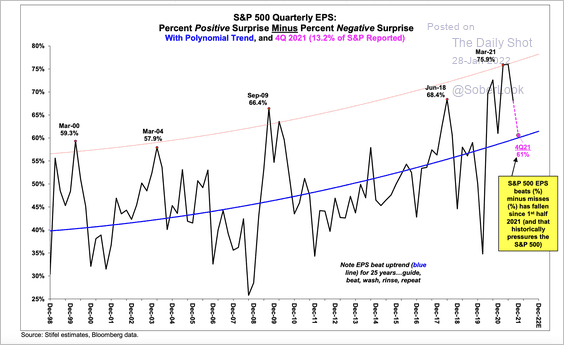 Source: Stifel
6. Here are the top-ten Nasdaq selloffs in January.
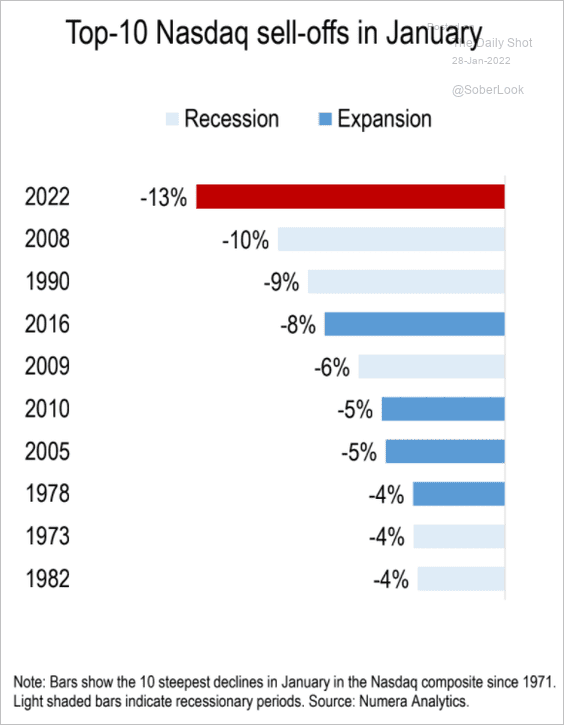 Source: Numera Analytics
7. Trading activity over the past week was similar to what occurred in 1998 when stocks suffered a mini-crash.
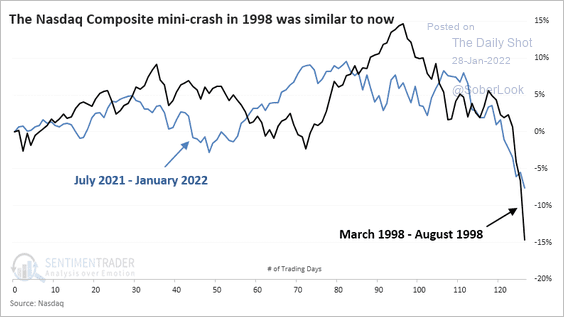 Source: SentimenTrader
8. Some 5% of S&P 500 tech stocks are trading above their 50-day moving average.
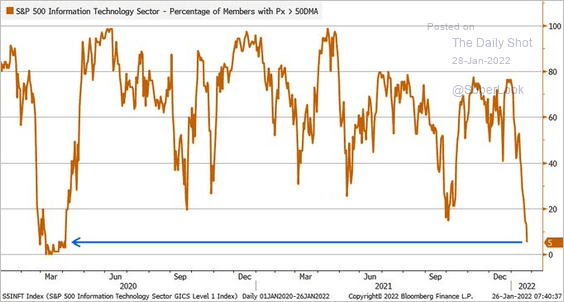 Source: @LizAnnSonders
9. Stocks with higher valuations sold off more.
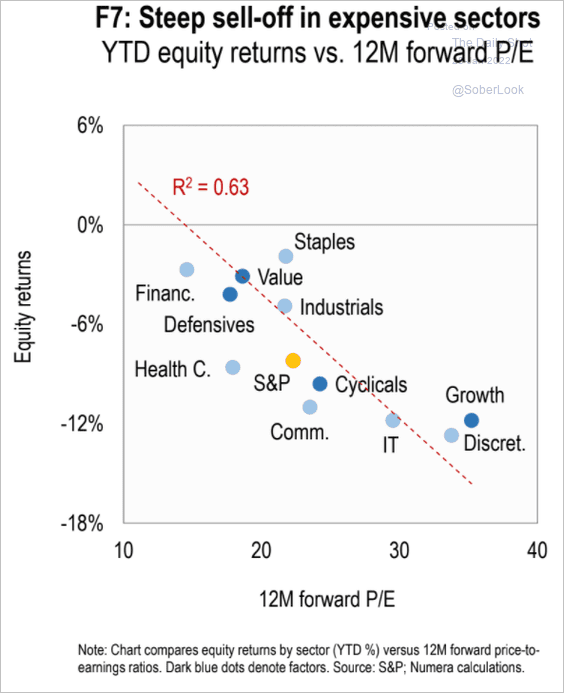 Source: Numera Analytics
Back to Index
Alternatives
1. Commercial real estate transactions surged last year, …
![]() Source: Deutsche Bank Research
Source: Deutsche Bank Research
… while cap rates remained near multi-year lows.
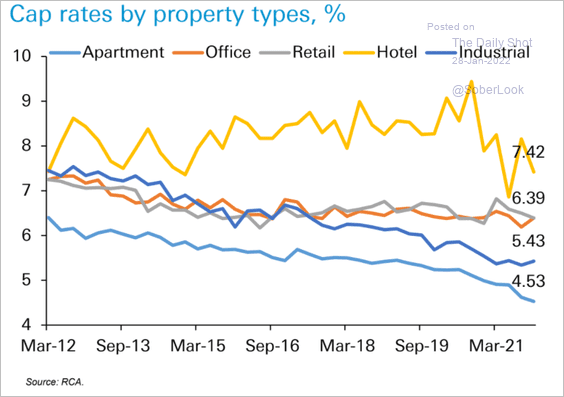 Source: Deutsche Bank Research
——————–
2. Venture capital deal value for early-stage startups in the US reached a record high of $80 billion last year.
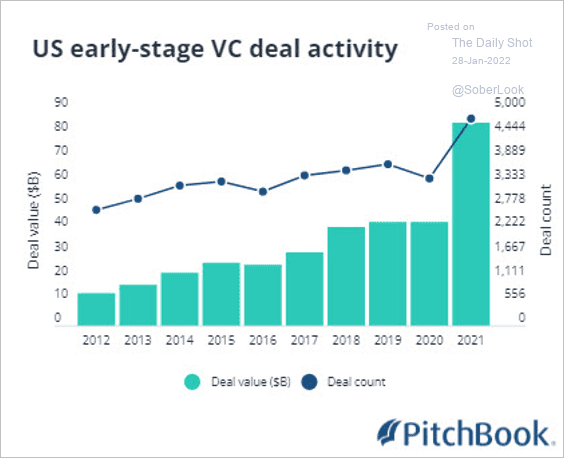 Source: PitchBook
Back to Index
Credit
1. Flight out of high-yield bonds pushed income ETF flows into negative territory this month.
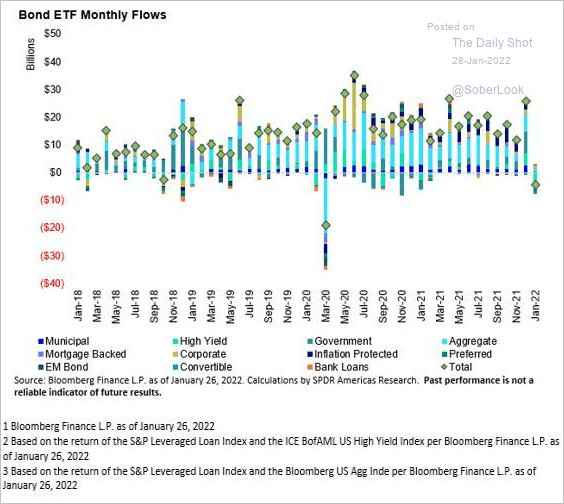 Source: SPDR Americas Research, @mattbartolini Read full article
2. Next, we have some data on US fixed income issuance, …
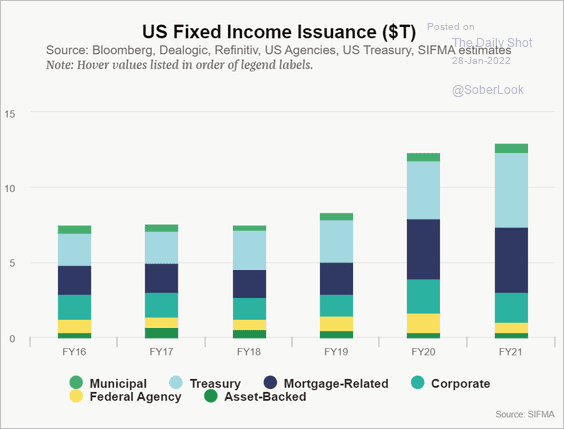 Source: SIFMA
… and trading volumes.
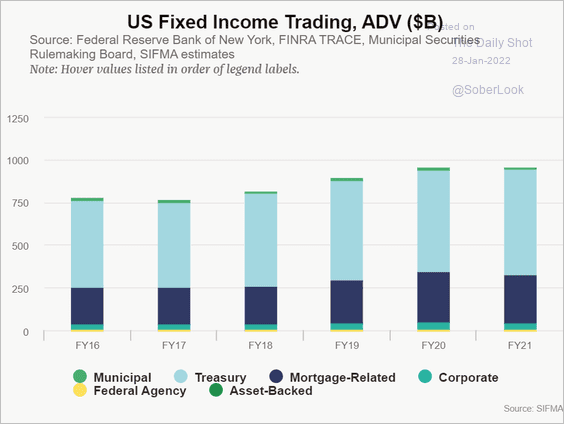 Source: SIFMA
Back to Index
Rates
1. The Treasury curve keeps flattening as the front end prices in more rate hikes.
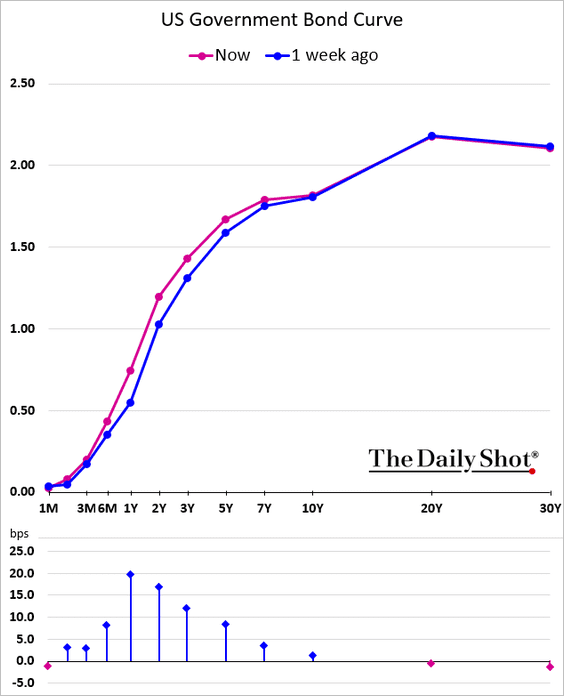

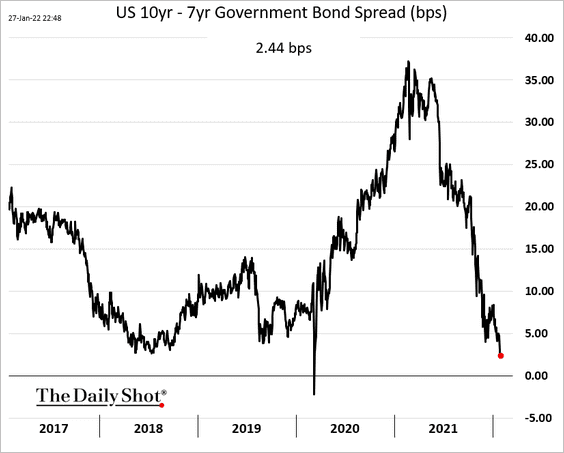
The spread between the 10yr and the 7yr Treasury yields is nearing zero.
——————–
2. SOFR derivatives volume continues to surge.
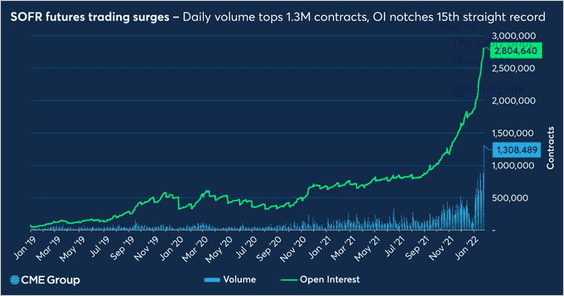 Source: @CMEGroup
Back to Index
Global Developments
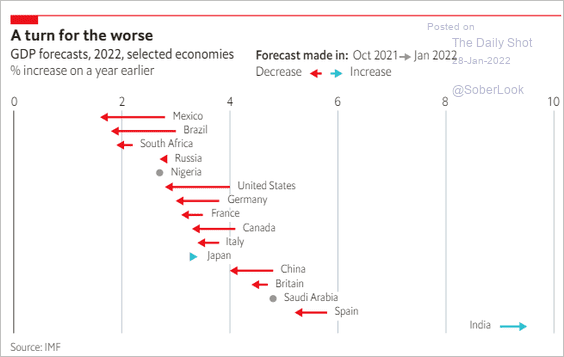
1. 2022 GDP growth forecasts are getting downgraded.
 Source: The Economist Read full article
2. Auto production is recovering suggesting some bottlenecks are easing.
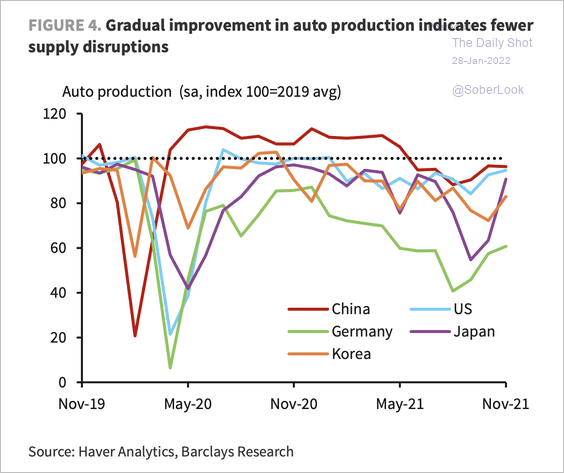 Source: Barclays Research
3. The decline in the Baltic Dry Index (dry bulk shipping costs) could point to easing supply chain pressures.
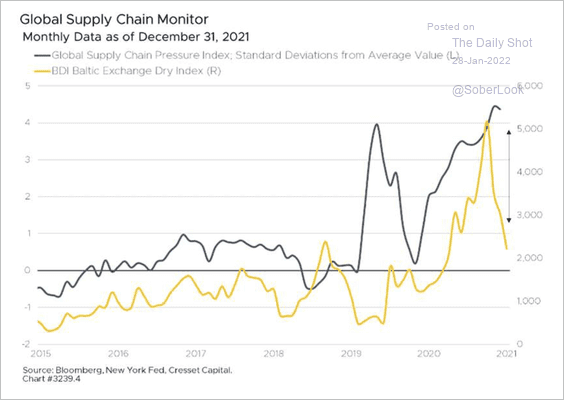 Source: Jack Ablin, Cresset Wealth Advisors
4. This pie chart shows the distribution of global equity market capitalization.
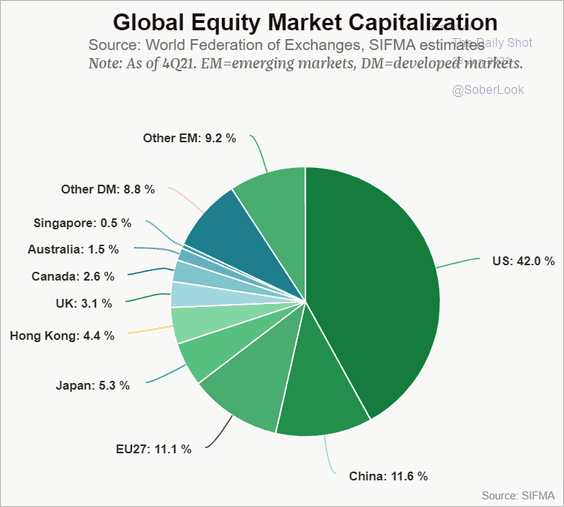 Source: SIFMA
5. This chart shows the global fiscal pandemic response by type.
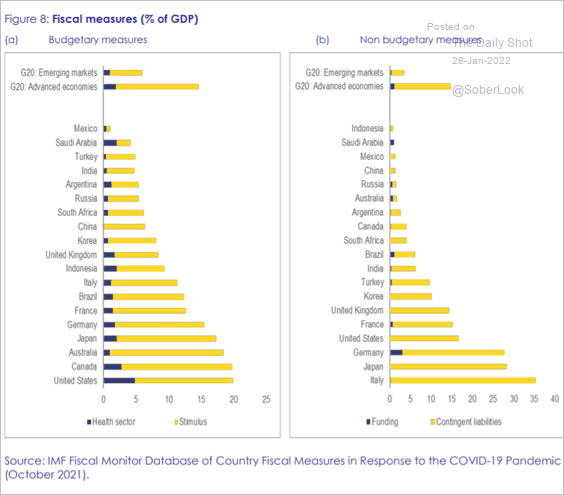 Source: EC Read full article
6. Manufacturing productivity gains will come from digitization, AI, and automation.
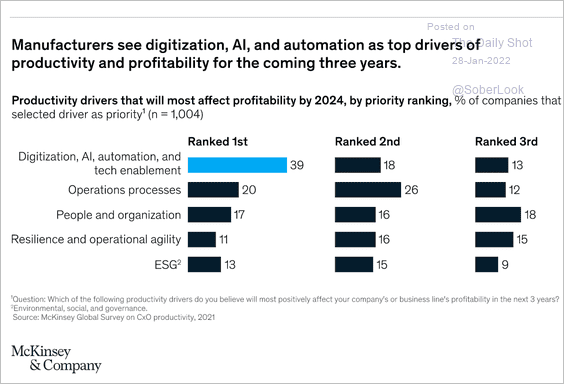 Source: McKinsey & Company
——————–
Food for Thought
1. Rising efficiency of working from home:
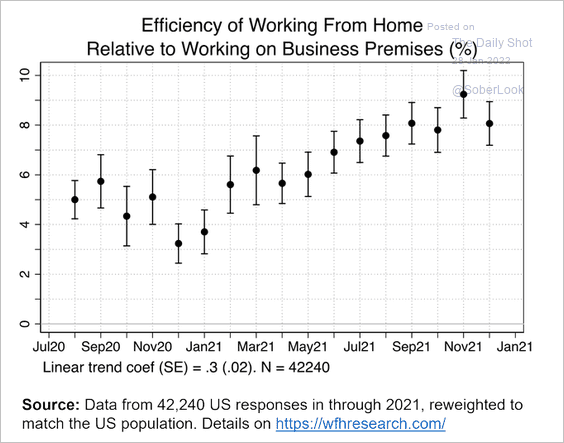 Source: @I_Am_NickBloom
2. Minimum wage increases:
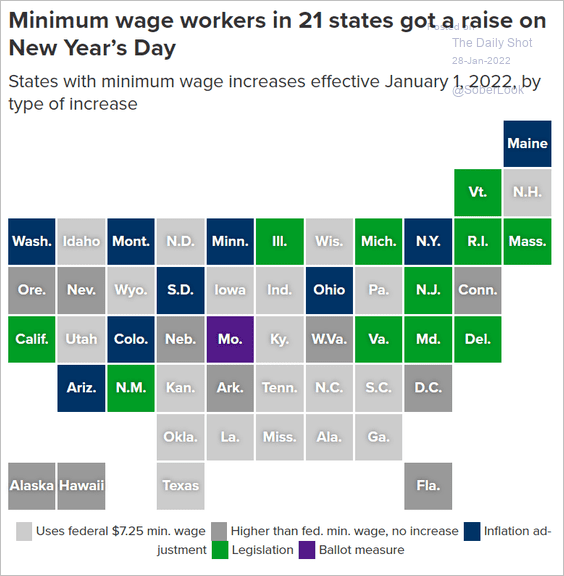 Source: EPI
3. US Senate polarization scores:
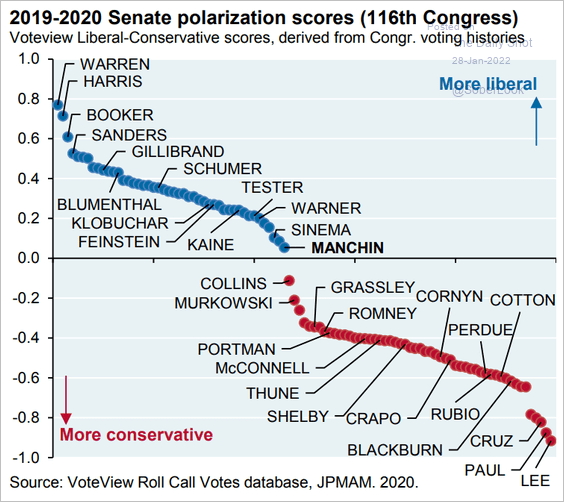 Source: J.P. Morgan Asset Management
4. Views on a plant-based diet:
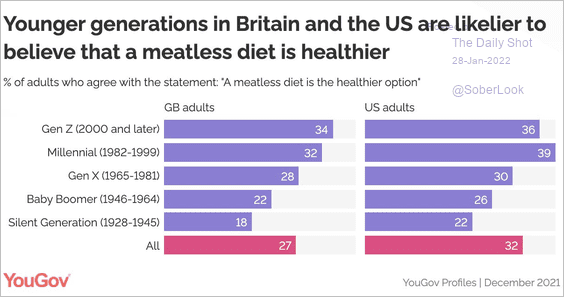 Source: @YouGov Read full article
5. COVID booster shots:
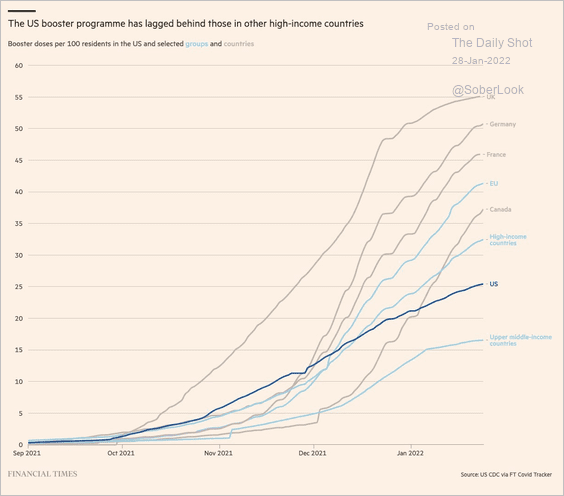 Source: @FinancialTimes Read full article
6. Global COVID cases:
 Source: Statista
7. Landmine casualties:
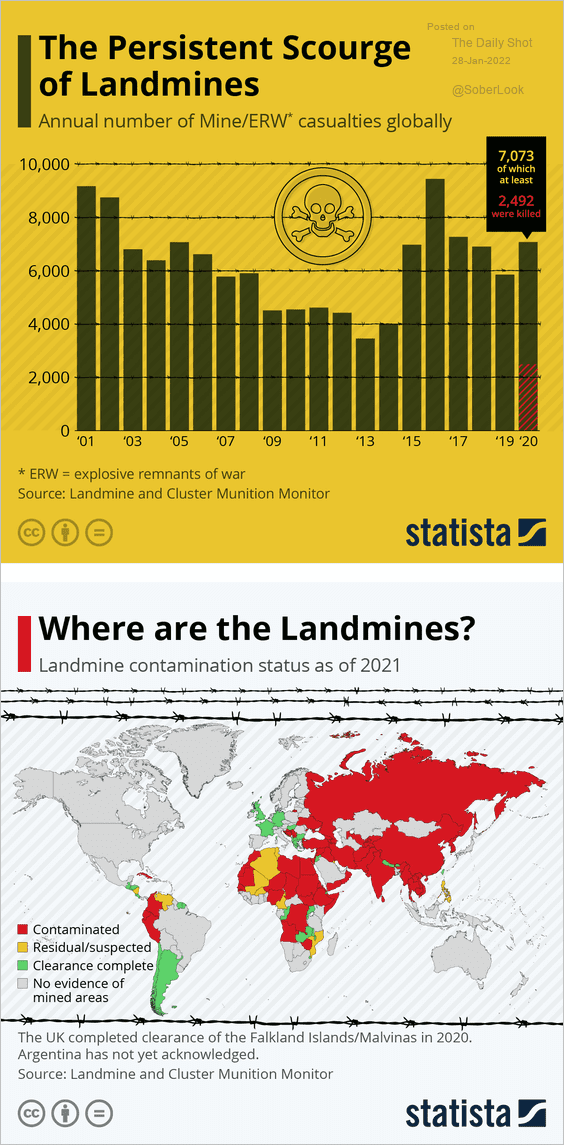 Source: Statista
8. Population growth in the largest economies:
 Source: @acemaxx, @greg_ip Read full article
9. Appliances backlog:
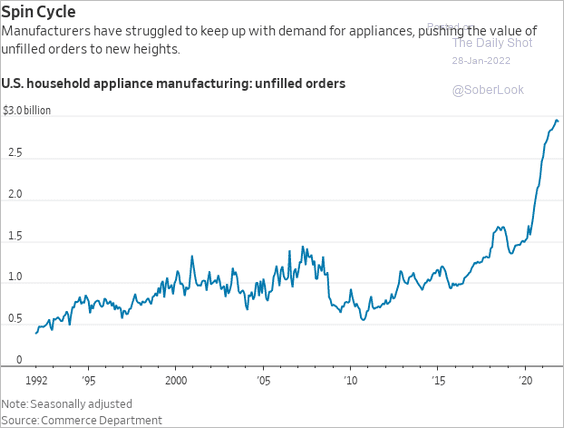 Source: @WSJ Read full article
10. Vinyl LP sales:
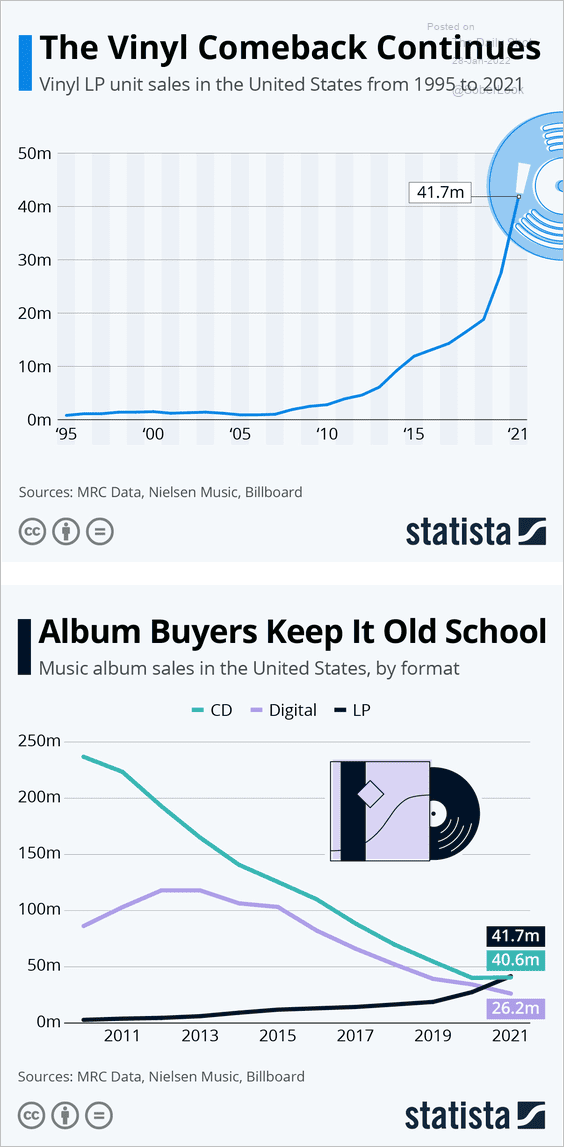 Source: Statista
——————–
Have a great weekend!
Back to Index