
The Daily Shot: 07-Feb-22
• The United States
• Canada
• The United Kingdom
• The Eurozone
• Australia
• China
• Emerging Markets
• Cryptocurrency
• Commodities
• Energy
• Equities
• Credit
• Global Developments
• Food for Thought
The United States
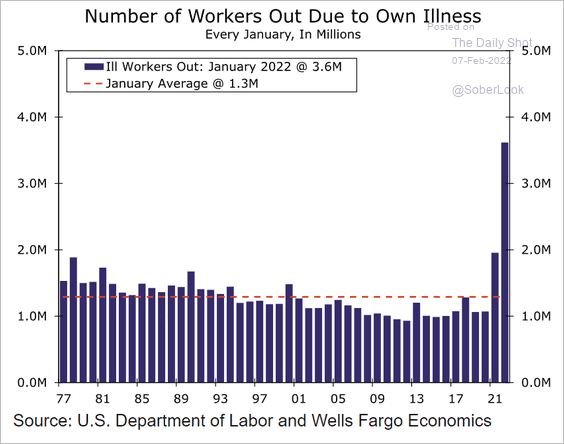
1. Economists knew that the January payrolls figures were going to be a bit of a wild card, with many expecting a decline due to omicron.
 Source: Wells Fargo Securities
But this report was well above any of the forecasts, showing nearly half a million jobs created.
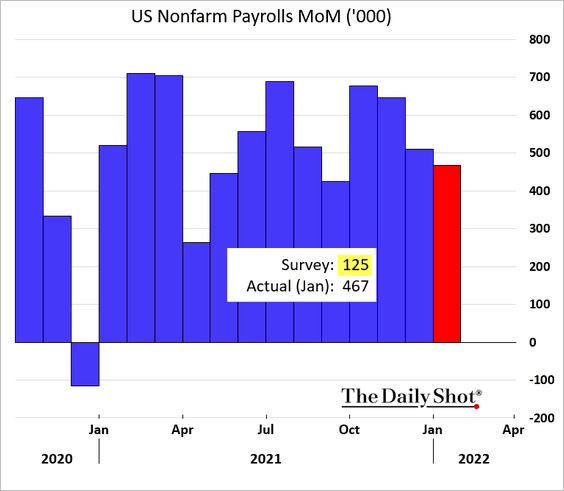
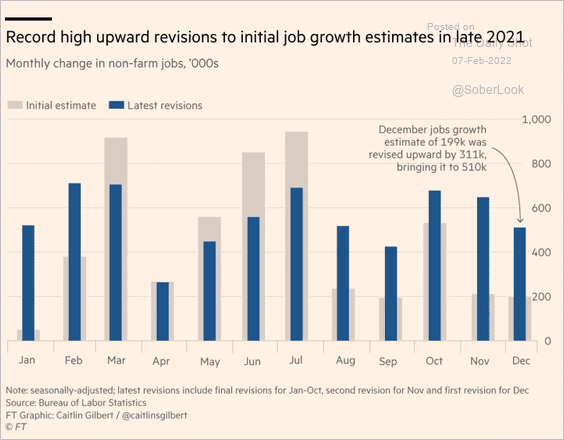
Moreover, there was another massive upward revision to the December figure.
 Source: @financialtimes Read full article
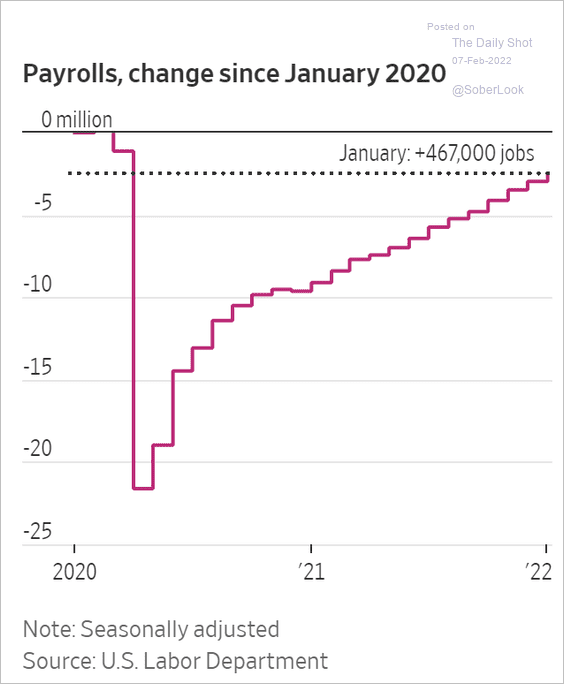
• Payrolls are approaching pre-COVID levels.
 Source: @WSJ Read full article
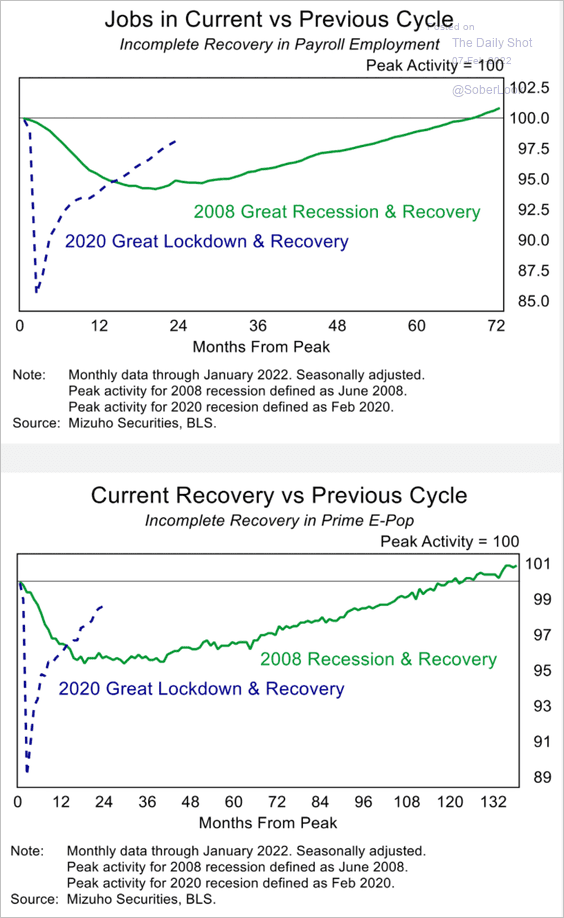
Here is the comparison to 2008. The second panel shows the prime-age employment-to-population ratio (relative change).
 Source: Mizuho Securities USA
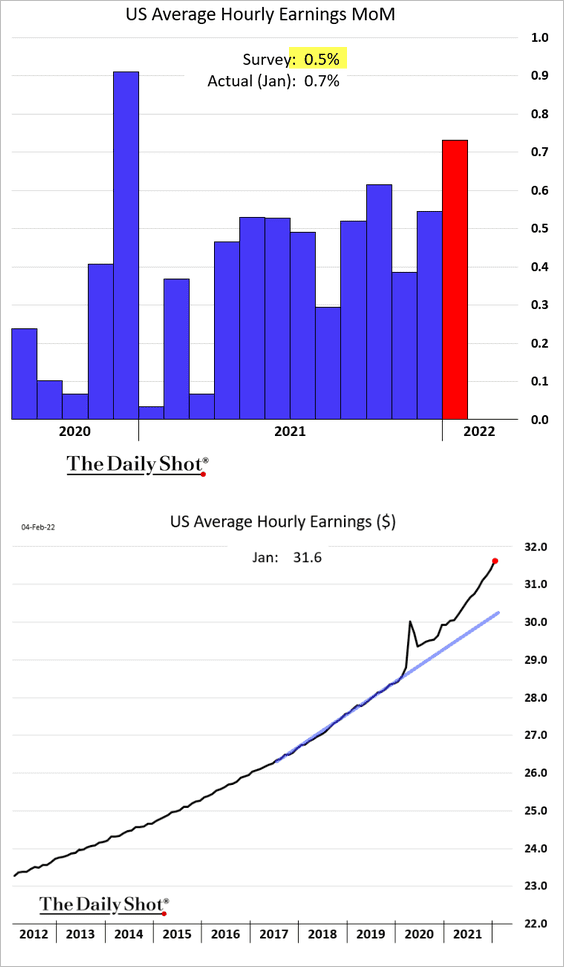
• Perhaps of greater importance for the Fed and the market was stronger than expected wage growth (including an upward revision).
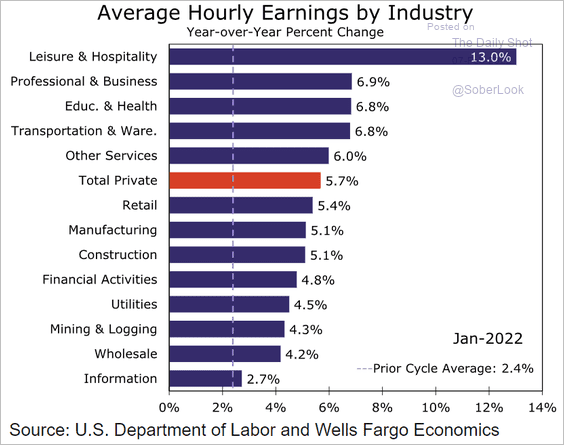
Below is wage growth by sector.
 Source: Wells Fargo Securities
• Labor force participation is rebounding, …
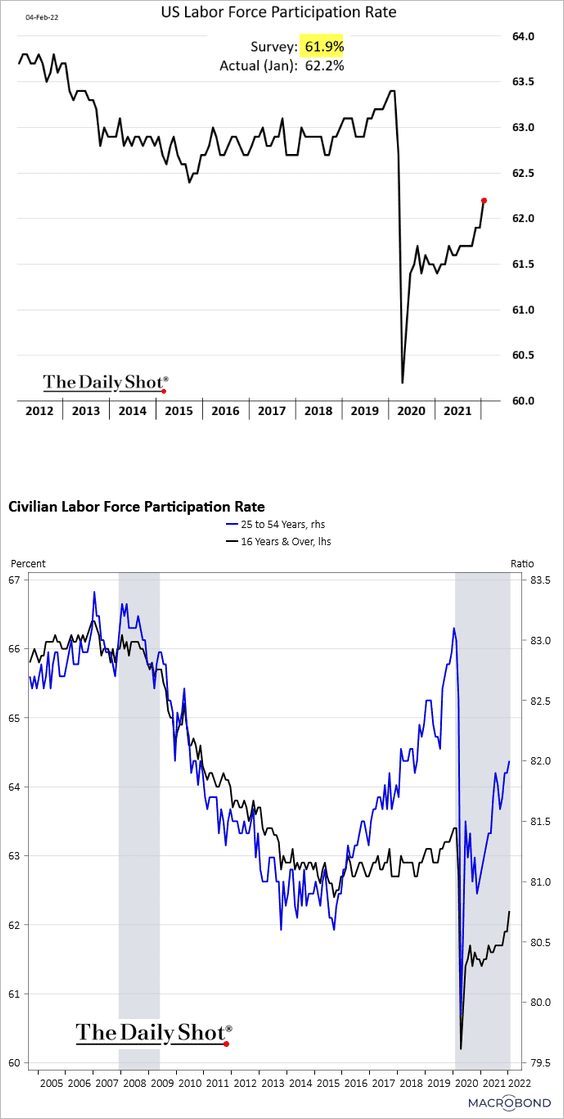
… as some older Americans return to work.
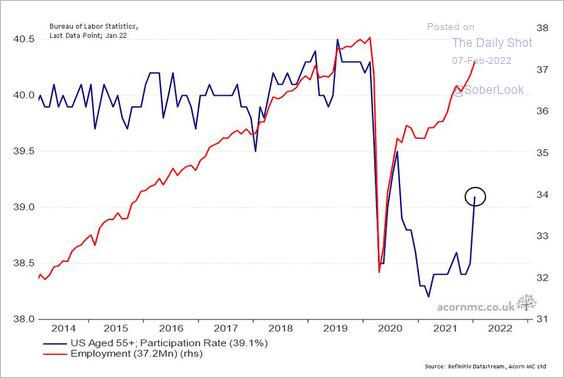 Source: @RichardDias_CFA
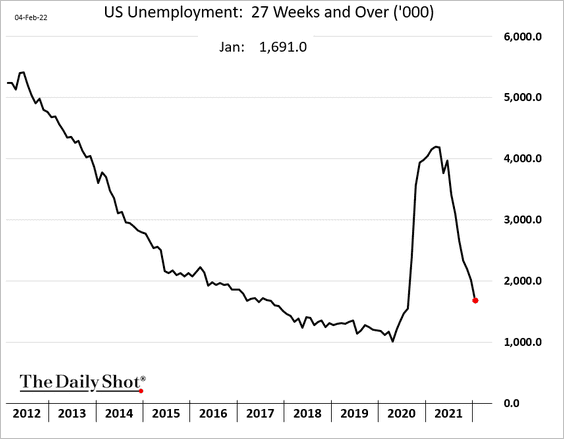
• Long-term unemployment continues to fall.
• One measure of labor slack is the number of people working part-time for economic reasons. And that pool is shrinking rapidly.

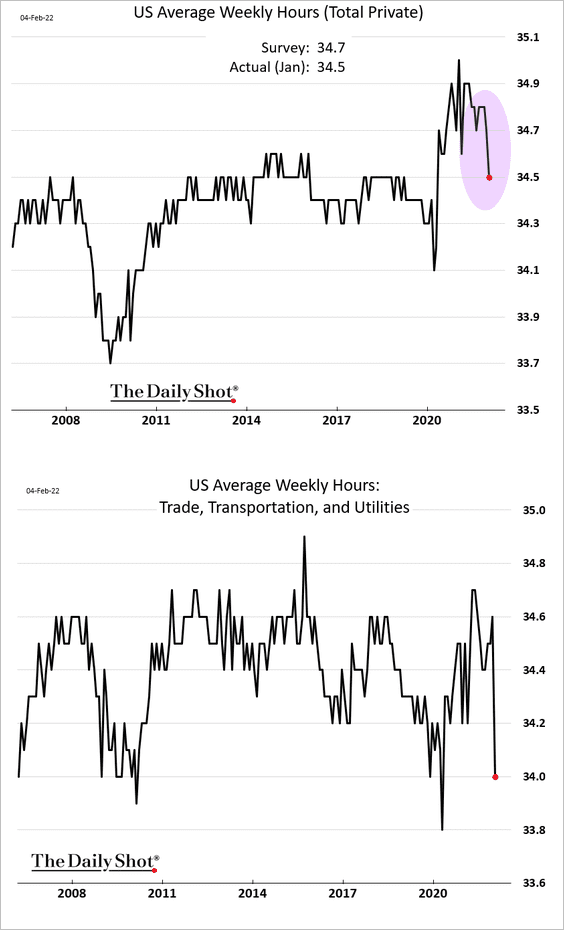
• Omicron took a toll on hours worked, especially in services.
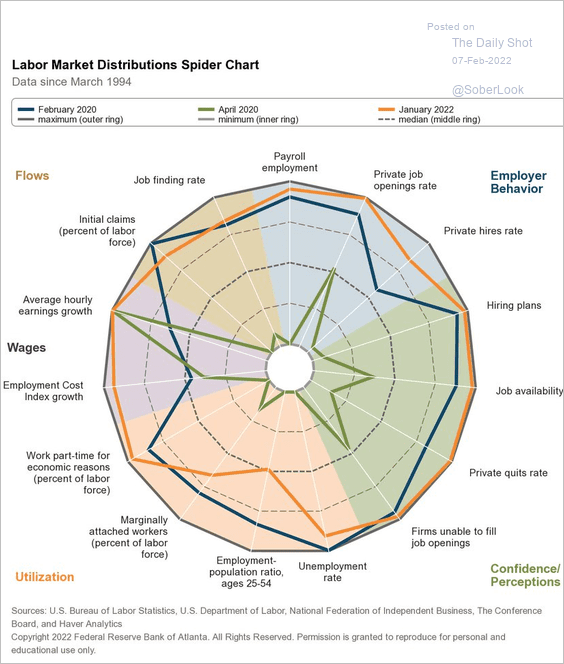
• Here is the Atlanta Fed’s labor market “dashboard.”
 Source: @AtlantaFed, @BLS_gov Read full article
——————–
2. Rate markets reacted strongly to the report, with Treasury yields climbing further.
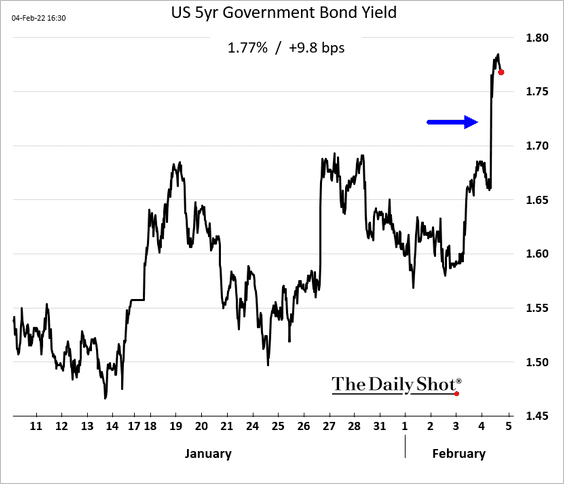
• The 2yr Treasury yield is nearing pre-COVID levels, …
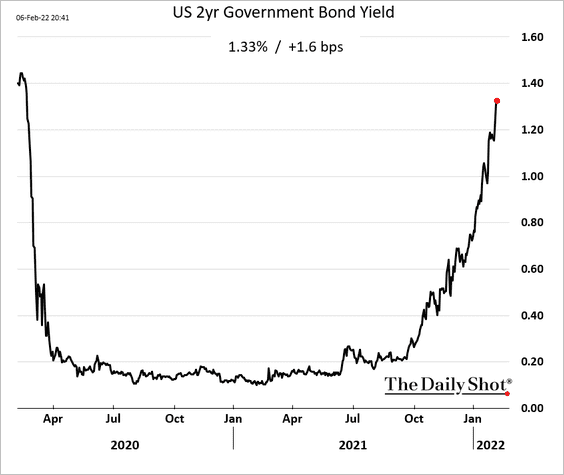
… as the yield curve keeps flattening (3 charts).
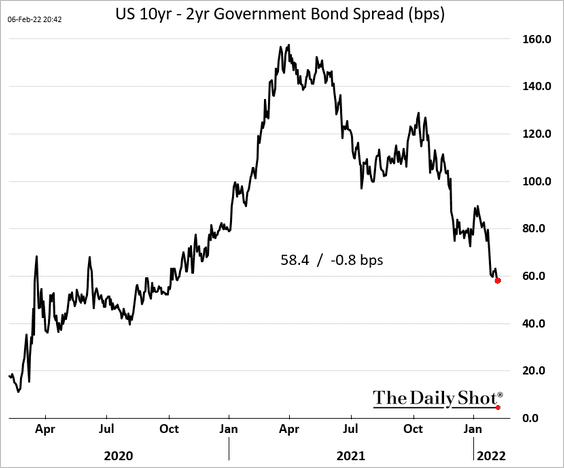
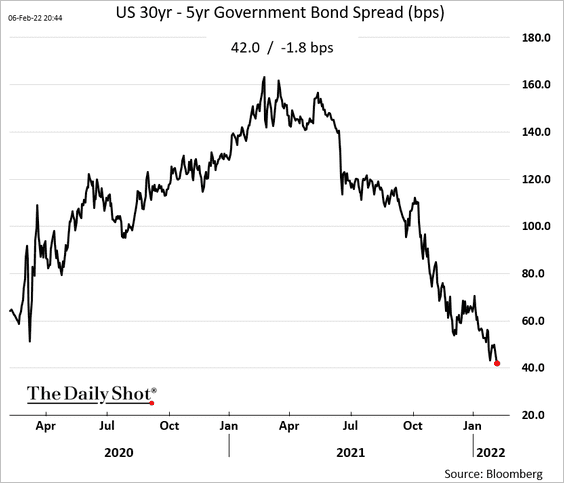
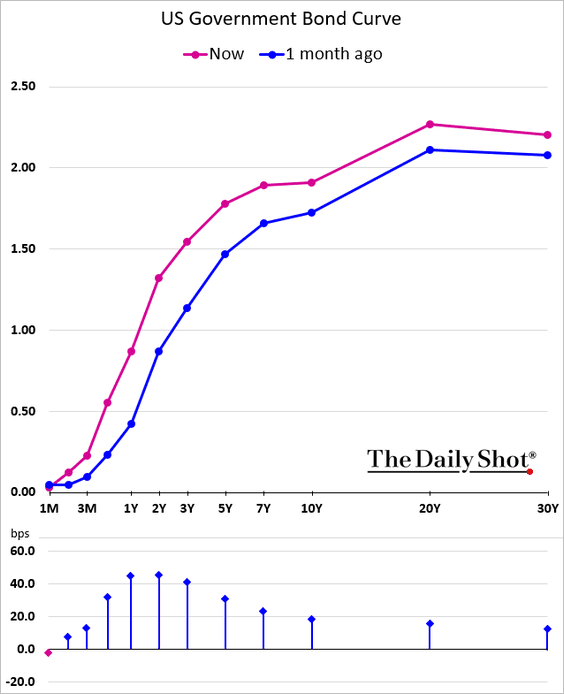
The pace of flattening in this cycle has been unusual.
 Source: @parrmenidies
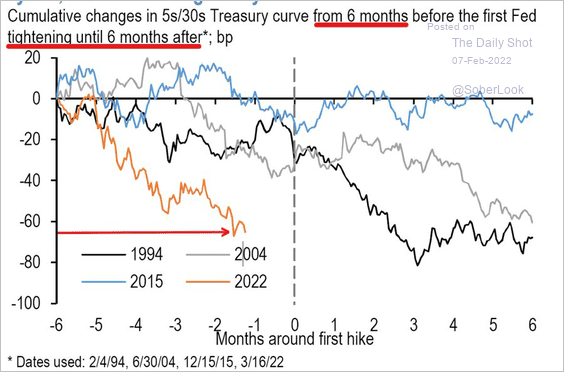
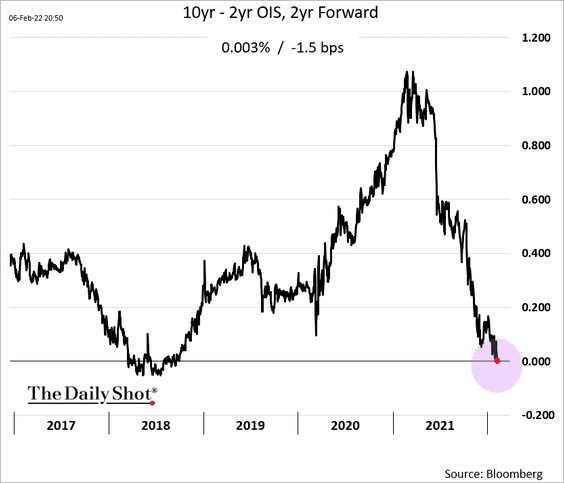
The market is now expecting the curve to begin inverting two years out.
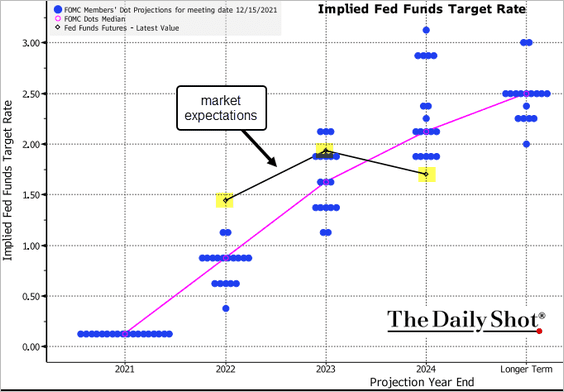
• This year’s rate hike expectations are now well above the FOMC’s dot plot. But the market is pricing in the possibility that by the end of 2024, the Fed will be forced to cut rates.
 Source: @TheTerminal, Bloomberg Finance L.P.
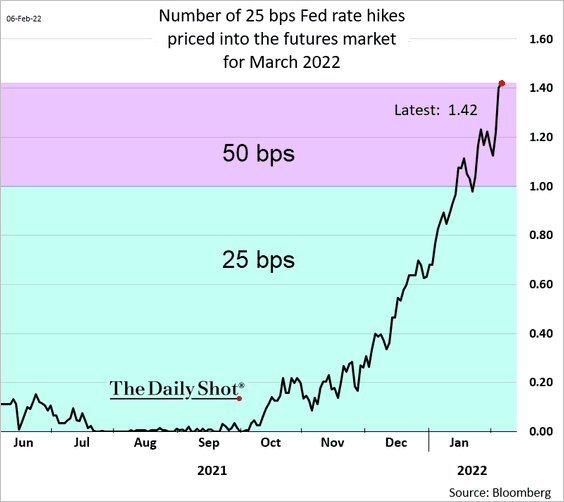
• Five 25 bps rate increases this year are now fully priced in, with the possibility of six increases on the rise. Note that the market does not expect a rate hike this month. …
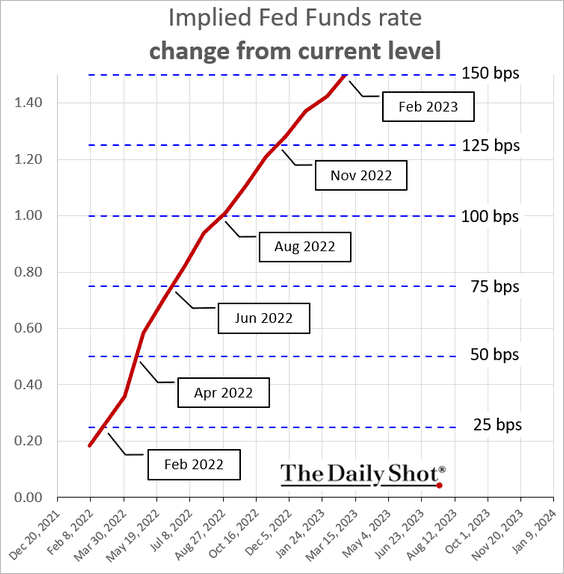
… Instead, the odds of a 50 bps rate increase rather than 25 bps in March are now above 40%.
——————–
3. Next, we have some updates on the housing market.
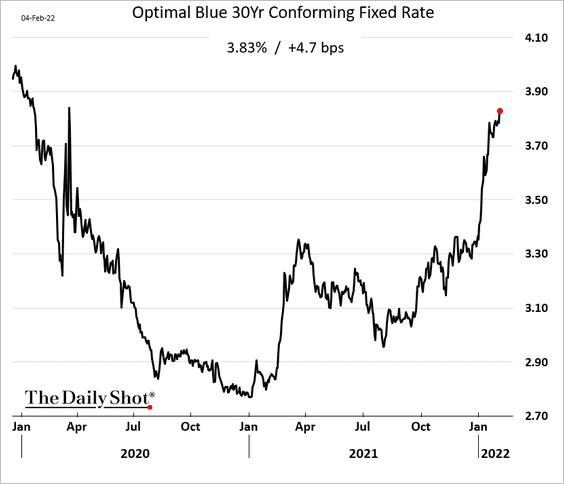
• Mortgage rates keep moving higher with Treasury yields.
• The nation’s rental vacancy rate hit the lowest level since the mid-1980s.
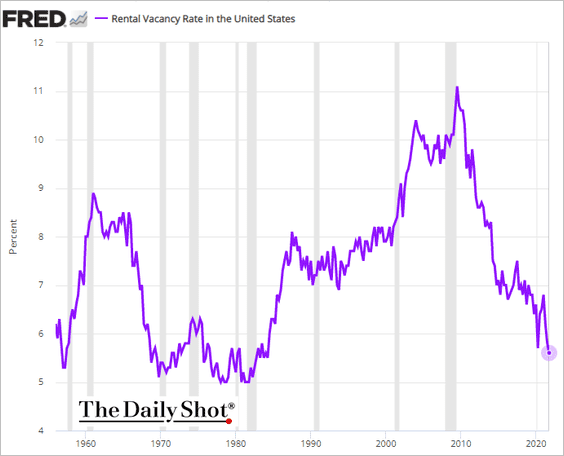
• There is an “undersupply” of 1.8 million vacant units.
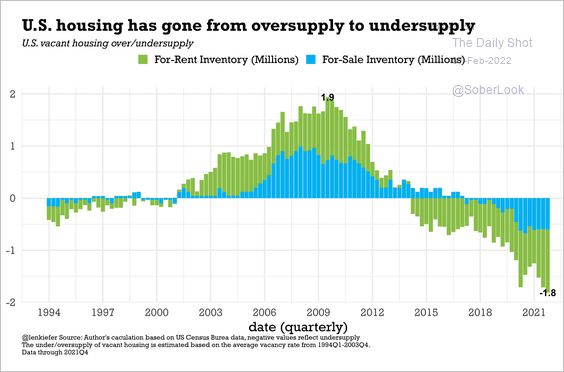 Source: @lenkiefer
• This chart shows the increase in home prices relative to inflation, which accelerated in the mid-90s.
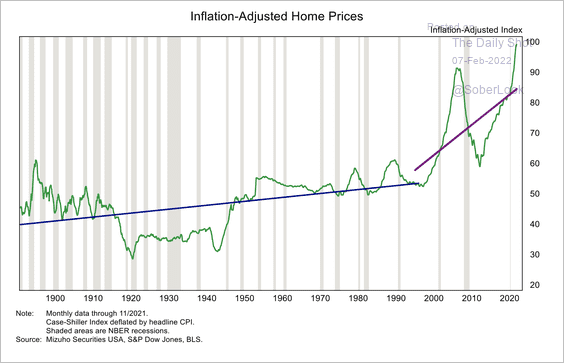 Source: Mizuho Securities USA
• Here is the US housing wealth as a percentage of GDP.
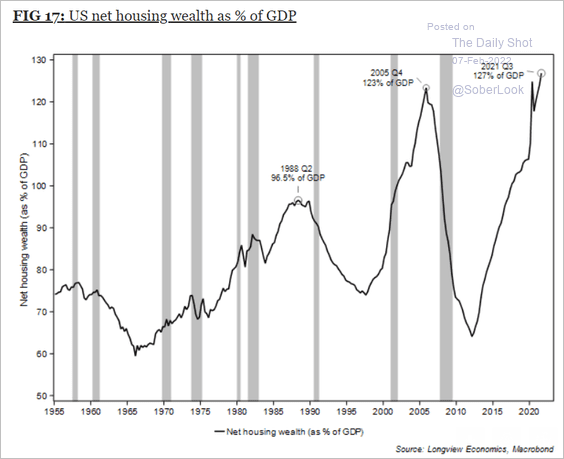 Source: Longview Economics
• Relative housing price changes reflect a move away from cities, toward more space, and away from economic regional hubs.
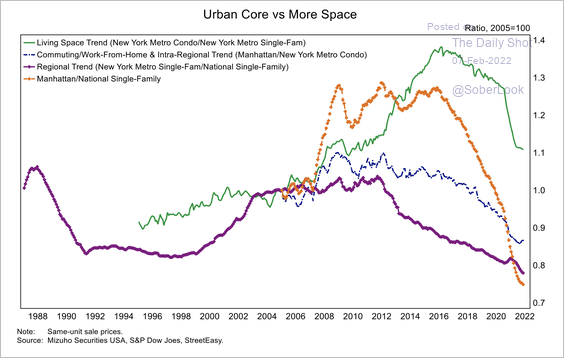 Source: Mizuho Securities USA
• Housing affordability has deteriorated.
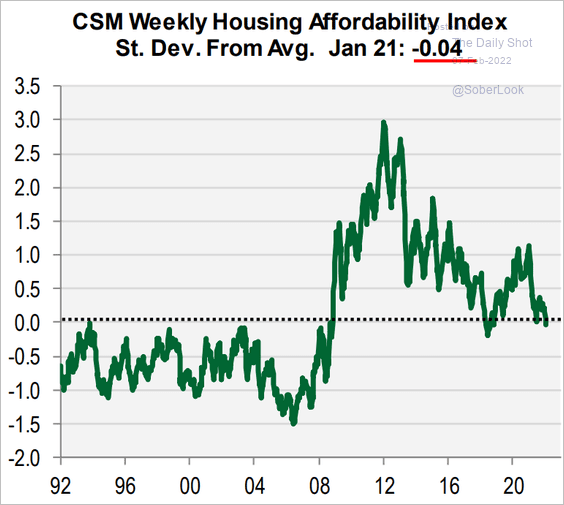 Source: Cornerstone Macro
• But demand for homes is expected to remain robust due to demographics.
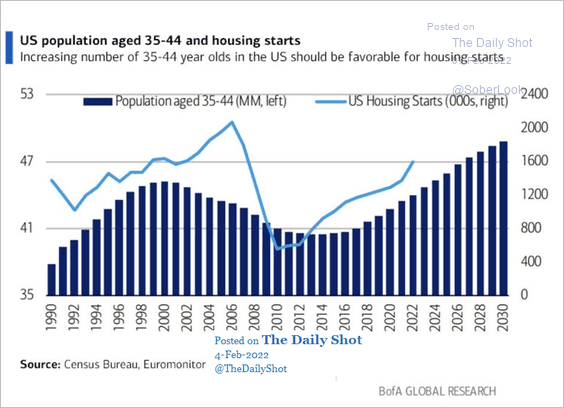 Source: @acemaxx, @BofA_Business, BofA Global Research
• Homebuilder sentiment points to stronger residential construction.
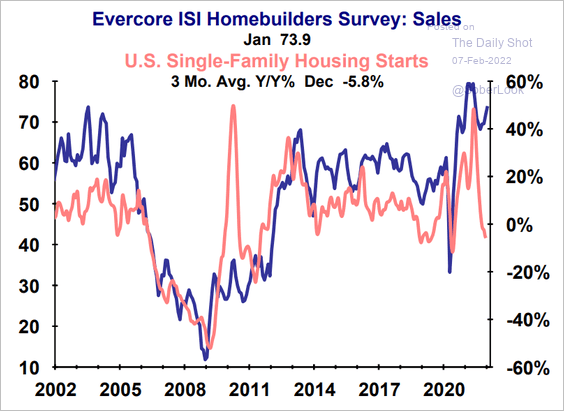 Source: Evercore ISI Research
• Due to supply shortages, building homes takes nine weeks longer on average than before the pandemic.
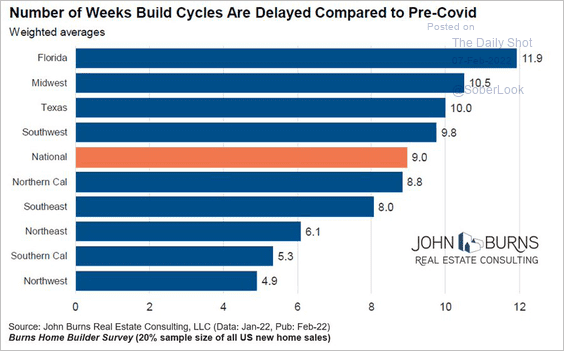 Source: @RickPalaciosJr
• Existing home prices have increased much more than new home prices over the past few years.
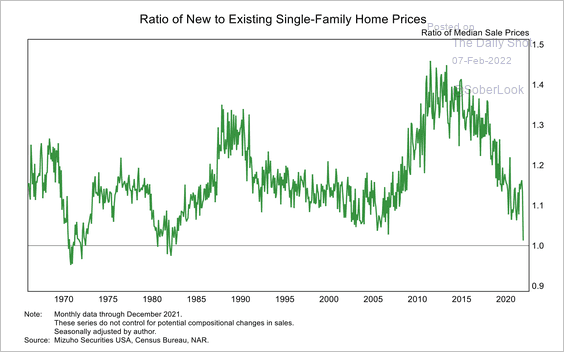 Source: Mizuho Securities USA
——————–
4. Mobility indicators have deteriorated, according to Cornerstone Macro.
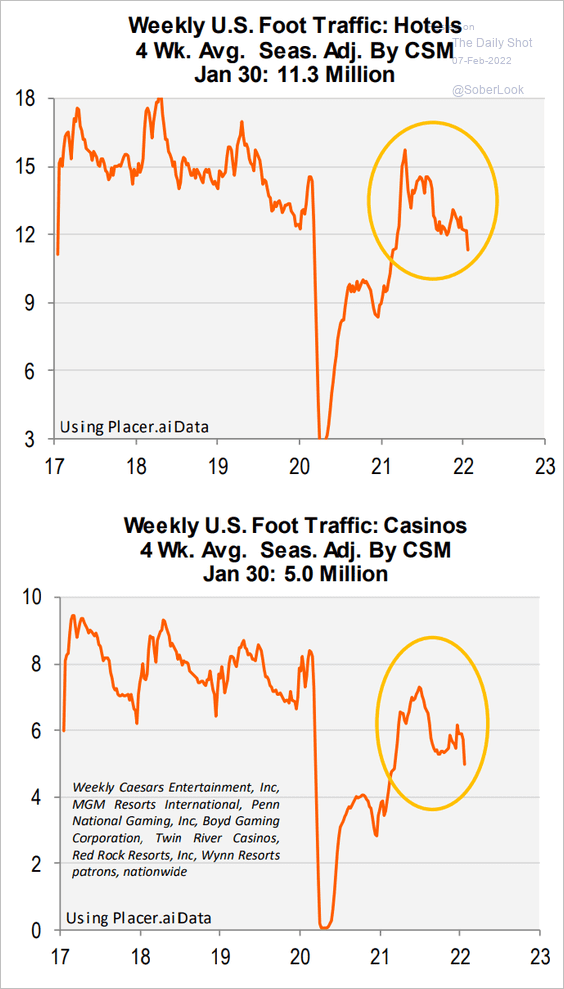 Source: Cornerstone Macro
Back to Index
Canada
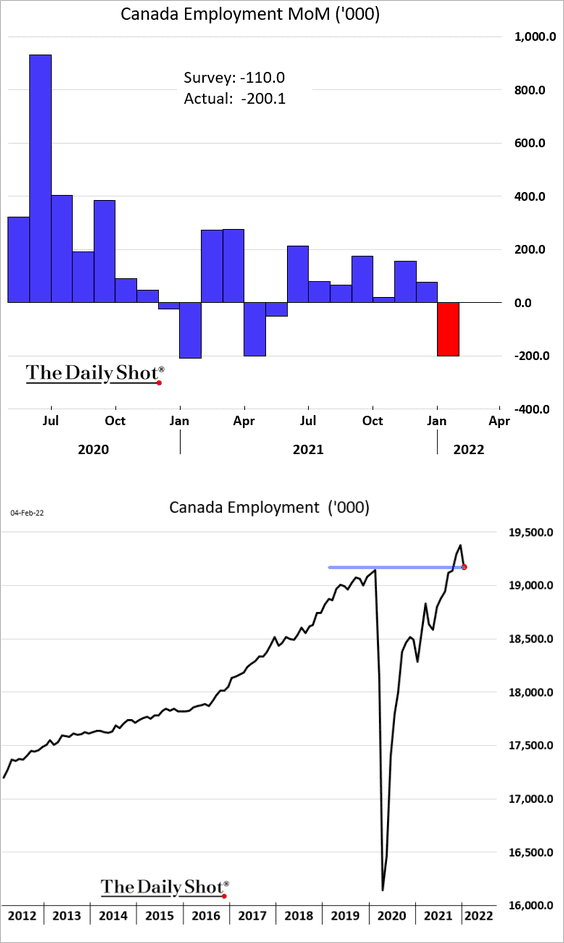
1. Omicron had a substantial impact on Canada’s payroll figures.
• Employment:
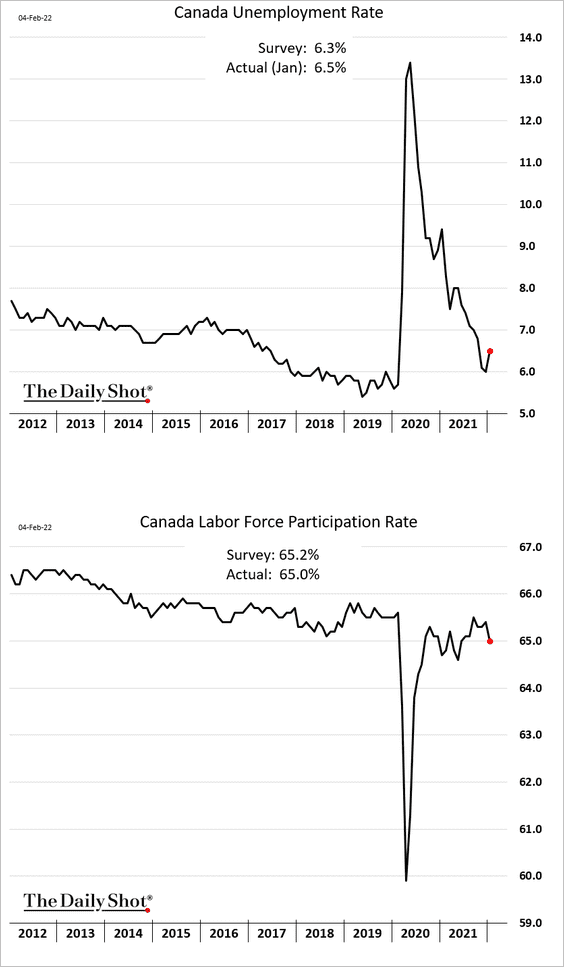
• The unemployment rate and labor force participation.
——————–
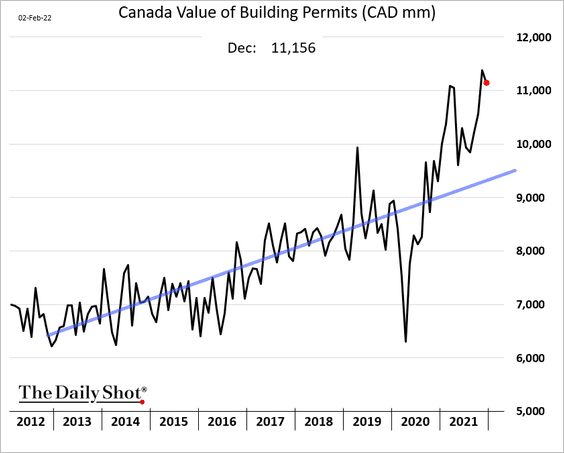
2. Building permits remain well above the pre-COVID trend.
3. Inflation is expected to moderate within the BoC’s target range.
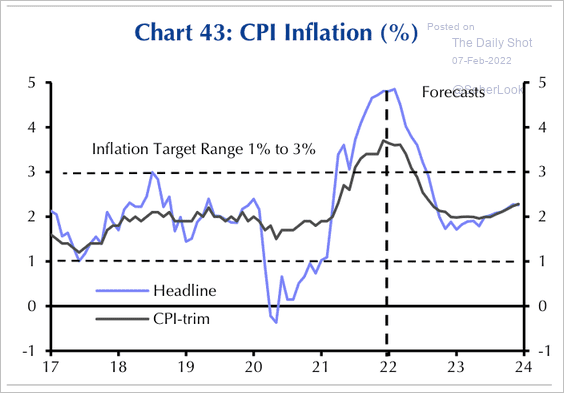 Source: Capital Economics
4. Capital Economics expects the household savings rate to continue lower over the next year.
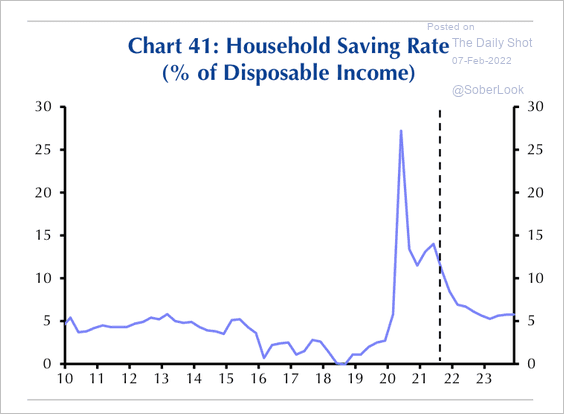 Source: Capital Economics
Back to Index
The United Kingdom
1. The BoE sharply boosted its inflation forecast for the next two years.
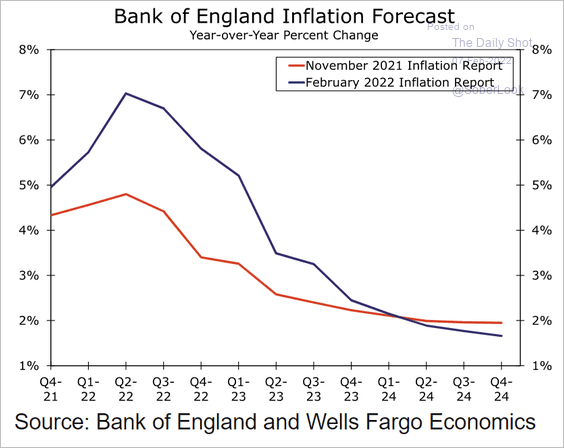 Source: Wells Fargo Securities Read full article
But the three-year projection was moved lower (rapid rate hikes are expected to slow growth and inflation).
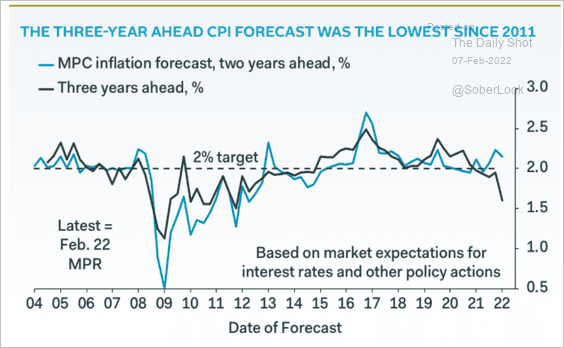 Source: Pantheon Macroeconomics
——————–
2. The gilt curve continues to flatten.
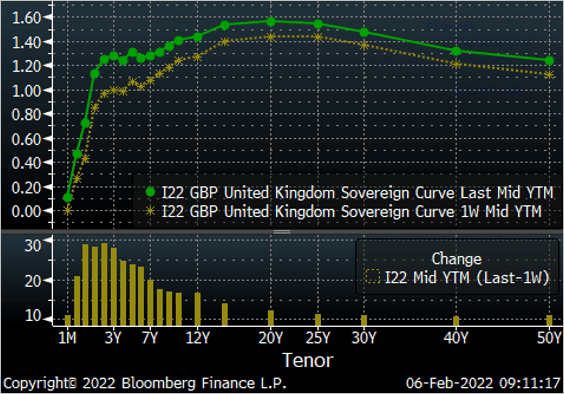 Source: @Marcomadness2
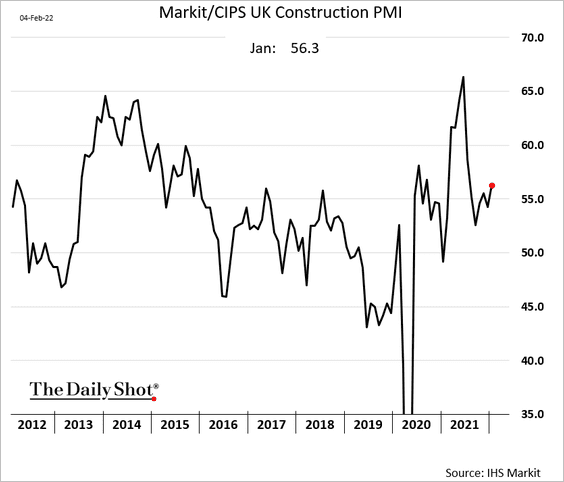
3. Construction activity picked up momentum last month.
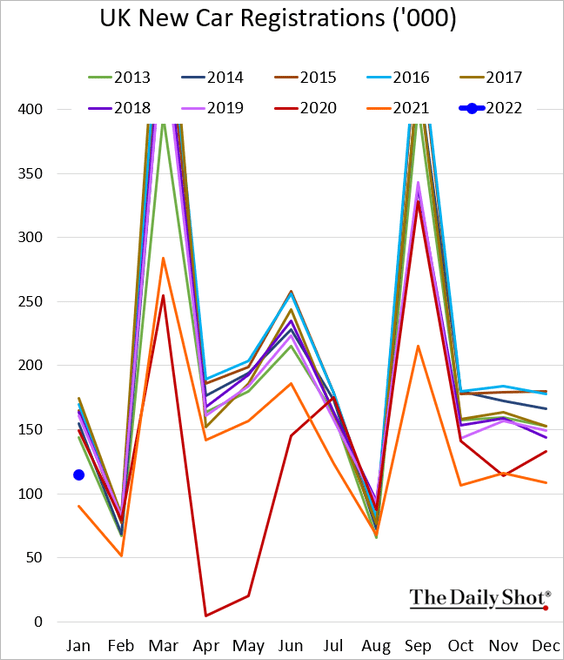
4. New car registrations remain soft.
Back to Index
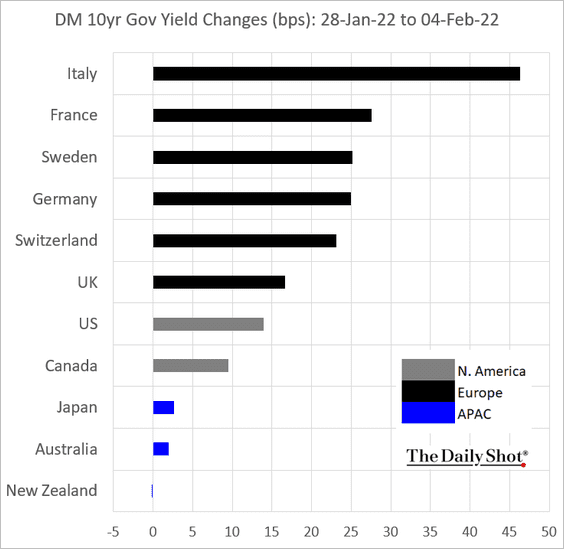
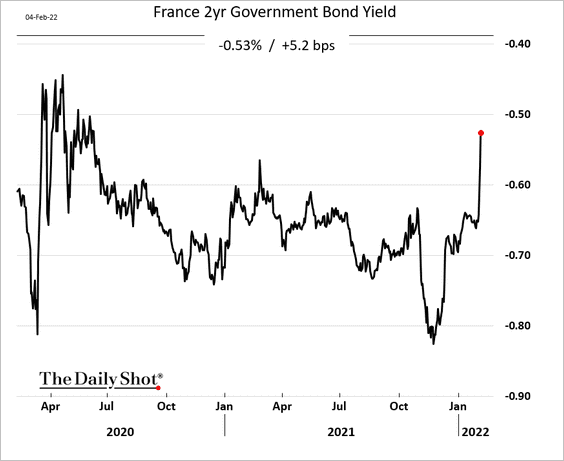
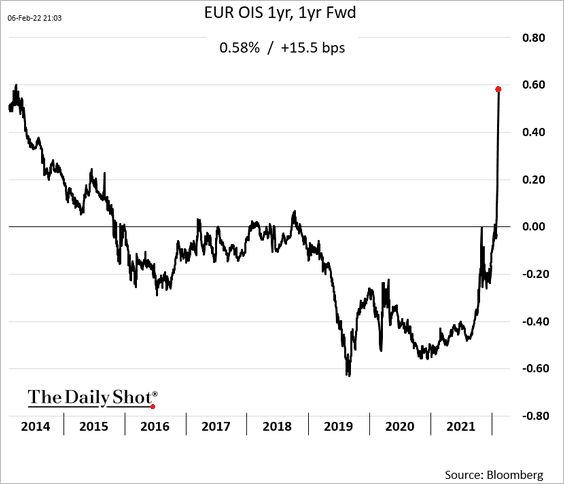
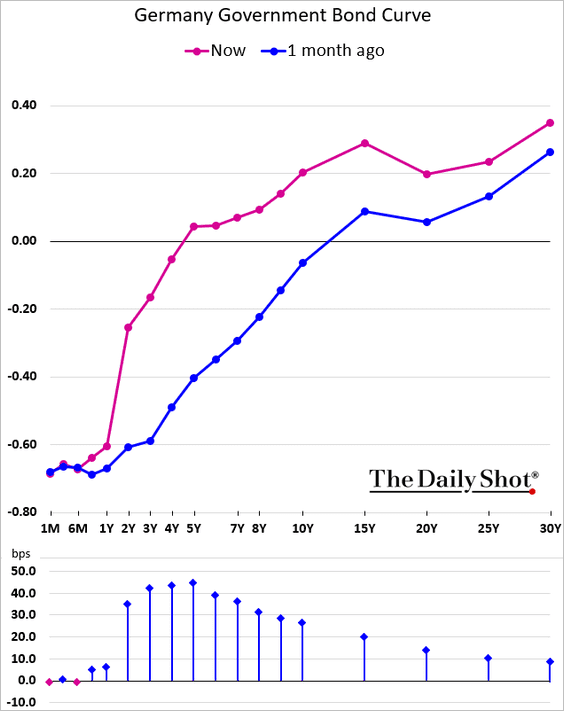
The Eurozone
1. The bond market continues to reprice the ECB’s policy trajectory.
• French 2yr yield:
• Euro short-term rate expectations one year out:
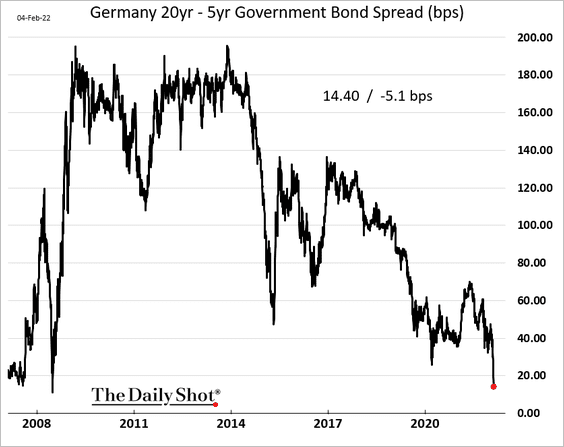
• Germany’s flattening yield curve (2 charts):
• And there is more hawkish news coming from the ECB.
 Source: Reuters Read full article
——————–
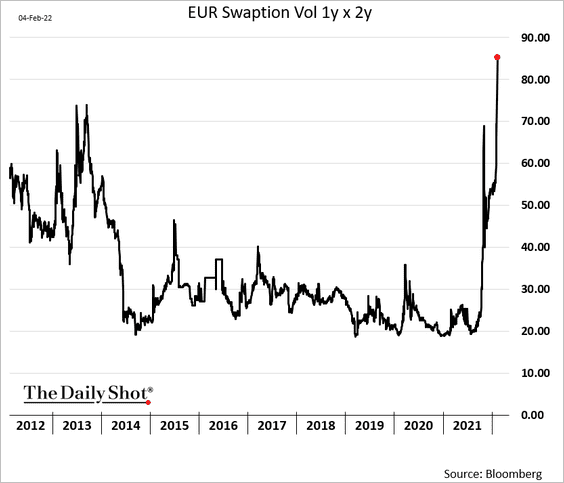
2. Rate volatility has been surging, …
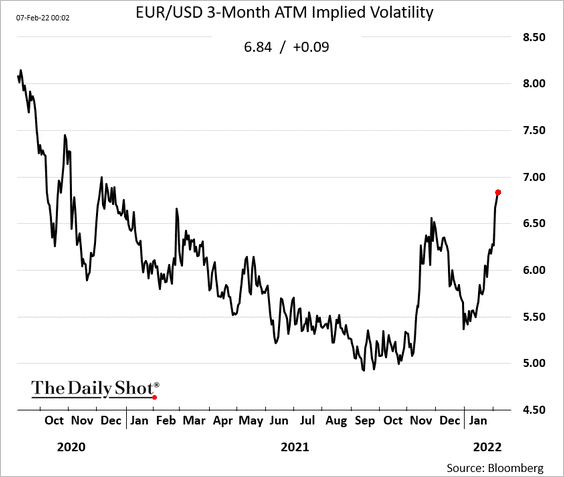
… and currency volatility is on the rise as well.
——————–
3. Higher bond yields should help European bank shares outperform.
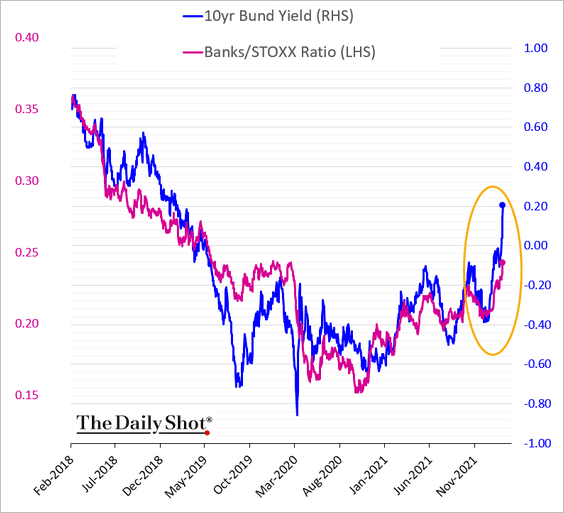 h/t @mikamsika
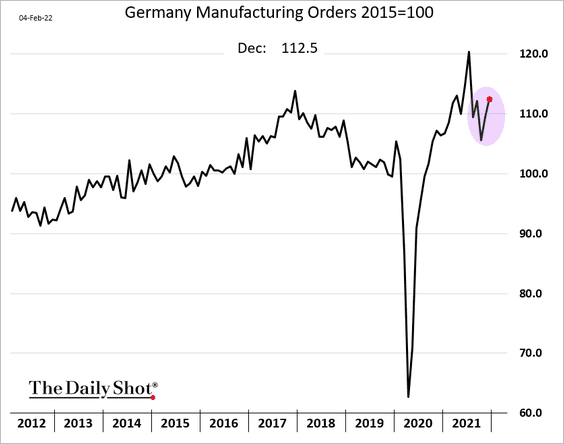
4. German factory orders strengthened in December.
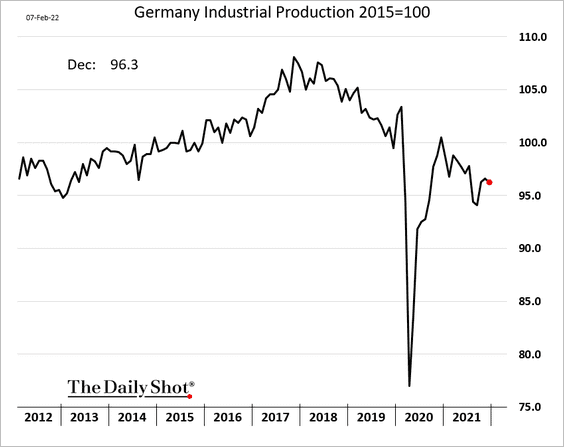
But industrial production continues to disappoint.
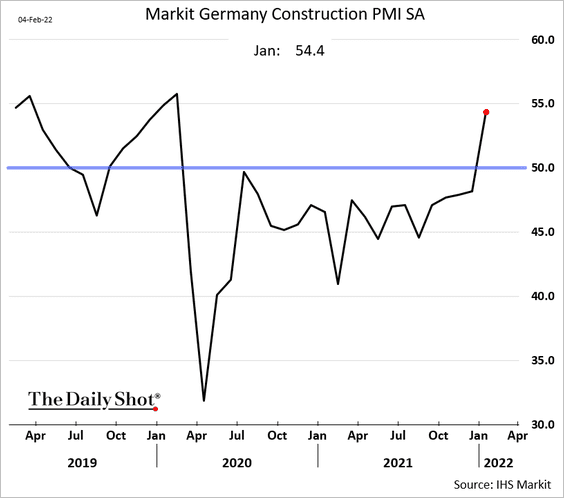
• Construction activity accelerated last month.
——————–
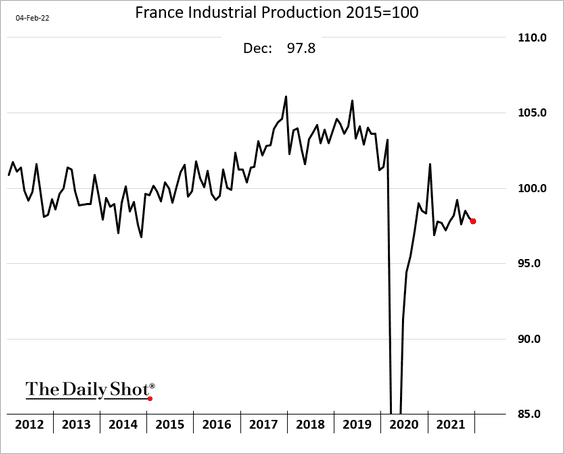
5. French industrial production was also softer than expected.
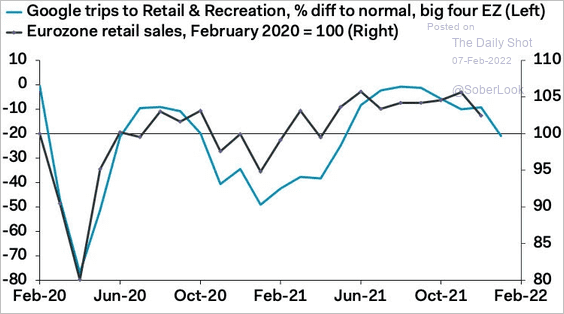
6. At the Eurozone level, retail sales declined sharply in December.
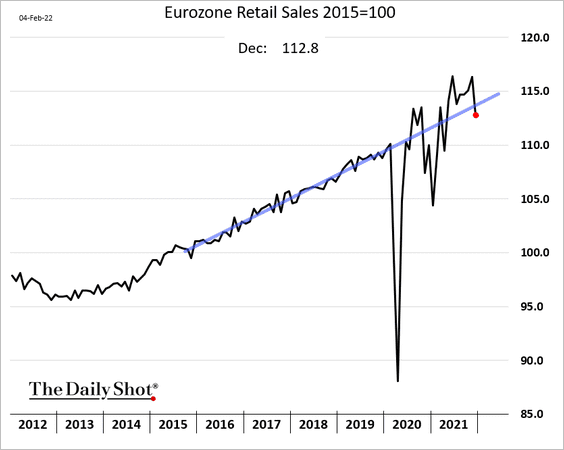
And we could see further weakness in January.
 Source: Pantheon Macroeconomics
Back to Index
Australia
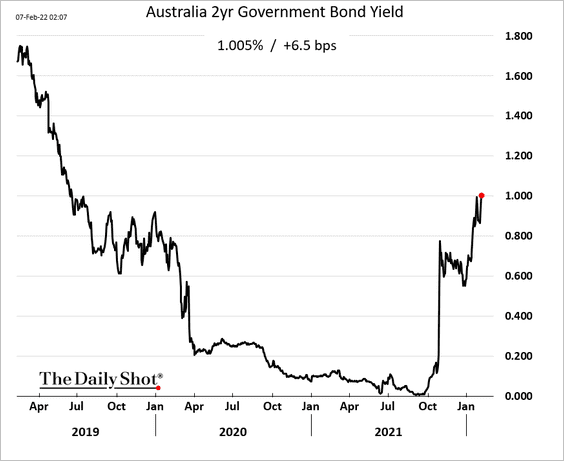
1. The 2-year yield is above 1% for the first time since mid-2019.
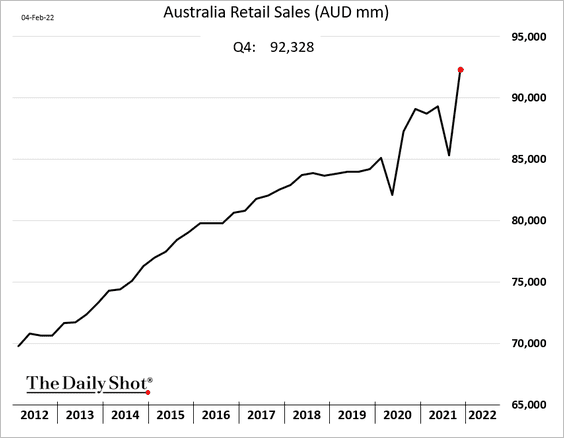
2. Retail sales surged last quarter.
Back to Index
China
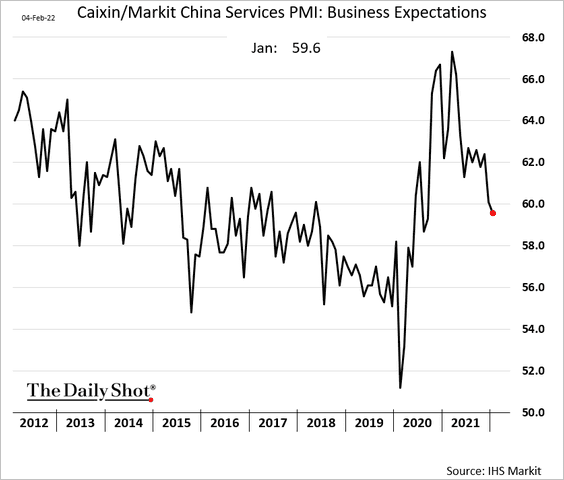
1. Service-sector activity held up better than expected last month.
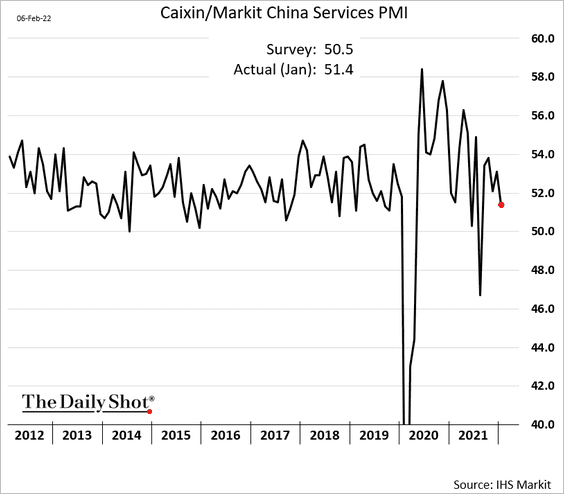
Business sentiment continues to moderate.
——————–
2. Tight restrictions on property financing caused a decline in construction activity, which diverged from the rest of the economy (2 charts).
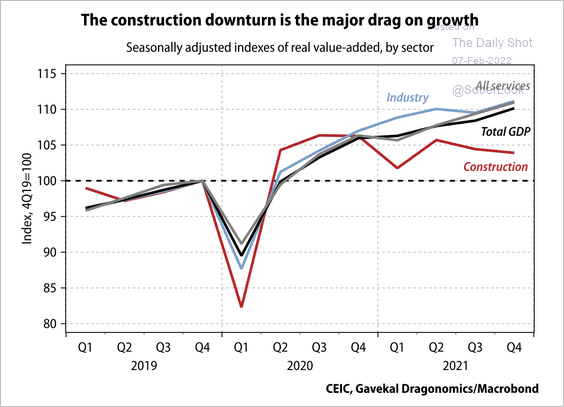 Source: Gavekal Research
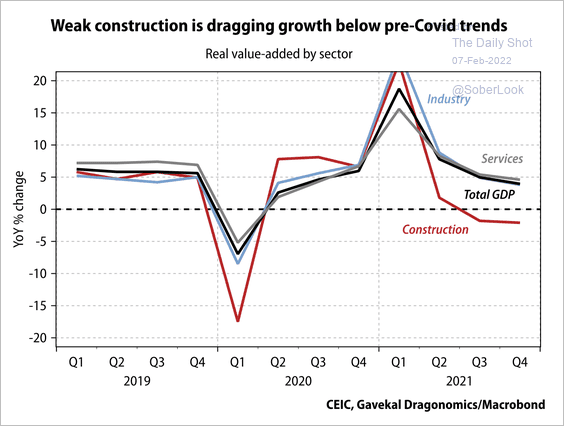 Source: Gavekal Research
3. There is room for steel demand to rebound, but weak construction starts could limit full recovery.
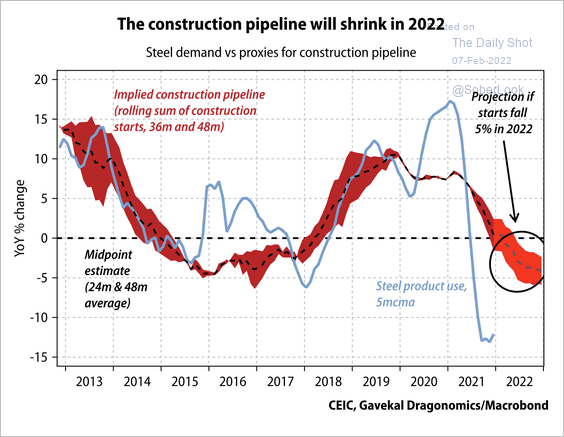 Source: Gavekal Research
Back to Index
Emerging Markets
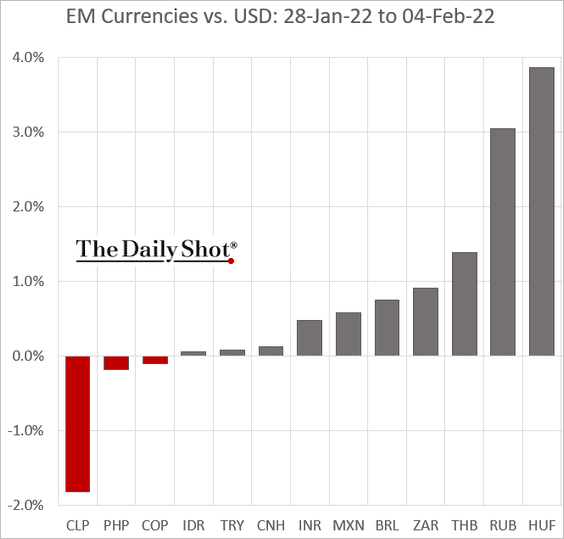
1. Let’s start with last week’s currency market performance.
2. EM portfolio inflows have slowed but held up relatively well last month.
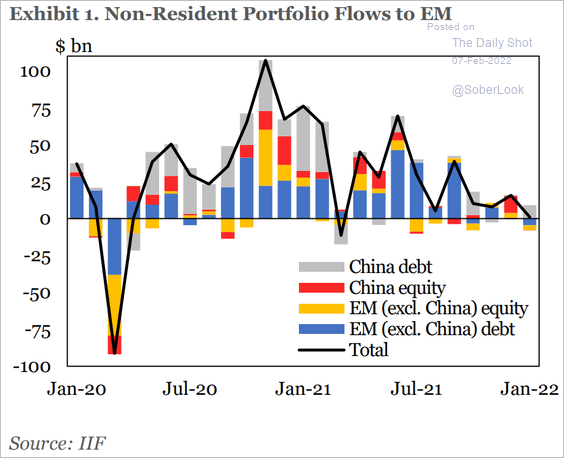 Source: IIF
3. Indian equities have outperformed the broader EM basket as Treasury yields rose over the past two years.
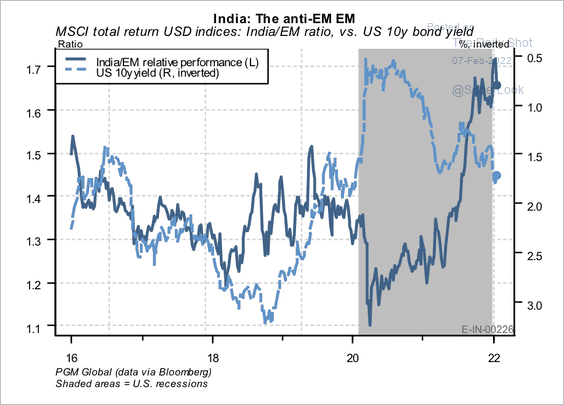 Source: PGM Global
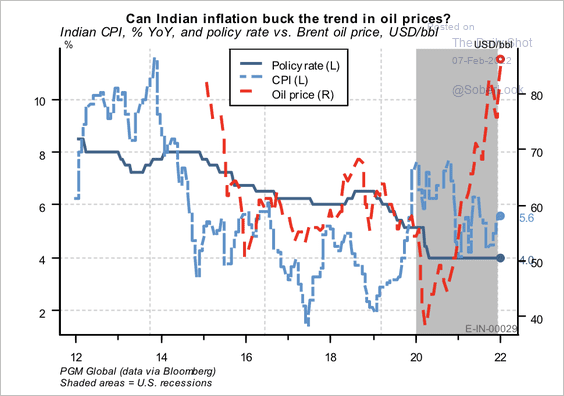
• Rising oil prices could lead to higher inflation in India. A higher policy rate relative to developed and emerging market peers could mean there is less urgency for the nation’s central bank to act.
 Source: PGM Global
——————–
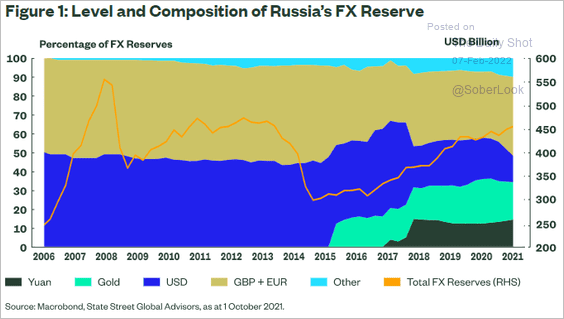
4. This chart illustrates Russia’s shift away from the US dollar.
 Source: Elliot Hentov, State Street Global Advisors Read full article
5. Brazil’s service-sector PMI has been drifting lower but remains in growth territory.

• The real has decoupled from commodities.
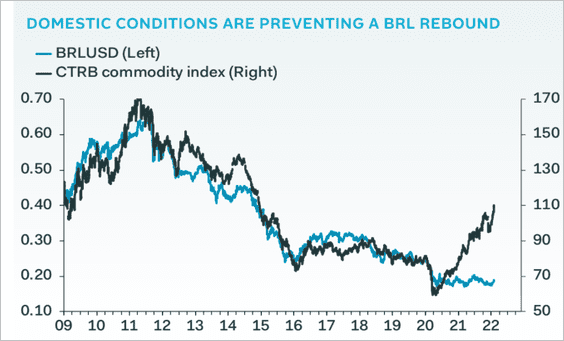
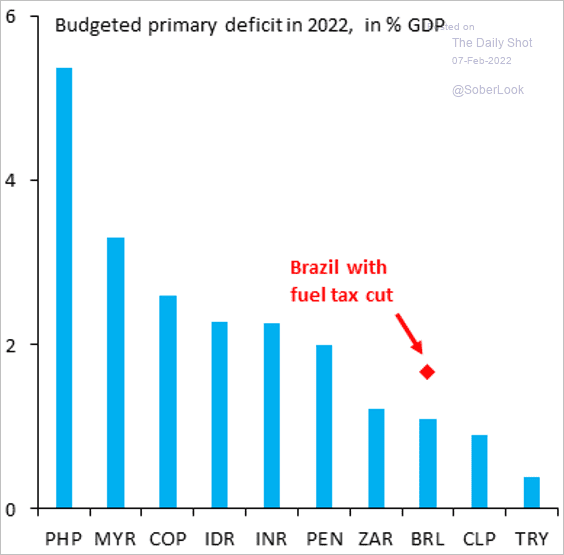
• Cutting the fuel tax could be costly for Brazil.
 Source: Reuters Read full article
 Source: @SergiLanauIIF
——————–
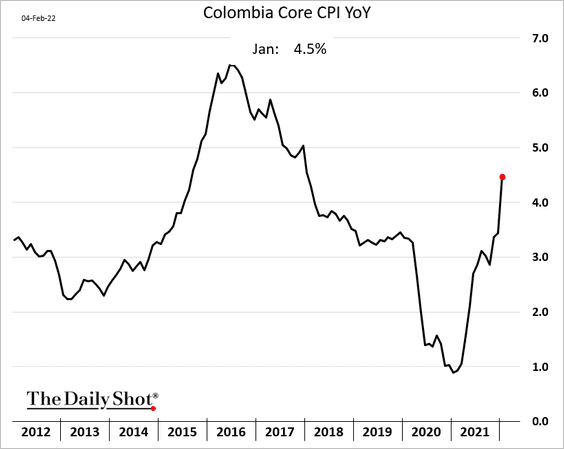
6. Colombian CPI continues to climb.
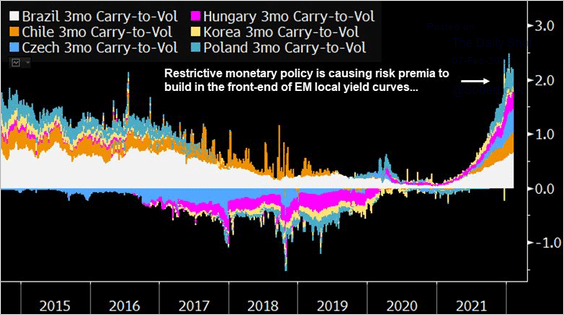
7. Three-month carry-to-volatility ratios are rising in EM countries with hawkish central banks.
 Source: @dsassower, @Bloomberg Read full article
Back to Index
Cryptocurrency
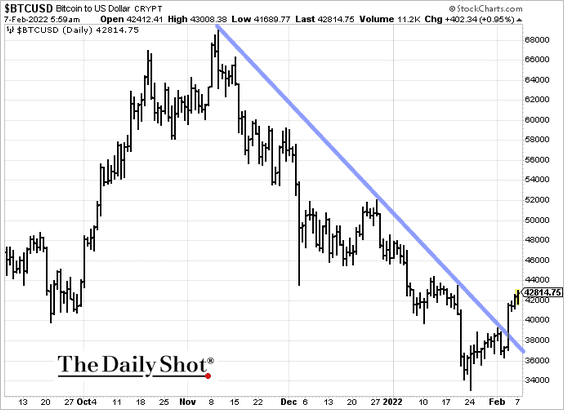
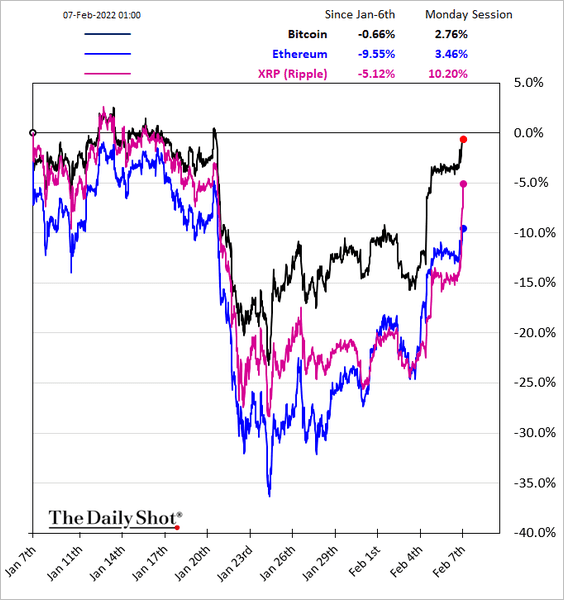
1. Here we go …
2. XRP is surging.
3. Friday’s crypto rally forced many short sellers to liquidate positions.
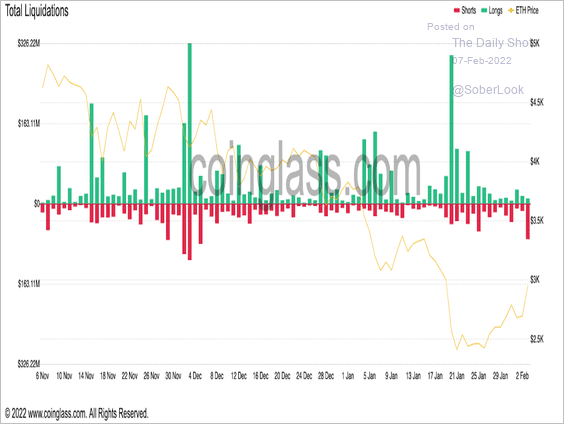 Source: Coinglass Read full article
4. Bitcoin’s market-value-to-realized-value ratio (MVRV), which compares the aggregate cost basis of BTC holders relative to the current market value, is near deep value territory.
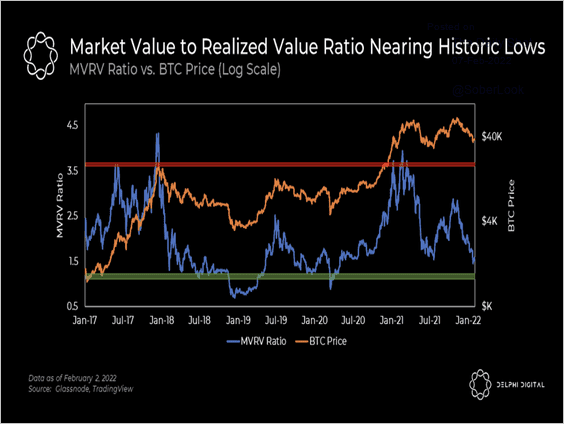 Source: @Delphi_Digital
5. Tether is losing market share in the stablecoin market.
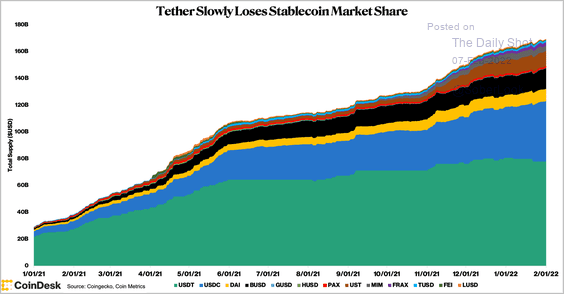 Source: CoinDesk
6. MicroStrategy has given up its outperformance relative to the S&P 500 during the crypto/equity market sell-off.
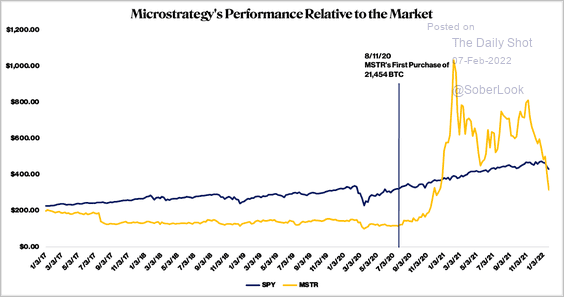 Source: CoinDesk Read full article
Back to Index
Commodities
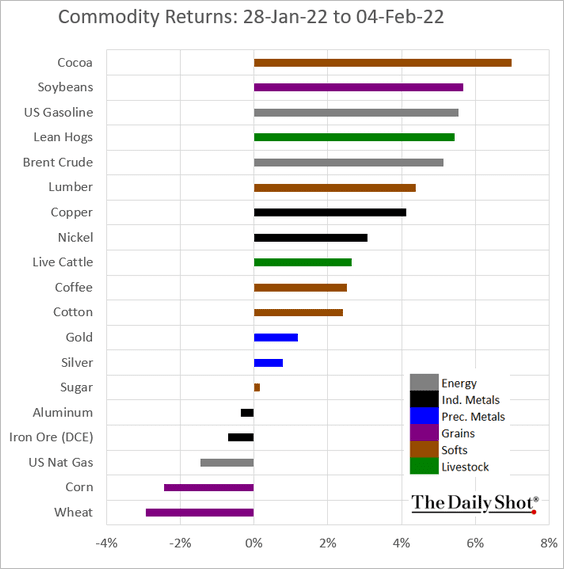
1. Let’s start with last week’s returns …
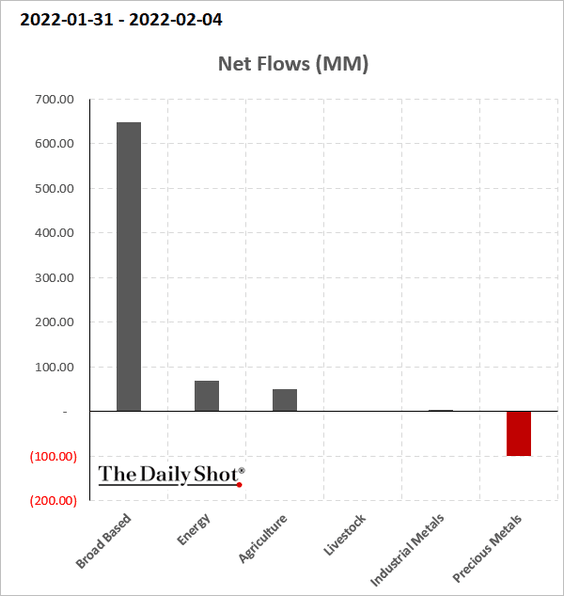
… and fund flows.
——————–
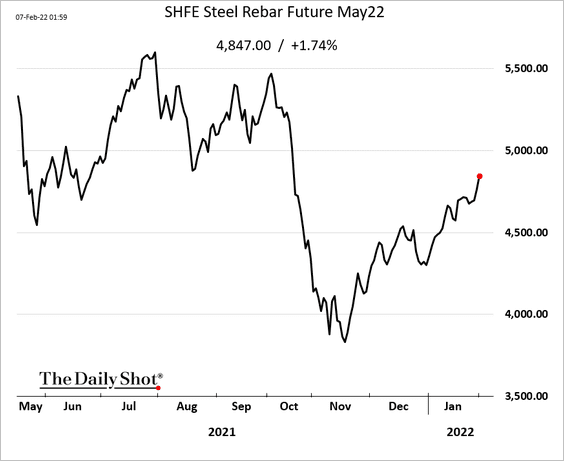
2. China’s iron ore and steel futures are rallying.
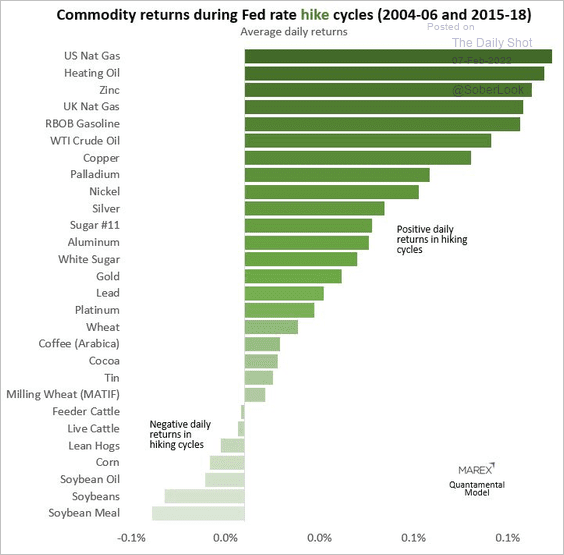
3. Here is a look at commodity returns during past rate hike cycles.
 Source: Marex
4. Hedge funds have bought agriculture futures contracts last week amid Brazil weather damage.
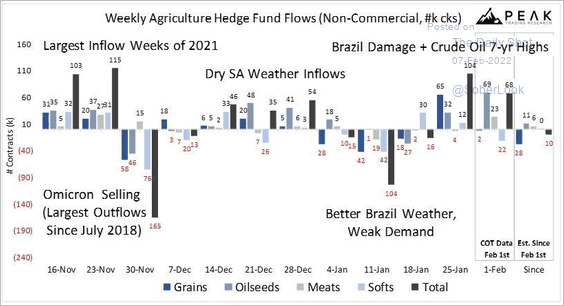 Source: Peak Trading Research
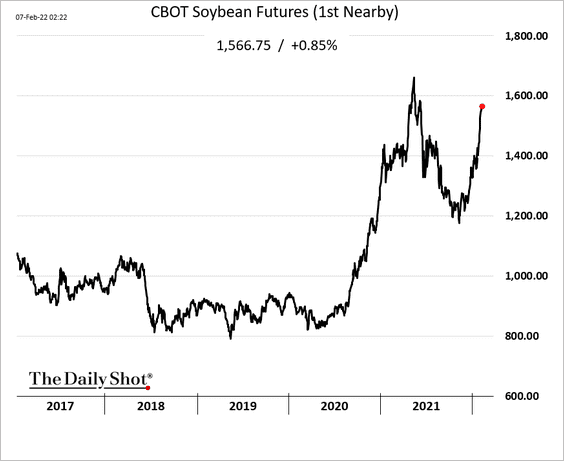
Soybean futures continue to rally.
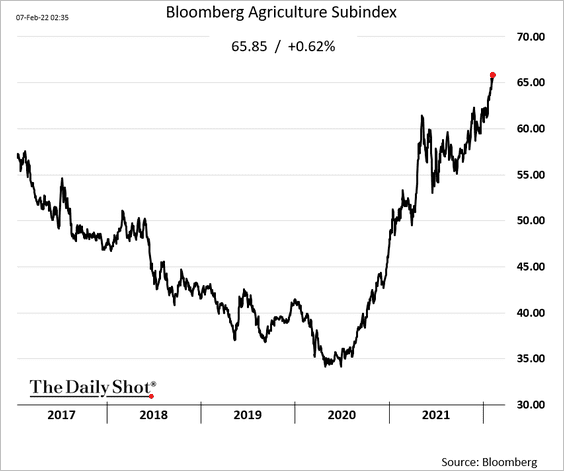
Here is Bloomberg’s agriculture index.
Back to Index
Energy
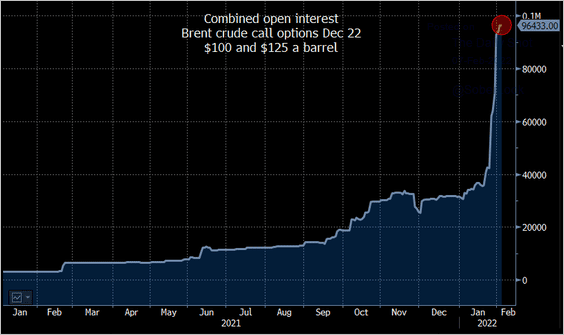
1. Will we hit $100/bbl before the week is over?
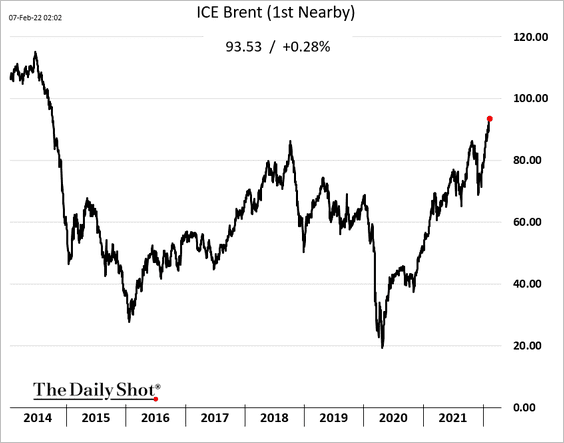
Open interest in $100 and $125 Brent call options has been soaring.
 Source: @JavierBlas Read full article
——————–
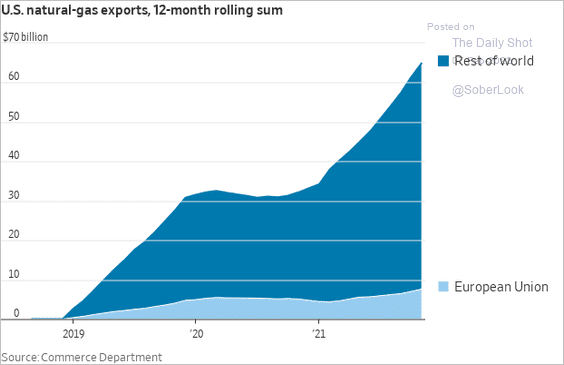
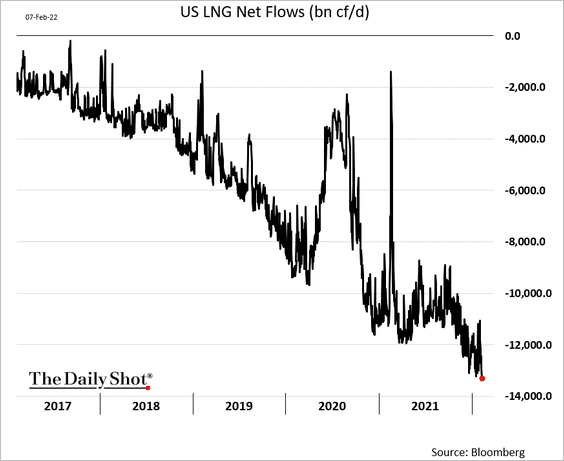
3. US LNG exports are surging.
 Source: @WSJecon
This chart shows US “net imports.”
Back to Index
Equities
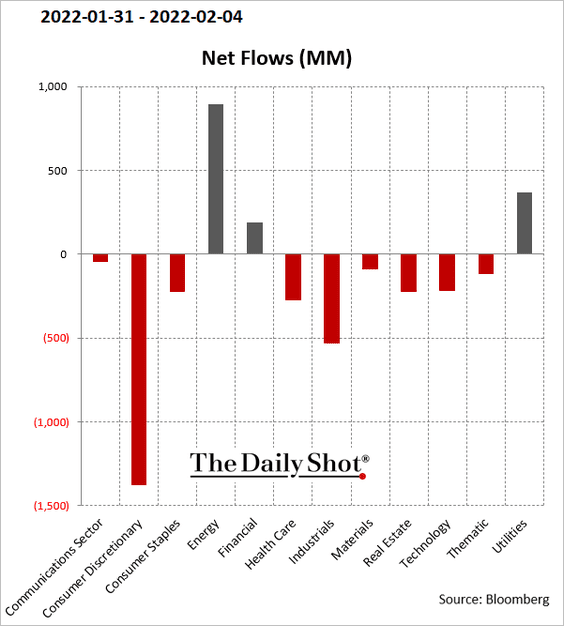
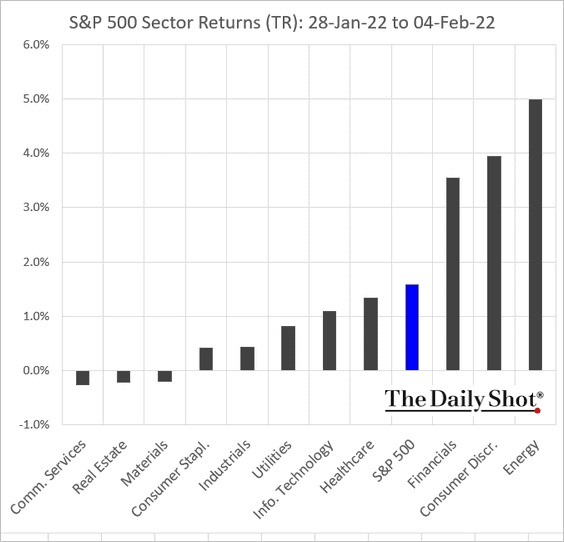
1. Let’s begin with last week’s fund flows and sector returns.
• US domestic equity flows:
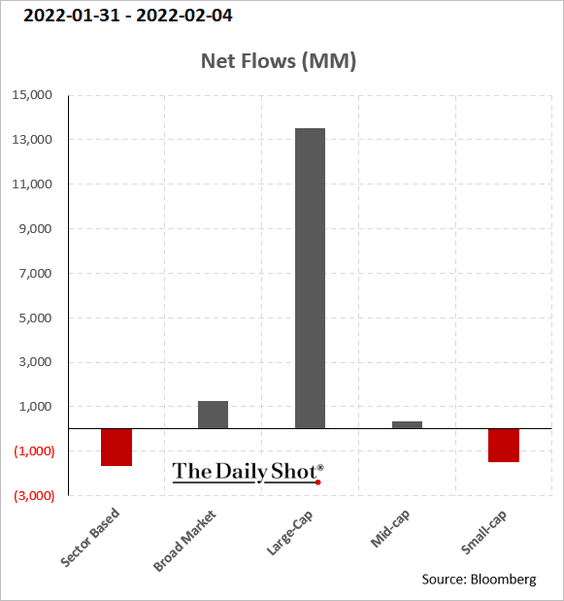
• Fund flows by sector:
• Returns by sector:
——————–
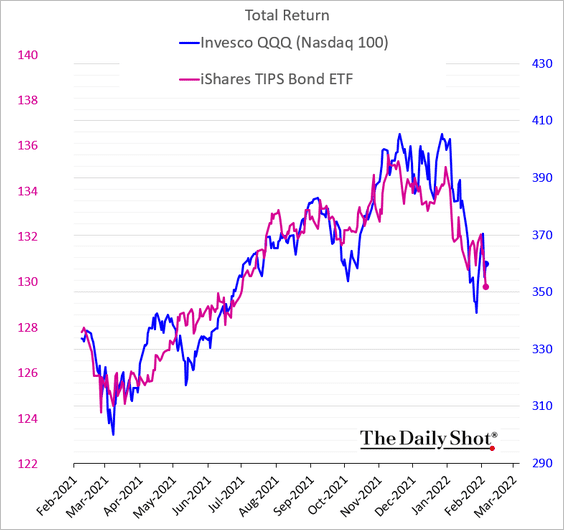
2. Market participants are watching US real rates very closely, …
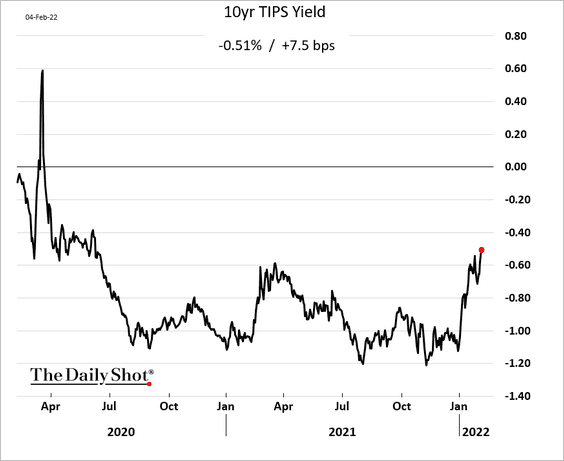
… as the correlation between TIPS (Treasury Inflation-Protected Securities) and growth stocks remains strong.
——————–
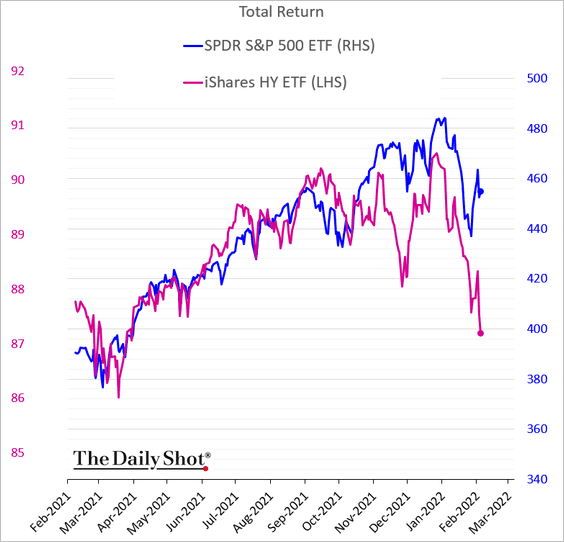
3. How concerned should stock investors be about the recent weakness in credit?
4. S&P futures liquidity has been deteriorating (2 charts).
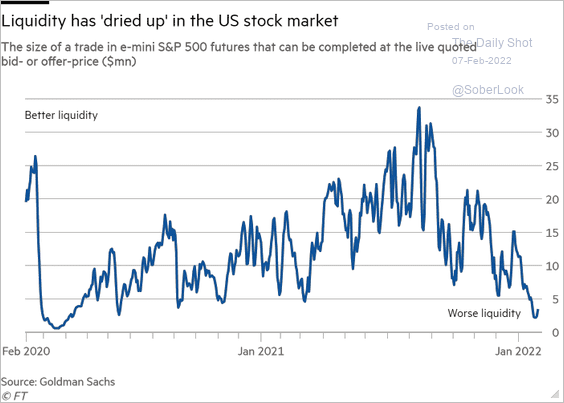 Source: @financialtimes Read full article
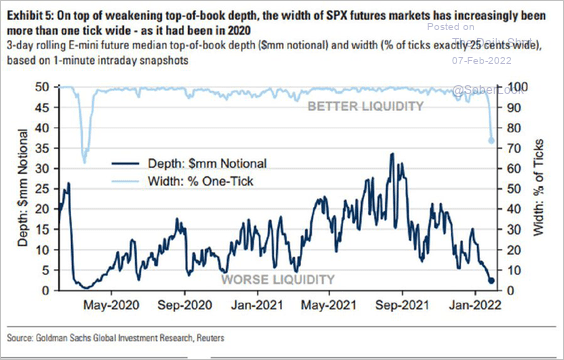 Source: Goldman Sachs; @HayekAndKeynes
——————–
5. Institutional participation in the market increased significantly last month.
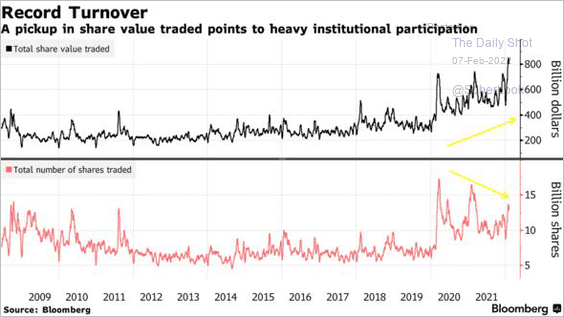 Source: @markets, @luwangnyc Read full article
6. Sector return dispersion is elevated, currently in the top quintile dating back to 1990.
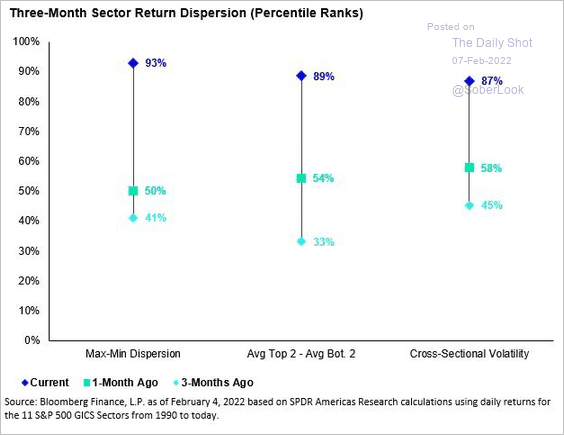 Source: SPDR Americas Research, @mattbartolini
Energy relative to tech looks stretched over the short-term.
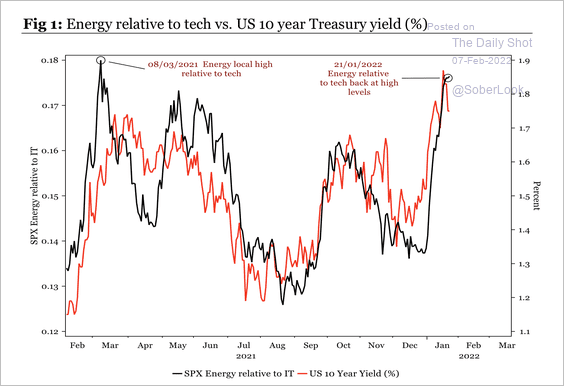 Source: Longview Economics
7. This chart shows the contribution to net income by sector of the S&P 500.
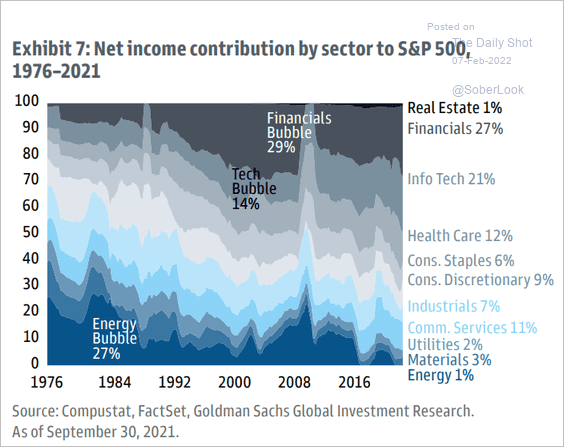 Source: Goldman Sachs Asset Management
8. Omicron is taking a toll on restaurant stocks as mobility declines.
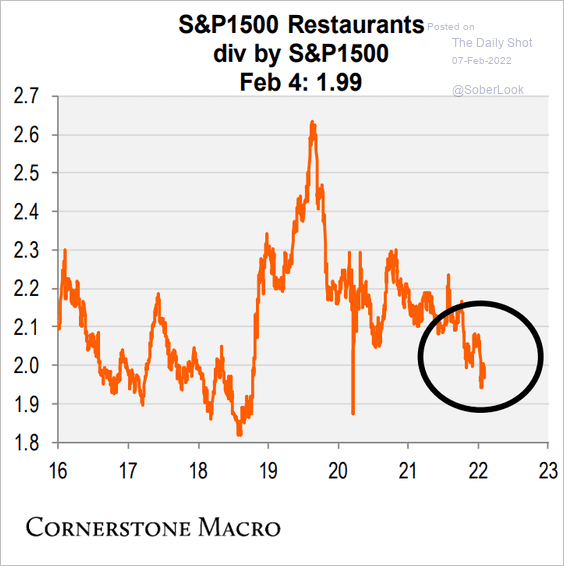 Source: Cornerstone Macro
9. High-beta and momentum factors outperformed last week.
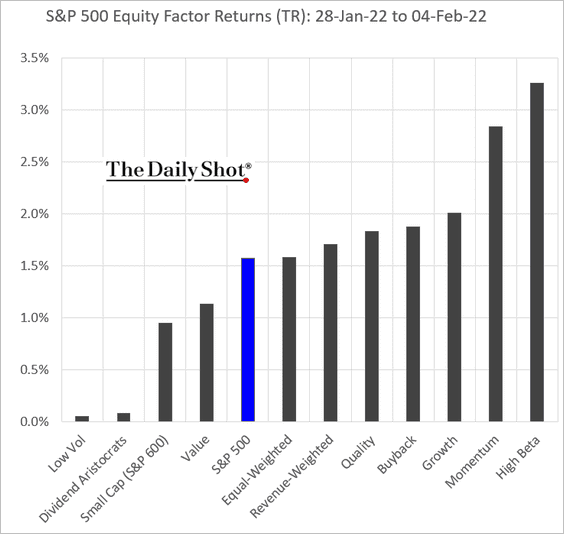
• Historically, combining value and quality factors resulted in higher risk-adjusted returns.
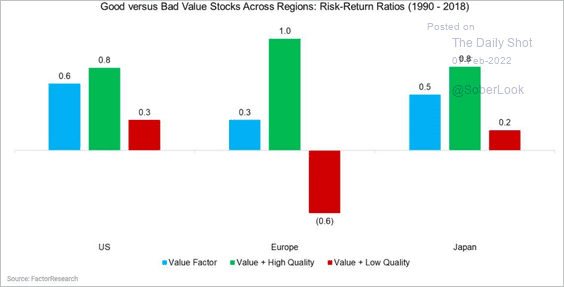 Source: FactorResearch
——————–
10. The Nasdaq newsletter sentiment index reached an extreme low.
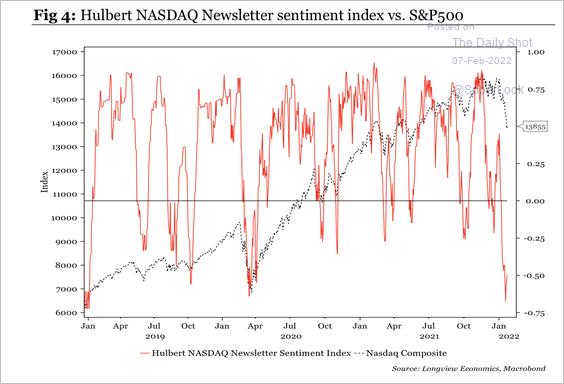 Source: Longview Economics
Back to Index
Credit
1. Let’s start with last week’s asset class returns.
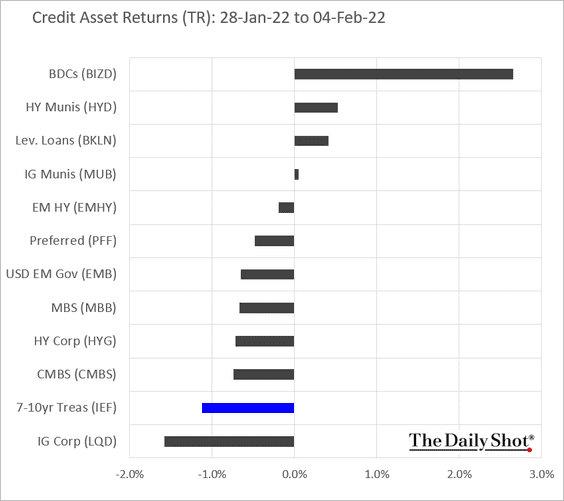
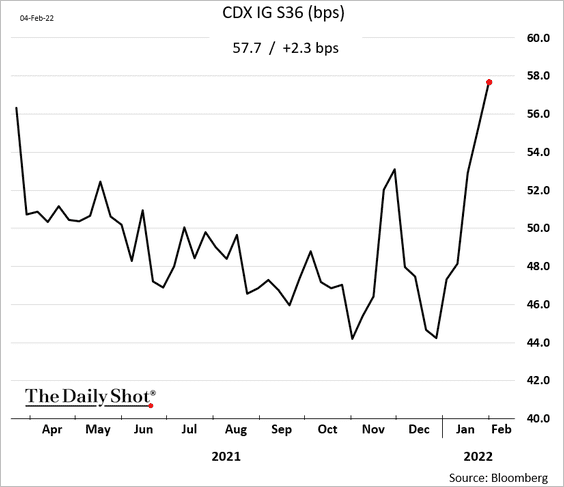
2. Investment-grade corporate debt has been under pressure as Treasuries decline, …
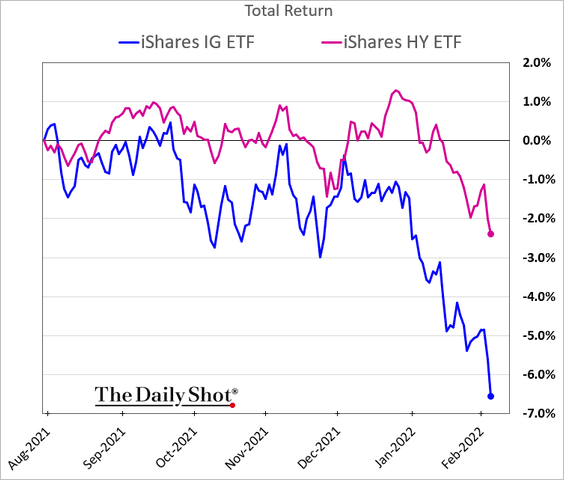
… and spreads widen.
US investment-grade valuations appear expensive, more so than high-yield (2 charts).
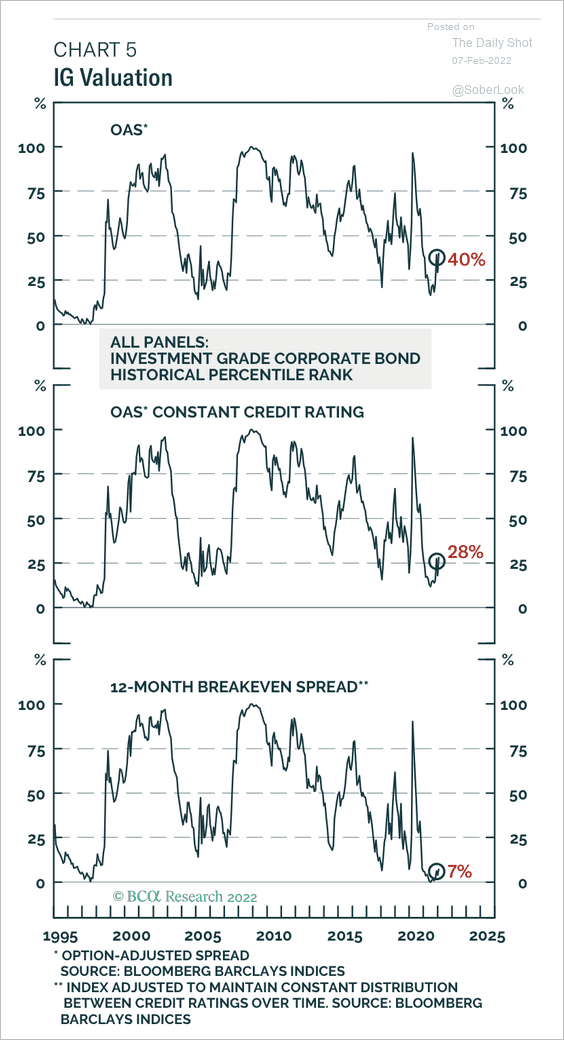 Source: BCA Research
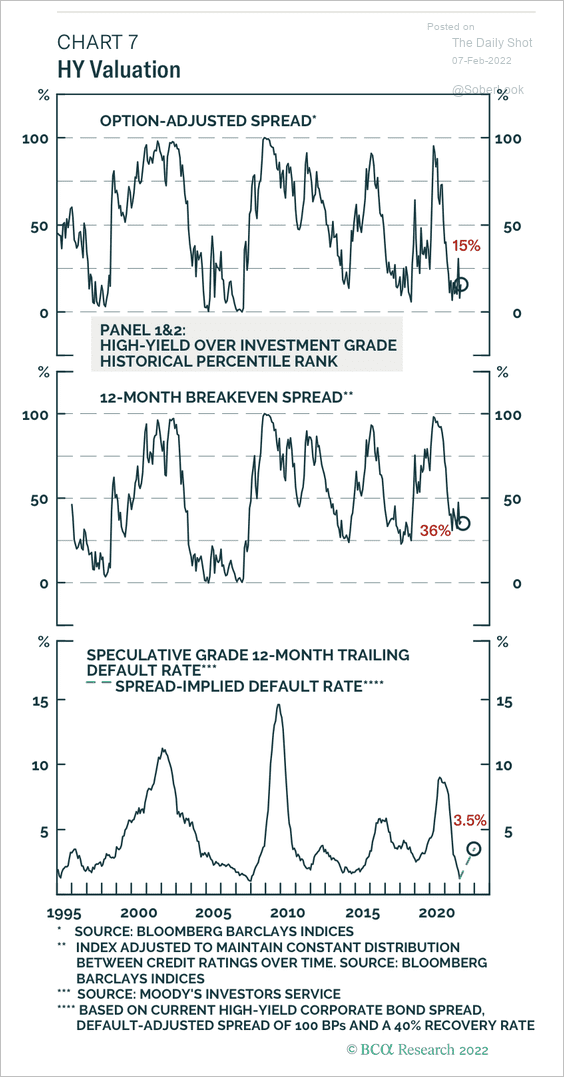 Source: BCA Research
——————–
3. Corporate bond returns vary widely between cycles.
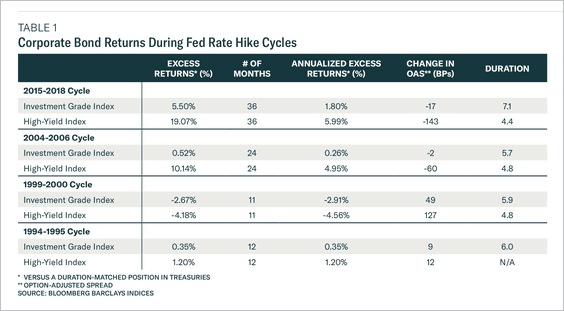 Source: BCA Research
4. High-yield bonds continue to see outflows.
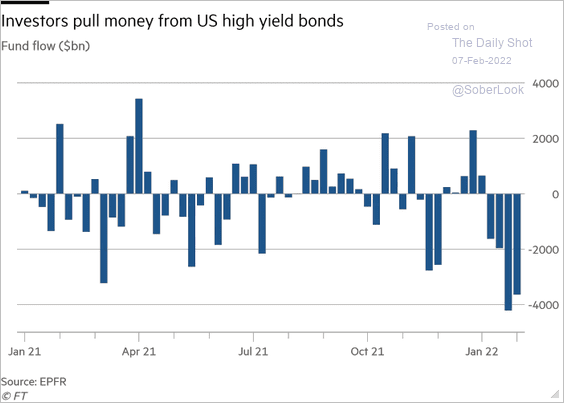 Source: @financialtimes Read full article
5. Demand for puts on the largest high-yield ETF has been surging.
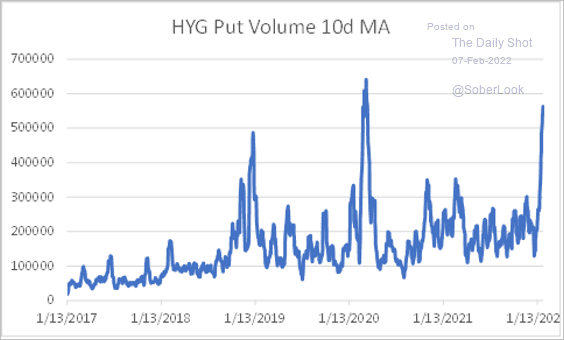 Source: @danny_kirsch
Back to Index
Global Developments
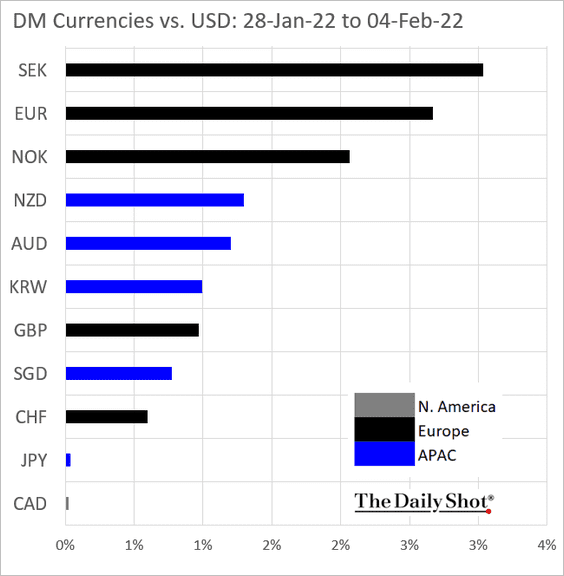
1. Let’s start with last week’s DM currency performance against the dollar.
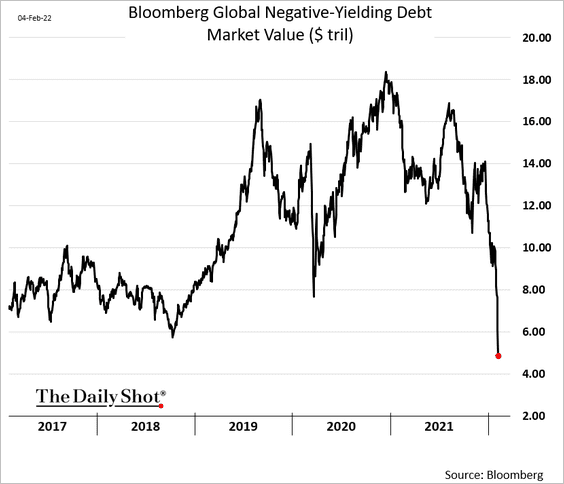
2. The market value of negative-yielding debt continues to tumble as yields in Europe and Japan surge.
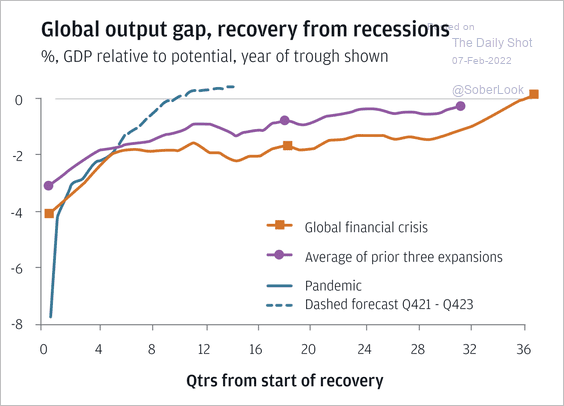
3. JP Morgan expects the global output gap to close faster than during previous cycles.
 Source: J.P. Morgan Asset Management
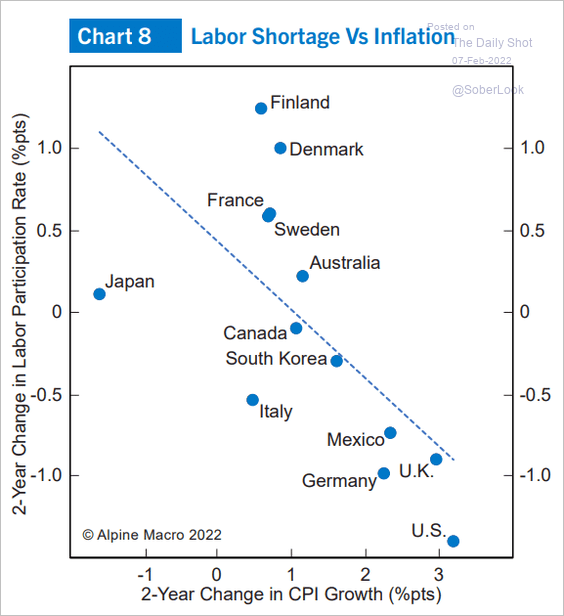
4. How correlated are labor shortages and inflation?
 Source: Alpine Macro
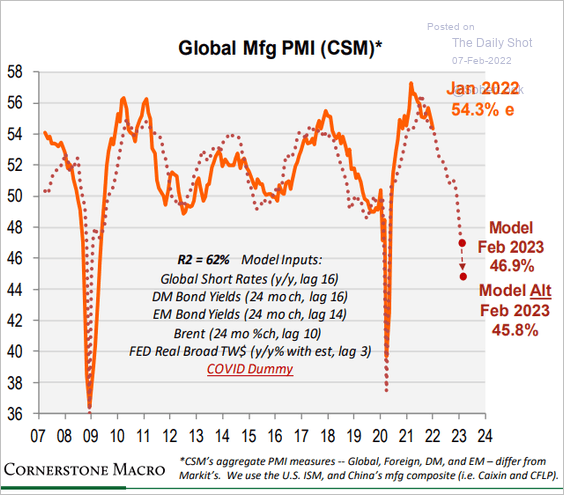
5. According to a model from Cornerstone Macro, global manufacturing could be in contraction early next year.
 Source: Cornerstone Macro
——————–
Food for Thought
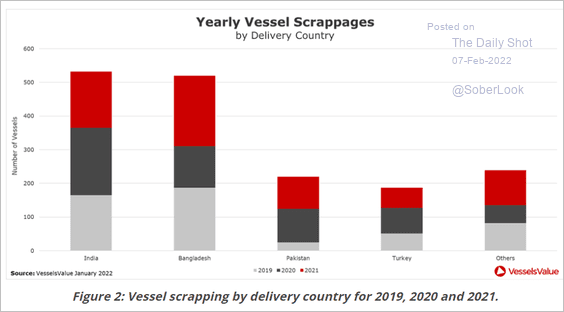
1. Vessel demolitions:
 Source: VesselsValue Read full article
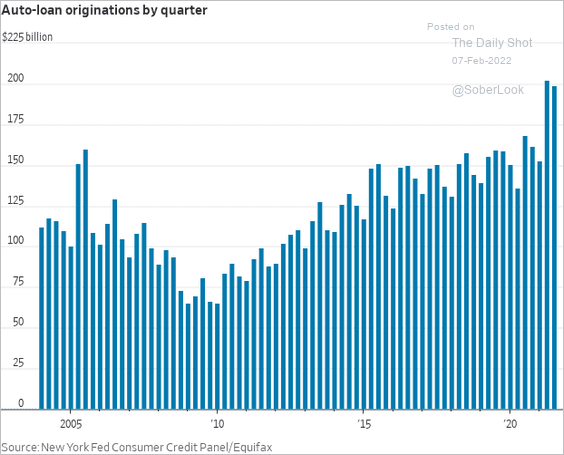
2. US auto loan originations:
 Source: @WSJ Read full article
3. Challenged airline sector:
 Source: @chartrdaily
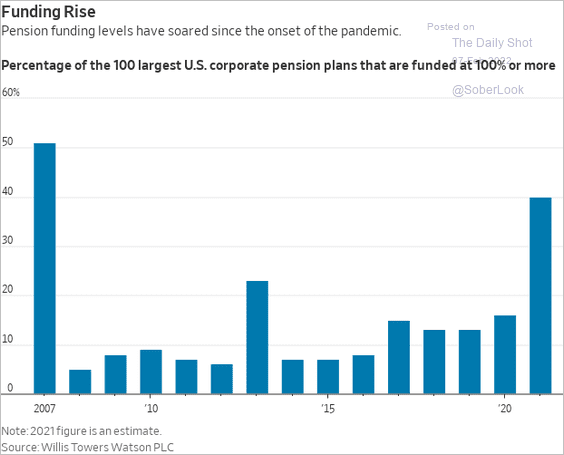
4. Fully-funded corporate pension plans:
 Source: @WSJ Read full article
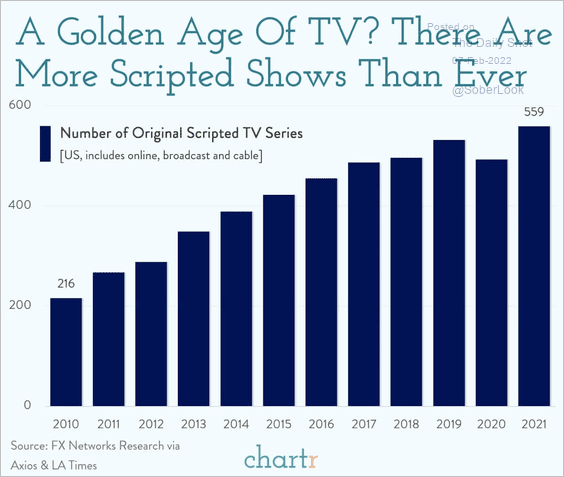
5. Number of scripted TV series:
 Source: @chartrdaily
6. US labor force growth:
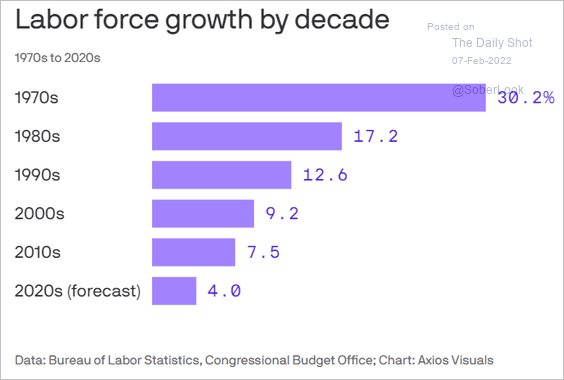 Source: @axios Read full article
7. Super Bowl titles by a quarterback:
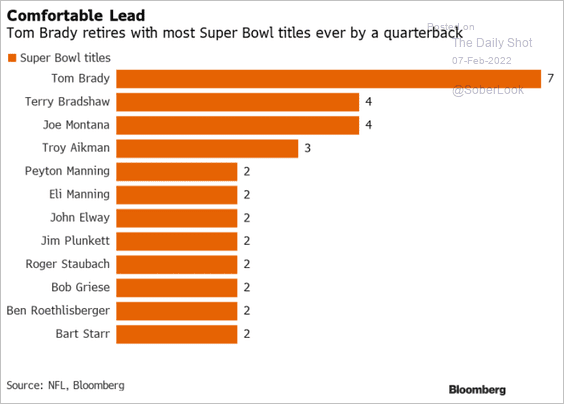 Source: Bloomberg Read full article
——————–
Back to Index