
The Daily Shot: 21-Feb-22
• Equities
• Credit
• Rates
• Energy
• Commodities
• Cryptocurrency
• Emerging Markets
• China
• Asia – Pacific
• The Eurozone
• Europe
• The United Kingdom
• Canada
• The United States
• Global Developments
• Food for Thought
Equities
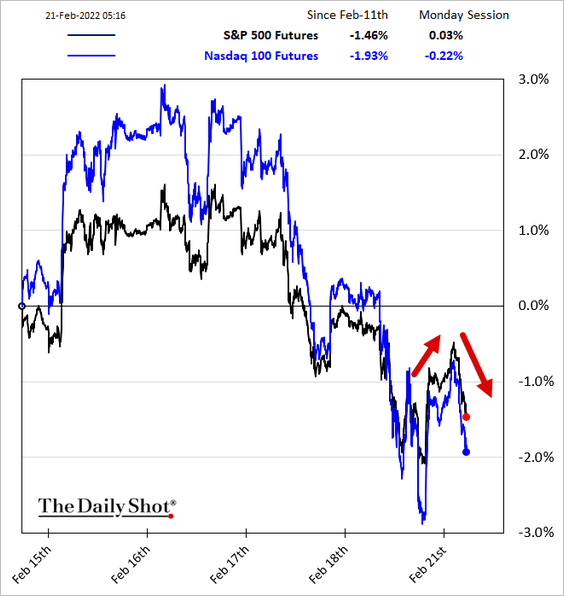
1. US equity futures rallied this morning amid hopes for a peaceful resolution to the Ukraine/Russia crisis, …
 Source: Reuters Read full article
… but then reversed course as the Kremlin poured cold water on the Biden-Putin summit.
——————–
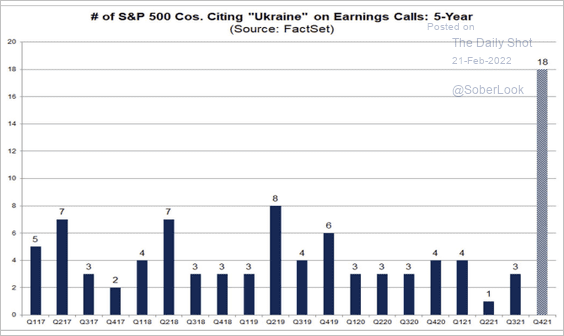
2. A number of companies have mentioned Ukraine on their earnings calls.
 Source: @FactSet
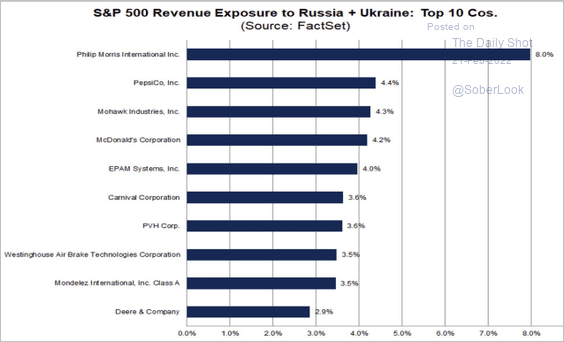
Which firms have exposure to Ukraine/Russia?
 Source: @FactSet
——————–
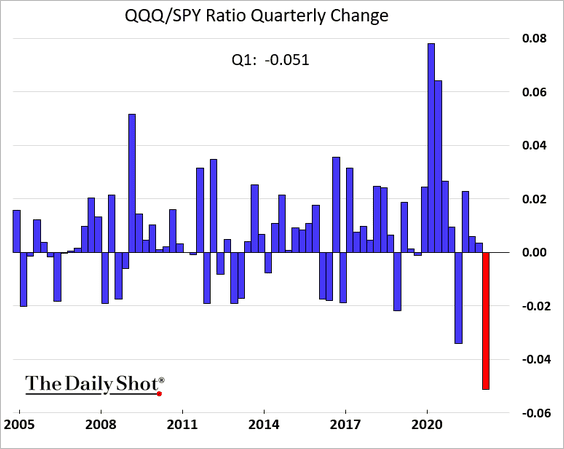
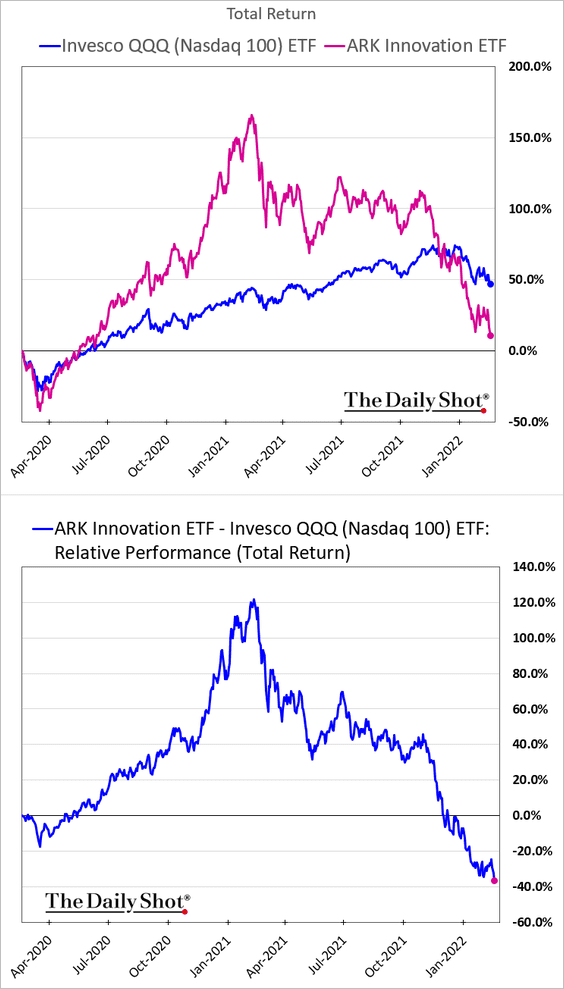
3. The recent Nasdaq 100 underperformance vs. the S&P 500 has been severe.
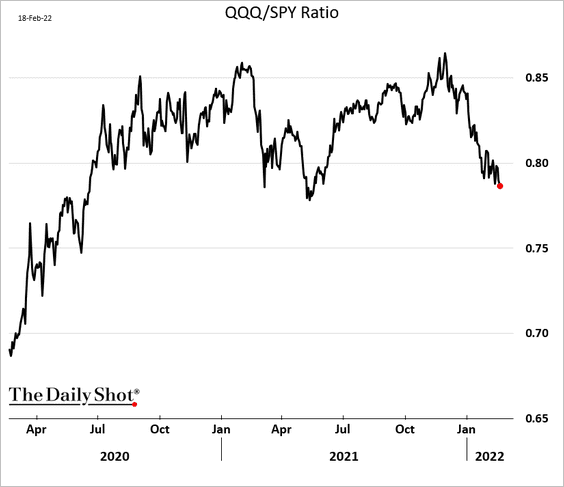
Here are the quarterly changes in the Nasdaq 100/S&P 500 ratio.
——————–
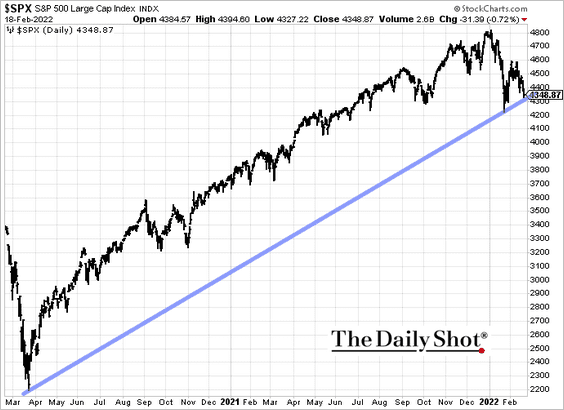
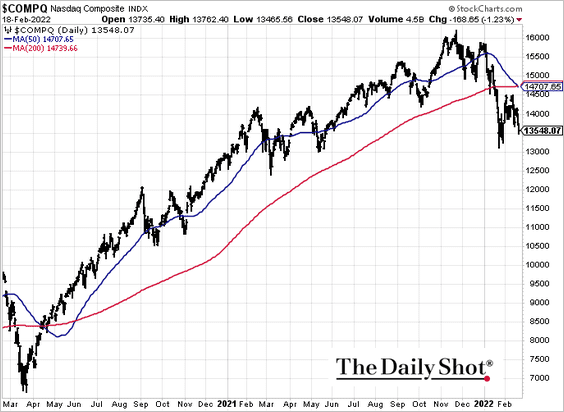
4. Next, we have a couple of technical charts.
• The S&P 500 is at support.
• The Nasdaq Composite entered a death cross.
——————–
5. How does the S&P 500 perform around Fed rate hikes?
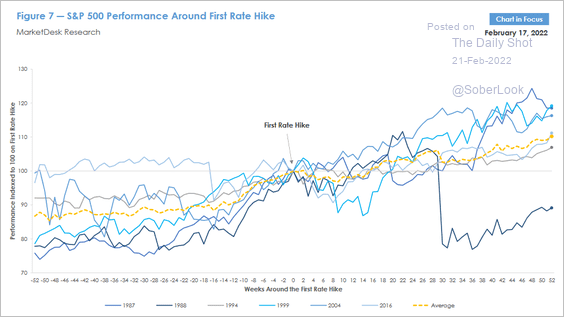 Source: MarketDesk Research
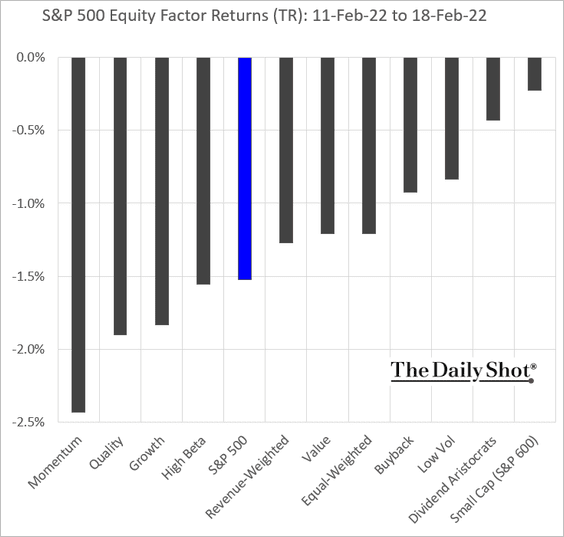
6. Now, let’s take a look at some equity factor data.
• Last week’s returns:
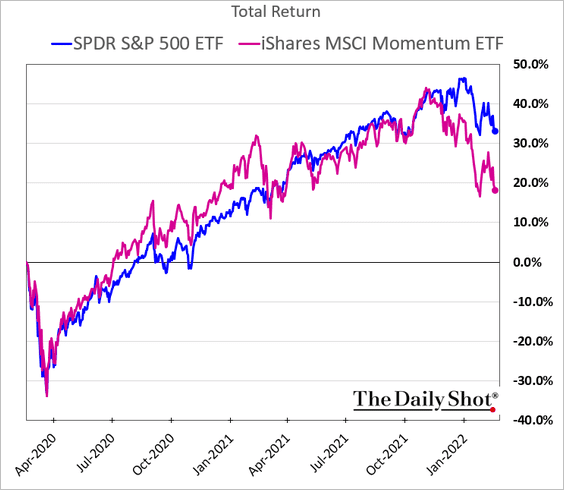
• The momentum factor relative performance over the past two years:
• How do equity factors perform across monetary policy tightening cycles?
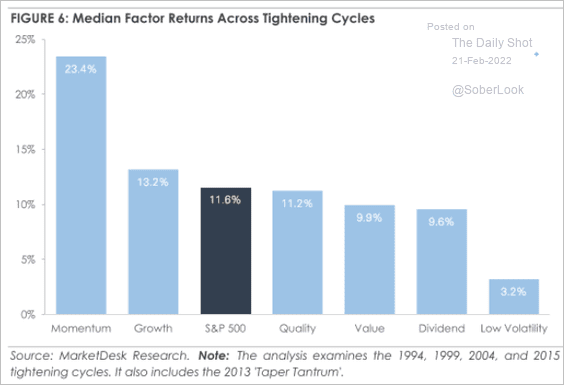 Source: MarketDesk Research
• Value discount vs. growth:
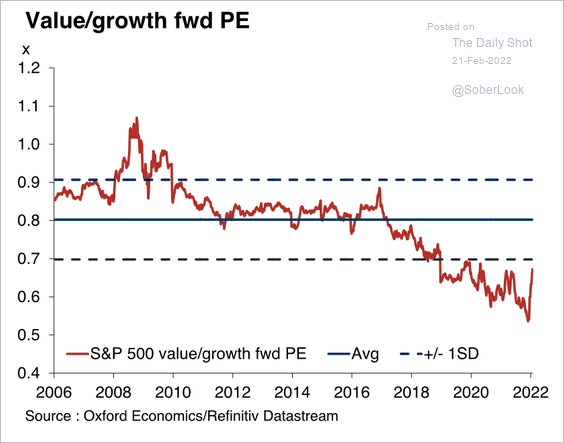 Source: Oxford Economics
• Are growth stocks due for a relative bounce?
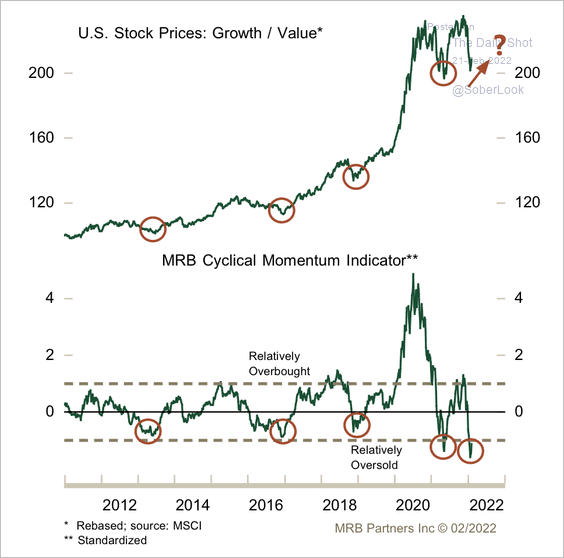 Source: MRB Partners
——————–
7. What’s most bullish for equities?
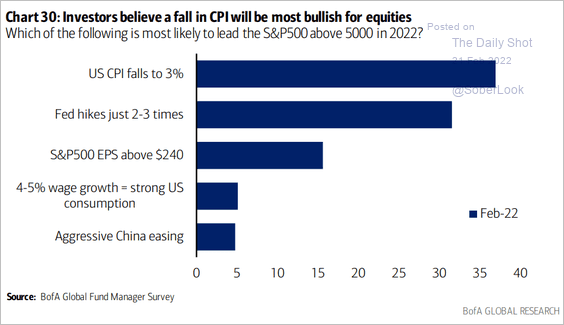 Source: BofA Global Research
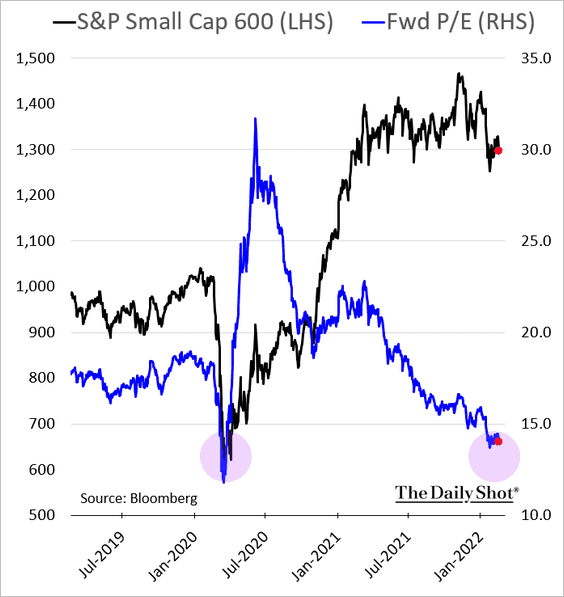
8. The S&P 500 and Nasdaq 100 valuations are roughly at pre-COVID levels (which, of course, doesn’t make them cheap).
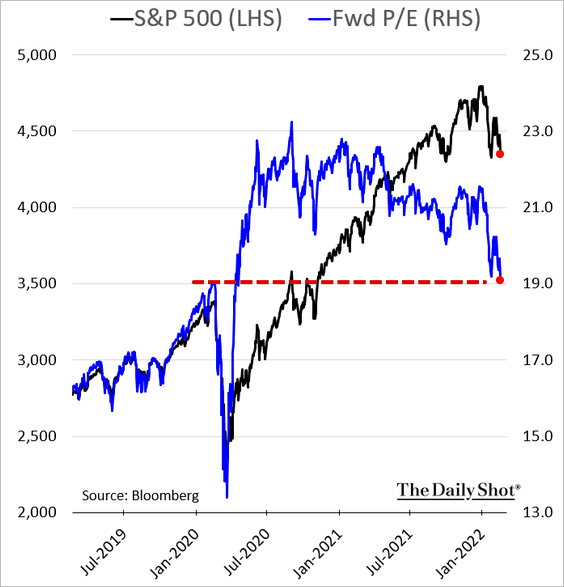
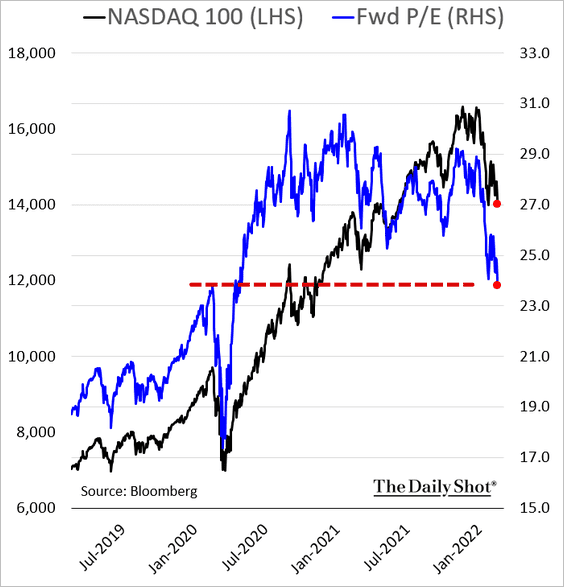
Small-cap valuations are near the COVID-selloff lows.
——————–
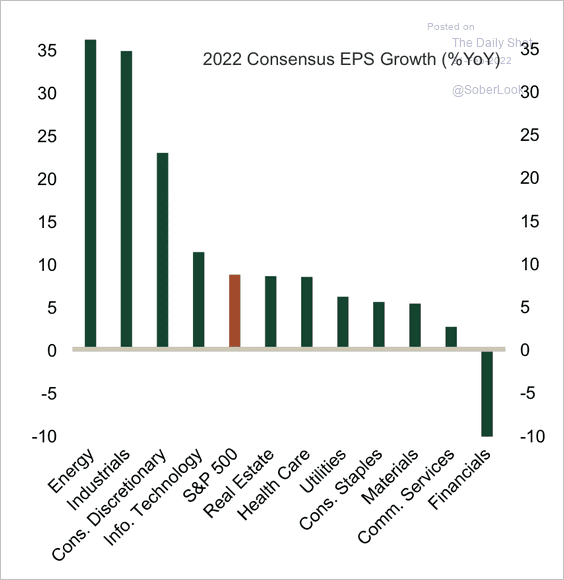
9. Cyclical stocks are expected to lead overall earnings growth this year.
 Source: MRB Partners
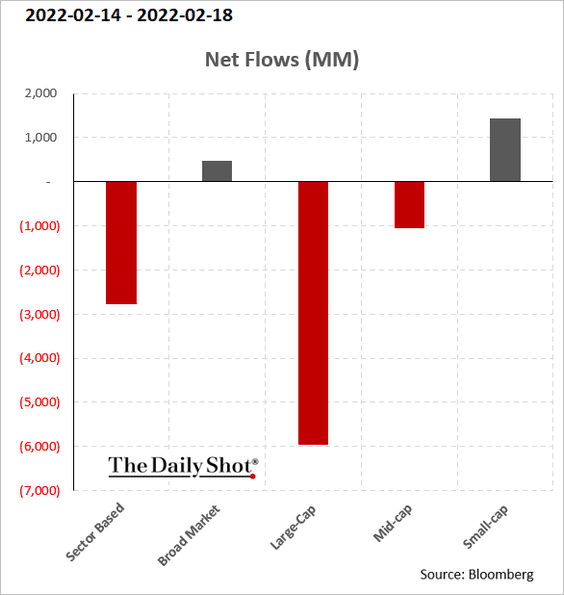
10. Large-cap ETFs saw outflows last week.
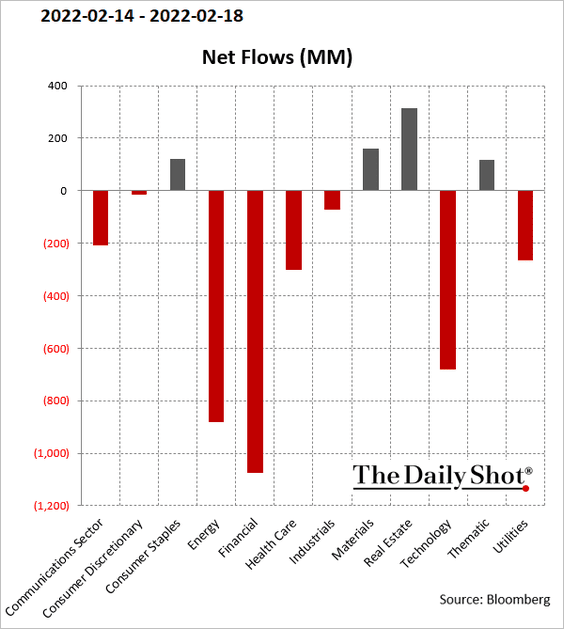
Financials and energy experienced the highest outflows among sector funds.
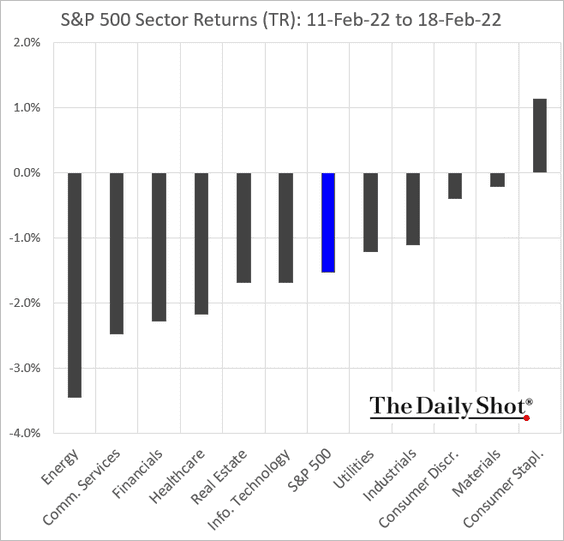
11. Consumer Staples was the only large-cap sector with a positive return last week.
12. Finally, we have last week’s returns for select thematic ETFs.
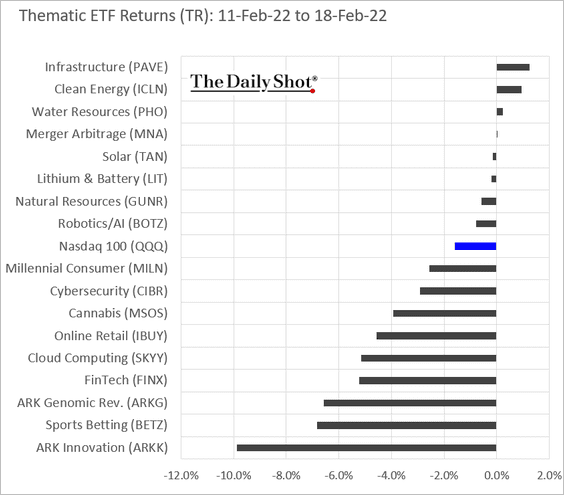
ARK Innovation continues to struggle.
Back to Index
Credit
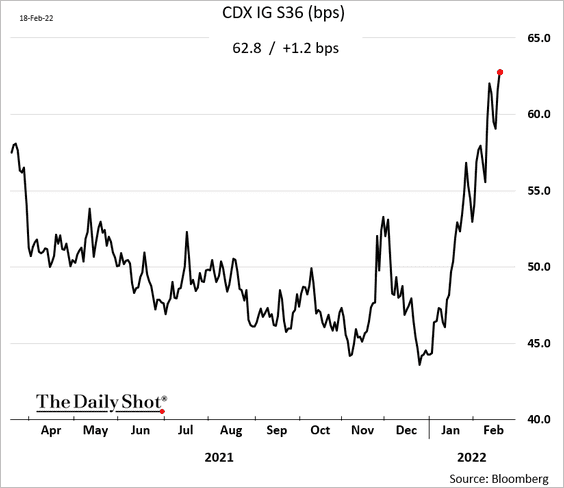
1. Investment-grade credit default swap spreads continue to widen.
2. Investment-grade bond managers are holding above-average cash levels.
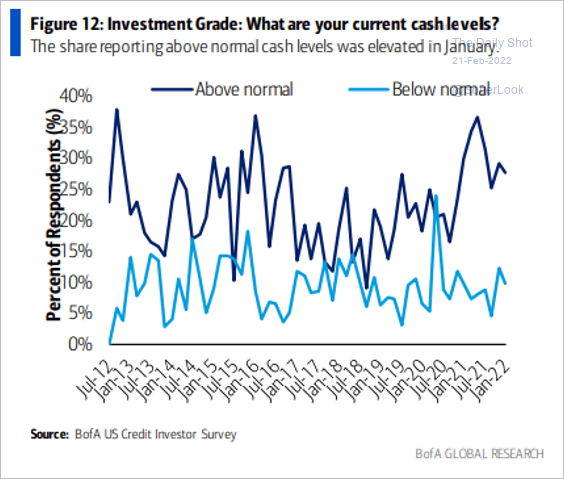 Source: BofA Global Research; @MikeZaccardi
3. There was an unprecedented wave of fallen angels (investment-grade bonds reduced to junk status) at the onset of the pandemic.
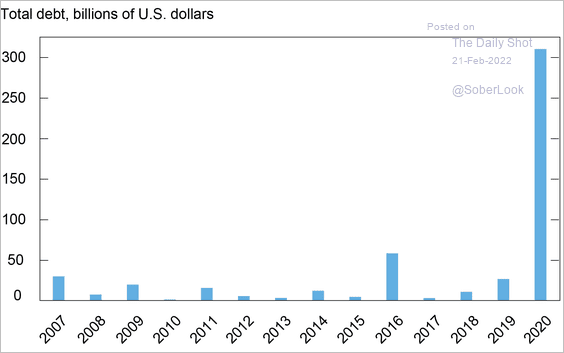 Source: Liberty Street Economics Read full article
Prospective US fallen angels have paid less to borrow in the corporate bond market compared with safer BBB-rated issuers.
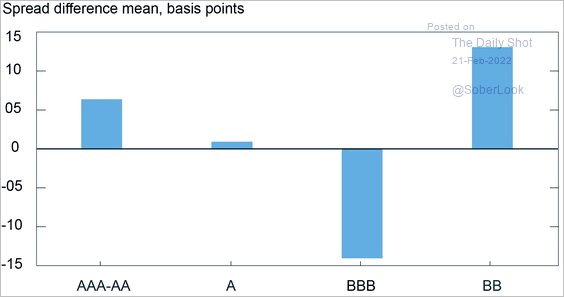 Source: Liberty Street Economics Read full article
——————–
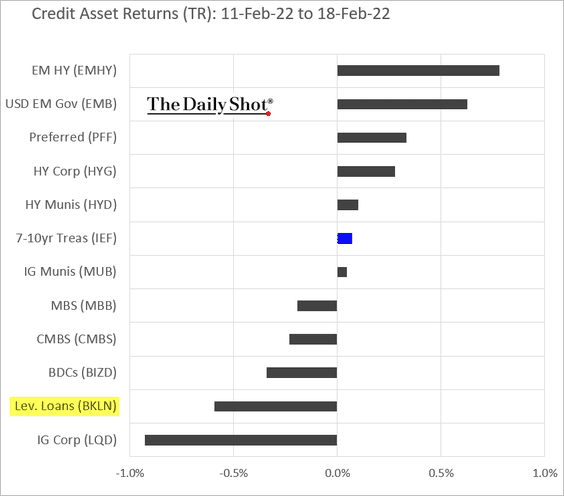
4. Leveraged loans finally caught the credit contagion last week, underperforming HY bonds.
5. Here is how certain bond sectors performed during rising rates.
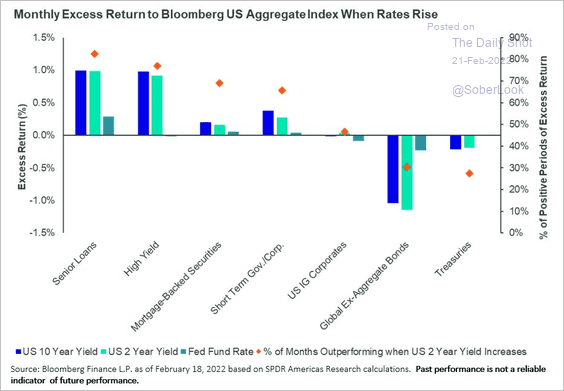 Source: SPDR Americas Research, @mattbartolini
6. In recent weeks, the combination of IG, HY, and EM bond funds experienced substantial outflows.
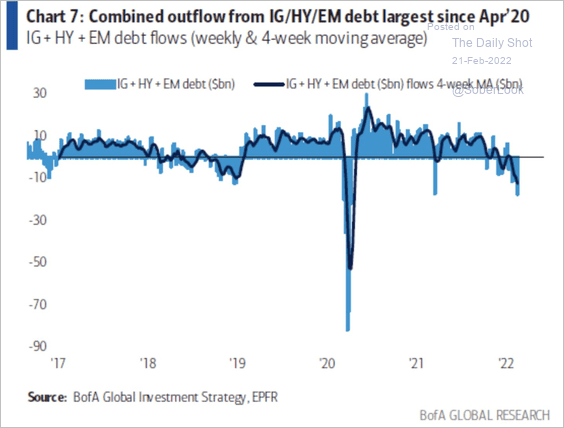 Source: BofA Global Research
Back to Index
Rates
1. Treasury funds saw massive inflows last week.
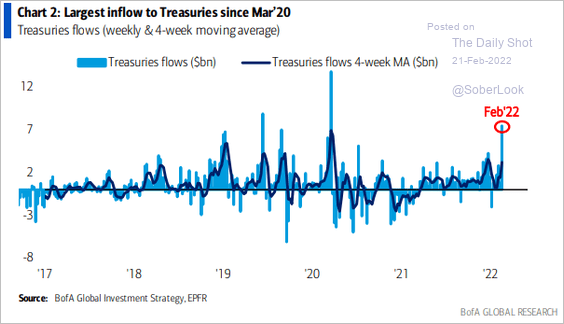 Source: BofA Global Research
2. The 10yr Treasury yield held resistance at 2%.
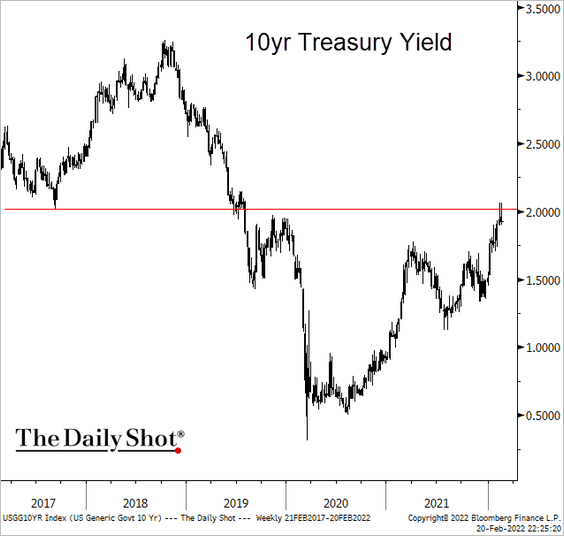 Source: @TheTerminal, Bloomberg Finance L.P.
3. The policy gap, or the spread between the market’s long-term and short-term rate expectations, has narrowed significantly, consistent with the end of a tightening cycle.
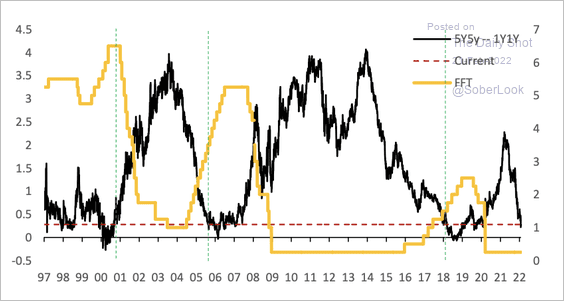 Source: Deutsche Bank Research
4. The 3-month/10-year volatility has increased over the past year, while the policy gap contracted. This could reflect uncertainty and/or the market’s focus on the Fed’s reaction function over the short-term, which could lead to aggressive repricing, according to Deutsche Bank.
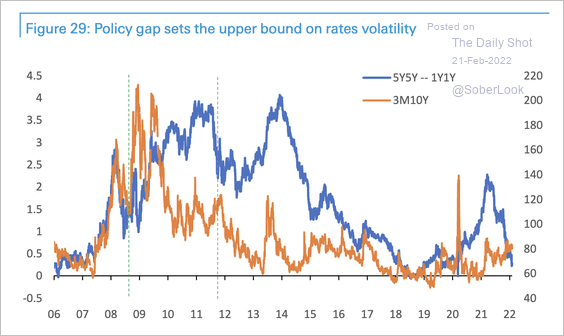 Source: Deutsche Bank Research
Back to Index
Energy
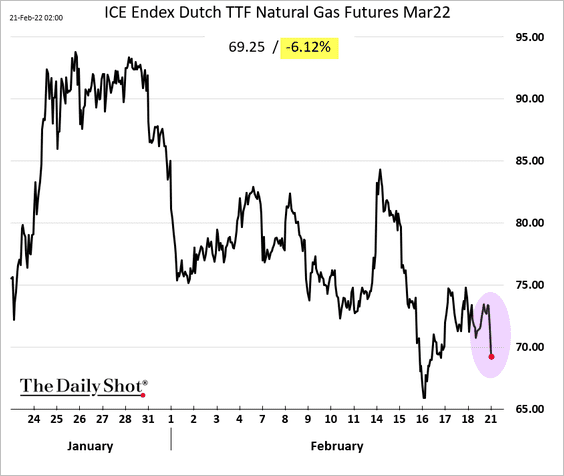
1. European natural gas futures dropped 6% in response to the “Biden/Putin potential meeting” news
2. Russia is producing less than its quota of oil.
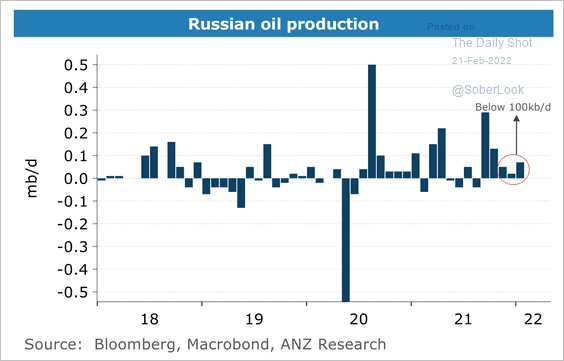 Source: ANZ Research
3. Oil has been trading above “fair value” due to geopolitical risks.
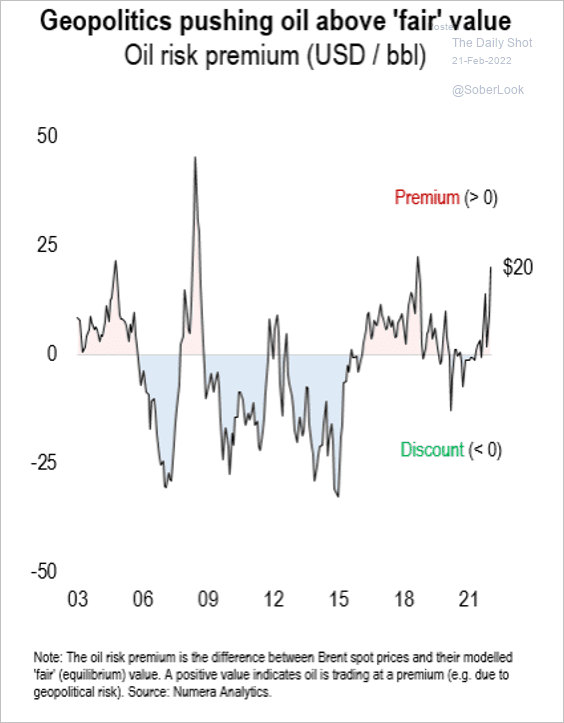 Source: Numera Analytics
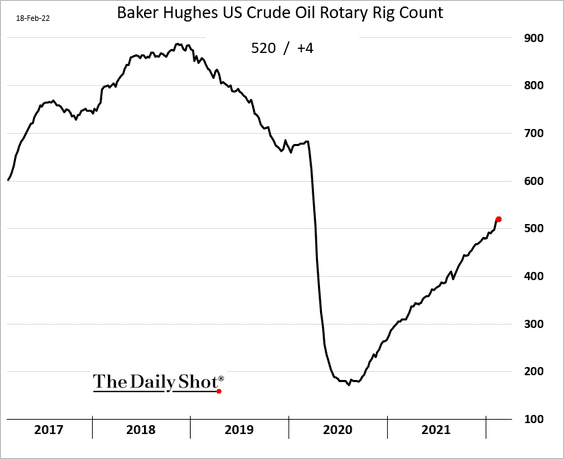
4. The number of US rigs has risen well above 500 over the past couple of weeks.
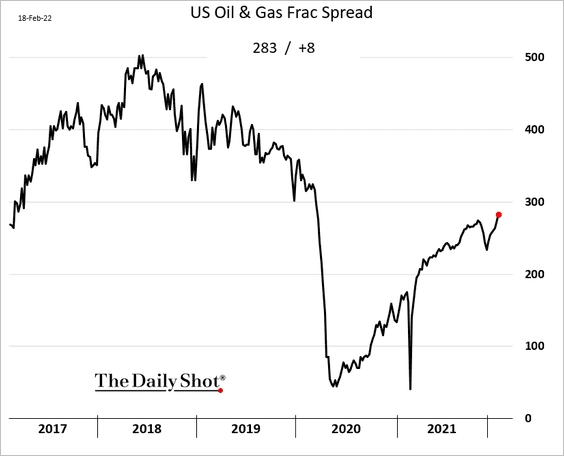
Here is the frac spread.
——————–
5. US natural gas inventories have declined faster than usual in recent weeks.
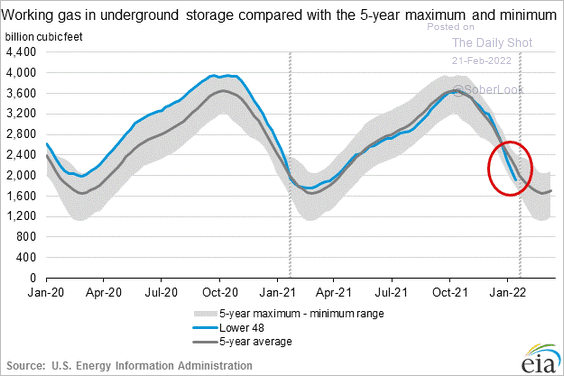
This inventory drop has not been due to cold weather in the US. In fact, it’s been relatively warm (chart below). This is about LNG demand from Europe and Asia.
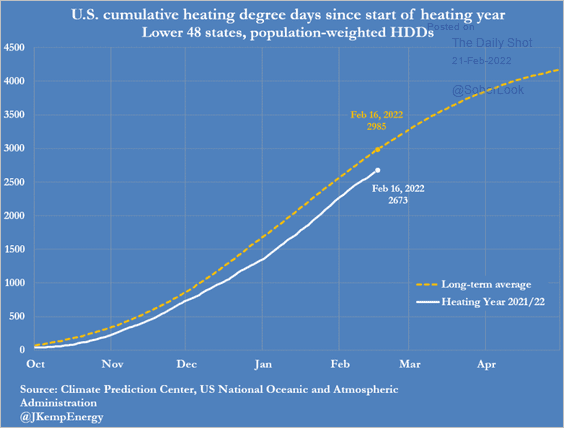 Source: @JKempEnergy Further reading
Back to Index
Commodities
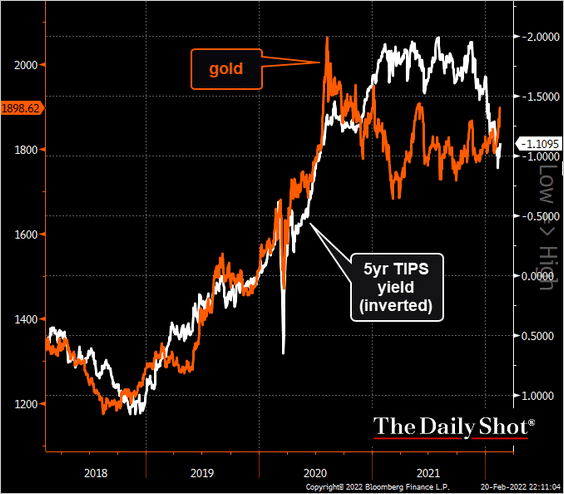
1. Flows into gold funds have been strong lately due to the Ukraine/Russia tensions (2 charts).
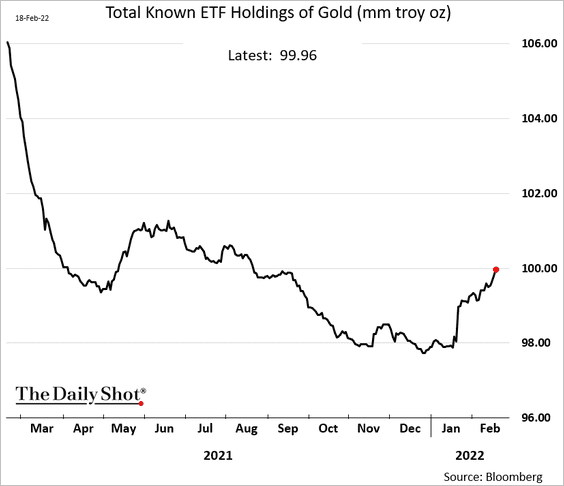
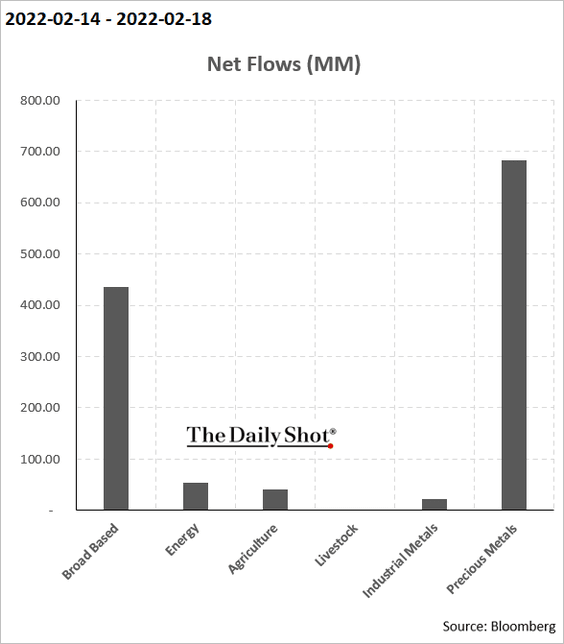
The gold mining sector also saw robust inflows.
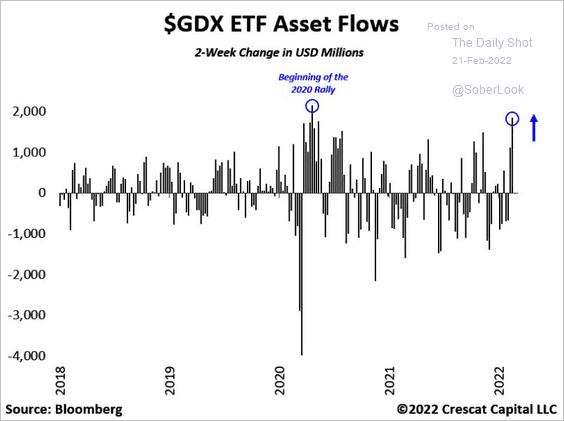 Source: @TaviCosta
But gold could be vulnerable here if geopolitical tensions ease.
 Source: @TheTerminal, Bloomberg Finance L.P.
——————–
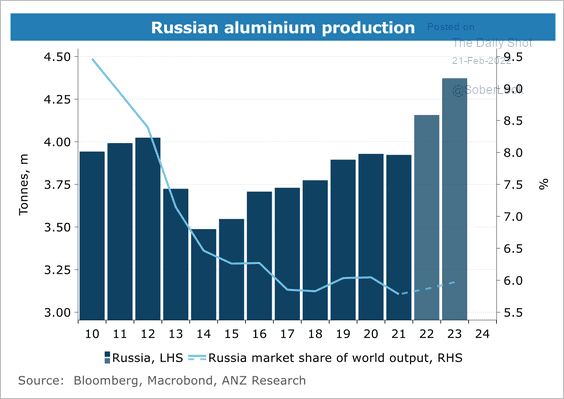
2. Russia is in the process of expanding both its output and global supply share of aluminum. Sanctions could slow this down.
 Source: ANZ Research
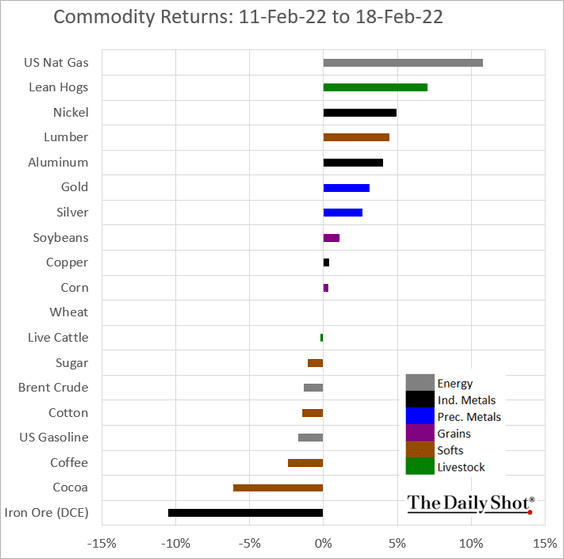
3. Finally, we have last week’s returns across select commodity markets.
Back to Index
Cryptocurrency
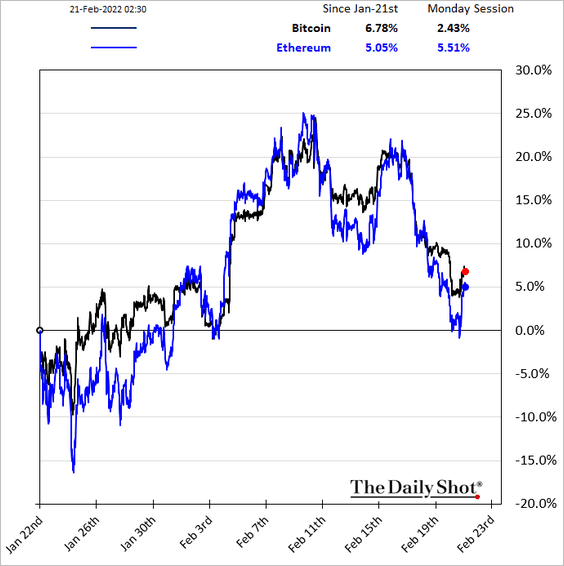
1. After a rough few days, cryptos have stabilized in response to the Ukraine/Russia news.
2. Bitcoin mining activity has accelerated recently after shifting out of China.
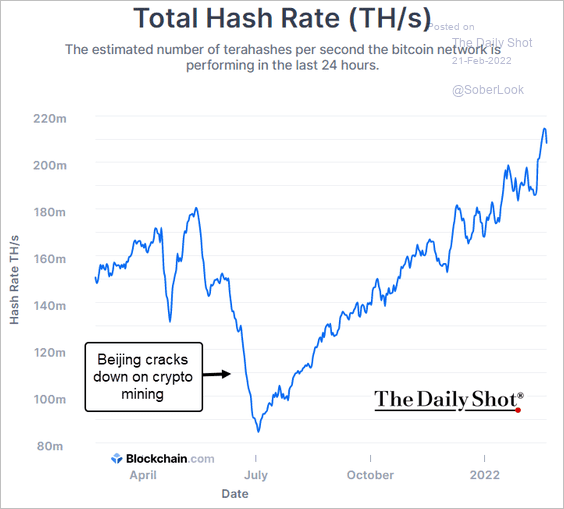 Source: Blockchain.com
3. How effective was Super Bowl advertising for crypto firms?
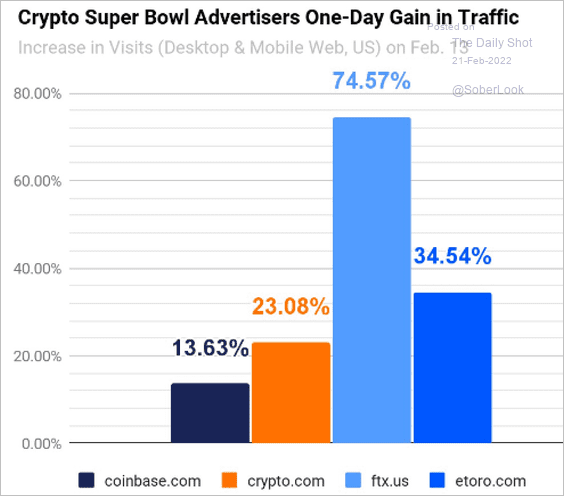 Source: @EricBalchunas, @Similarweb
Back to Index
Emerging Markets
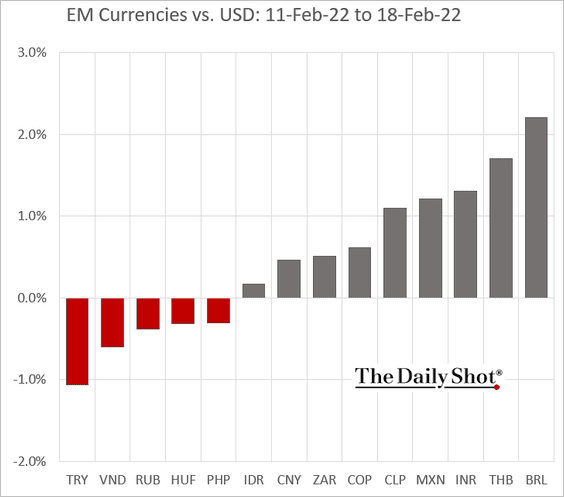
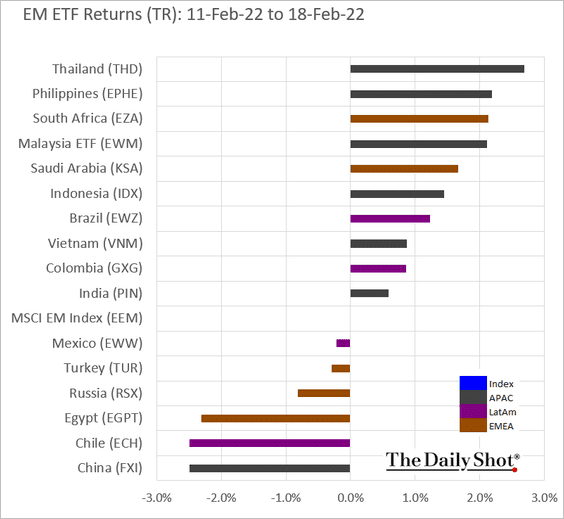
1. Let’s begin with last week’s returns.
• Currencies:
• Select EM ETFs:
——————–
2. The middle-class population is expected to grow across EM nations, especially in Asia/Pacific (2 charts).
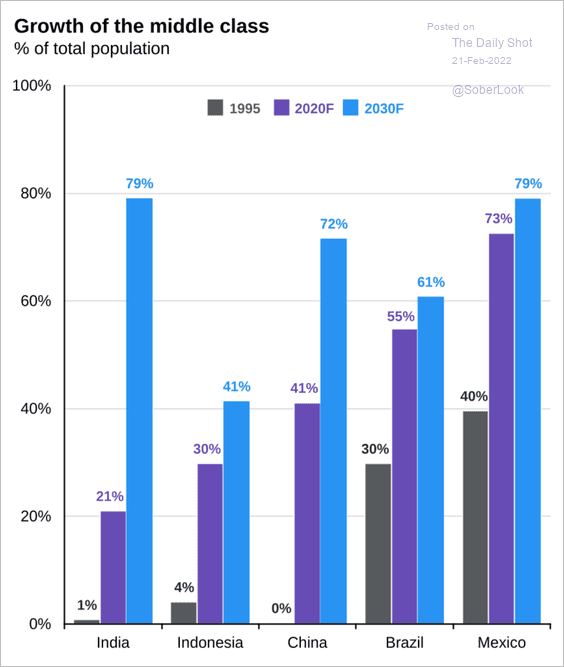 Source: J.P. Morgan Asset Management
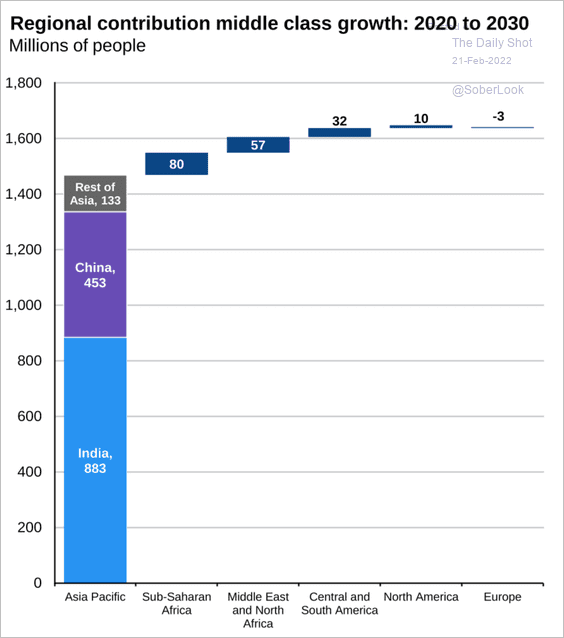 Source: J.P. Morgan Asset Management
Back to Index
China
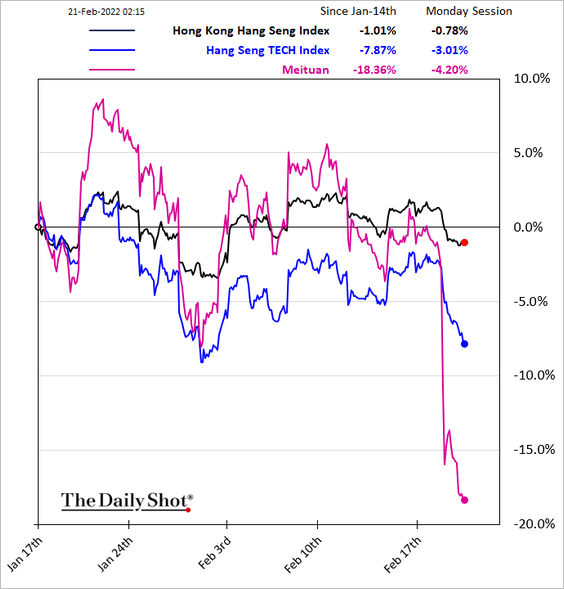
1. Beijing continues its regulatory crackdown on tech firms.
 Source: Reuters Read full article
——————–
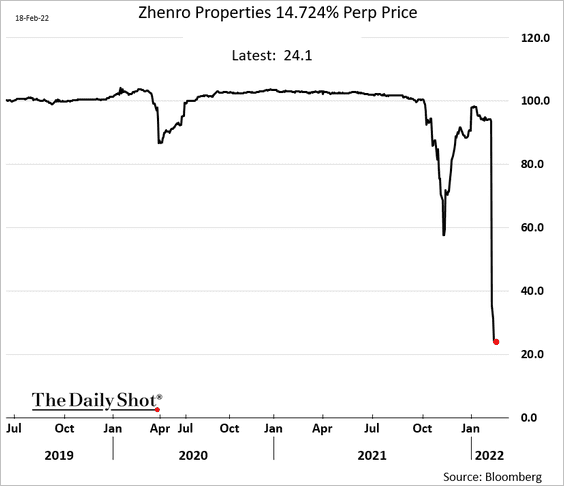
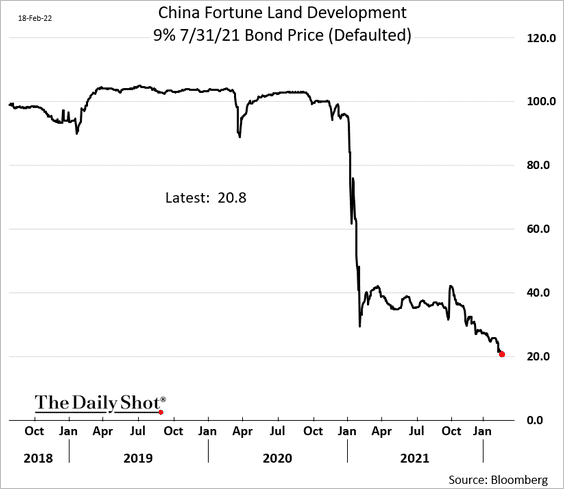
2. Property developers’ credit stress persists.
– Zhenro:
 Source: Reuters Read full article
– Fortune Land:
• Property developers and consumers are even more indebted now than during the 2014-2015 cycle.
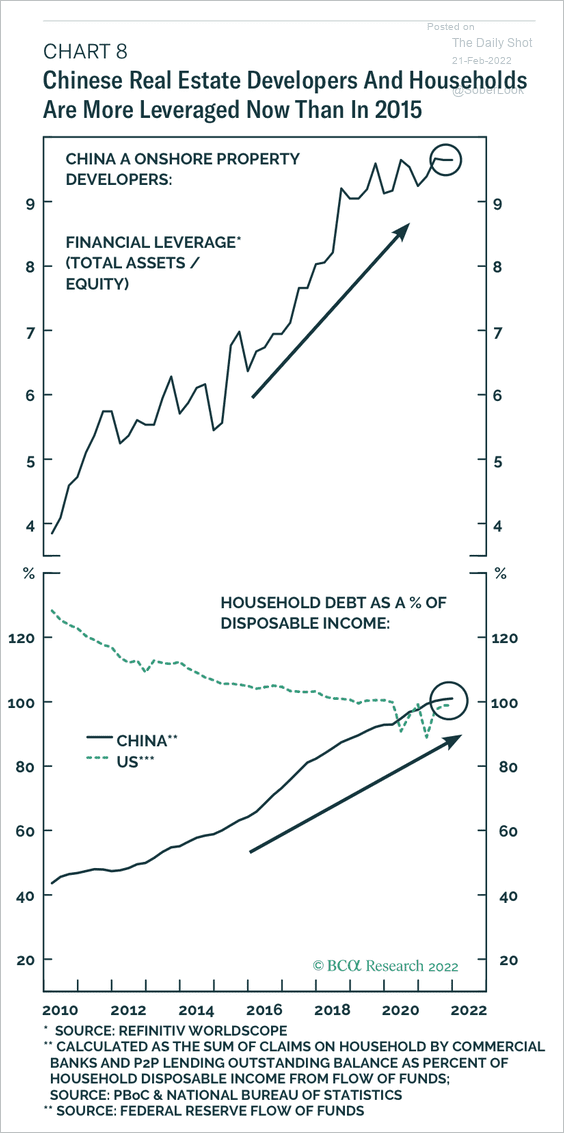 Source: BCA Research
• Next, we have some data from Bloomberg on developer debt maturities …
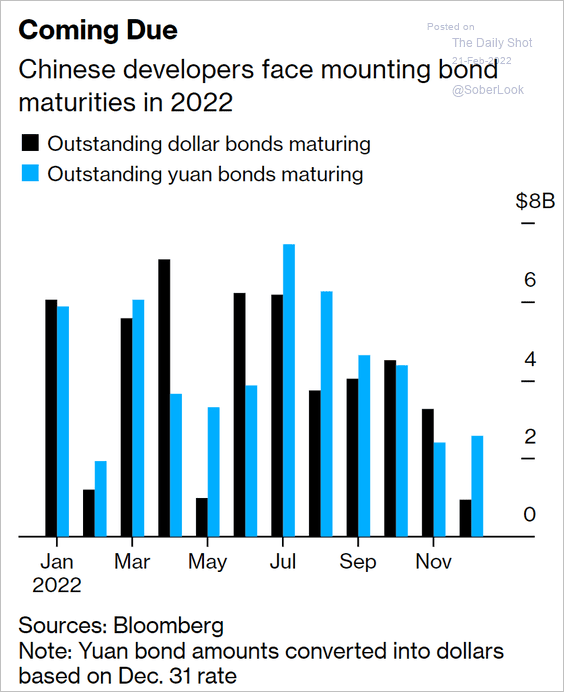 Source: Bloomberg Read full article
… and restructurings.
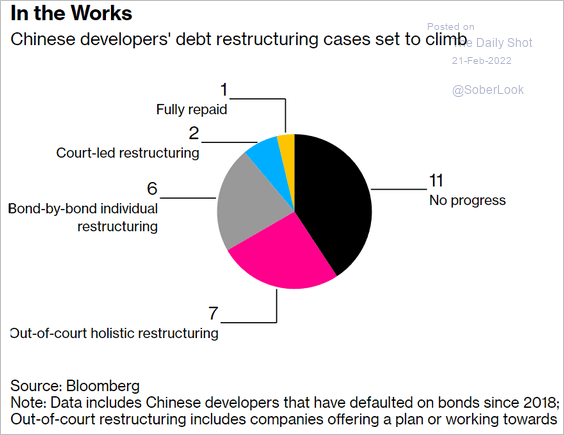 Source: Bloomberg Read full article
——————–
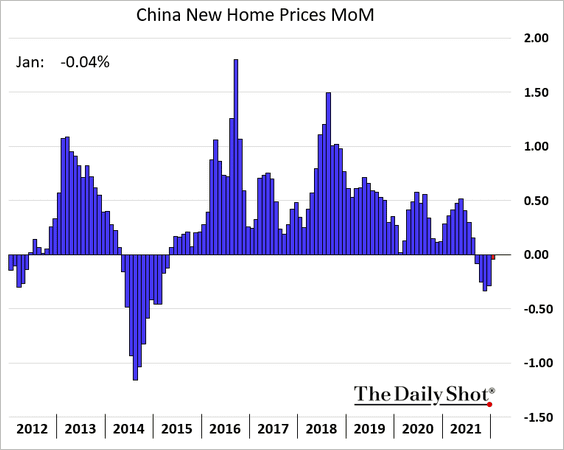
3. Home price declines have slowed.
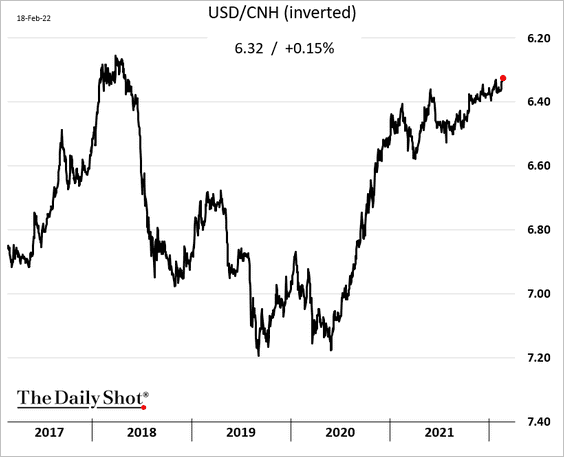
4. Bank clients are flush with foreign currency, …
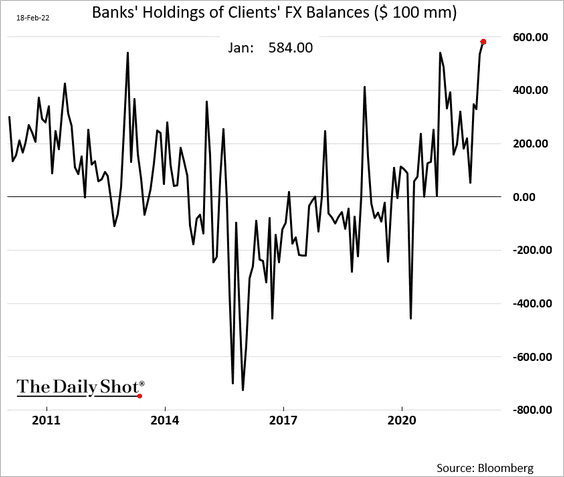
… which has been boosting the renminbi.
Back to Index
Asia – Pacific
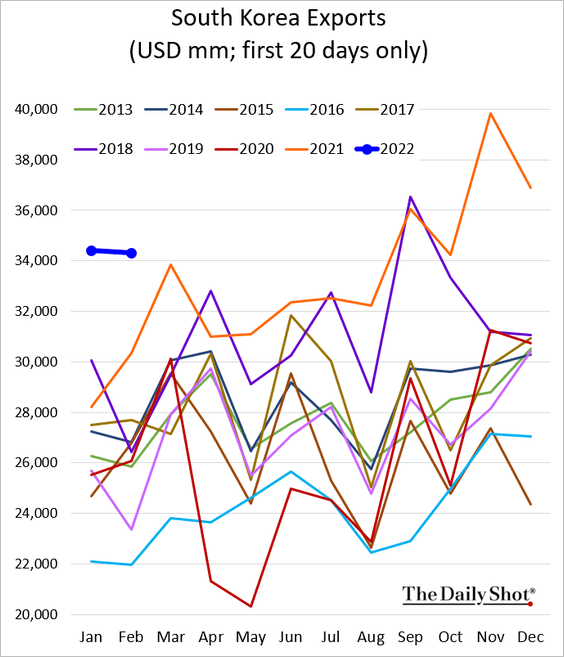
1. South Korea’s exports are off the highs but remain elevated.
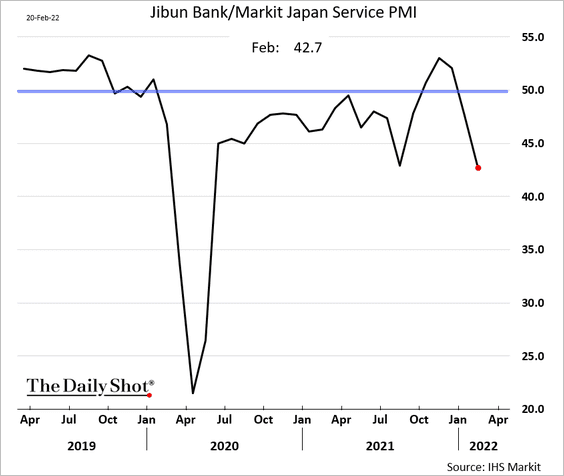
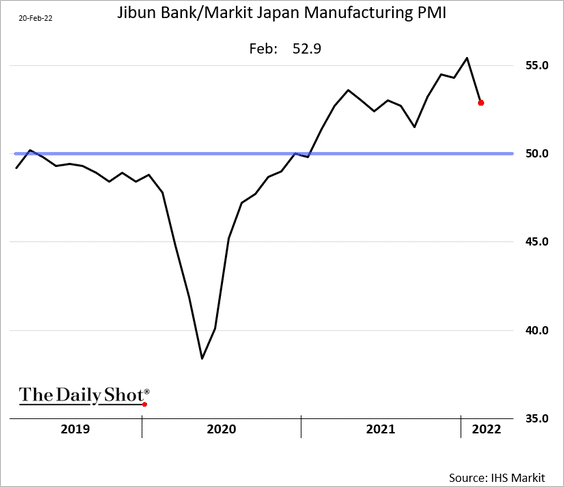
2. Japan’s business activity deteriorated this month as omicron took a toll on services.
• Services PMI:
• Manufacturing PMI:
• Composite output PMI:
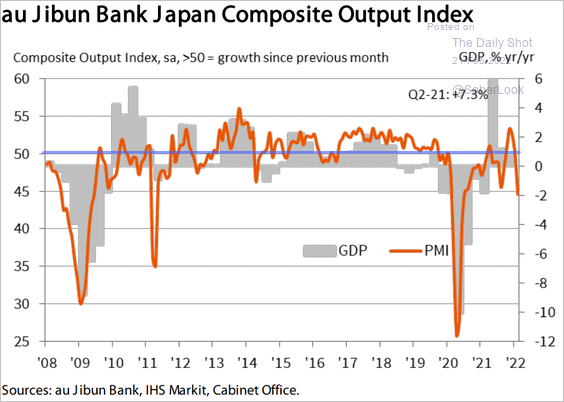 Source: IHS Markit
——————–
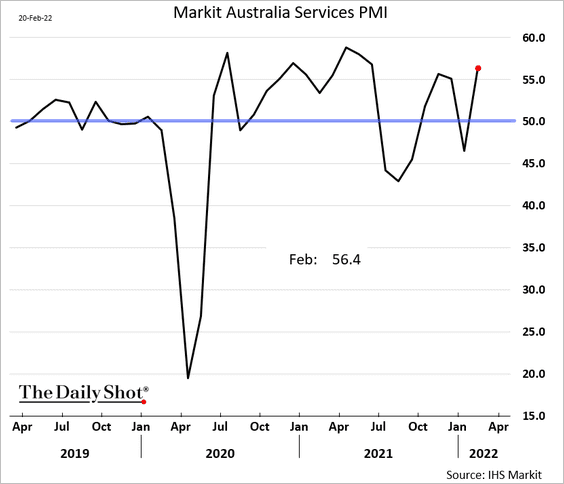
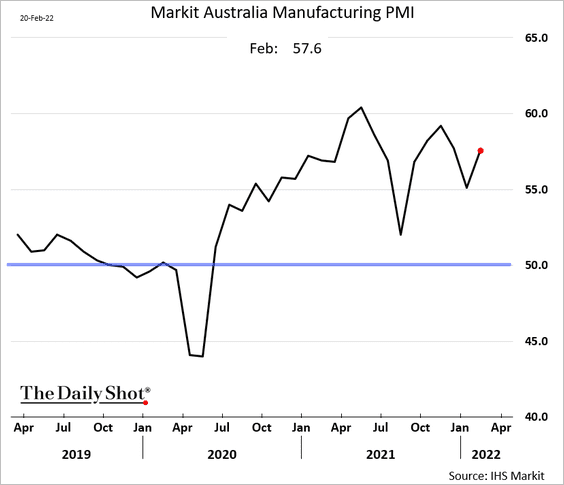
3. Australia’s business activity strengthened in February.
• Services:
• Manufacturing:
Back to Index
The Eurozone
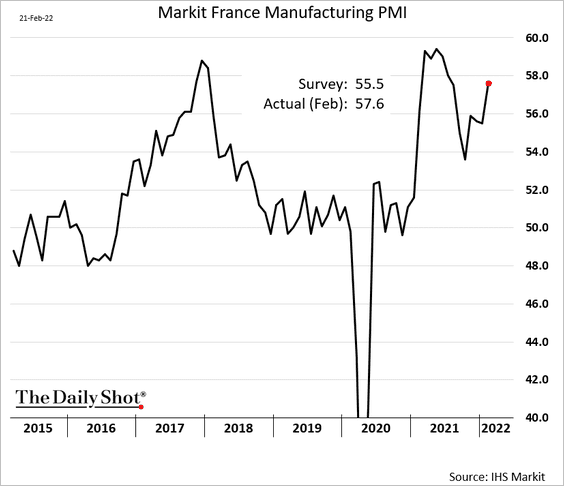
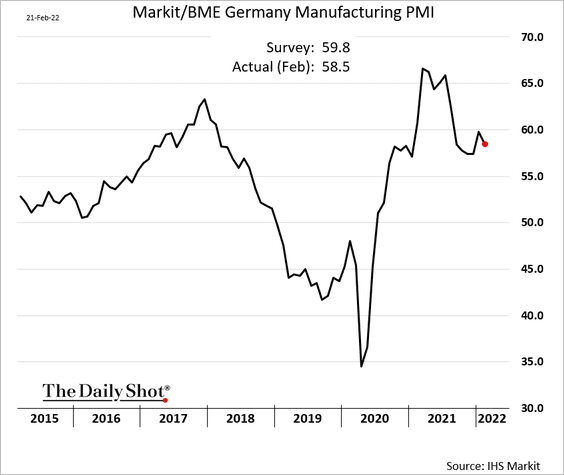
1. Flash PMI data surprised to the upside, …
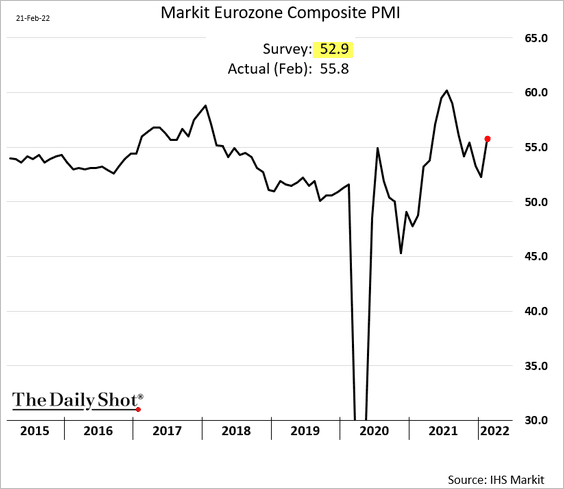
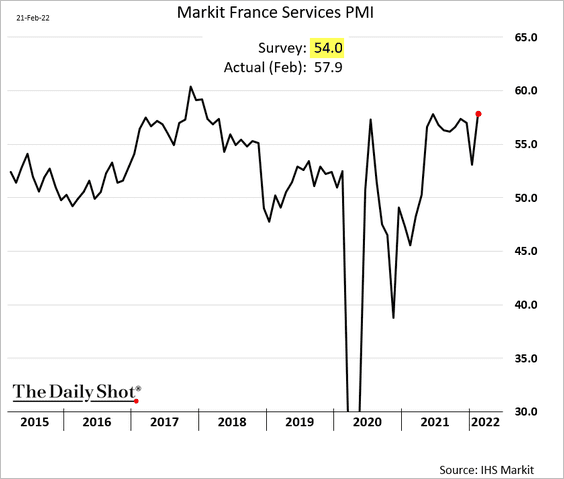
… as service-sector activity accelerated. This will give the ECB’s hawks more ammunition.
• France:
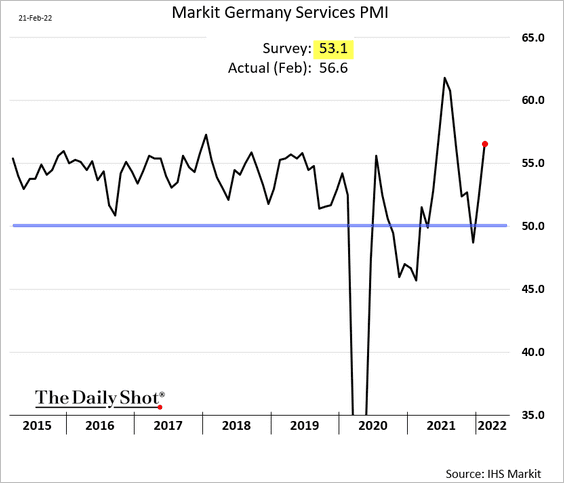
• Germany:
Manufacturing growth figures were mixed.
• France (stronger):
• Germany (softer, but still robust):
——————–
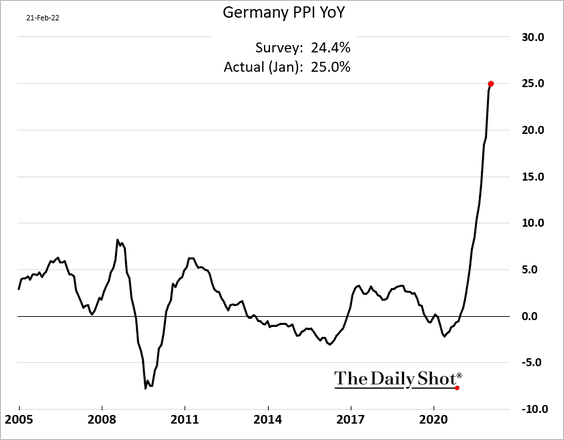
2. Germany’s producer prices are up 25% from a year ago.
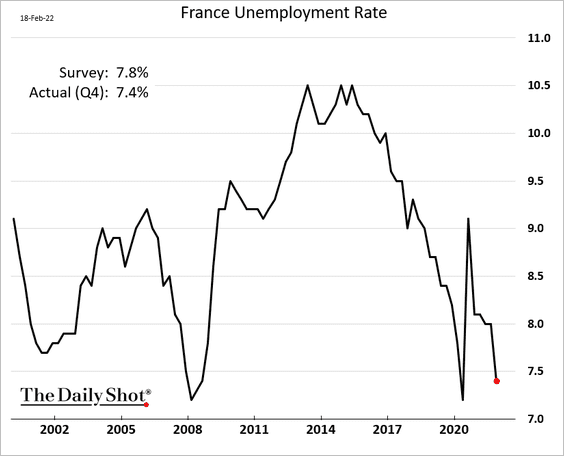
3. French unemployment was lower than expected last quarter, which should boost Macron’s campaign.
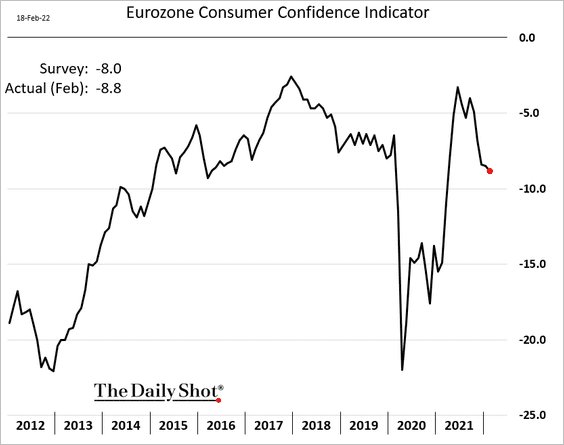
4. Euro-area consumer confidence softened this month amid inflationary pressures.
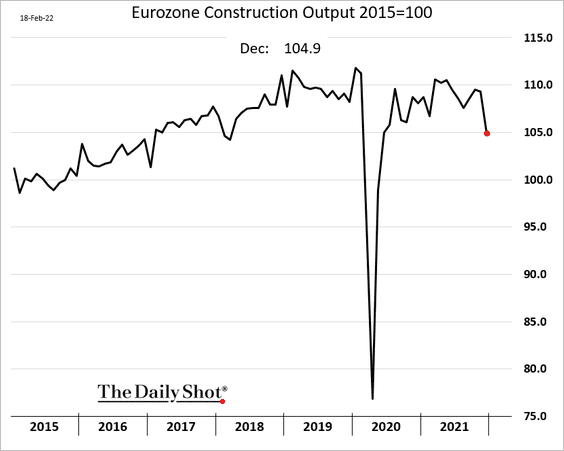
5. Construction output tumbled in December.
Back to Index
Europe
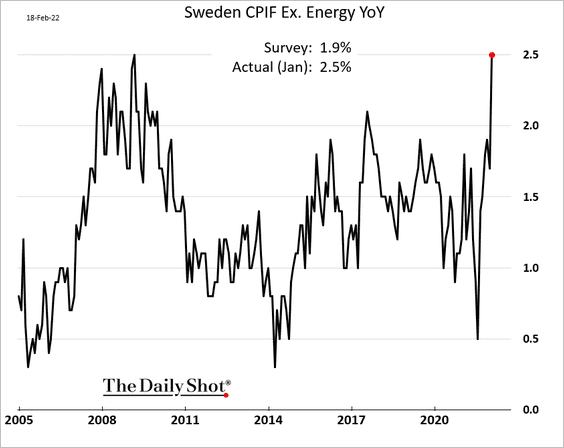
1. Sweden’s core inflation surprised to the upside.
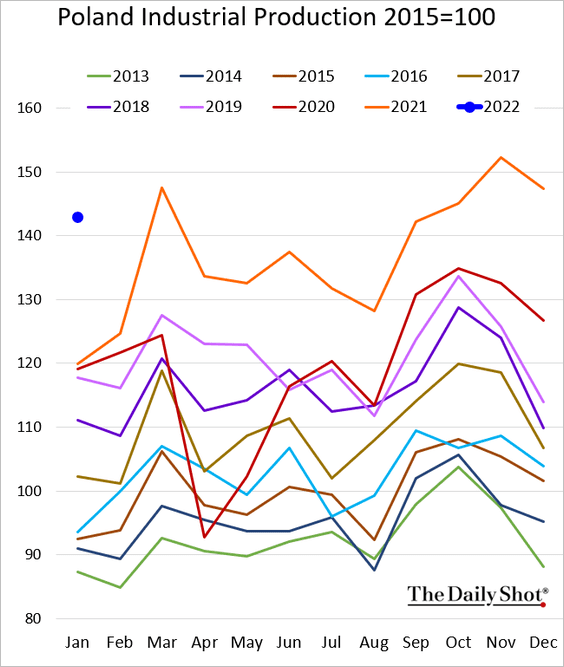
2. Poland’s industrial production was very strong in January.
3. This chart shows the EU’s foreign direct investment trends.
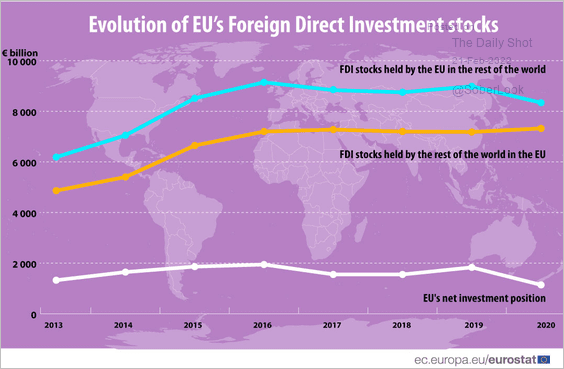 Source: Eurostat
4. What portion of the EU’s population is overweight?
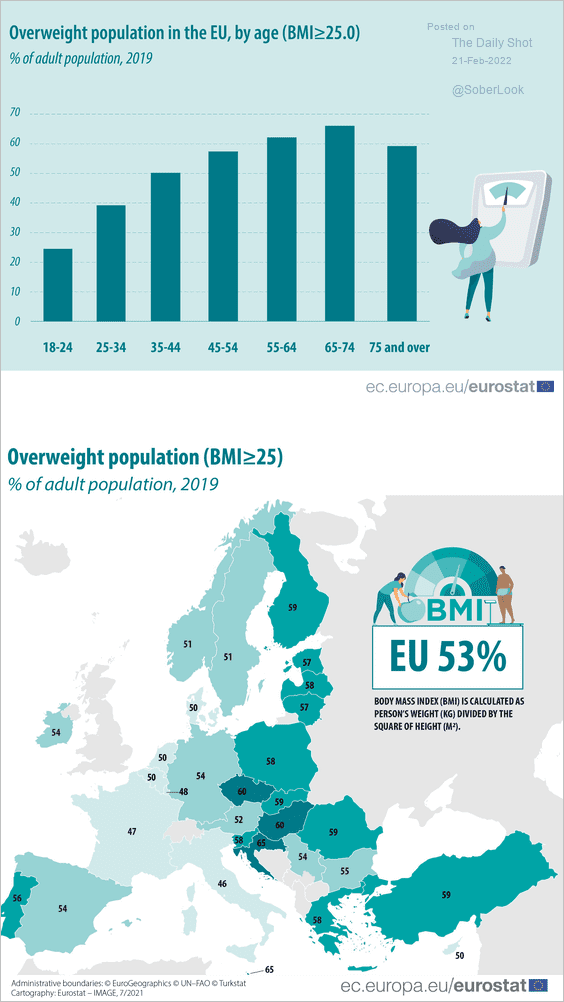 Source: Eurostat Read full article
Back to Index
The United Kingdom
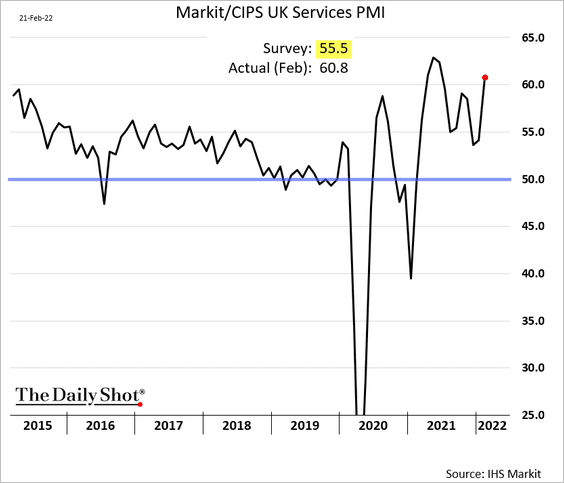
1. Services activity accelerated sharply this month as omicron ebbs.
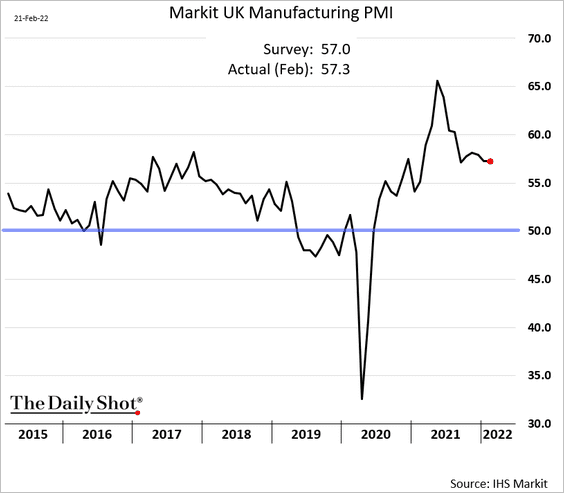
The manufacturing PMI was roughly in line with expectations.
——————–
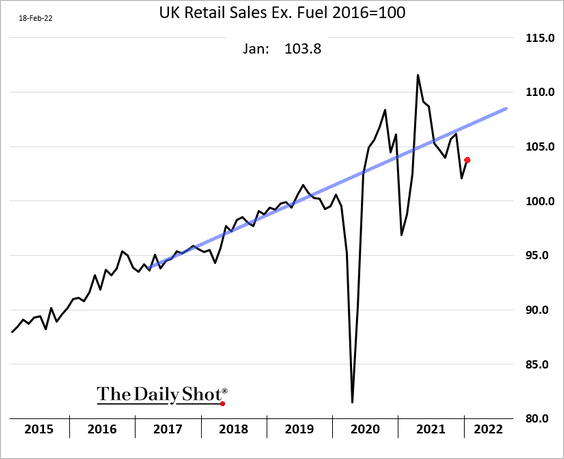
2. Retail sales ticked higher in January but remained well below the pre-COVID trend. Given the services PMI surprise (above), retail sales should show improvement in February.
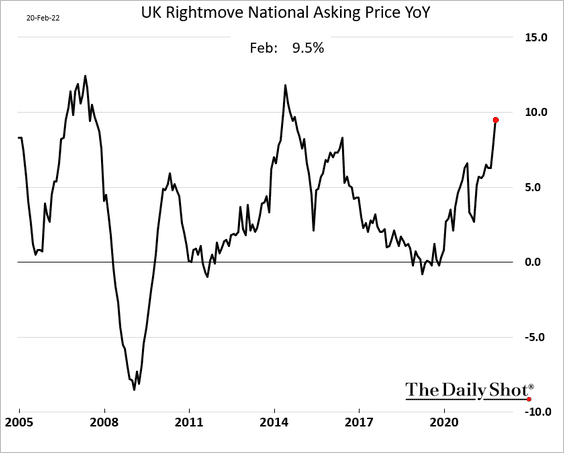
3. Home price appreciation accelerated this month.
Back to Index
Canada
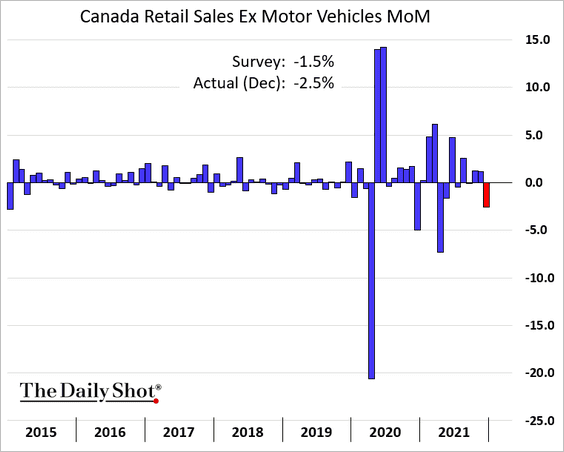
1. Similar to the US, Canada’s retail sales weakened in December.
2. Canadian stocks continue to trade at a substantial discount to the S&P 500.
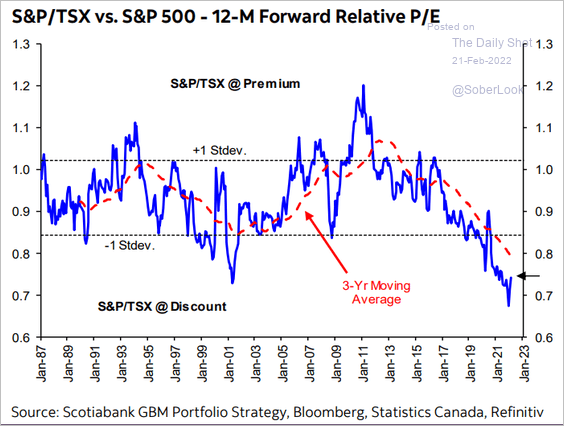 Source: Hugo Ste-Marie, Portfolio & Quantitative Strategy Global Equity Research, Scotia Capital
Back to Index
The United States
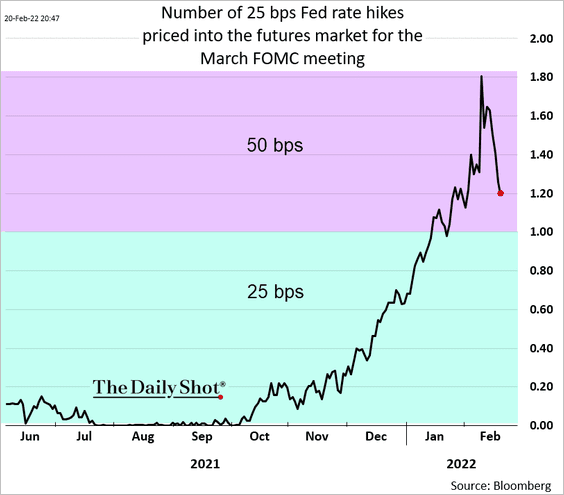
1. FOMC officials don’t seem to have the votes for a 50 bps hike next month, …
 Source: Reuters Read full article
… and the market is starting to reflect that sentiment.
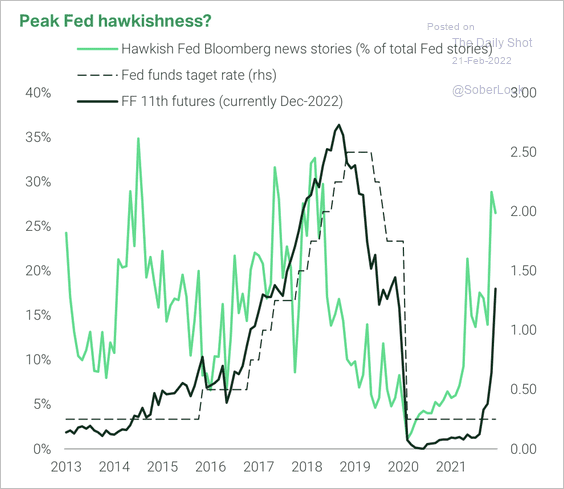
Have we reached “peak hawkishness”?
 Source: TS Lombard
——————–
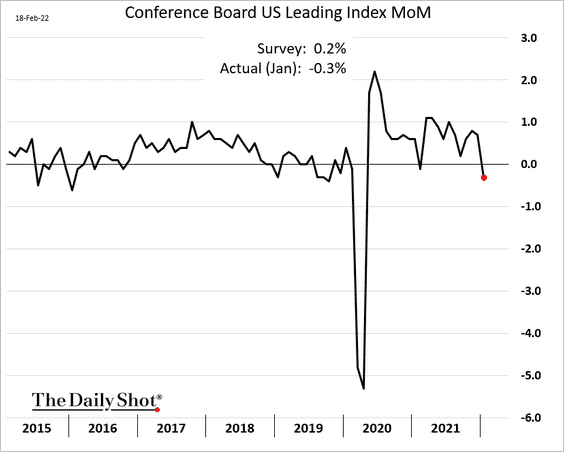
2. The Conference Board’s leading indicator deteriorated last month due in part to the stock market weakness.
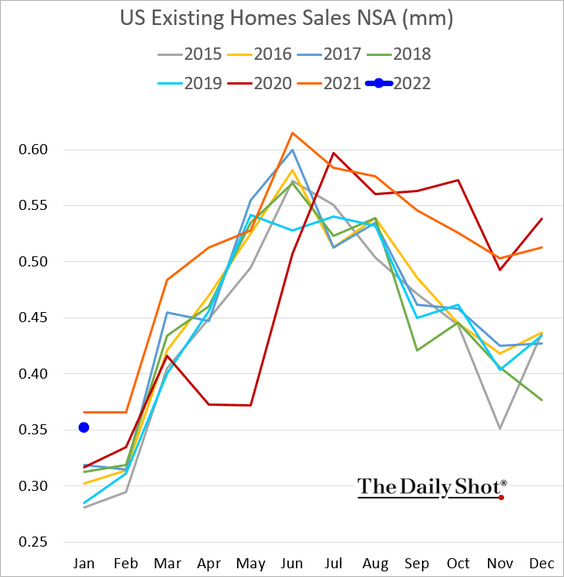
3. Existing home sales were strong in January, topping expectations. We will have more on the topic tomorrow.
4. The credit cycle has moved into the downturn stage, which could weigh on risk assets this year, according to TS Lombard.
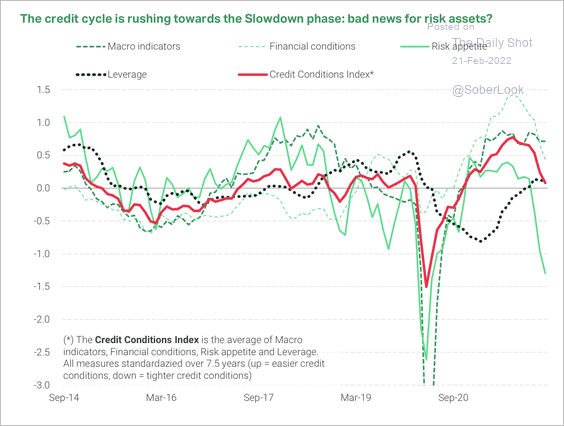 Source: TS Lombard
5. Next, we have some updates on supply chain bottlenecks.
• Longer delivery times:
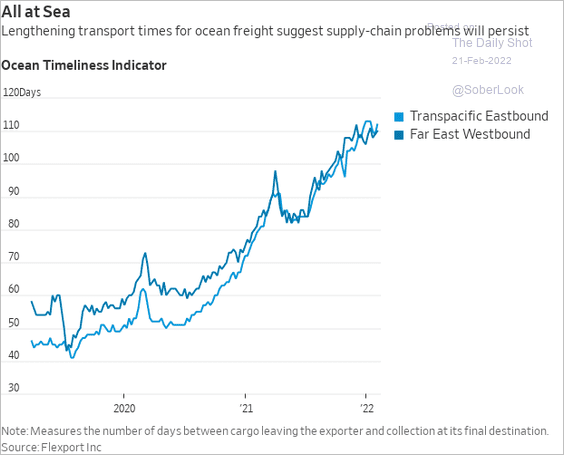 Source: @WSJ Read full article
• Freight shipping costs:
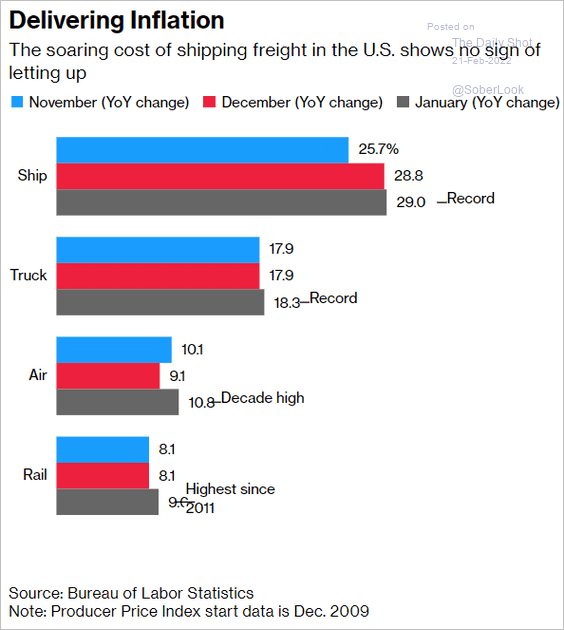 Source: Bloomberg Read full article
• Containerships waiting at LA/Long Beach ports:
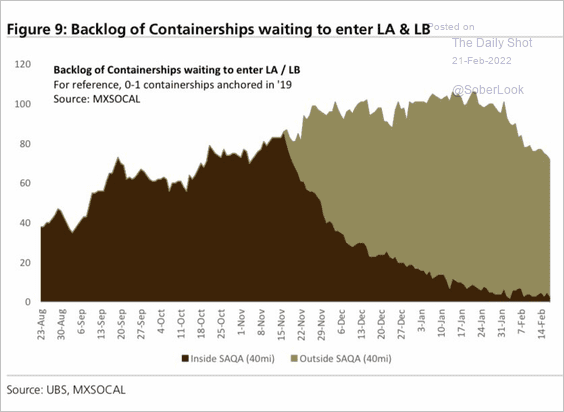 Source: UBS; @AlessioUrbanBacklog
——————–
6. US COVID cases continue to ease.
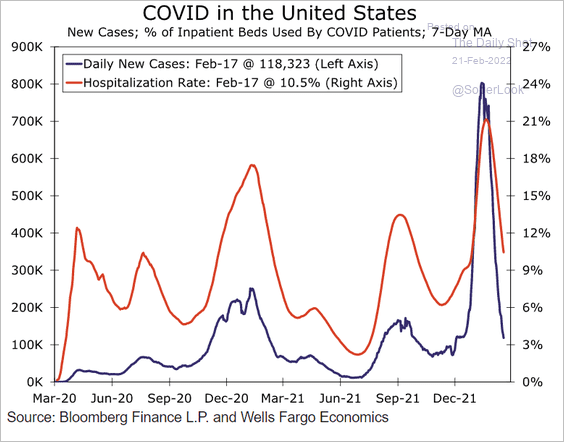 Source: Wells Fargo Securities
Back to Index
Global Developments
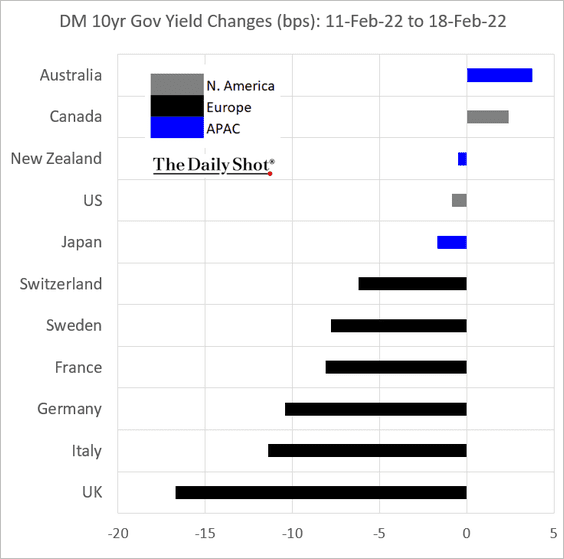
1. Across advanced economies, government bond yields increased only in Canada and Australia last week.
2. Real interest rates in developed commodity countries are still far from becoming restrictive.
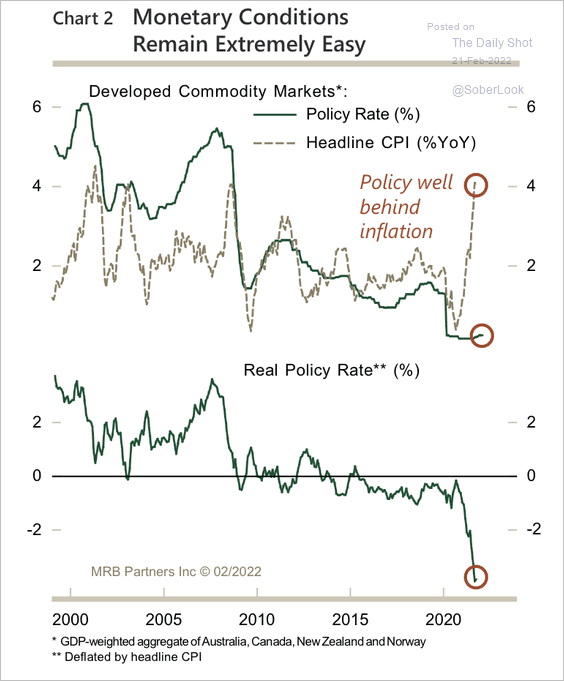 Source: BCA Research
3. Input prices and suppliers’ delivery times have peaked.
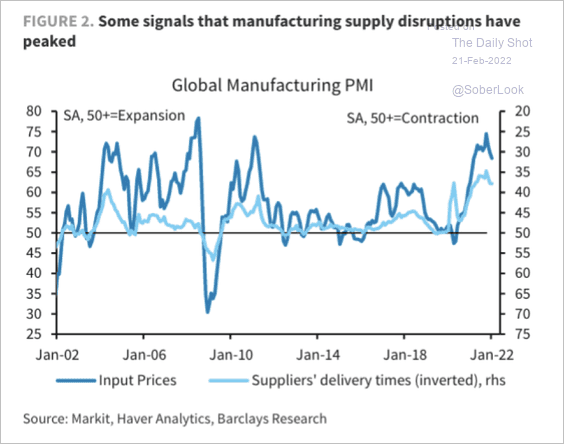 Source: Barclays Research
4. Total assets under management of currency traders (FX hedge funds) are approaching 2007 highs.
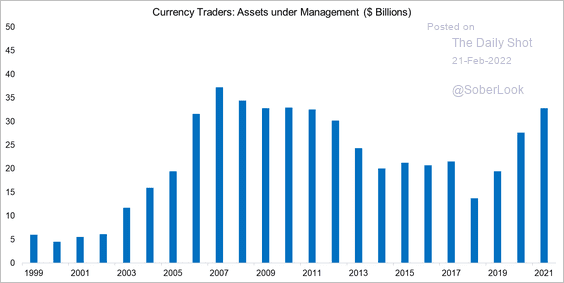 Source: FactorResearch Read full article
Many FX factors are trading below where they were issued, which implies negative risk premia.
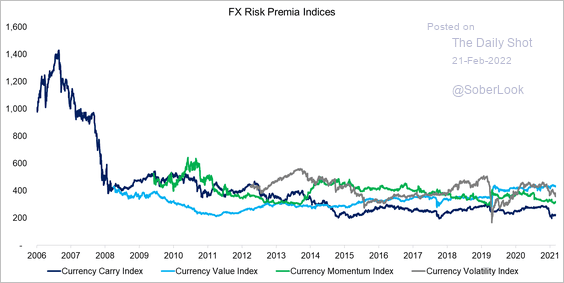 Source: FactorResearch Read full article
——————–
5. Higher inflation helps lower government debt-to-GDP ratios.
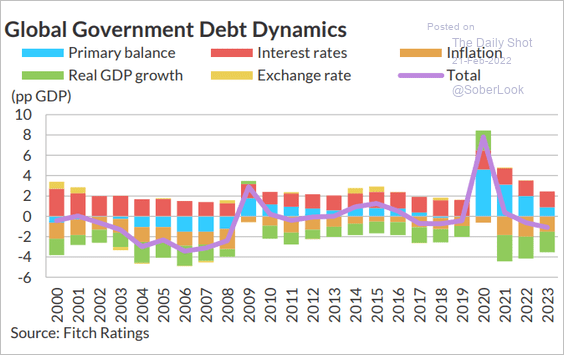 Source: Fitch Ratings
——————–
Food for Thought
1. Effective tax rate ratio of the top 10% vs. the bottom 50%:
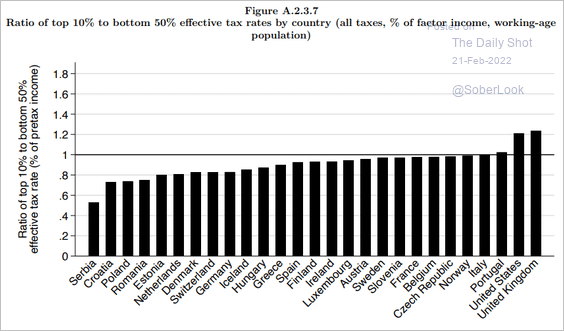 Source: @CPopeHC Read full article
2. Global auto sales:
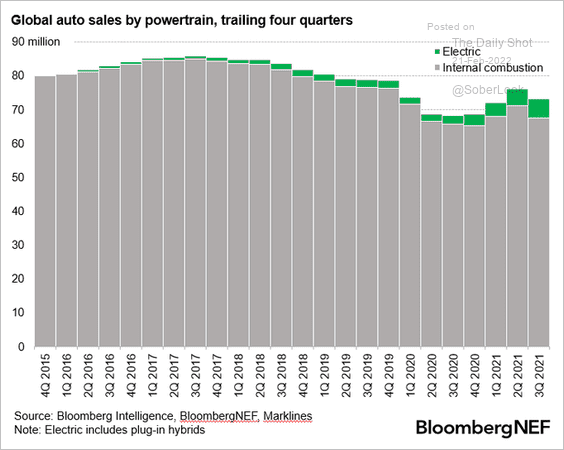 Source: @NatBullard
3. Real median household income among African Americans over the past three decades:
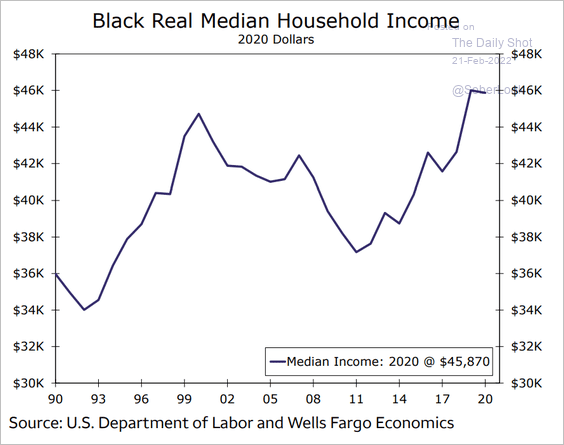 Source: Wells Fargo Securities
4. The US ideological divide on climate:
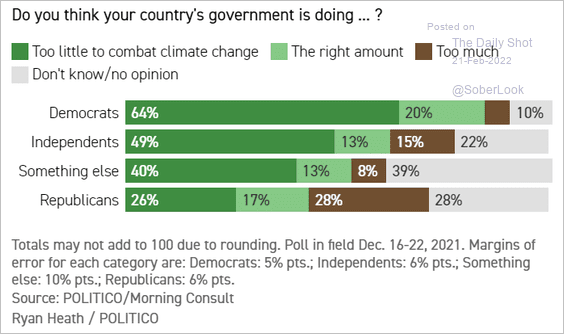 Source: POLITICO Read full article
5. Global voter turnout trend:
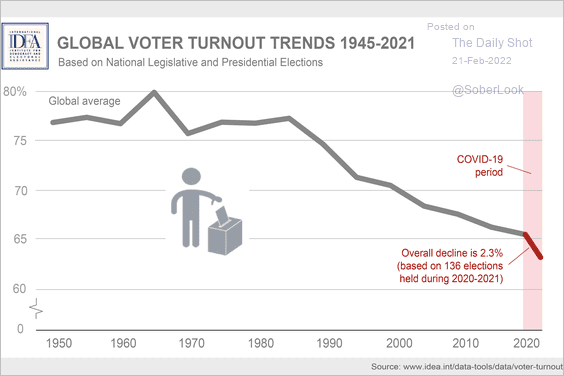 Source: @Int_IDEA Read full article
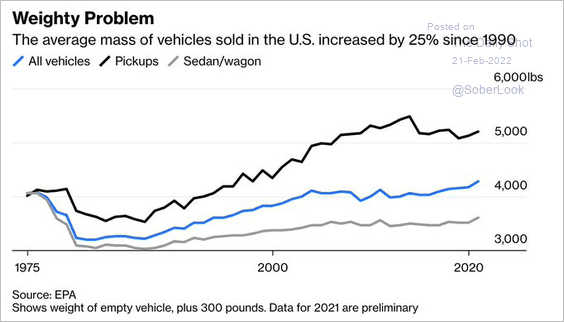
6. Larger vehicles:
 Source: @bopinion Read full article
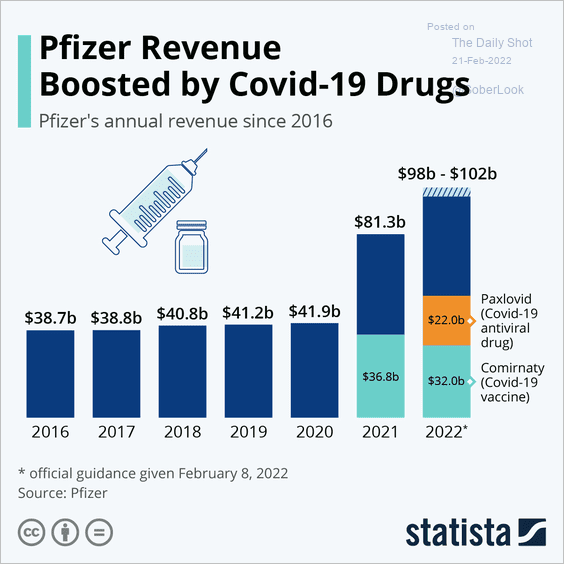
7. Pfizer revenues:
 Source: Statista
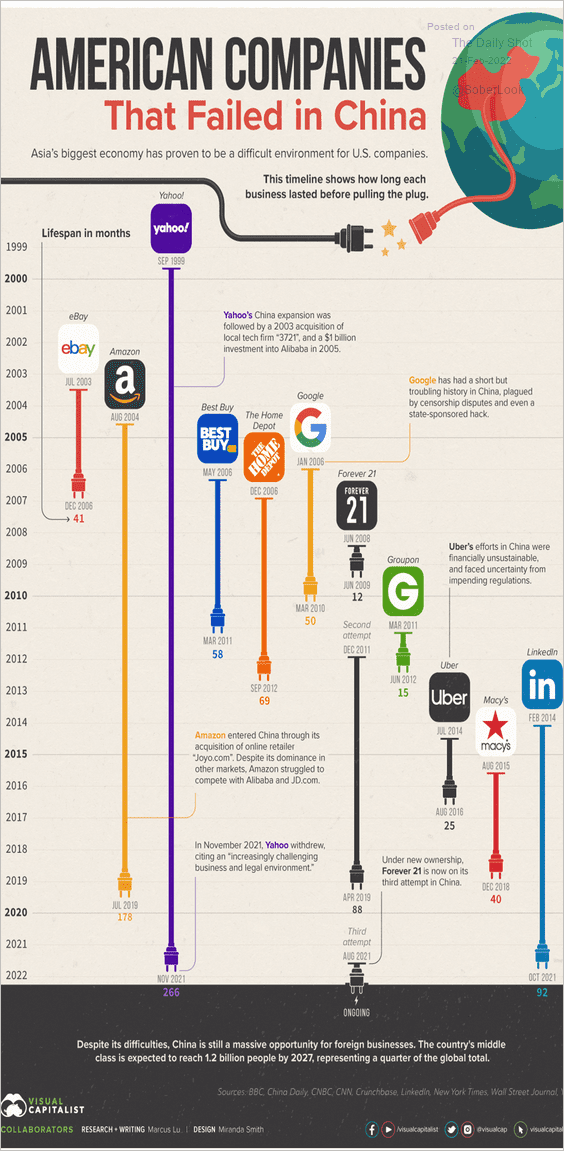
8. US companies that have been pushed out of China:
 Source: Visual Capitalist Read full article
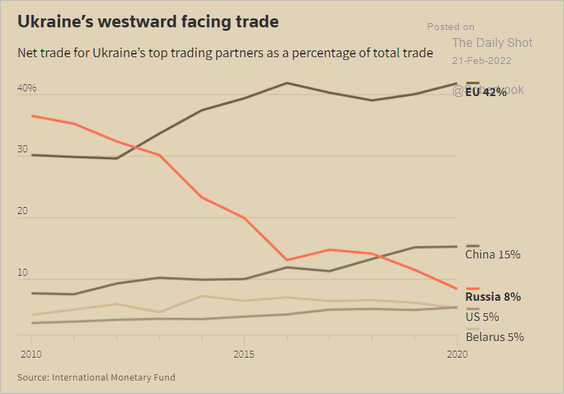
9. Ukraine’s shifting trade:
 Source: Reuters Read full article
Ukraine’s ramped up defense budget:
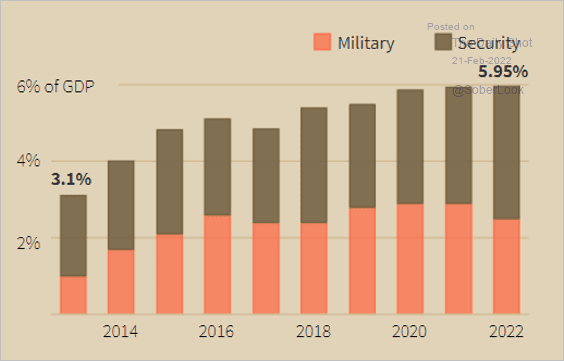 Source: Reuters Read full article
——————–
10. LEGO’s revenue growth:
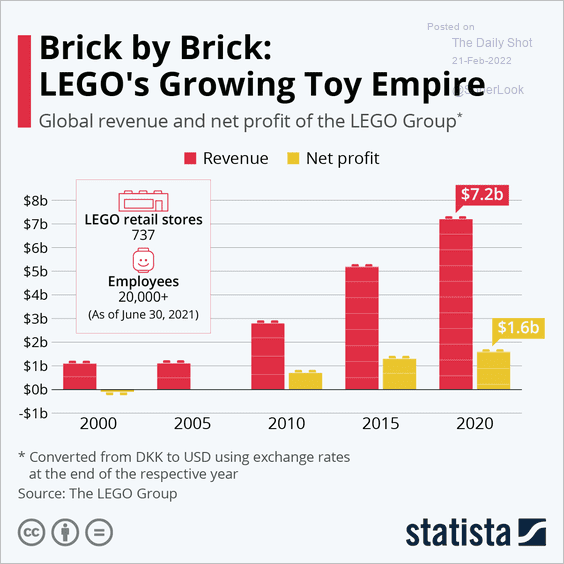 Source: Statista
——————–
Back to Index