
The Daily Shot: 11-Mar-22
• The United States
• The Eurozone
• Europe
• Japan
• China
• Emerging Markets
• Cryptocurrency
• Energy
• Equities
• Credit
• Rates
• Food for Thought
The United States
1. The CPI report was in line with expectations, as inflation
hit the highest level in over 40 years.
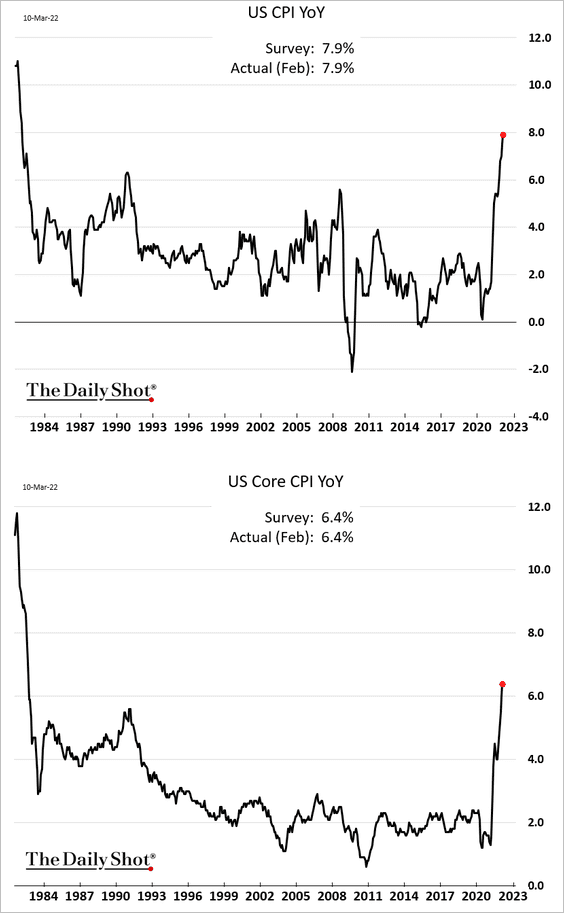
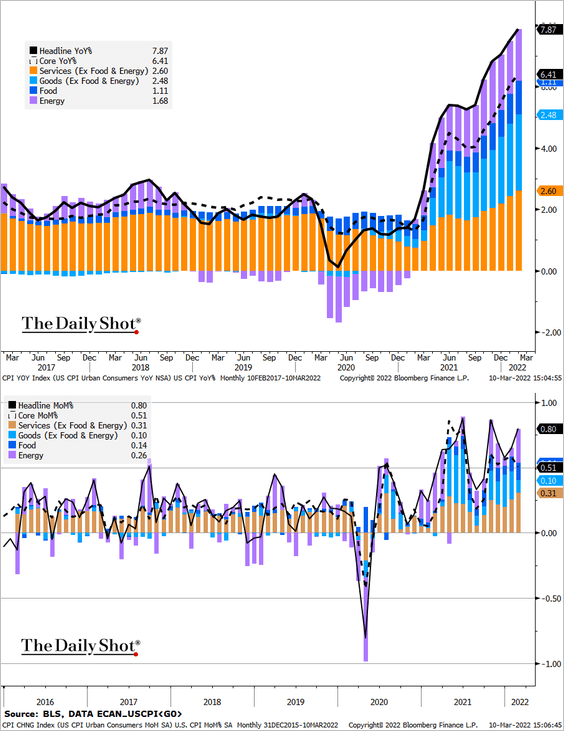
Here is the attribution (year-over-year and month-over-month).
 Source: @TheTerminal, Bloomberg Finance L.P.
This chart shows some of the key components.
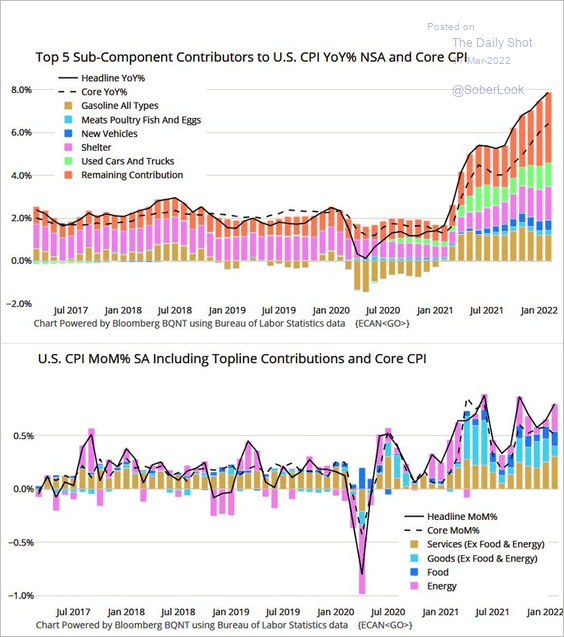 Source: @M_McDonough
We will have more on the CPI report next week.
——————–
2. Households will be forced to significantly shift their spending patterns in response to inflation.
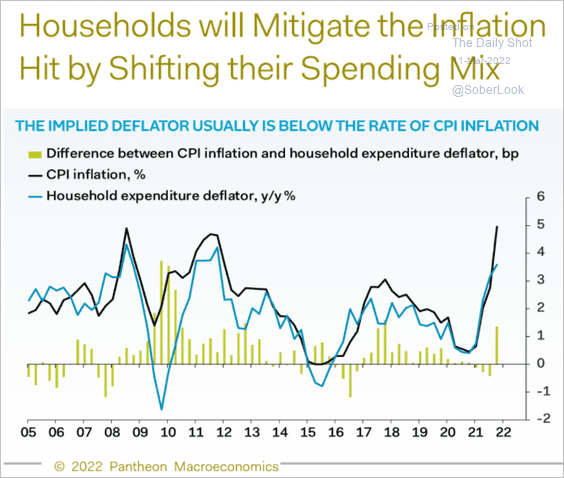 Source: Pantheon Macroeconomics
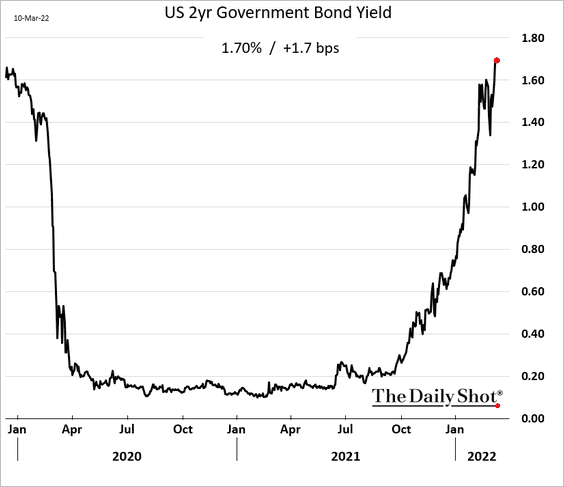
3. The 2-year Treasury yield is now well above pre-pandemic levels.
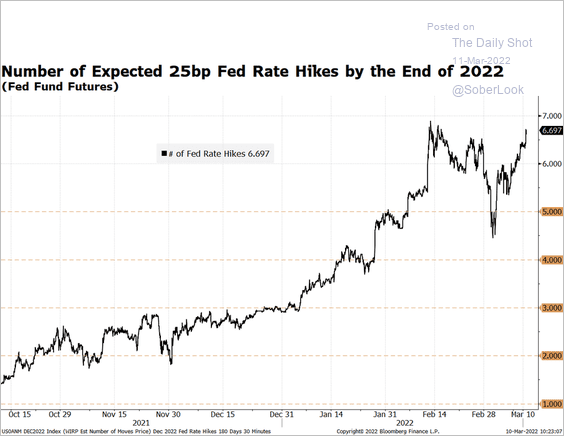
And the market is once again pricing in nearly seven Fed rate hikes this year.
 Source: @M_McDonough
——————–
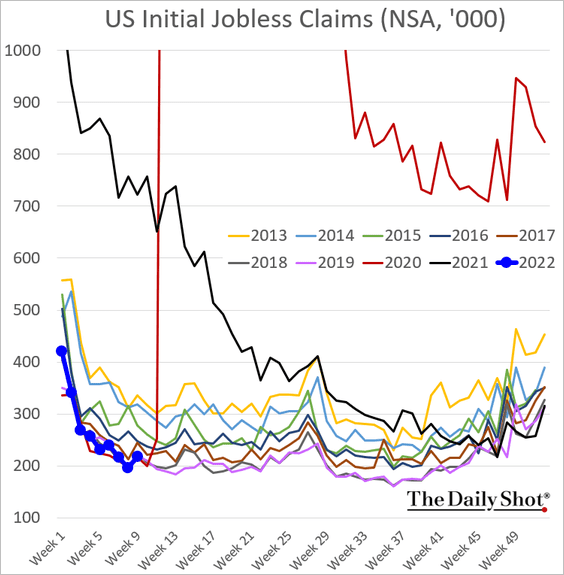
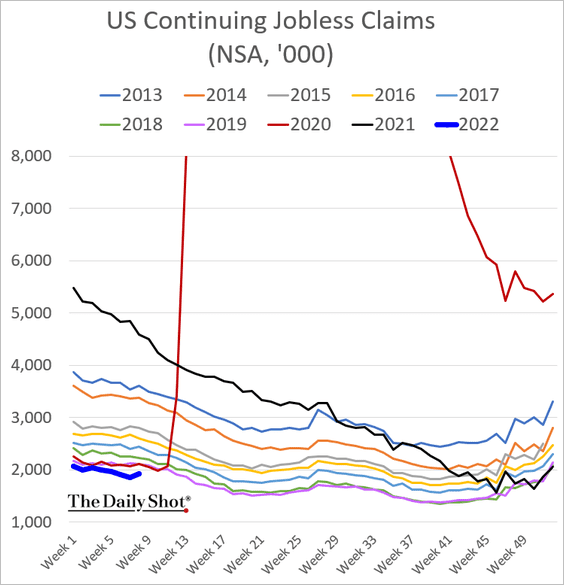
4. Unemployment claims remain near multi-year lows for this time of the year.
——————–
5. Nominal wage growth hit the highest level in over 30 years.
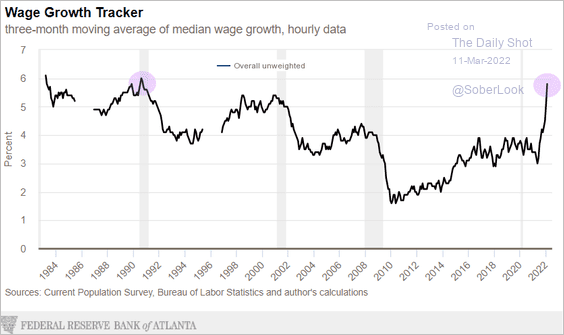 Source: @AtlantaFed
Wage gains for hourly workers have been particularly strong.
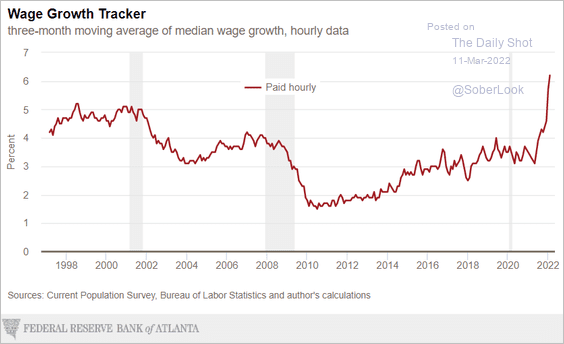 Source: @AtlantaFed
While job switching has delivered substantial pay increases, employees staying at their jobs are getting healthy raises as well.
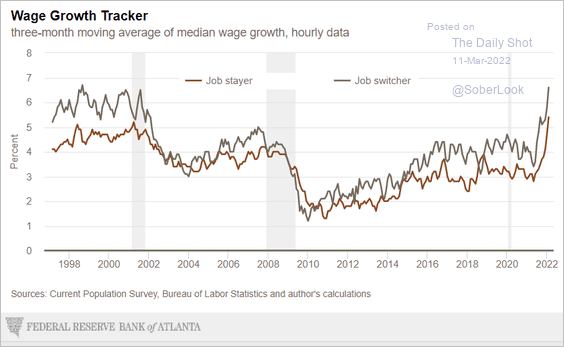 Source: @AtlantaFed
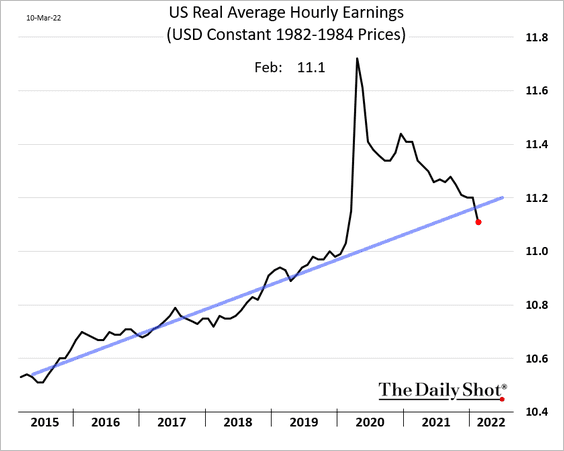
However, surging inflation has been offsetting wage increases.
——————–
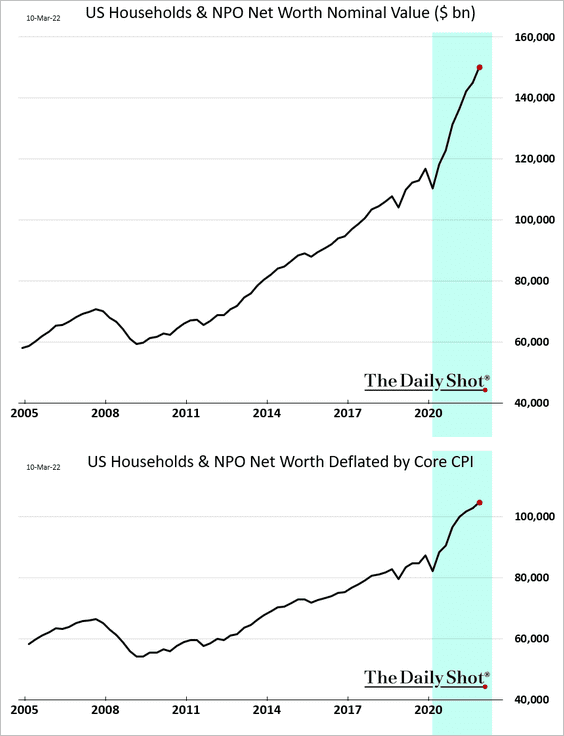
6. The pandemic era resulted in rapid gains in household wealth, even when adjusted for inflation. Higher inflation and weaker stock prices will put a dent in this trend in Q1.
7. Inflation will increasingly become a drag on economic activity.
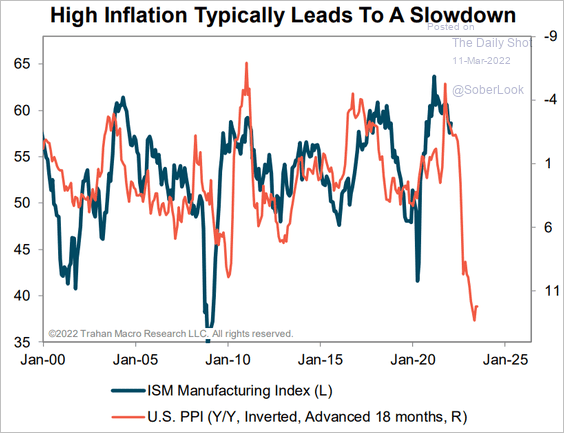 Source: Trahan Macro Research
How much will the oil shock impact US GDP? Here is an estimate from Oxford Economics.
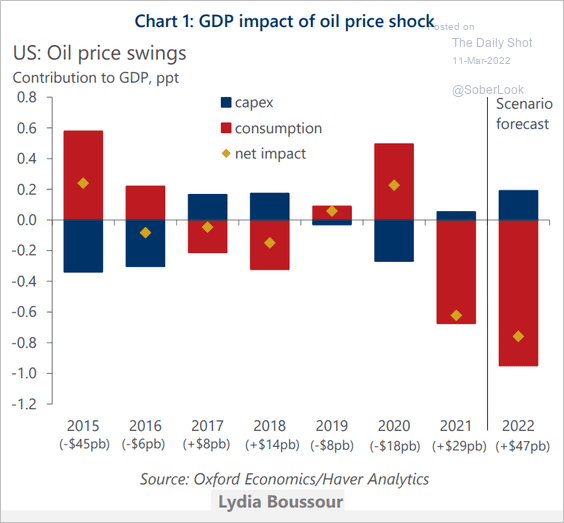 Source: Oxford Economics
——————–
8. Finally, this chart shows growth in the working-age population by decade.
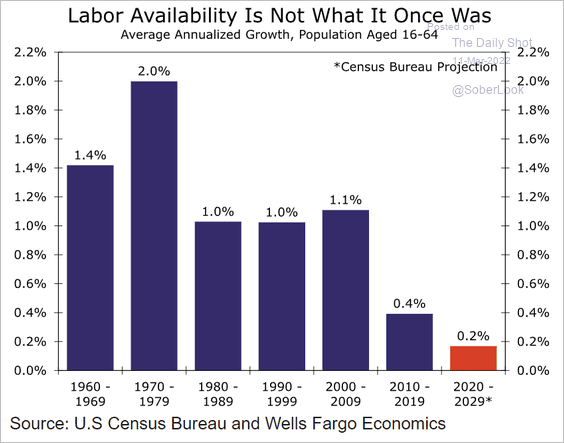 Source: Wells Fargo Securities
Back to Index
The Eurozone
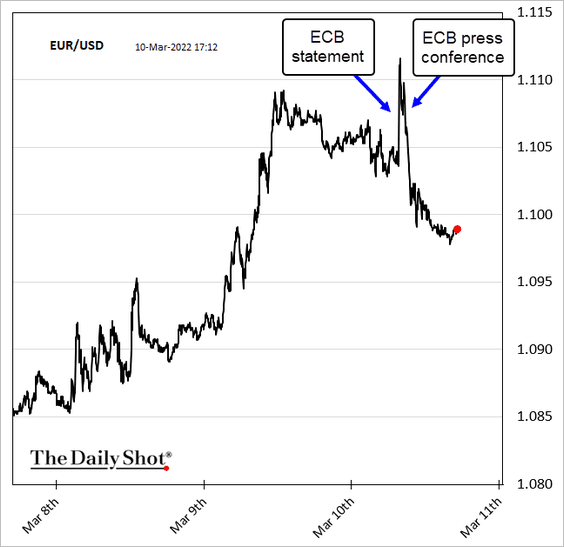
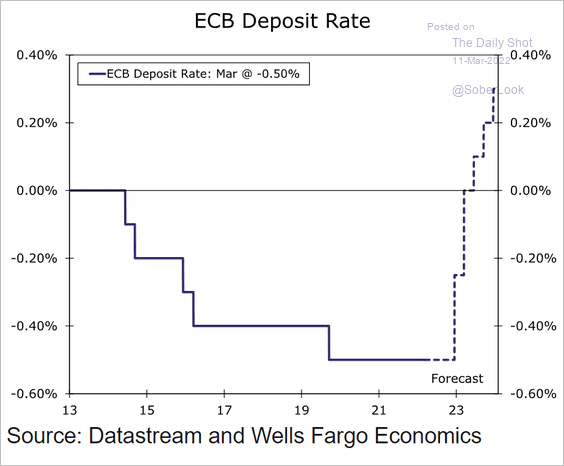
1. The ECB will wind down QE sooner than expected.
 Source: CNBC Read full article
Below are two projections.
– Pantheon Macroeconomics:
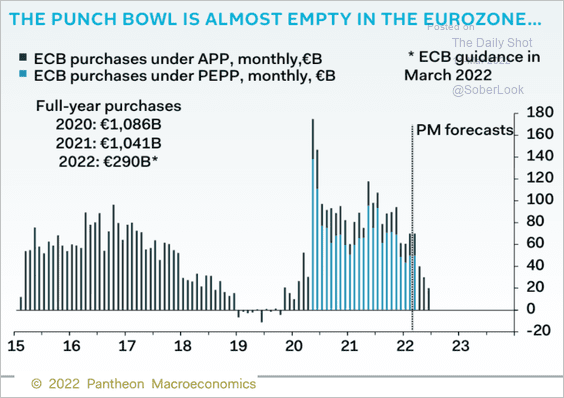 Source: Pantheon Macroeconomics
– Nordea Markets:
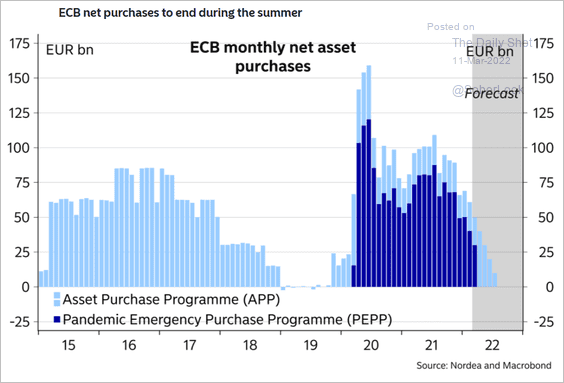 Source: Nordea Markets
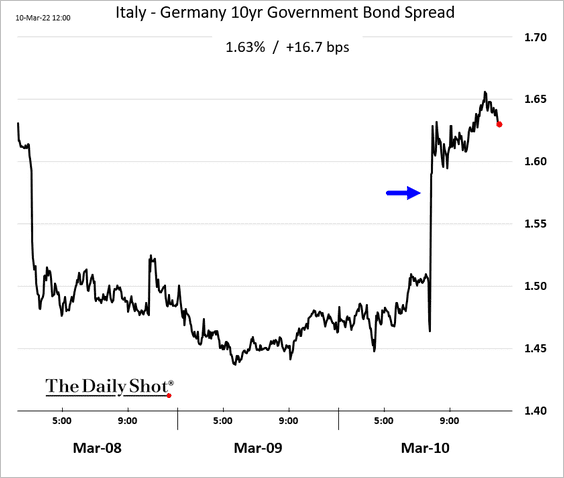
Bond yields jumped. Here is the 10yr Italy-Germany spread.
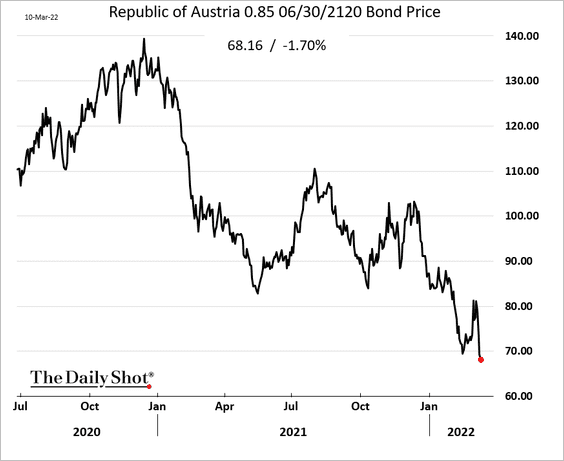
This chart shows Austria’s 100-year bond price.
• But the central bank will delay rate hikes due to the war. The euro’s rebound was short-lived.
Wells Fargo sees the first hike in December.
 Source: Wells Fargo Securities
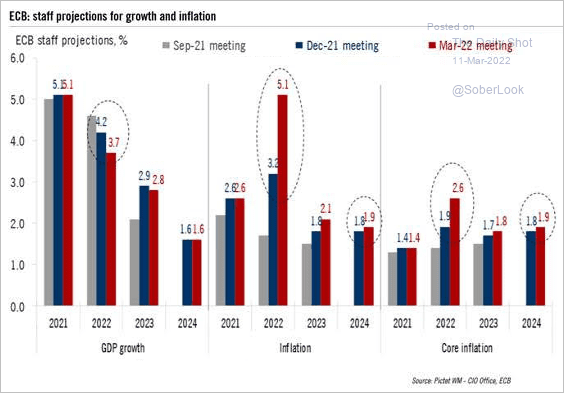
• The ECB downgraded its GDP forecasts and boosted inflation projections.
 Source: @fwred
——————–
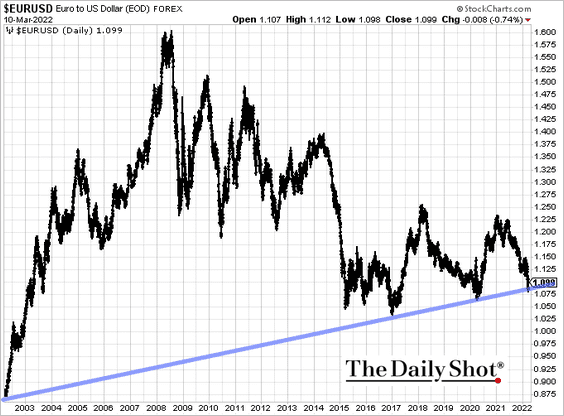
2. The euro is holding long-term support for now.
3. Input shortages in Europe probably peaked in Q4 2021.
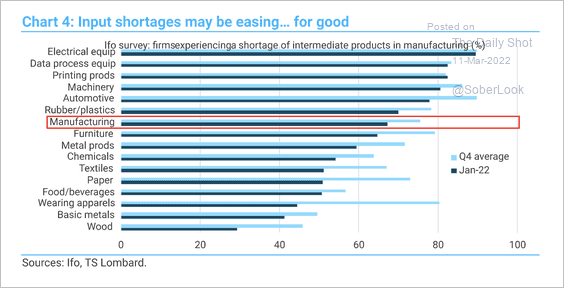 Source: TS Lombard
4. What happens to the GDP if energy imports from Russia stop?
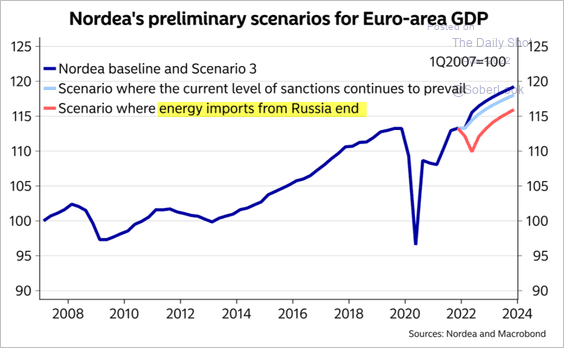 Source: Nordea Markets
Back to Index
Europe
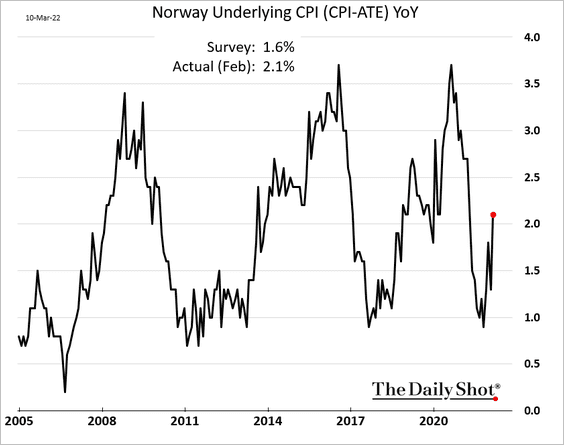
1. Norway’s CPI is rebounding.
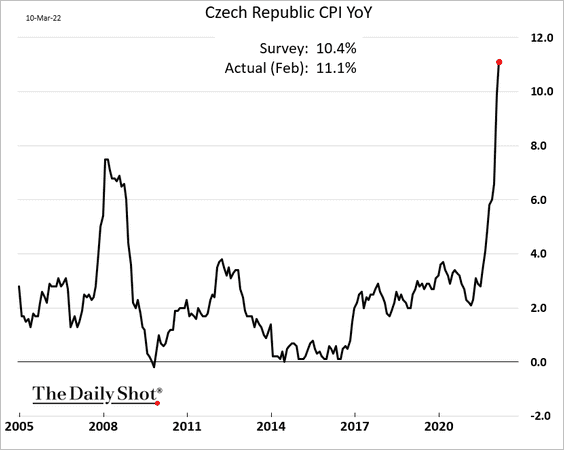
2. Czech inflation climbed above 11%.
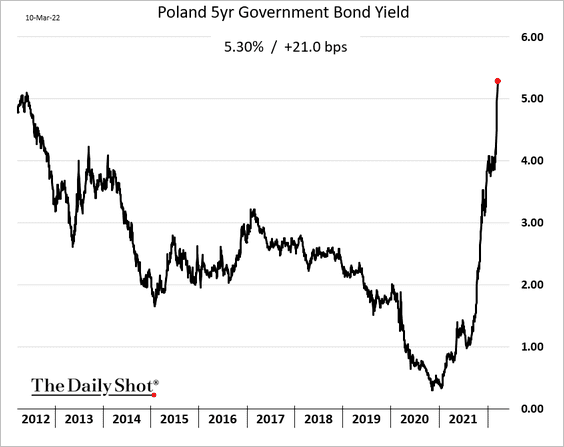
3. Poland’s bond yields continue to surge.
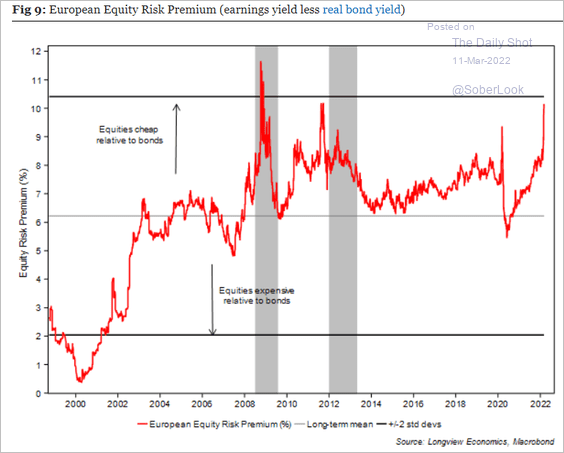
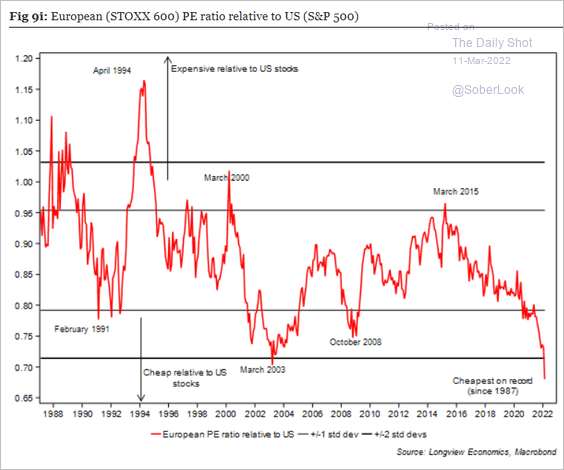
4. European shares look cheap.
• Equity risk premium:
 Source: Longview Economics
• PE ratio vs. the US:
 Source: Longview Economics
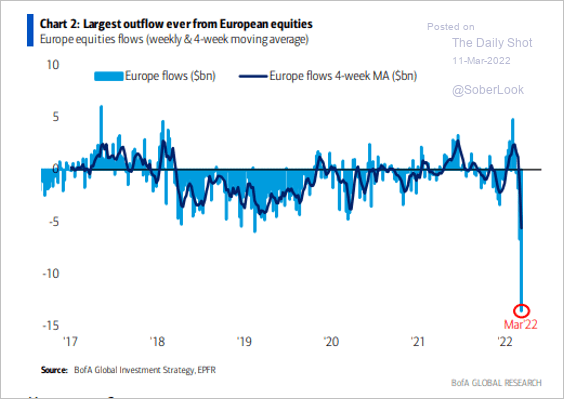
Equity outflows have been severe.
 Source: BofA Global Research; @MikeZaccardi
Back to Index
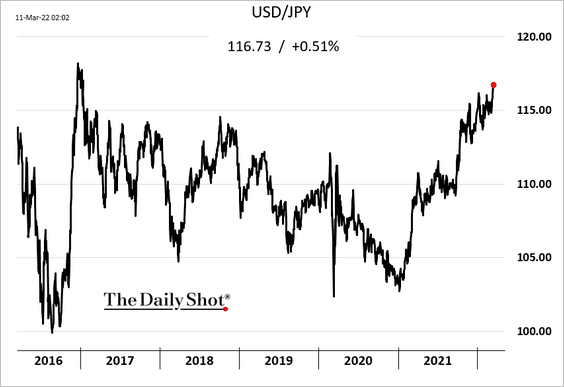
Japan
1. The yen continues to weaken vs. the dollar, hitting a five-year low amid widening yield differentials.
2. Inflation should accelerate once the impact of some temporary factors ebbs.
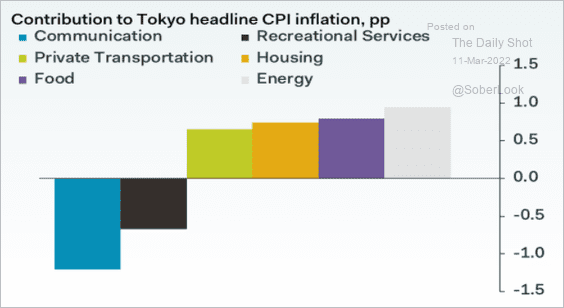 Source: Pantheon Macroeconomics
Back to Index
China
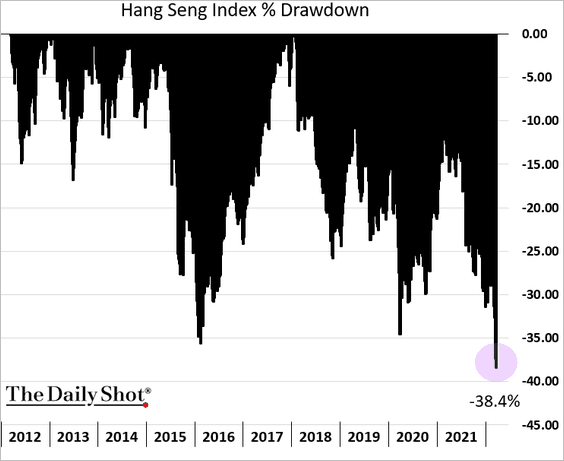
1. Stocks have been under severe pressure, …
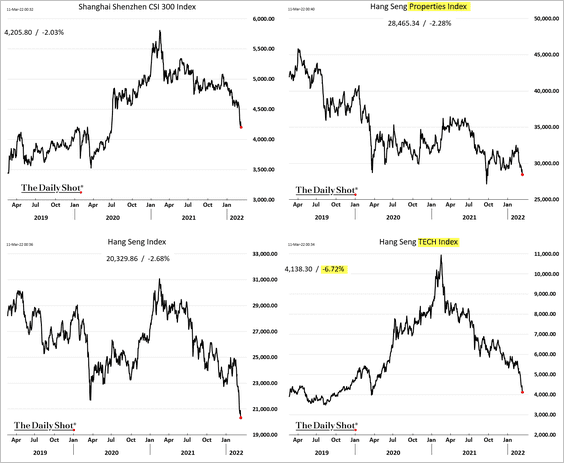
… with the Hang Seng Index drawdown hitting 38%.
——————–
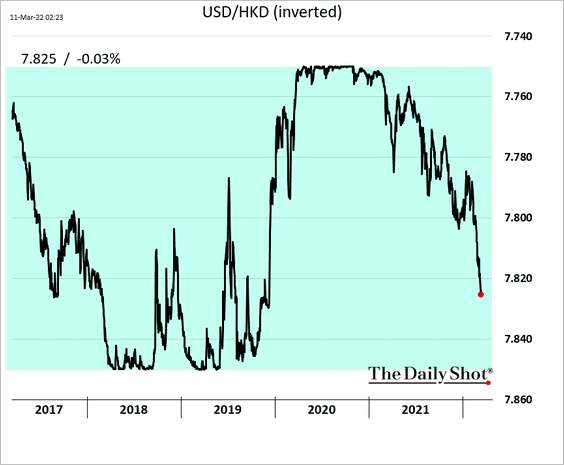
2. The Hong Kong dollar is moving toward the weaker end of its permitted range.
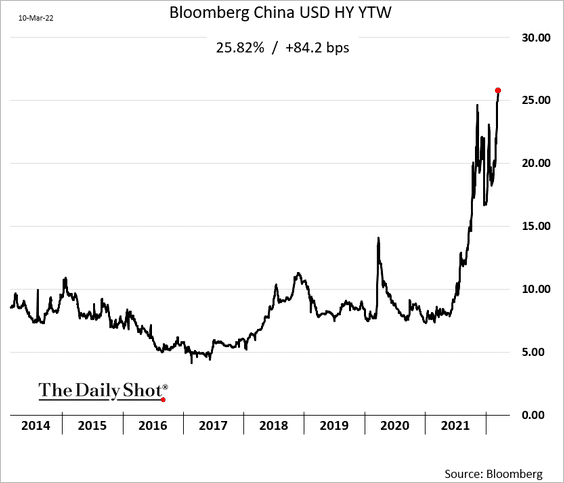
3. Bloomberg’s USD-denominated HY bond index yield is now above 25%.
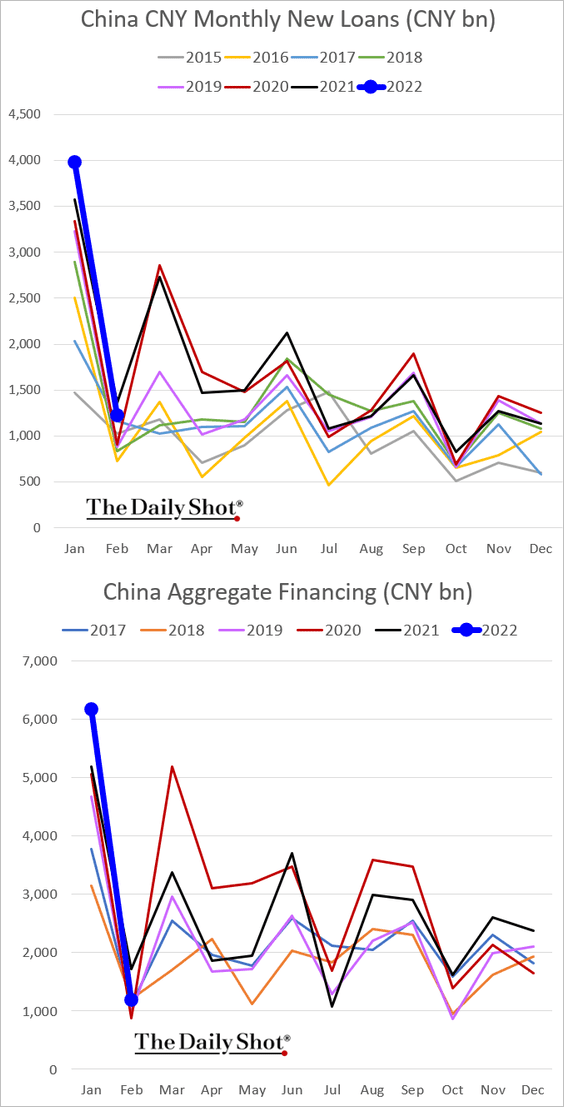
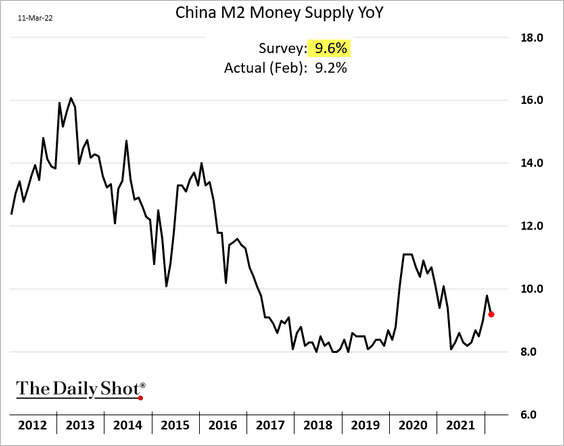
4. Loan growth was weaker than expected in February, although there is quite a bit of seasonal noise this time of the year. Aggregate financing was particularly soft.
• Monthly:
• Cumulative:
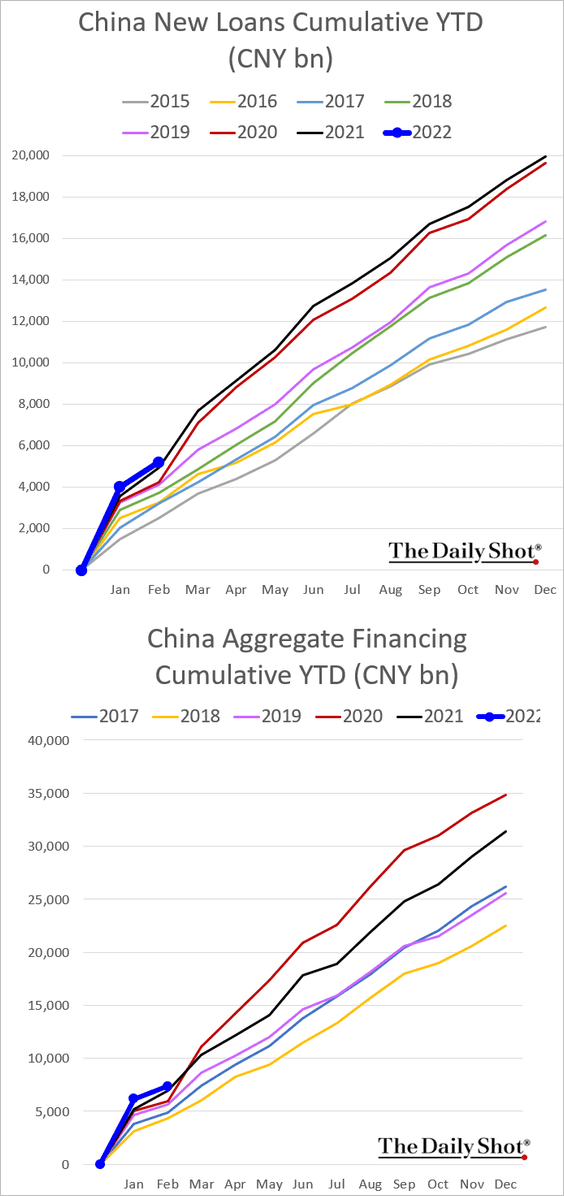
Money supply growth indicators were also lower than expected.
——————–
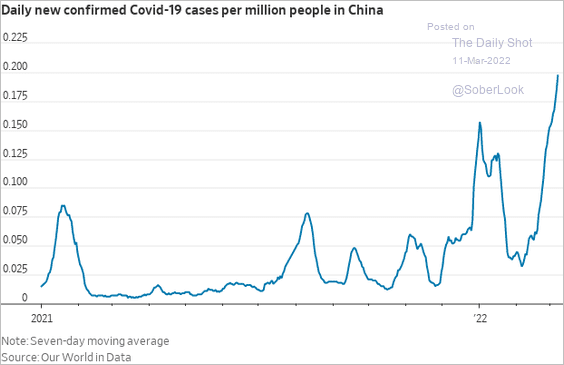
5. Beijing is having difficulties containing omicron.
 Source: @WSJ Read full article
Back to Index
Emerging Markets
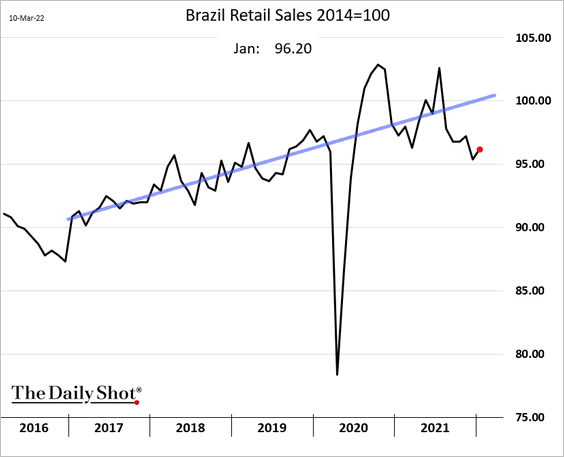
1. Brazil’s retail sales ticked higher in January.
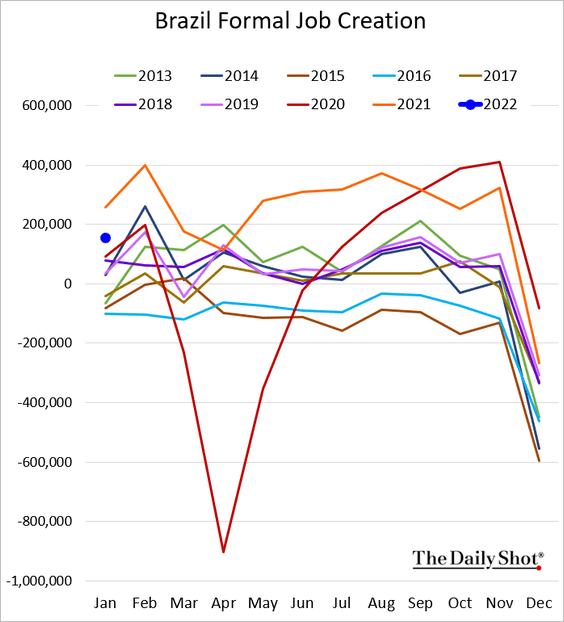
Job creation was lower than expected.
——————–
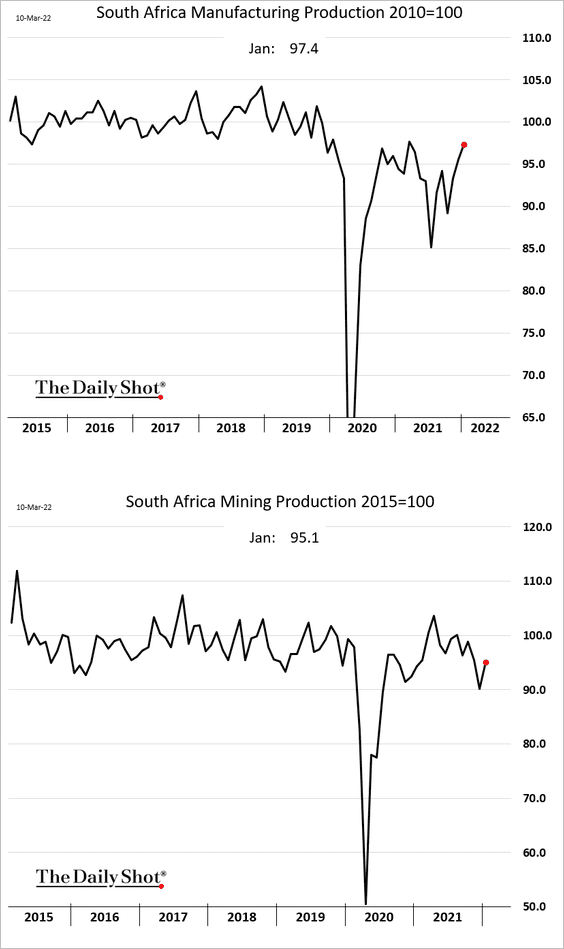
2. South Africa’s industrial production improved in January.
3. India’s equities look expensive relative to China.
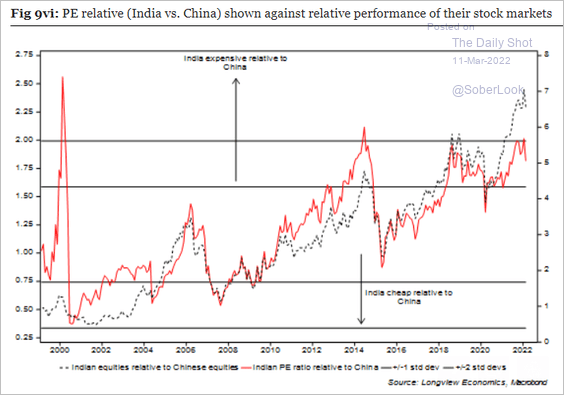 Source: Longview Economics
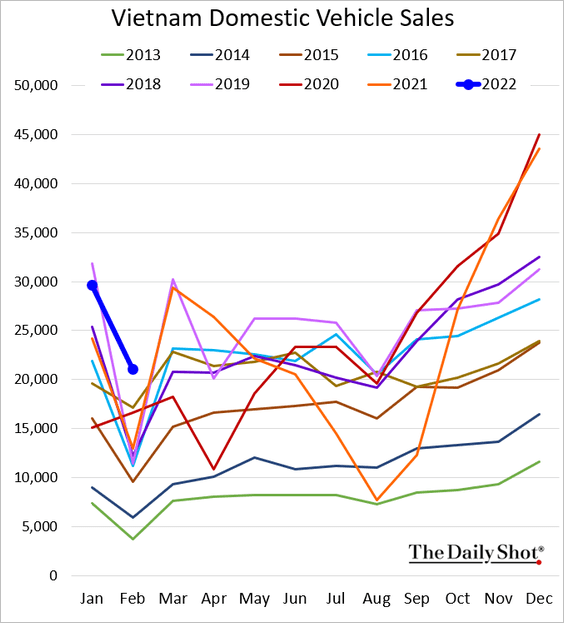
4. Vietnam’s vehicle sales were strong last month.
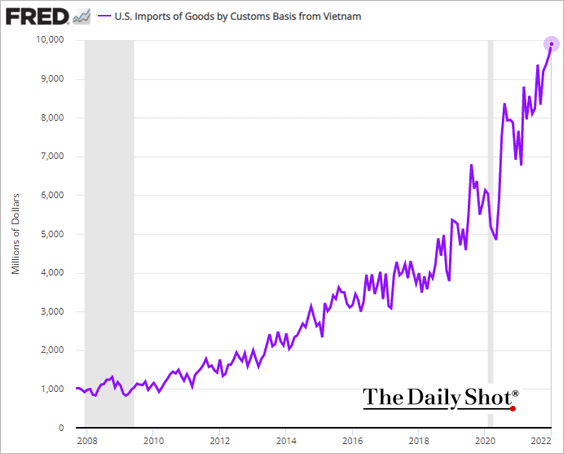
This chart shows US imports from Vietnam.
——————–
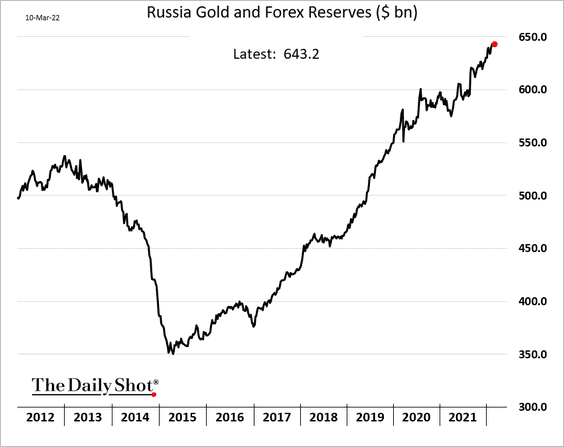
5. Russia reported unchanged forex reserves last week.
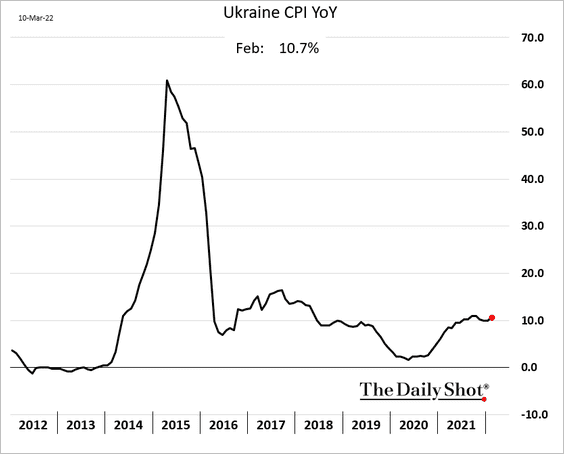
6. Remarkably, Ukraine produced its CPI report on time.
7. LatAm shares could keep outperforming this year.
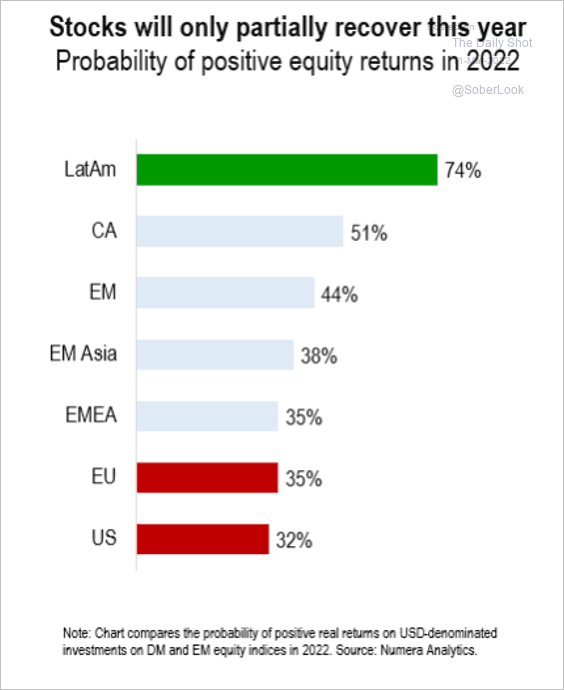 Source: Numera Analytics
Back to Index
Cryptocurrency
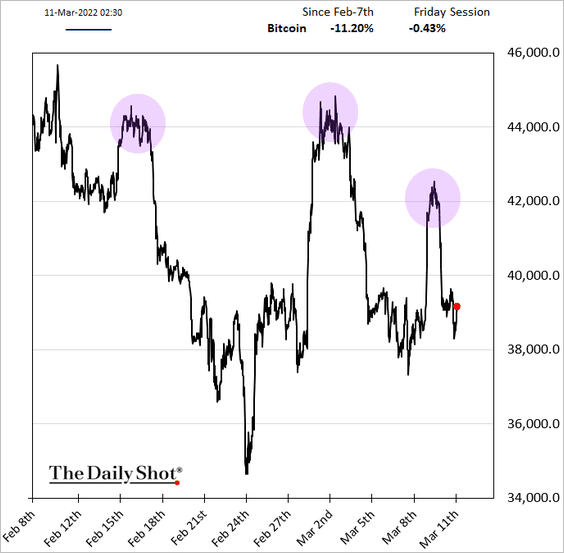
1. Cryptos had a tough week so far.
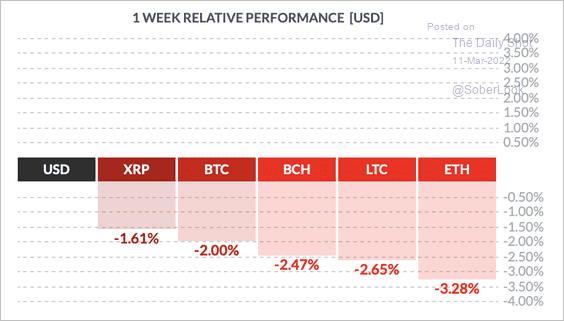 Source: FinViz
The news-driven rallies …
 Source: Reuters Read full article
 Source: MarketWatch Read full article
… are not holding.
——————–
2. Bitcoin’s implied volatility is starting to rise.
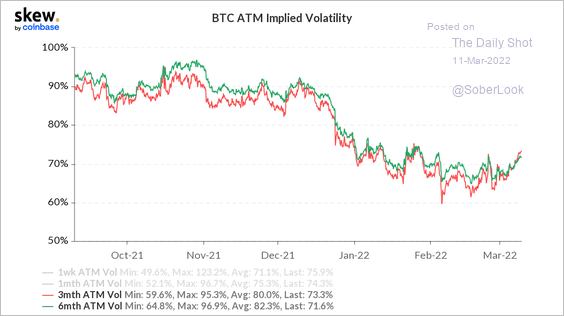 Source: Skew Read full article
3. The decline in bitcoin’s put/call ratio indicates less bearishness among option traders over the past month.
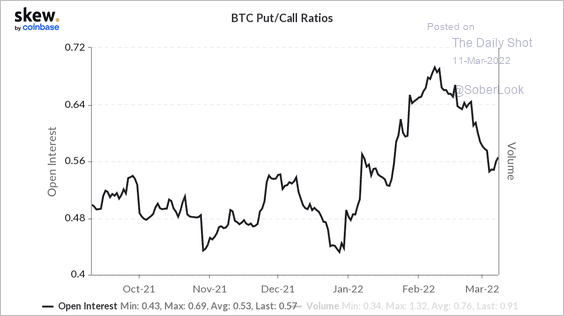 Source: Skew Read full article
4. Crypto assets had the highest Sharpe ratio relative to other assets over the past three years.
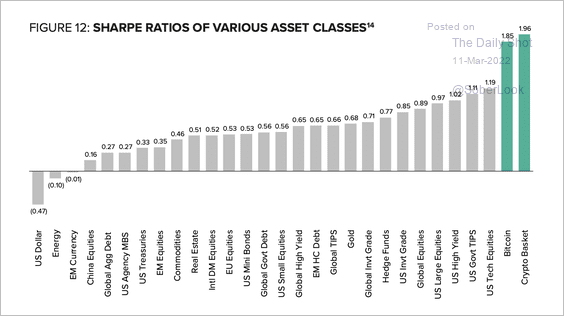 Source: @Grayscale
Still, despite superior returns, an allocation to crypto can produce significant drawdowns, especially during risk-off environments.
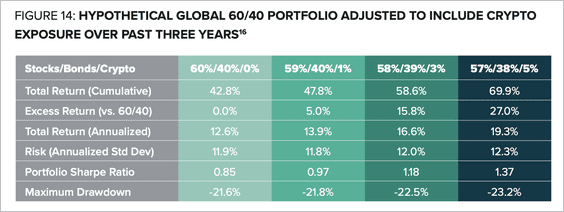 Source: @Grayscale
——————–
5. Bitcoin’s correlation with stocks has risen over the past year, while its correlation with commodities declined toward zero.
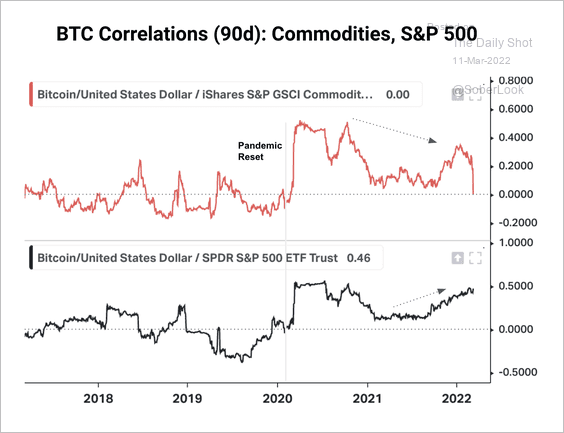 Source: CoinDesk Read full article
6. Here is a look at accumulation/distribution among bitcoin holders.
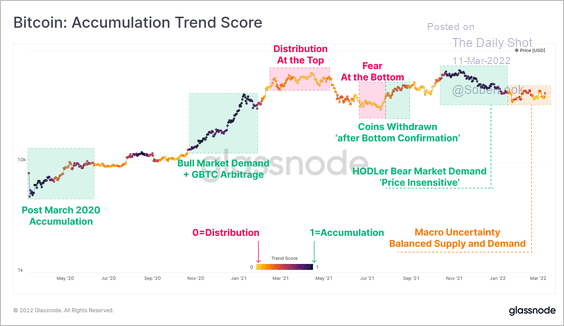 Source: @glassnode
7. Fees paid to miners on the Ethereum network to facilitate transactions (gas fees) are back near previous lows.
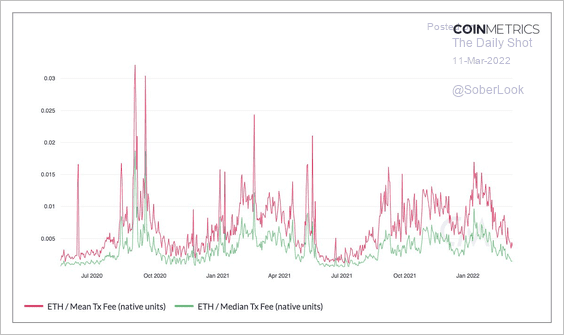 Source: @coinmetrics
8. Russia-based crypto activity remains elevated.
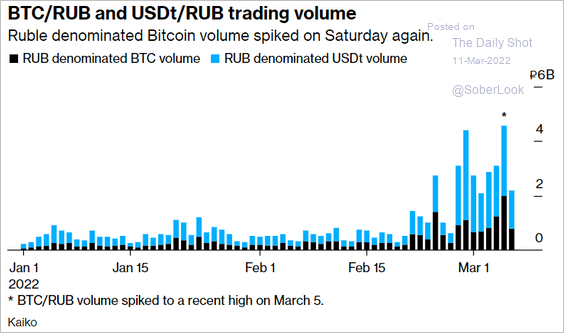 Source: Bloomberg Read full article
Back to Index
Energy
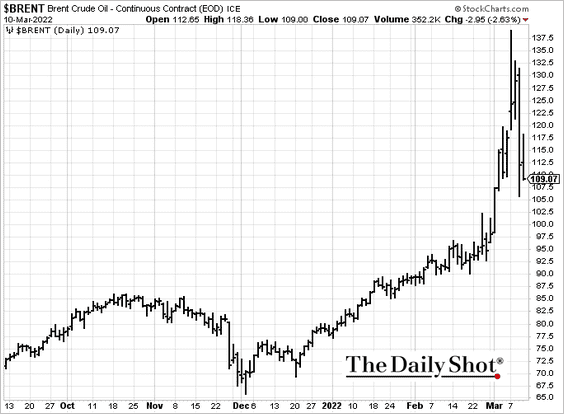
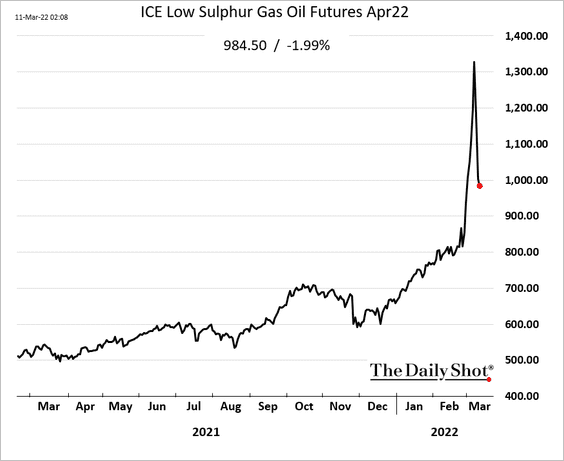
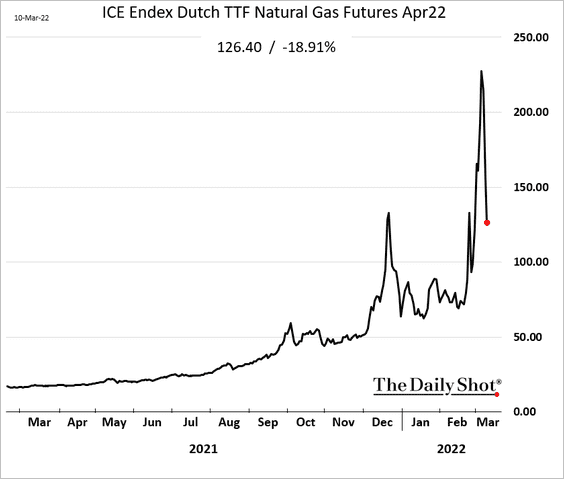
1. Energy markets are well off the highs.
• Brent:
• Diesel (Gasoil is down 25% from the highs):
• European natural gas:
——————–
2. Russia sells oil at a big discount, but it’s important to note that their prices are still much higher than what they got before the war.
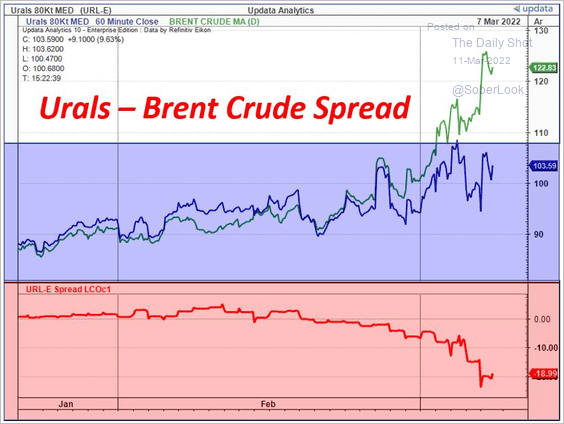 Source: @ChartsToday
3. At what point do we hit demand destruction?
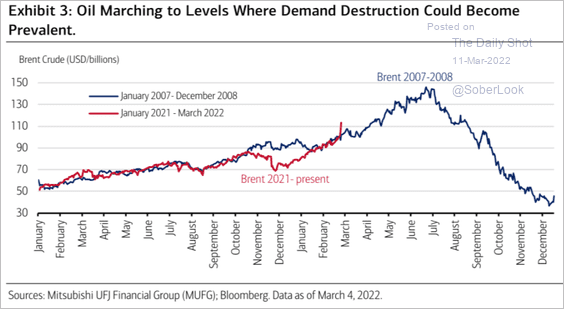 Source: Merrill Lynch, BofA Global Research
4. This chart shows the discrepancy in performance across oil ETFs. The United States Oil Fund (USO) is a significant outlier.
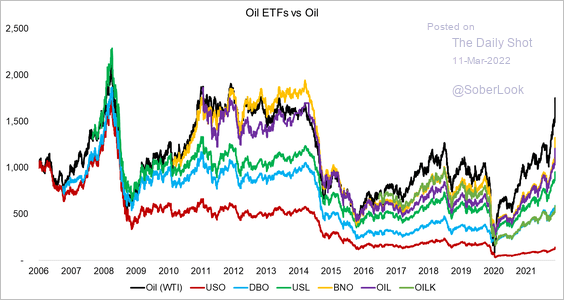 Source: FactorResearch Read full article
5. On average, oil ETFs are more correlated with WTI than Brent.
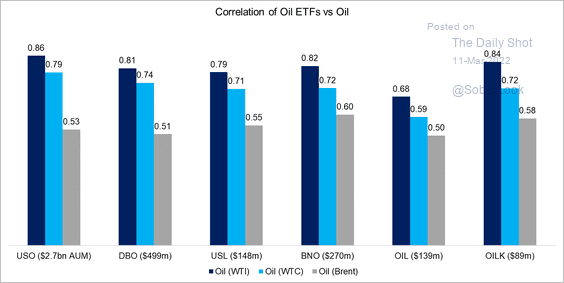 Source: FactorResearch Read full article
6. Uranium prices are surging.
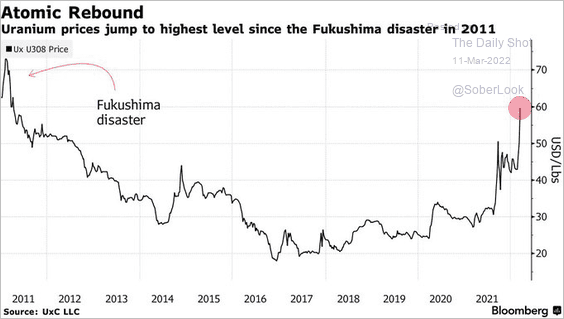 Source: @markets Read full article
Back to Index
Equities
1. How did equity markets perform around World War II?
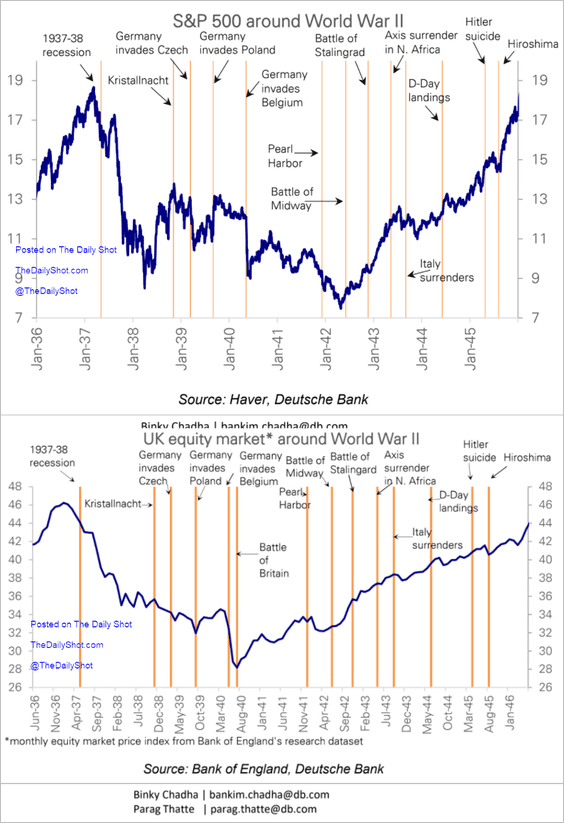 Source: Deutsche Bank Research
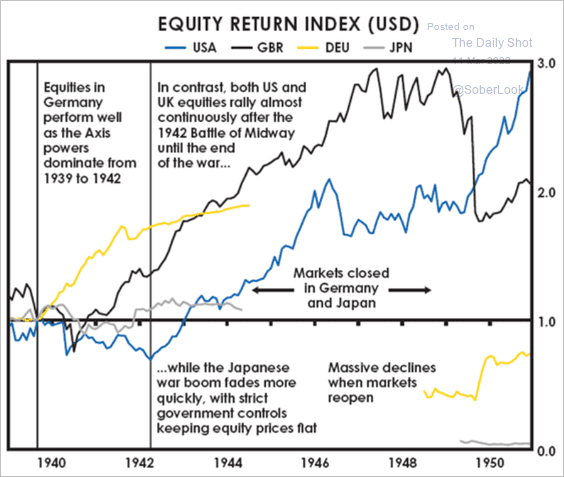 Source: Ray Dalio Read full article
What about during the 1970s oil crisis?
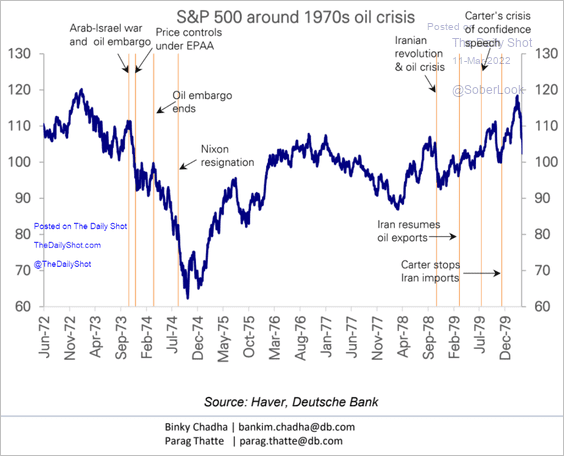 Source: Deutsche Bank Research
——————–
2. The “tech wreck” has been ugly.
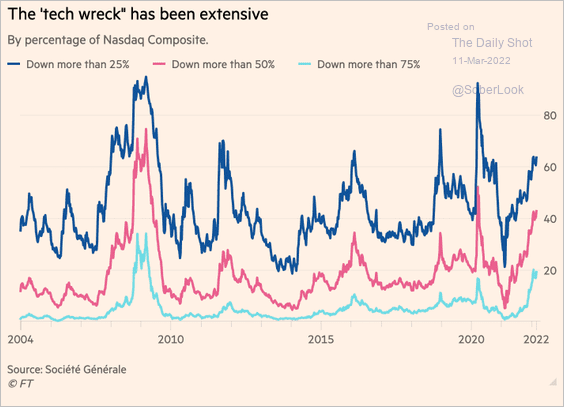 Source: @financialtimes; h/t Walter Read full article
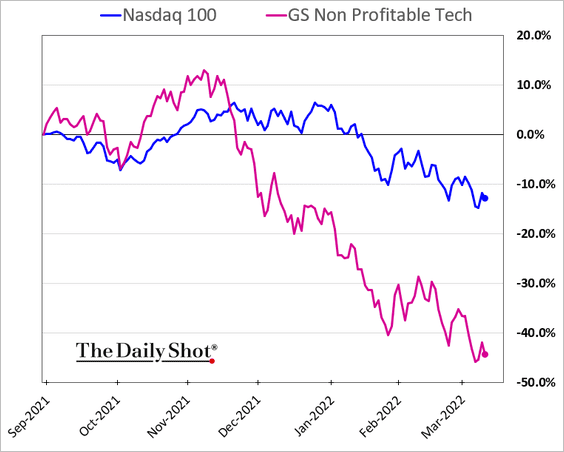
3. Profits are increasingly important in this environment. Non-profitable tech stocks are widening their underperformance.
4. Equity risk premium suggests that stocks are attractive.
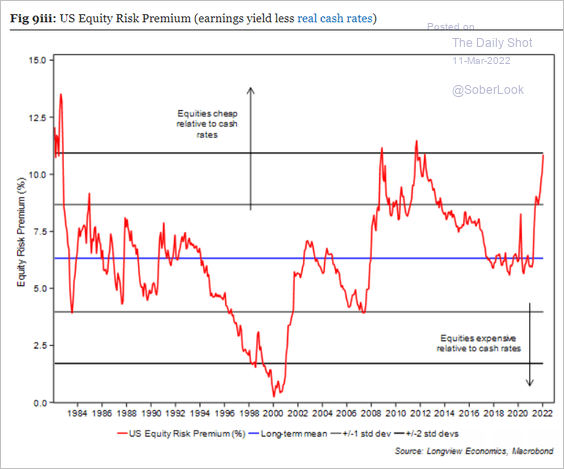 Source: Longview Economics
5. The value/growth relative performance tracks commodity cycles.
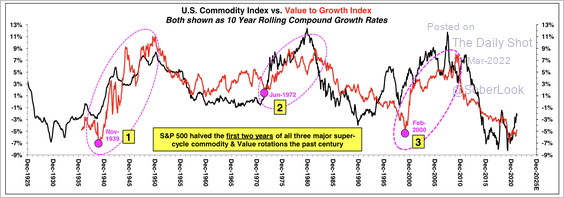 Source: Stifel
6. The market depth of S&P 500 futures has been deteriorating.
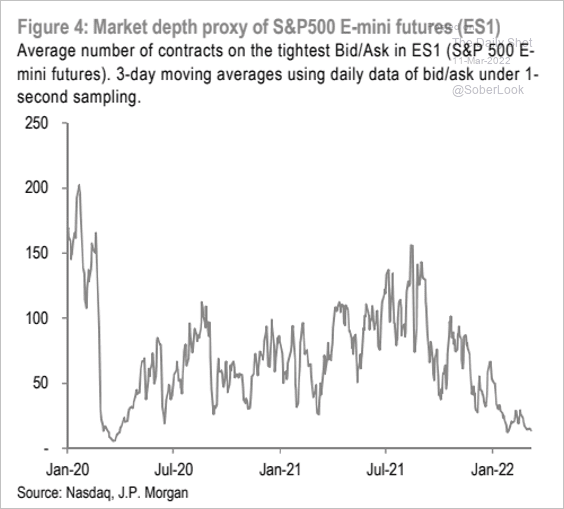 Source: JP Morgan Research; @themarketear
7. Open market purchases by corporate insiders for companies in the SPDR Tech ETF (XLK) are at an extreme.
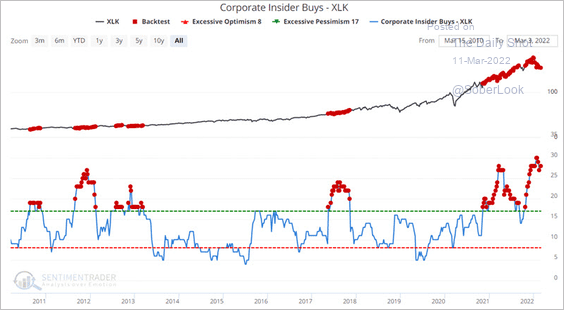 Source: SentimenTrader
8. The materials sector saw massive inflows this month.
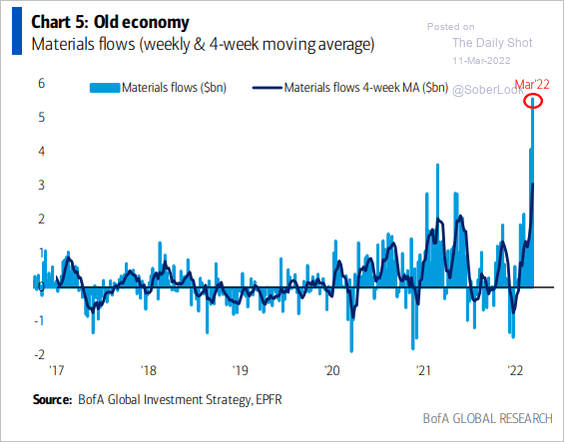 Source: BofA Global Research; @MikeZaccardi
Back to Index
Credit
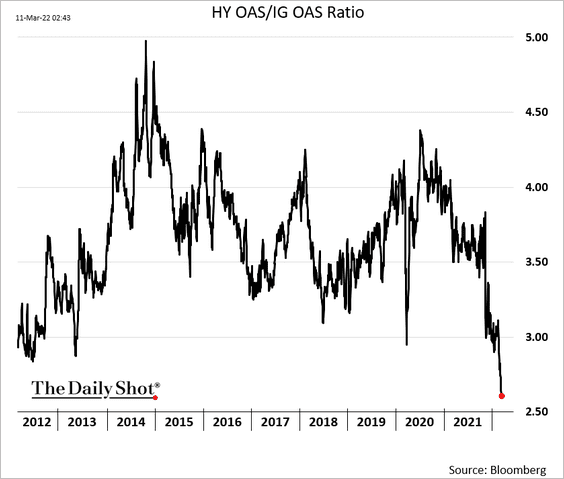
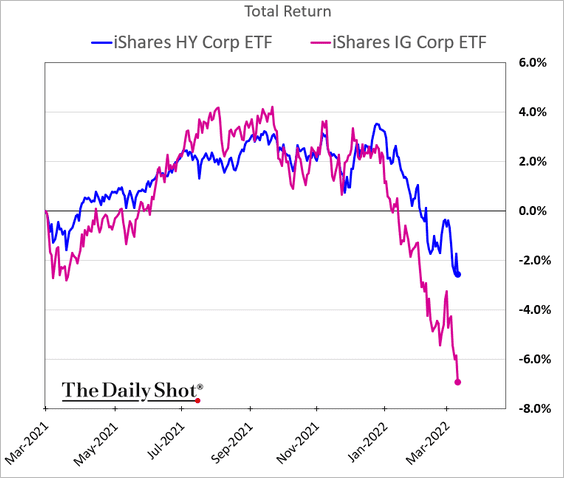
1. Boosted by strong energy prices, …
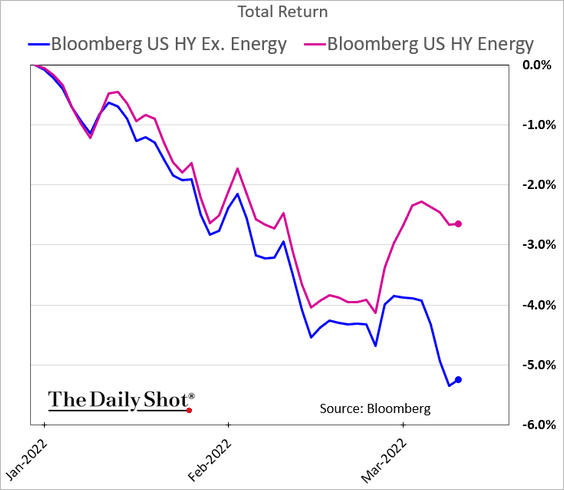 h/t @LivRaiReports
… US high-yield debt continues to outperform investment-grade.
• HY/IG spread ratio:
• Bond prices:
——————–
2. US high-yield is also outperforming European HY bonds.
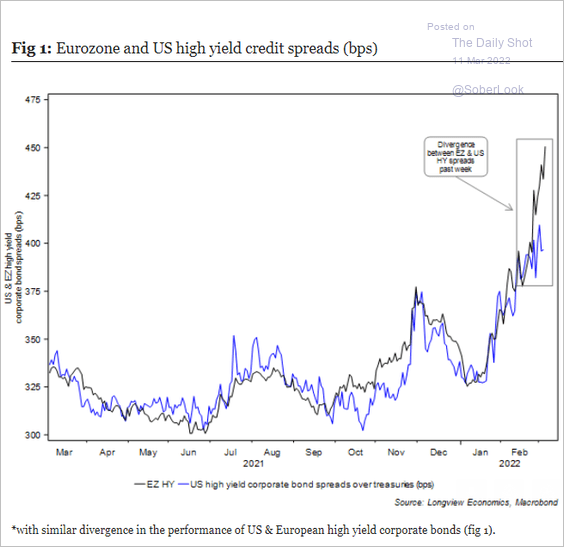 Source: Longview Economics
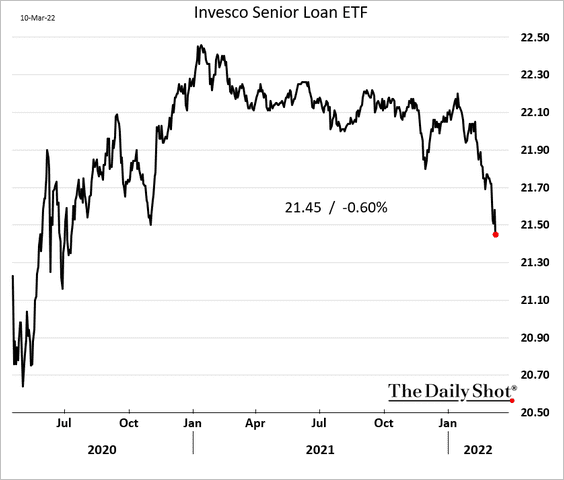
3. Leveraged loans have been under pressure.
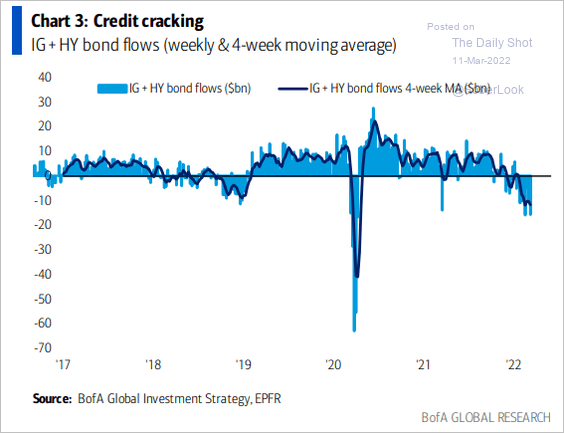
4. Corporate credit continues to see fund outflows.
 Source: BofA Global Research; @MikeZaccardi
Back to Index
Rates
1. Long-term inflation expectations have decoupled from crude oil.
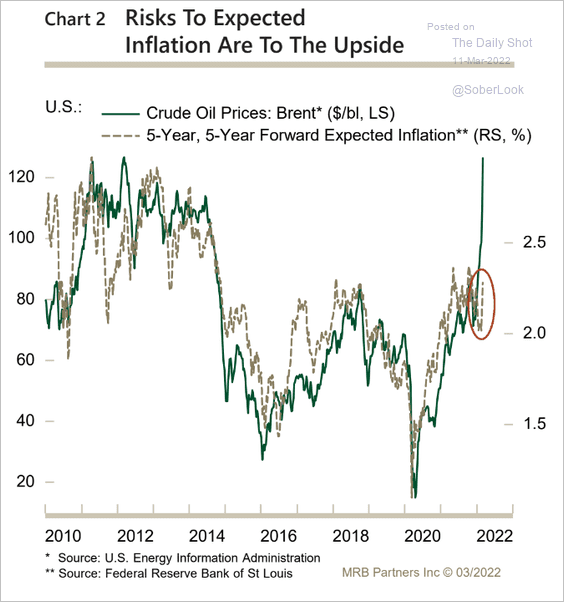 Source: MRB Partners
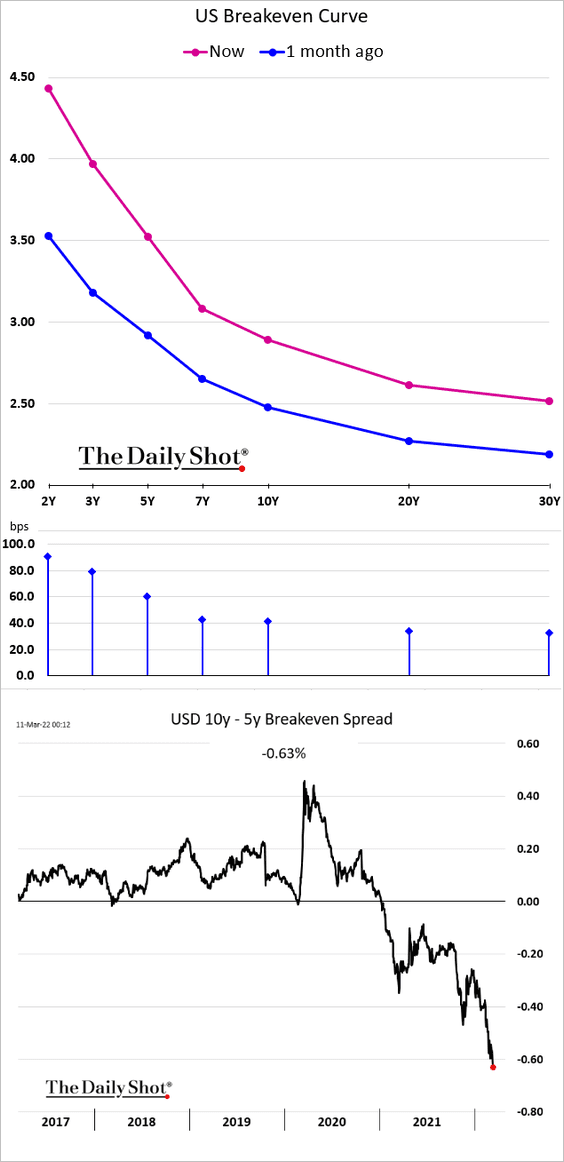
2. The market-based inflation expectations curve (breakeven) continues to invert.
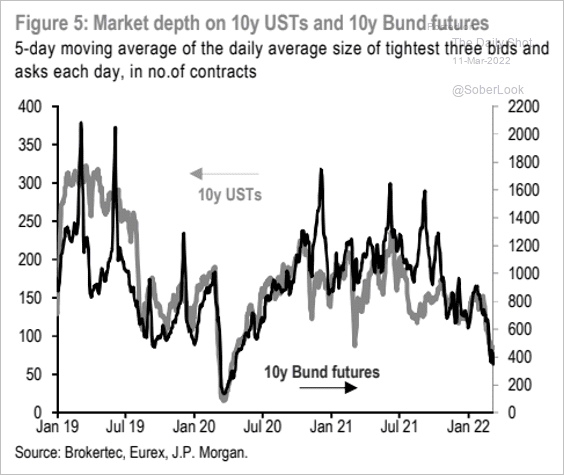
3. Market depth for Treasuries and Bunds has deteriorated this year.
 Source: JP Morgan Research; @themarketear
——————–
Food for Thought
1. QR code usage:
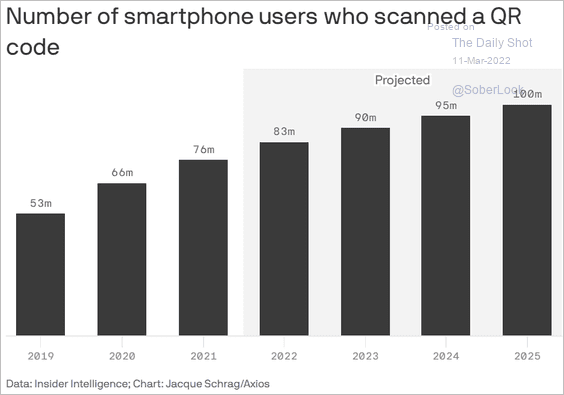 Source: @axios Read full article
2. Internet access by income range:
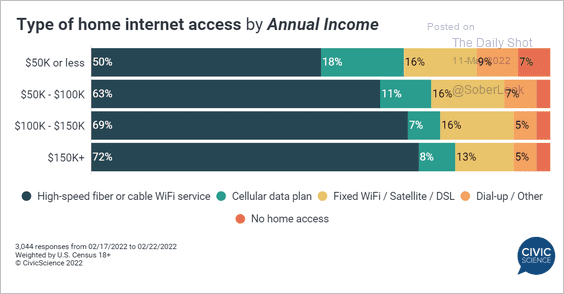 Source: @CivicScience
3. Winter Olympics participation by gender:
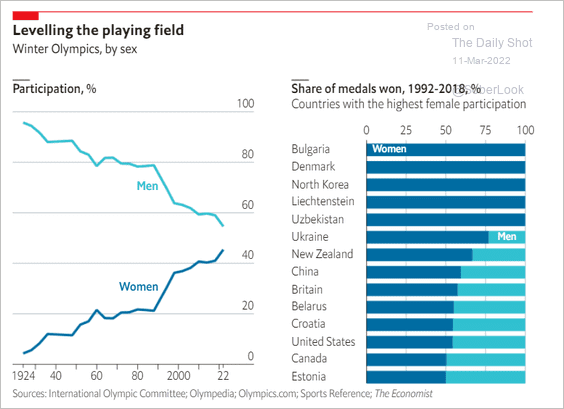 Source: The Economist Read full article
4. Public trust in various groups:
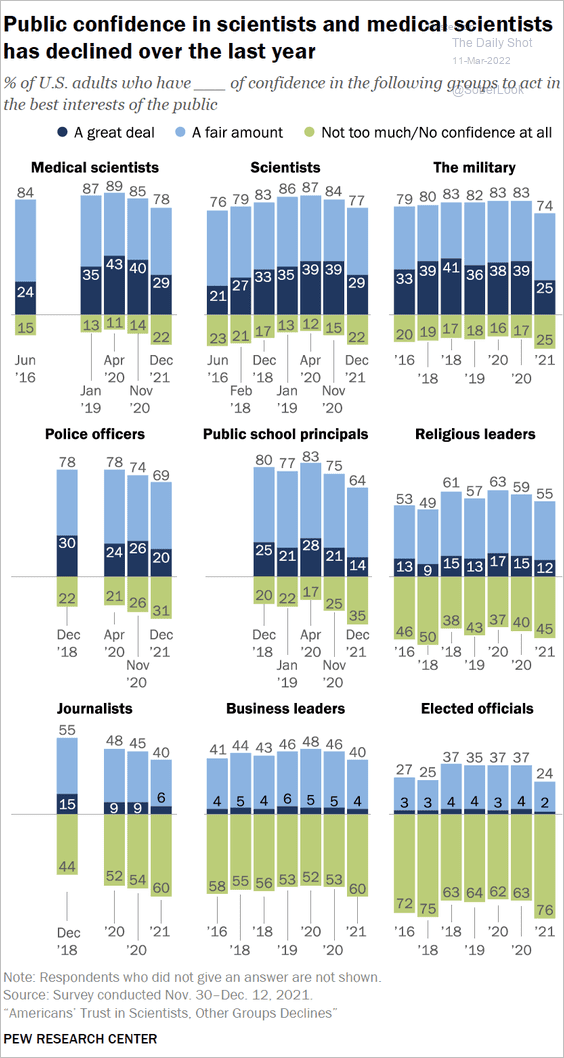 Source: Pew Research Center Read full article
5. Pedestrian traffic fatalities:
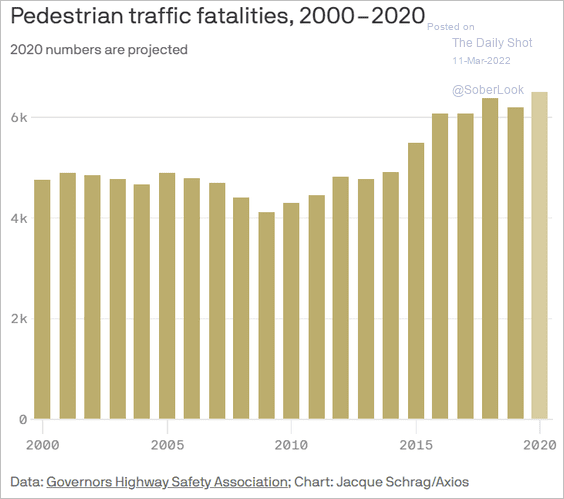 Source: @axios Read full article
6. Russia’s fourth financial crisis in 25 years:
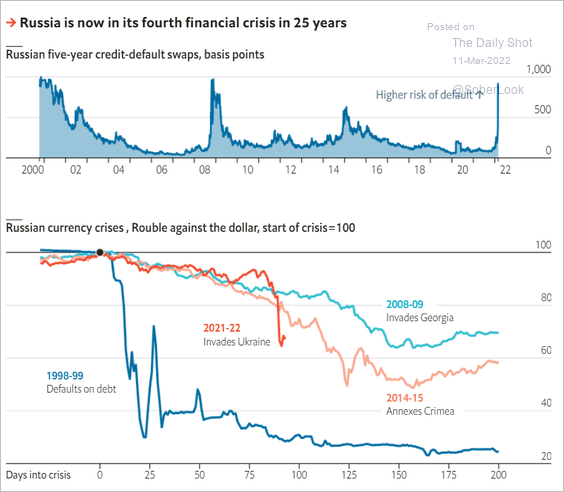 Source: The Economist Read full article
7. Loneliness at school:
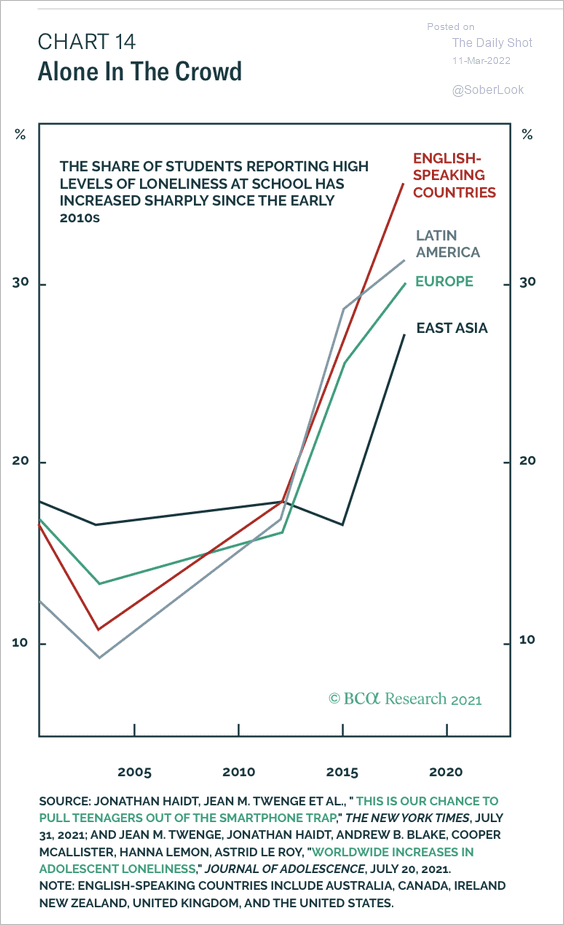 Source: BCA Research
8. Babysitting rates:
 Source: @axios Read full article
——————–
Have a great weekend!
Back to Index