
The Daily Shot: 12-Jun-23
• The United States
• Canada
• The Eurozone
• Europe
• Japan
• China
• Emerging Markets
• Cryptocurrency
• Commodities
• Equities
• Credit
• Global Developments
• Food for Thought
The United States
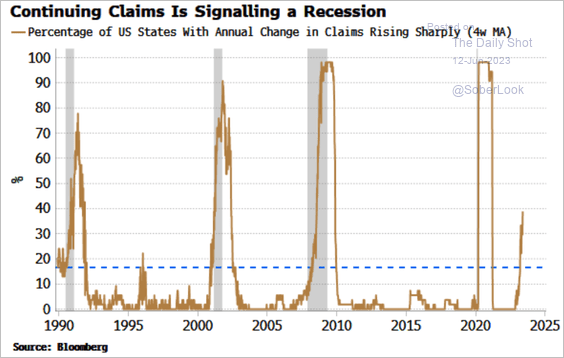
1. Let’s begin with the labor market.
• A growing number of states are reporting an increase in continuing jobless claims.
 Source: Simon White, Bloomberg Markets Live Blog
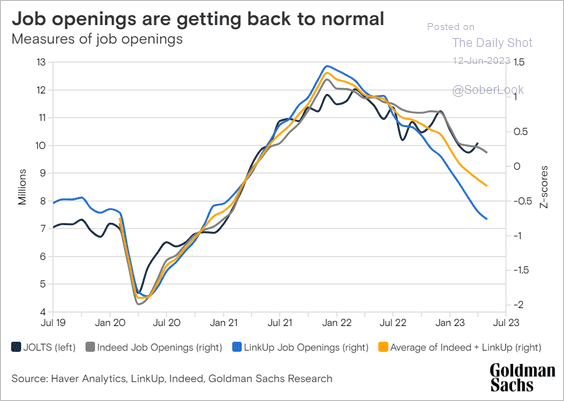
• Labor demand indicators continue to ease.
 Source: Goldman Sachs
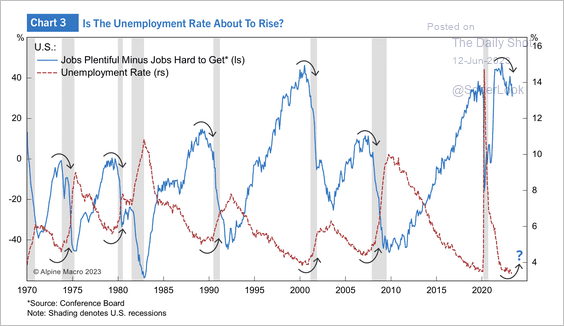
• The ratio of job openings/jobs hard to get is narrowing, which typically portends a rise in the unemployment rate and the beginning of a recession.
 Source: Alpine Macro
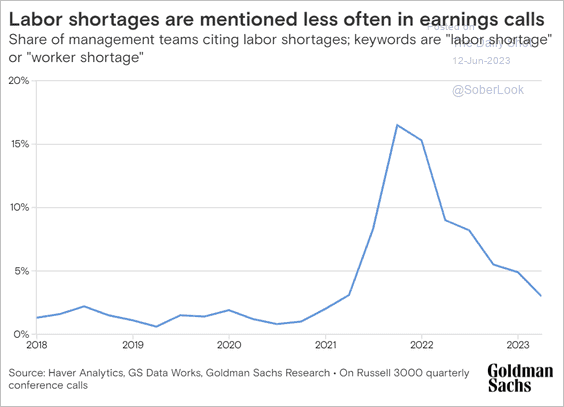
• This chart shows the percentage of companies mentioning “labor/worker shortage” on earnings calls.
 Source: Goldman Sachs
• Tight credit poses risks for the labor market.
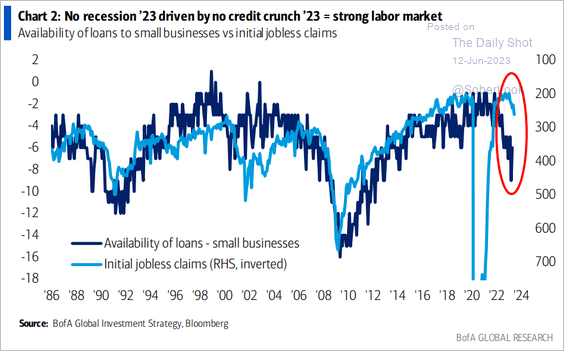 Source: BofA Global Research
——————–
2. Productivity growth has been softening.
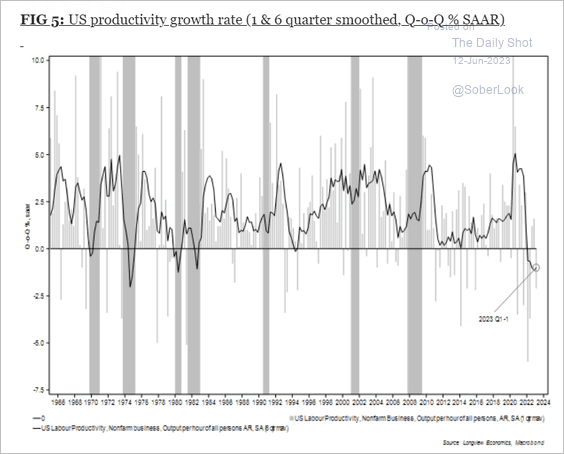 Source: TS Lombard
3. Here is a look at disposable personal income and consumer spending by income quartile.
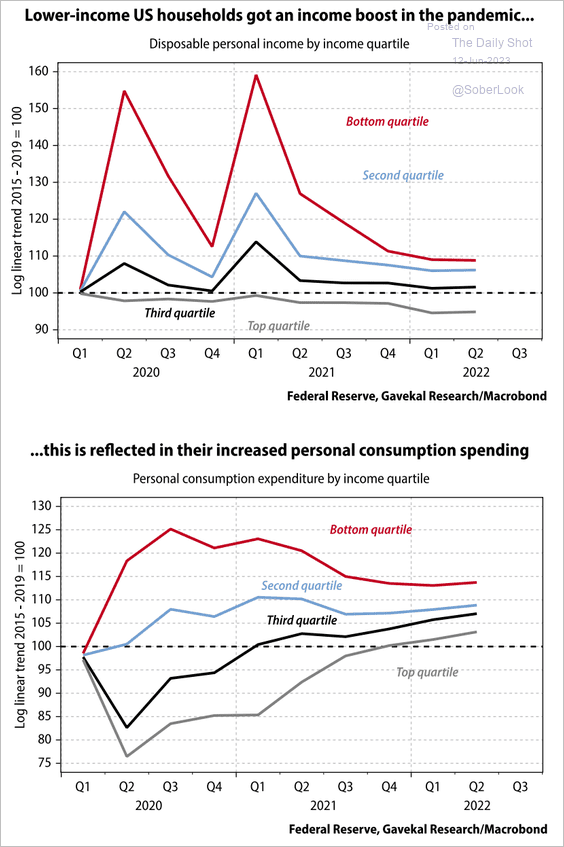 Source: Gavekal Research
• Household savings remain well above pre-pandemic levels.
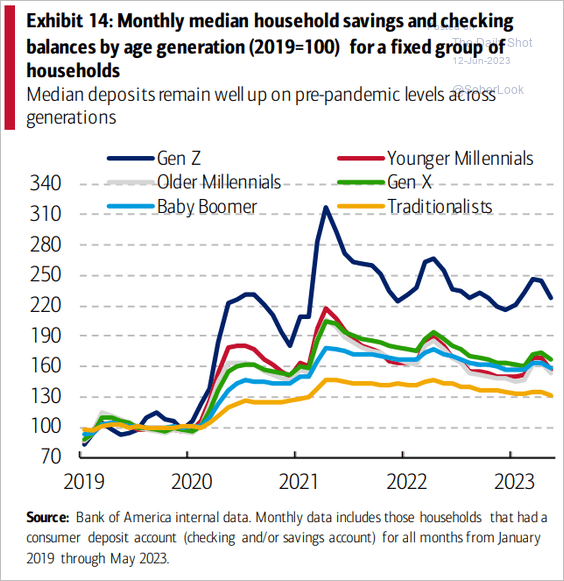 Source: BofA Global Research
• Debit and credit card spending bounced in May, according to BofA.
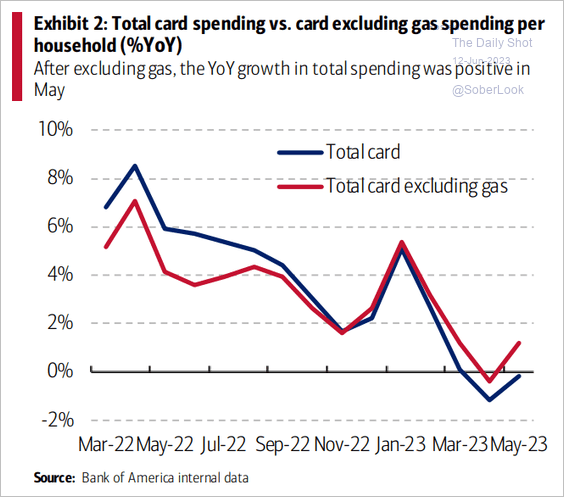 Source: BofA Global Research
——————–
4. Wells Fargo sees one more rate hike from the Fed.
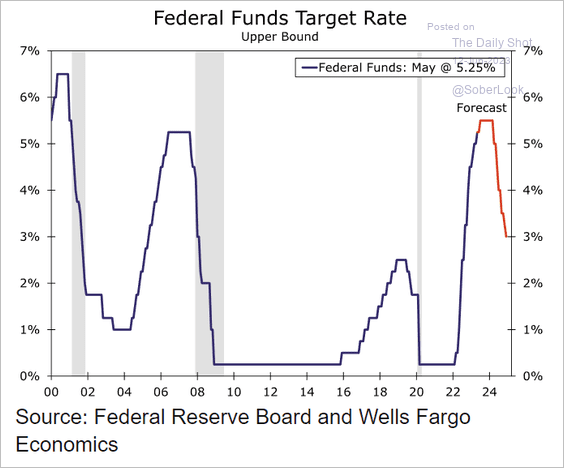 Source: Wells Fargo Securities
• The market now expects the Fed to complete its rate cuts near 3.5% (in H2 2025).
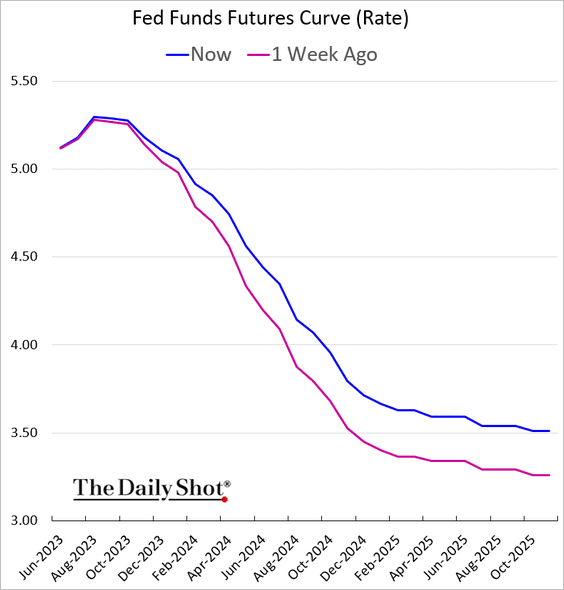
Nomura, however, sees the Fed taking the policy rate down to around 2%.
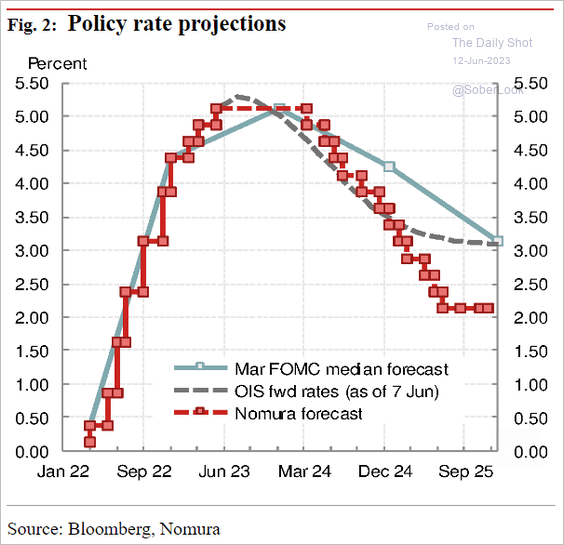 Source: Nomura Securities
• Here are some scenarios and expected market reactions for this week’s FOMC decision.
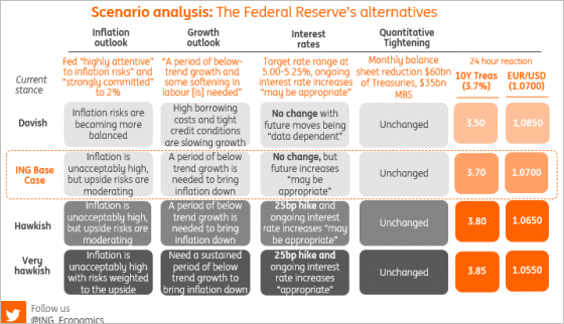 Source: ING
Back to Index
Canada
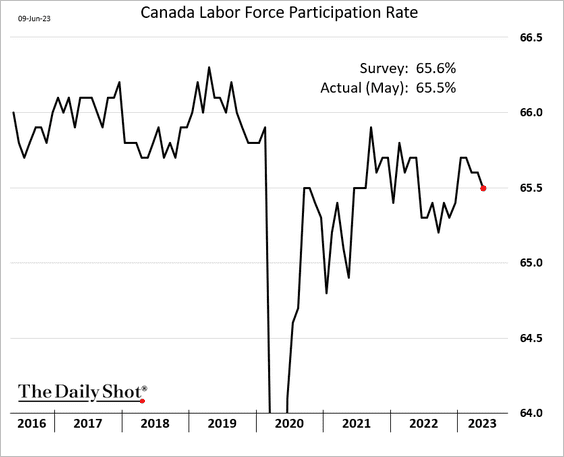
1. The employment report unexpectedly showed job losses in May.
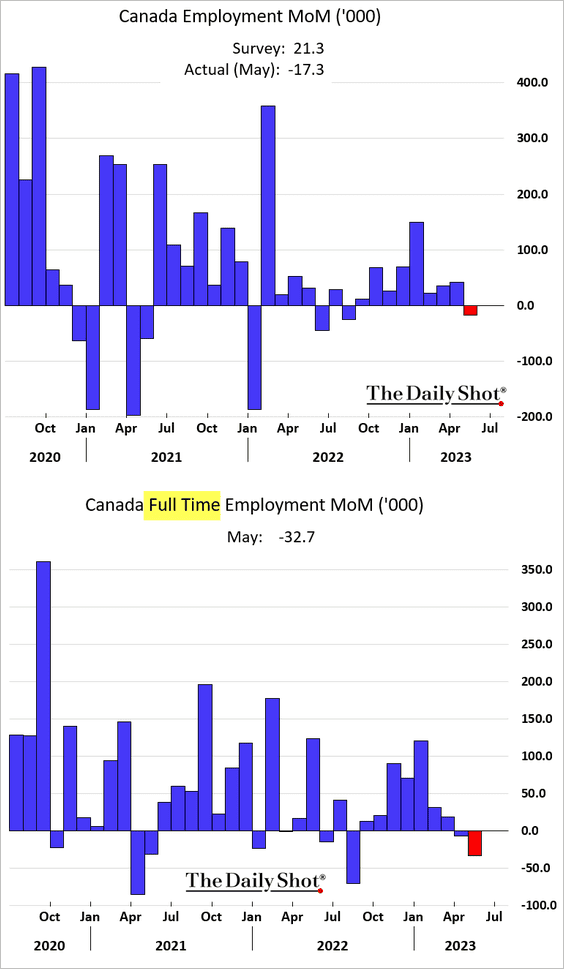
• The unemployment rate increased.
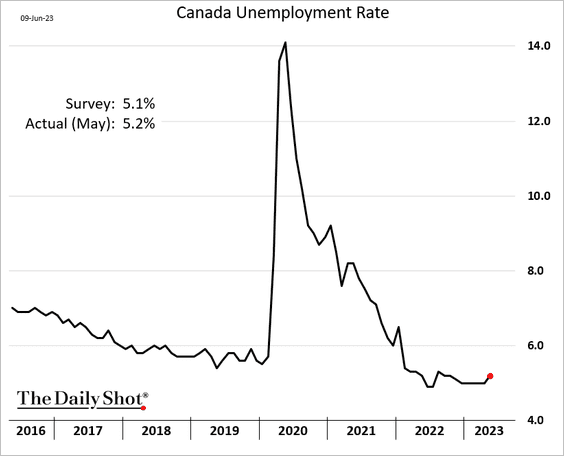
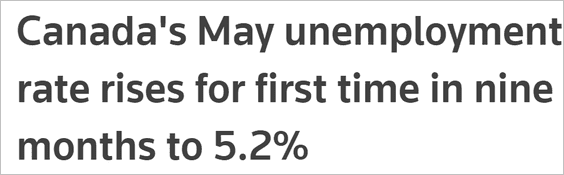 Source: Reuters Read full article
• Labor force participation eased.
• However, job openings remain elevated.
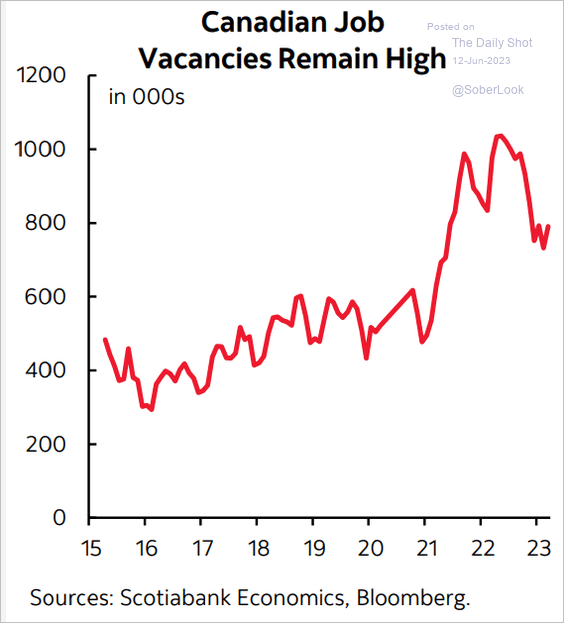 Source: Scotiabank Economics
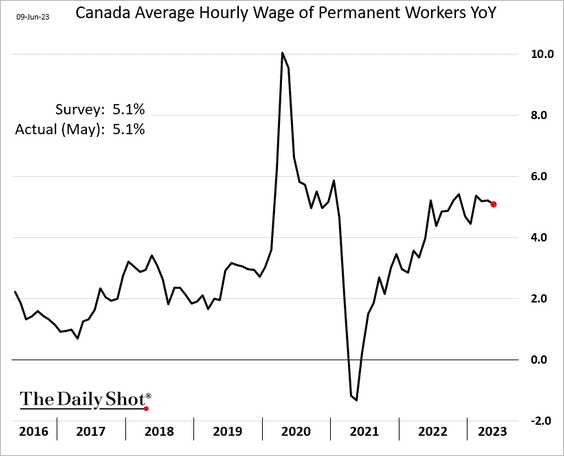
And so is wage growth.
——————–
2. USD/CAD is at support.
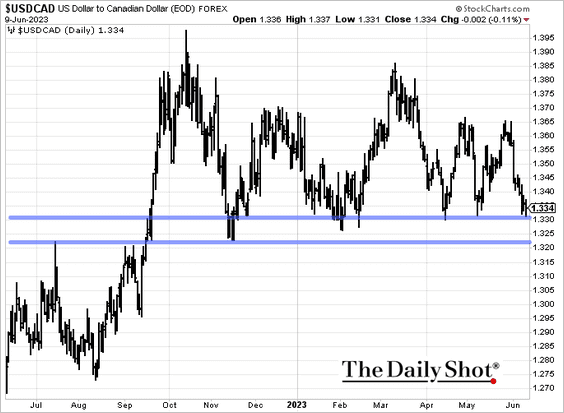
• USD/CAD has deviated far above fair value, according to Alpine Macro’s cyclical model.
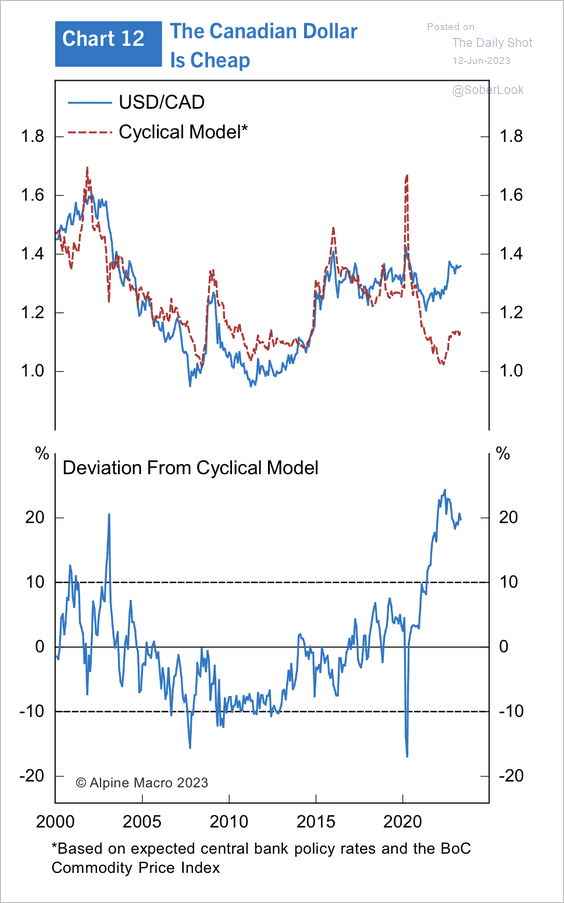 Source: BNN Bloomberg Read full article
• The loonie’s vol-adjusted carry looks attractive.
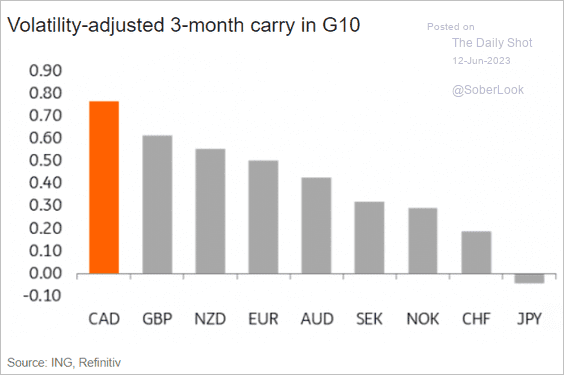 Source: ING
——————–
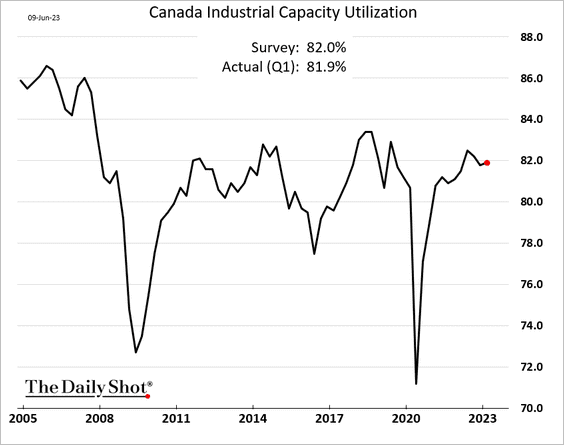
3. Capacity utilization held steady in Q1.
Back to Index
The Eurozone
1. Italian industrial production weakened further in April.
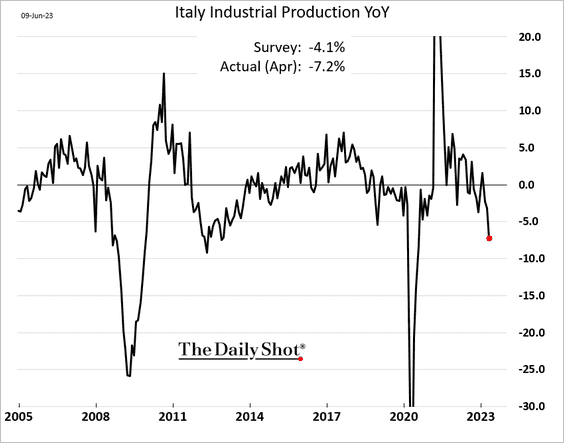
 Source: ING Read full article
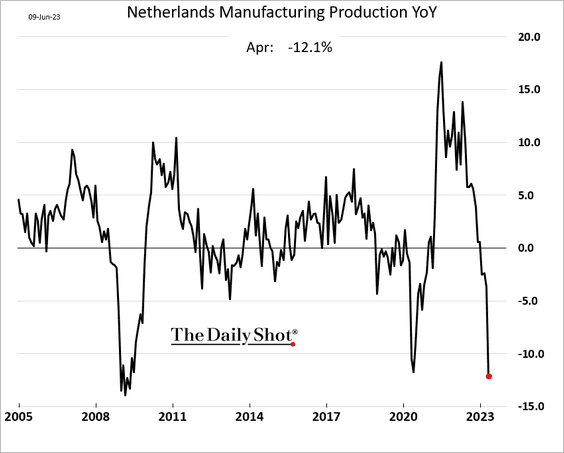
2. The Netherlands reported its largest year-over-year drop in manufacturing output since the GFC.
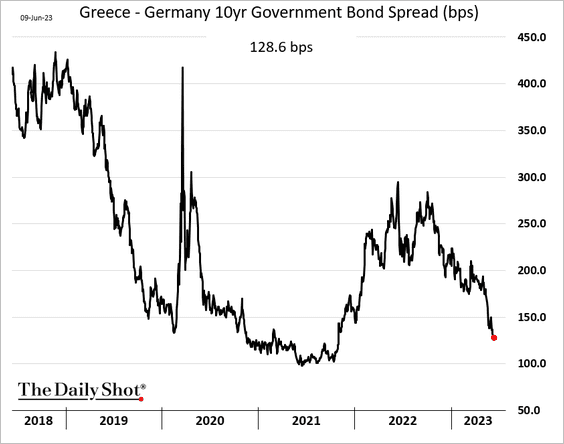
3. Greek government bond spreads continue to tighten.
4. Slower wage growth ahead?
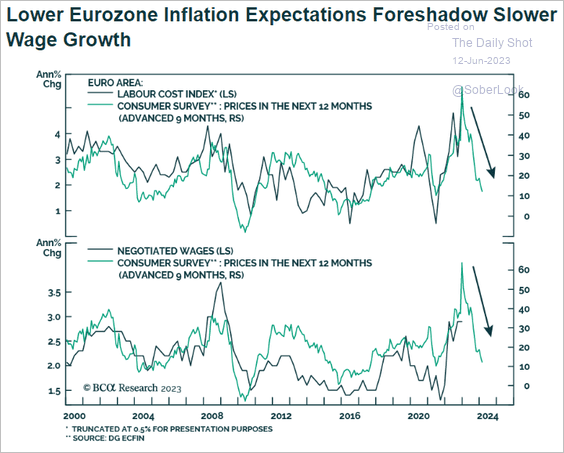 Source: BCA Research
Back to Index
Europe
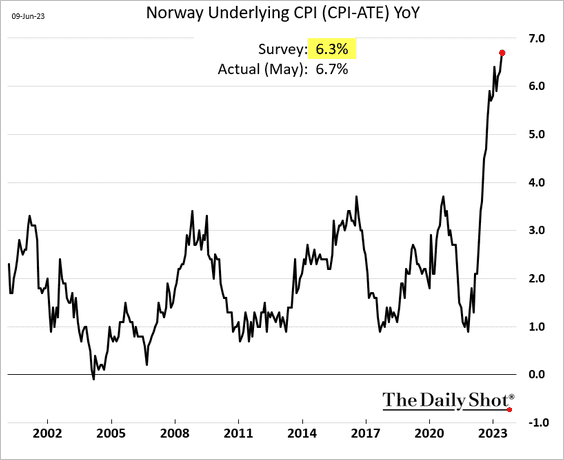
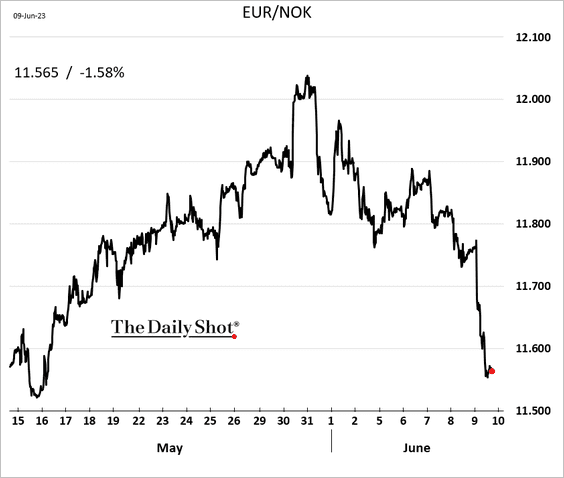
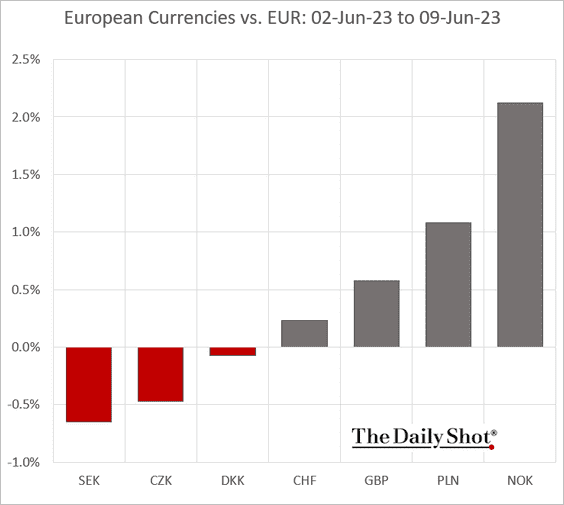
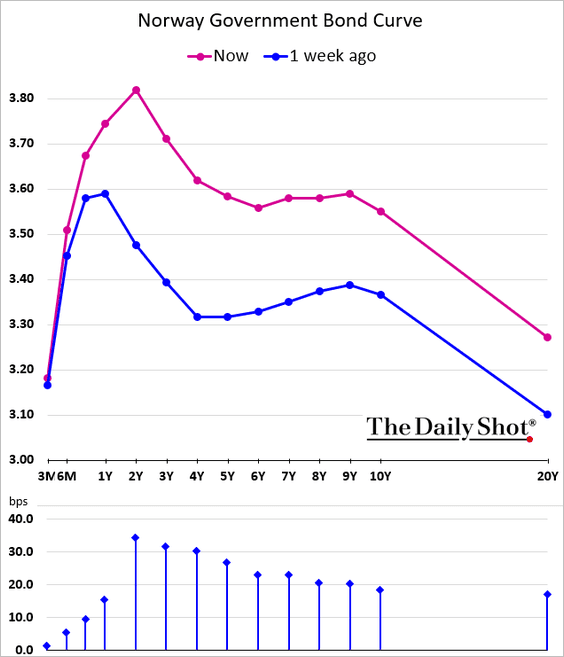
1. Norway’s CPI report was a shocker.
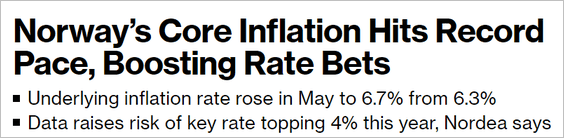 Source: @ottummelas, @economics Read full article
• The krone and bond yields surged.
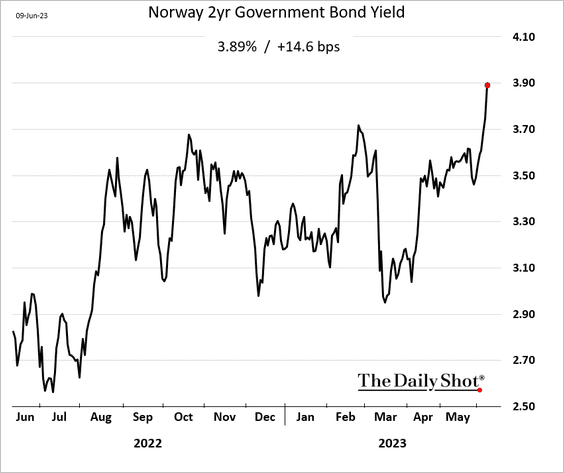
Here is the yield curve.
——————–
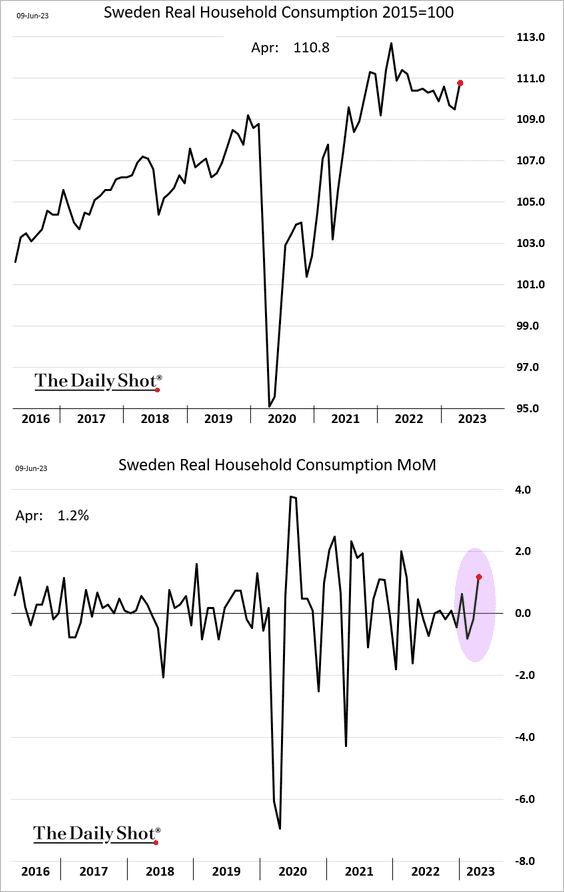
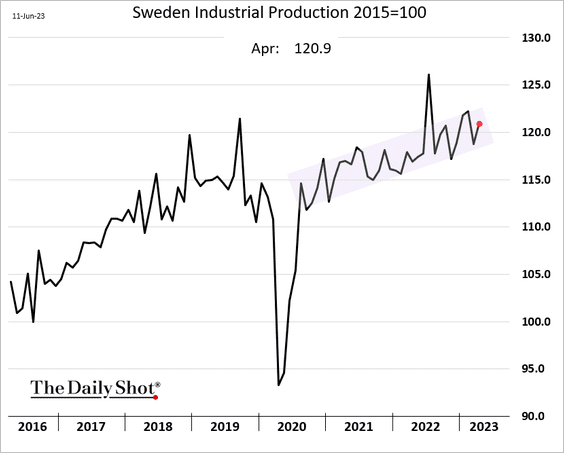
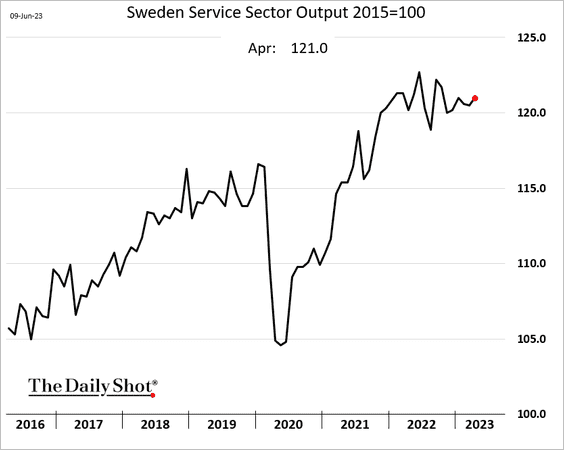
2. Sweden’s economic indicators improved in April.
• Consumer spending:
• Industrial production:
• Services output:
——————–
3. European shares’ discount to the US has widened.
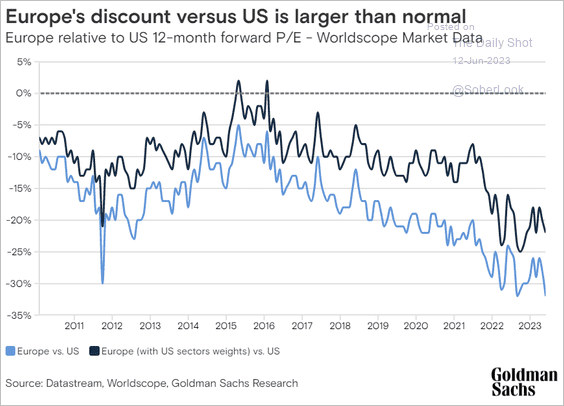 Source: Goldman Sachs
4. This chart shows public-sector employment as a share of total employment in select economies.
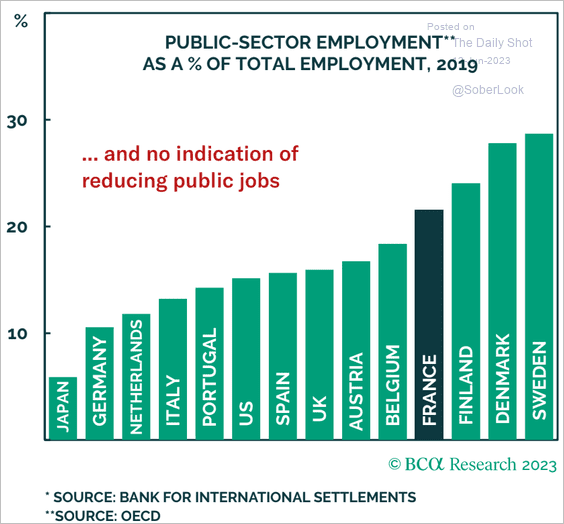 Source: BCA Research
Back to Index
Japan
1. Japan’s inflation has broadened.
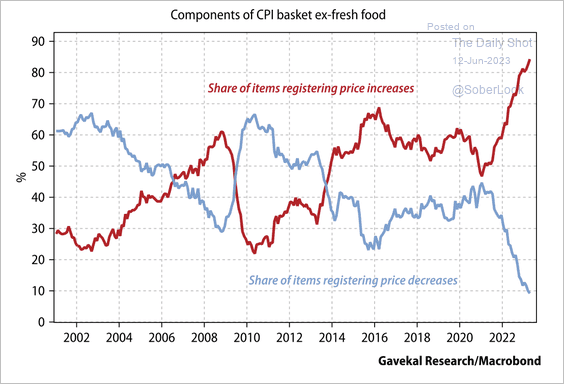 Source: Gavekal Research
However, government-directed cuts in cell phone charges weighed on CPI for most of last year.
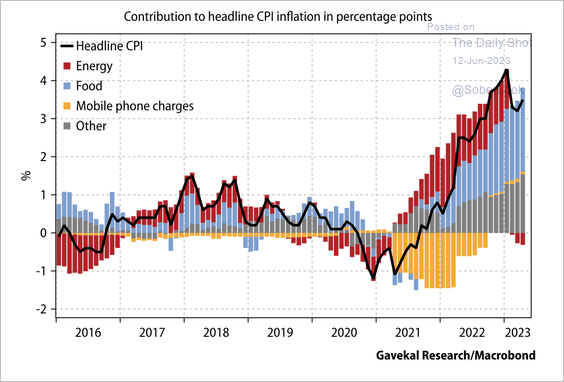 Source: Gavekal Research
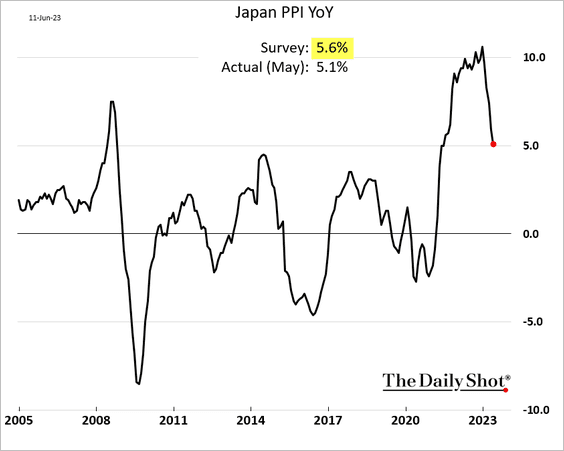
2. The PPI surprised to the downside.
Back to Index
China
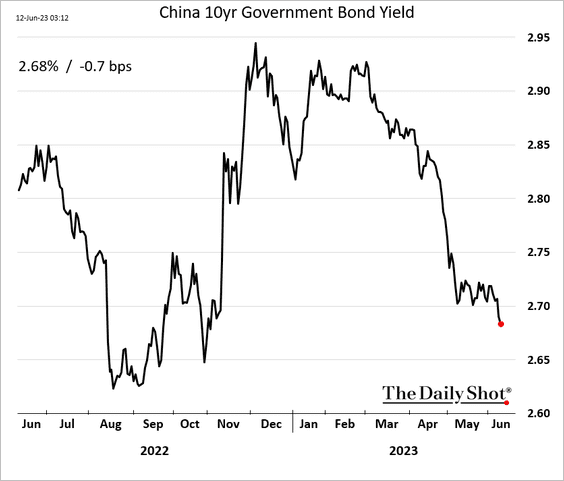
1. Bond yields continue to trend lower.
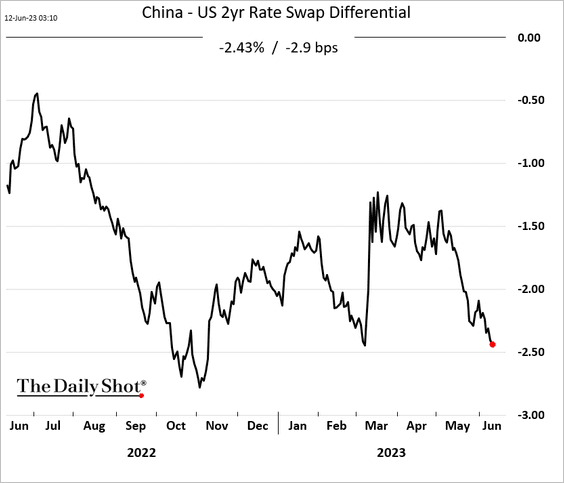
• Rate differentials keep moving in favor of the US dollar.
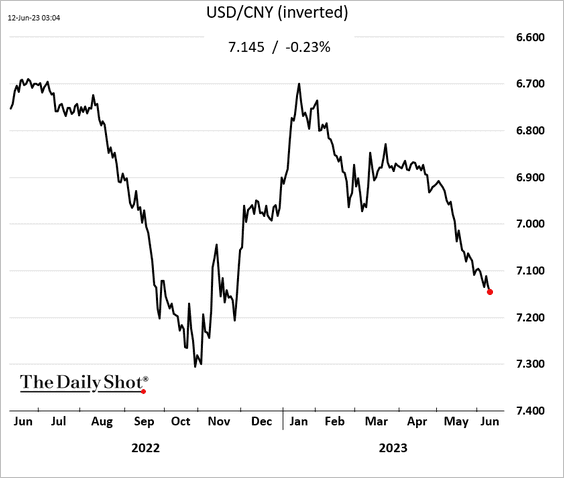
• The renminbi continues to weaken.
——————–
2. Finacial conditions have eased substantially.
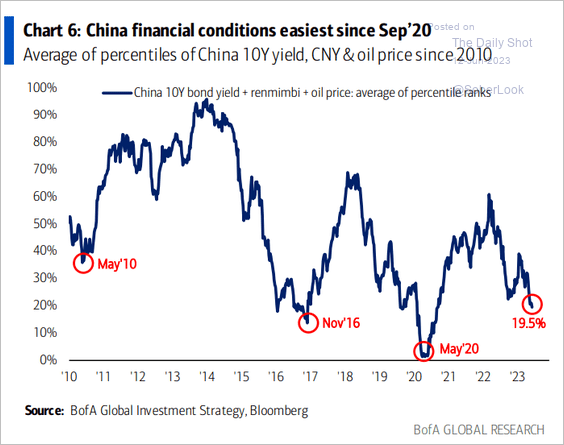 Source: BofA Global Research
Back to Index
Emerging Markets
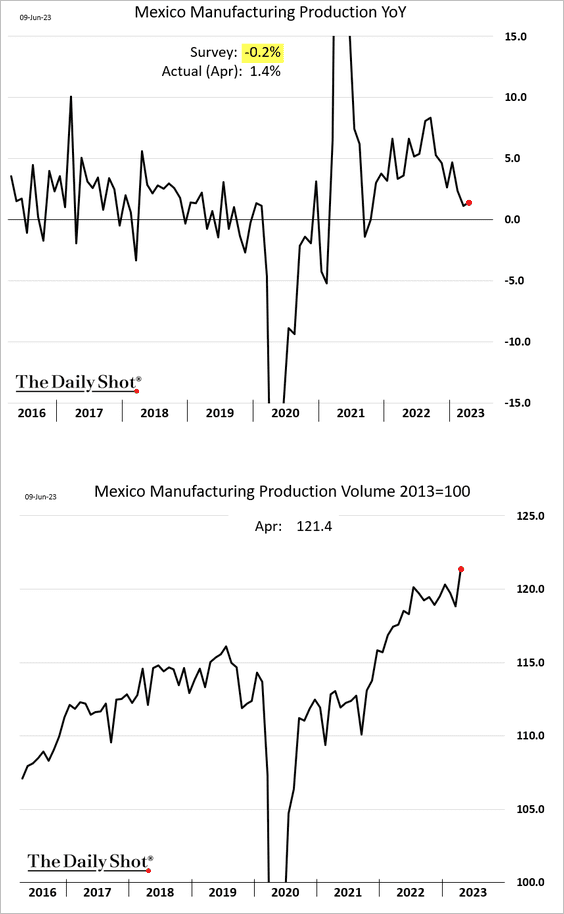
1. Mexico’s April manufacturing output topped expectations.
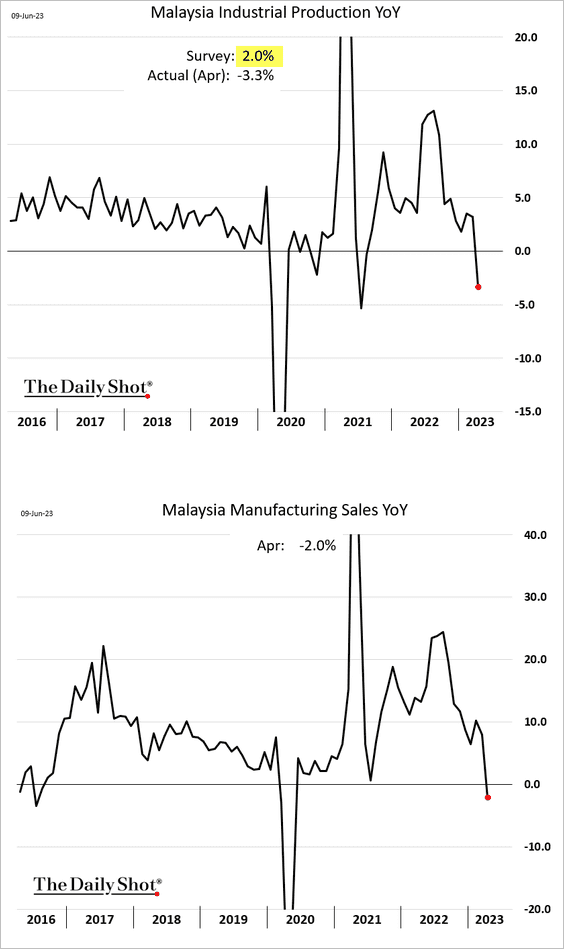
2. Malaysia’s industrial production tumbled in April.
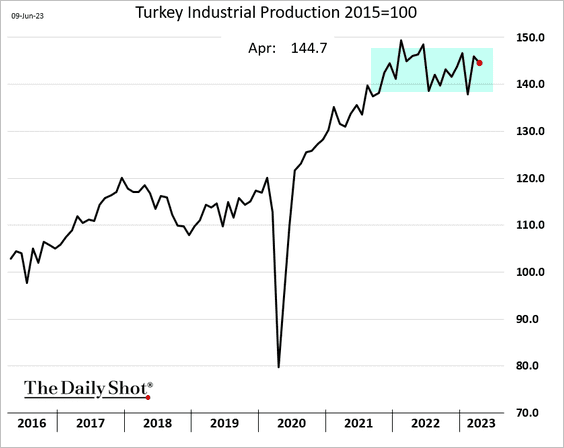
3. Turkey’s industrial production eased in April.
4. Saudi Arabia’s PIF is expected to become the largest sovereign wealth fund by 2030.
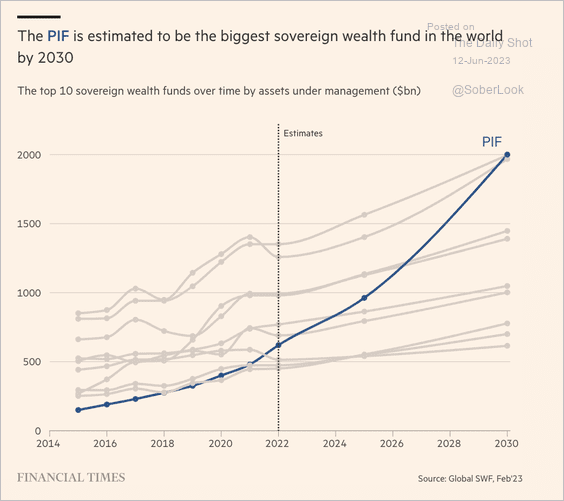 Source: @financialtimes Read full article
5. Ukraine’s GDP grew in Q1.
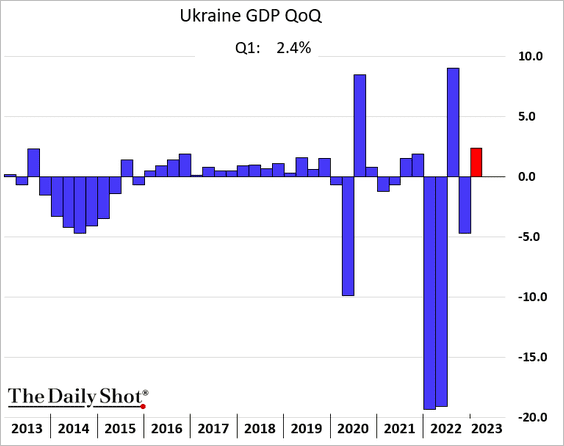
Below is the nation’s wheat production.
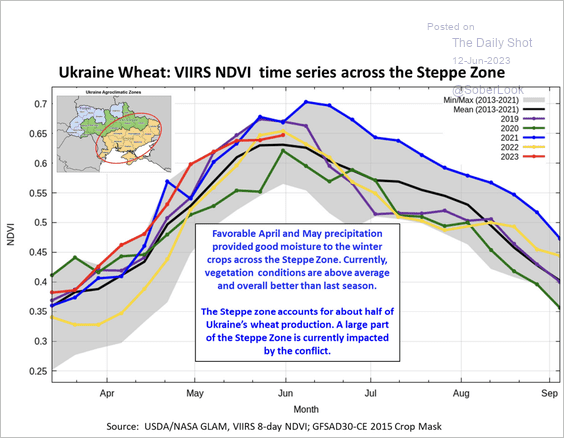 Source: USDA Read full article
——————–
6. Here is a look at distressed EM sovereign debt.
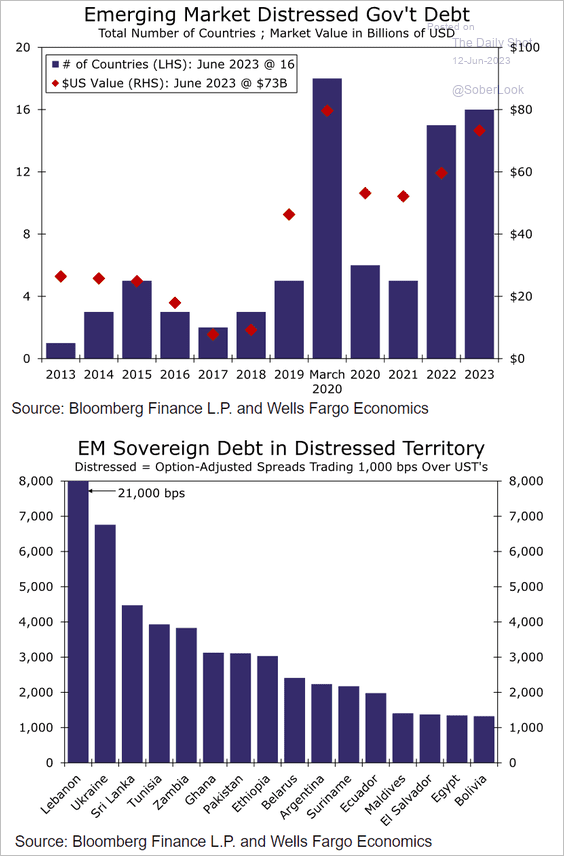 Source: Wells Fargo Securities
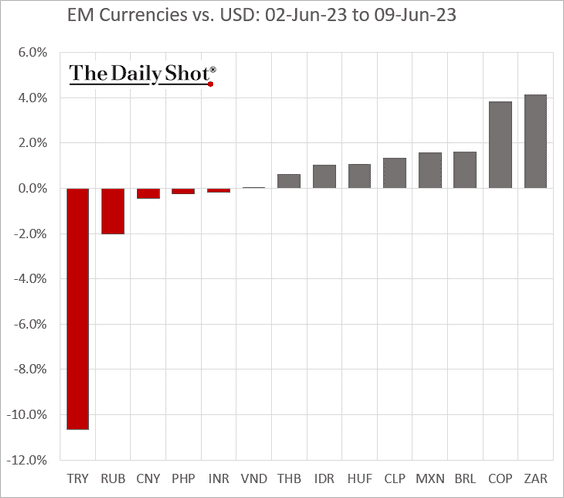
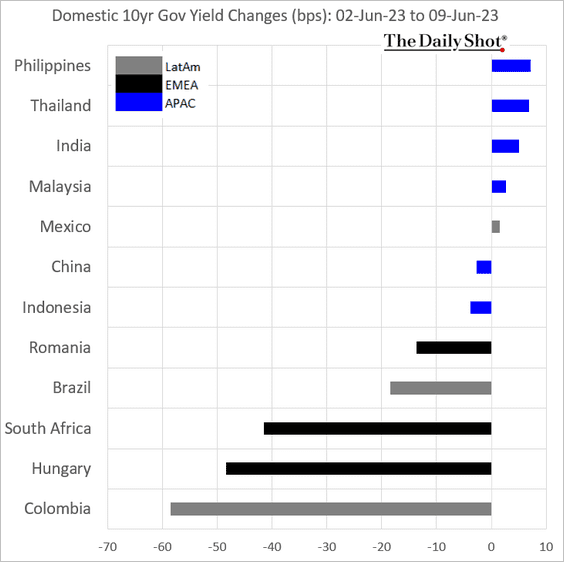
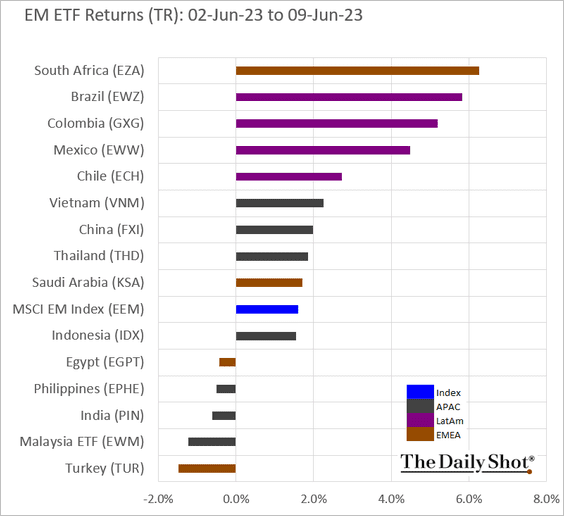
7. Next, we have some performance data from last week.
• Currencies:
• Bond yields:
• Equity ETFs:
Back to Index
Cryptocurrency
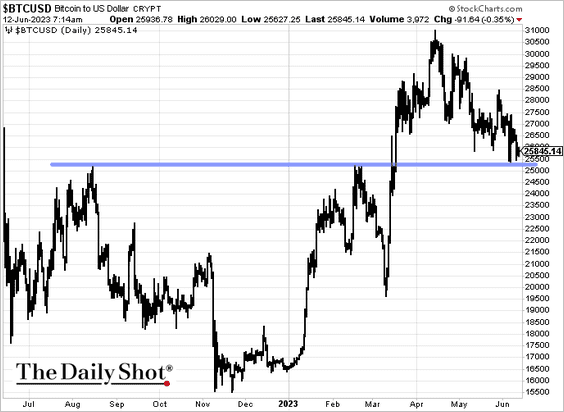
1. It was a tough week for crypto.
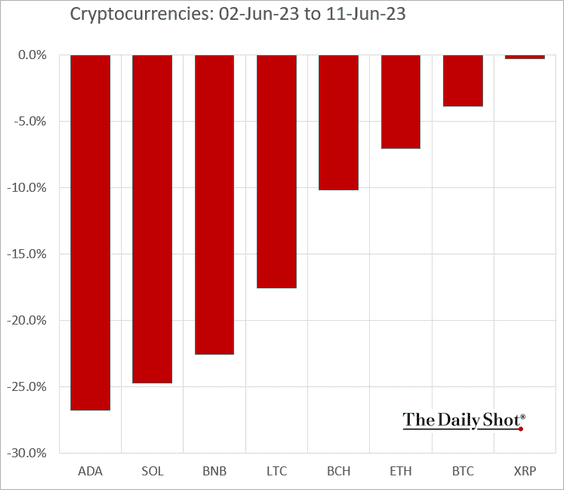
2. Bitcoin is nearing support.
3. Crypto owners are very optimistic.
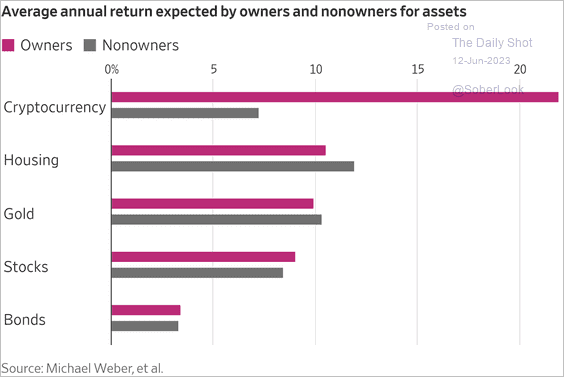 Source: @WSJ Read full article
Back to Index
Commodities
1. After surging in recent days, iron ore is down sharply on Monday.
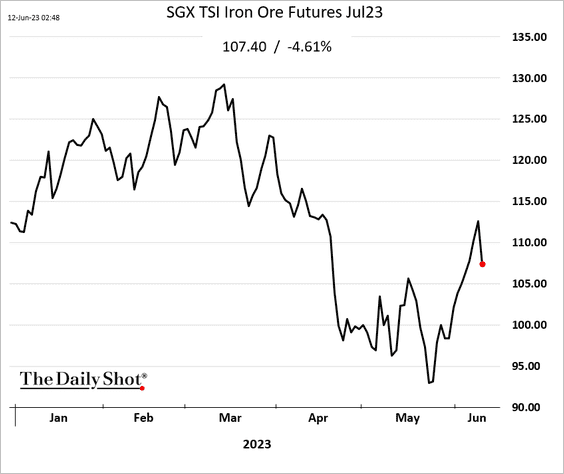
 Source: @markets Read full article
——————–
2. This chart shows China’s refined copper production.
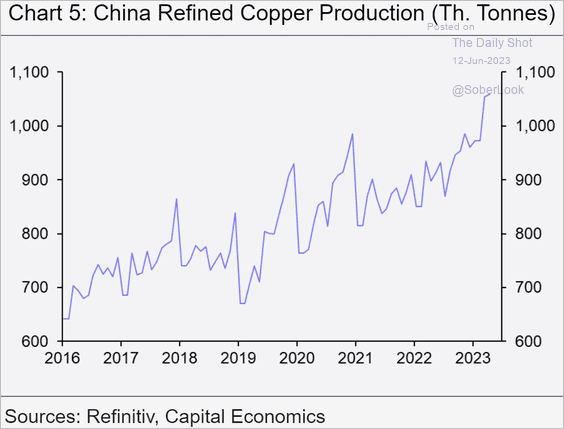 Source: Capital Economics
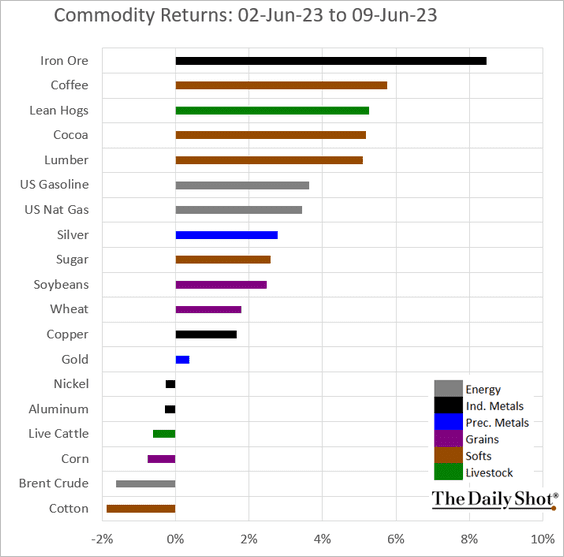
3. Here is a look at last week’s performance across key commodity markets.
Back to Index
Equities
1. The S&P 500 enters a bull market.
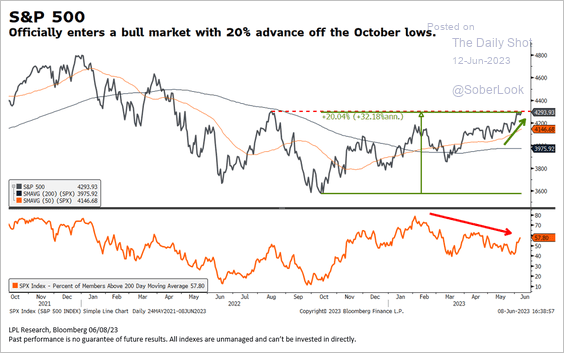 Source: LPL Research
2. The rally in global equities appears overbought.
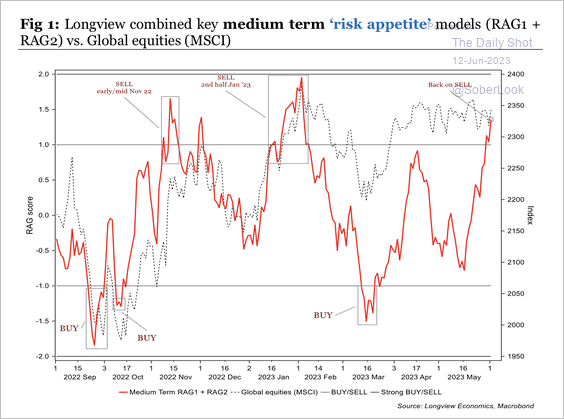 Source: Longview Economics
S&P 500 tech stocks are extended relative to financials.
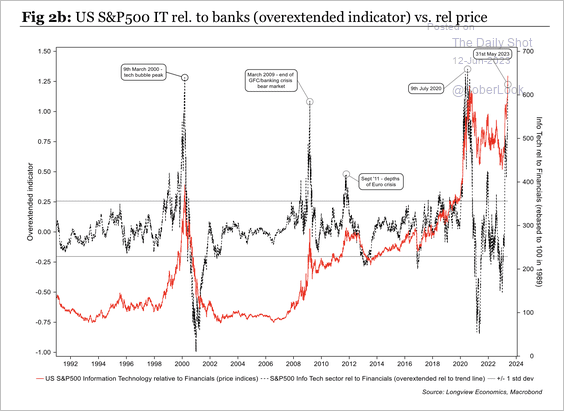 Source: Longview Economics
——————–
3. Deutsche Bank’s aggregate positioning indicator now shows overweight positioning.
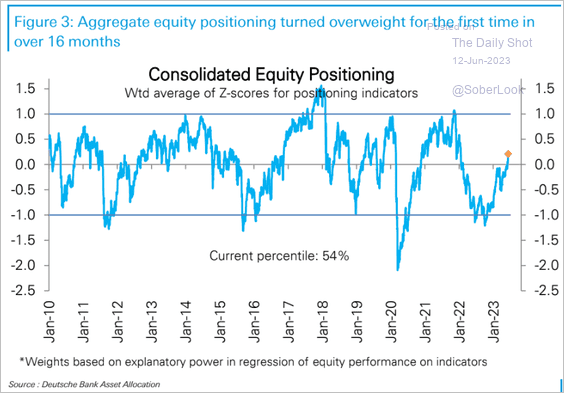 Source: Deutsche Bank Research
• Discretionary positioning moved above neutral.
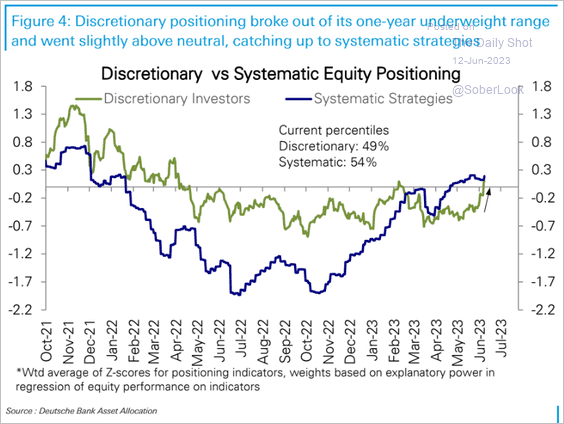 Source: Deutsche Bank Research
• CNN’s fear/greed index is now firmly in “extreme greed” territory.
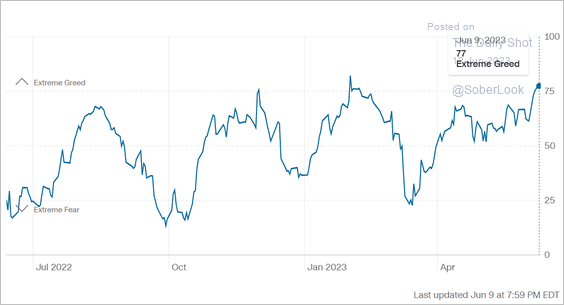 Source: CNN Business
• The put/call ratio has been moving lower, …
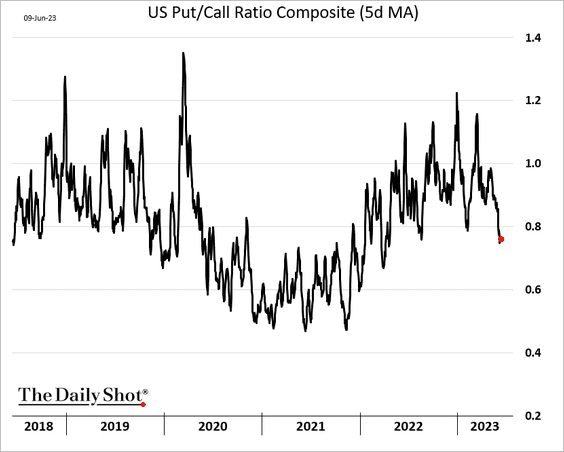
… as demand for calls surges.
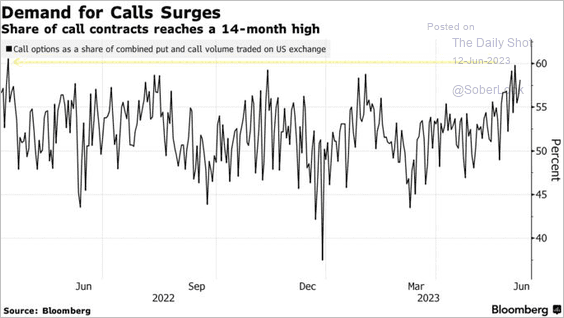 Source: @JessicaMenton, @lena_popina, @markets Read full article
——————–
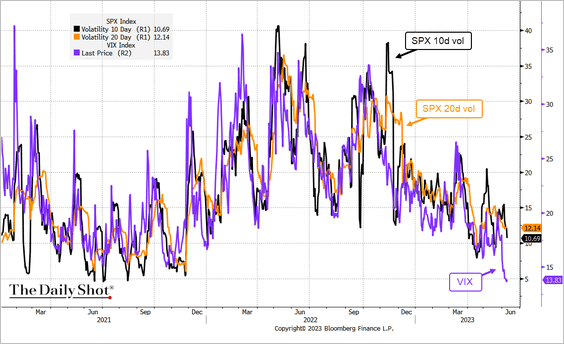
4. Here are some additional trends in volatility markets.
• VIX has declined faster than realized vol.
• VIX options trading volume has been rising.
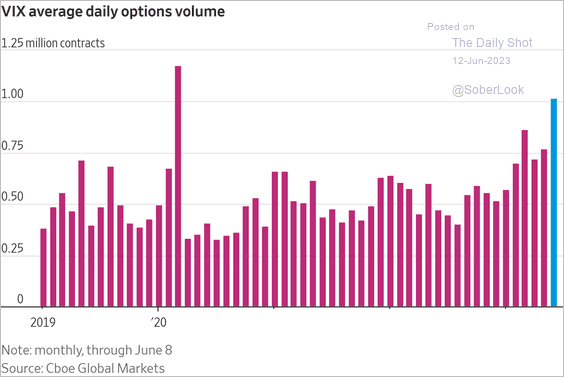 Source: @WSJ Read full article
• Implied volatility for the CPI and FOMC days this week is very low relative to previous months.
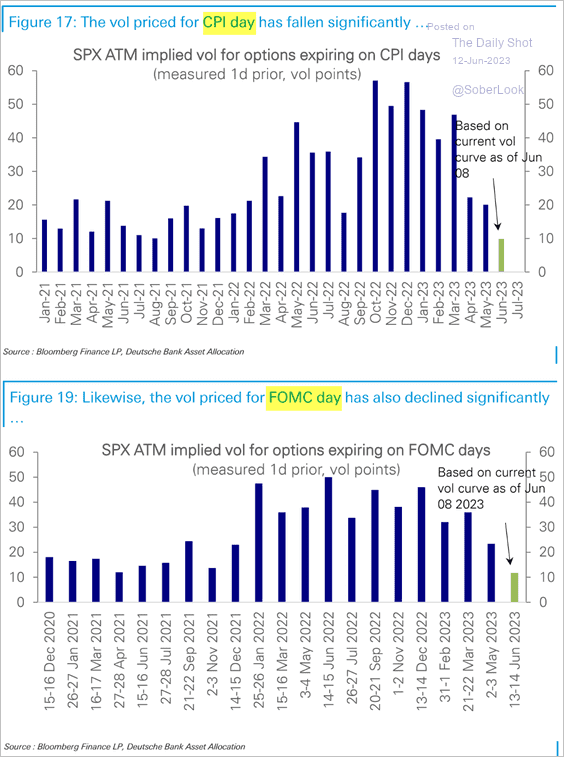 Source: Deutsche Bank Research
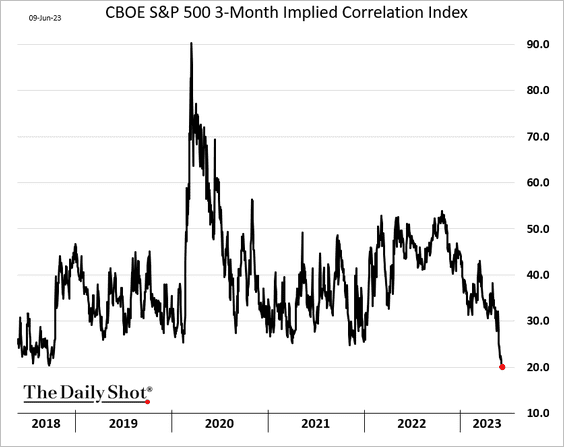
• S&P 500 implied correlation hit the lowest level since 2018.
——————–
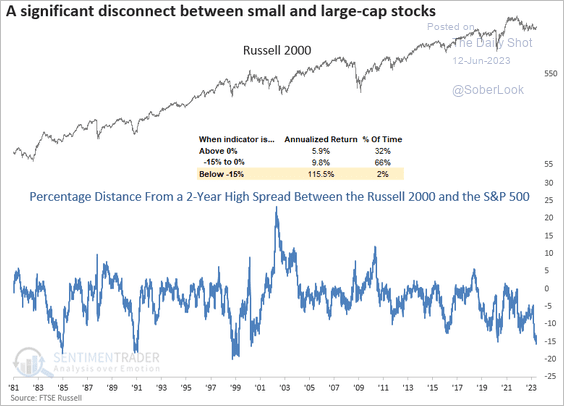
5. Historically, extreme disconnects between US small and large-cap indexes precede catch-up trades over the next 3-12 months, favoring the Russell 2000.
 Source: SentimenTrader
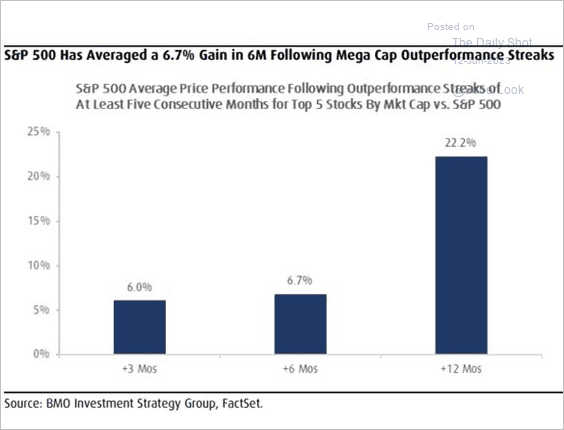
6. Megacap outperformance tends to precede gains for the S&P 500.
 Source: BMO Capital Markets
7. Next, we have some performance data from last week.
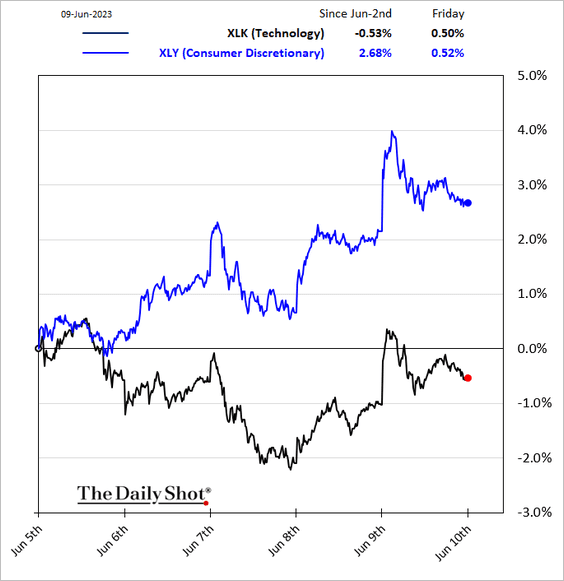
• Sectors:
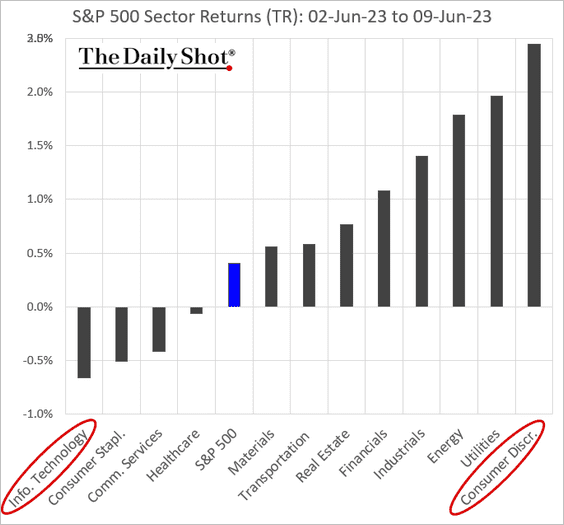
– The Consumer Discretionary sector got a boost from Tesla.
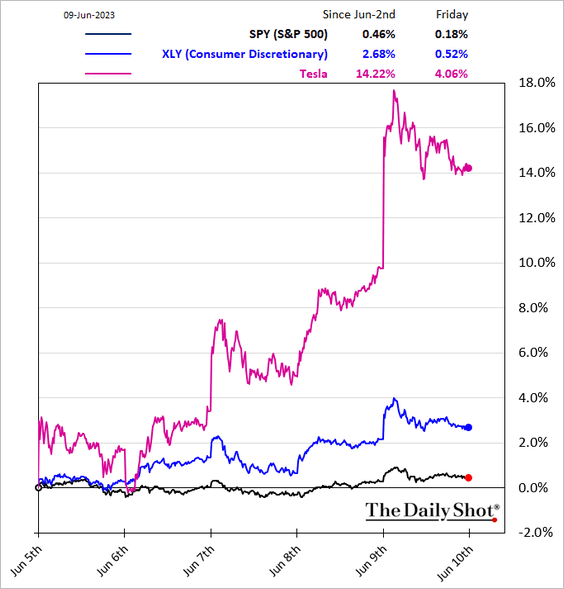
 Source: CNBC Read full article
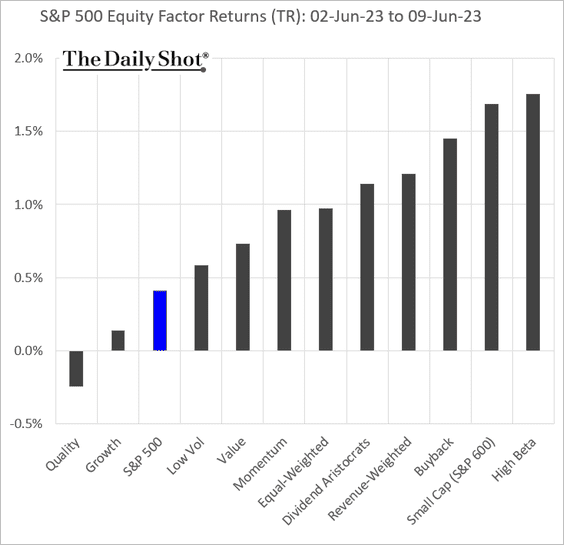
• Equity factors:
– By the way, what is the sector composition of the low-vol factor?
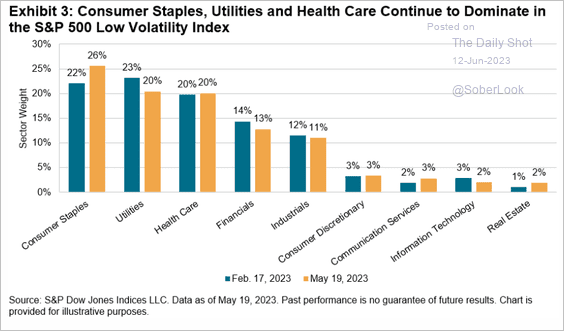 Source: S&P Dow Jones Indices
• Macro basket pairs’ relative performance:
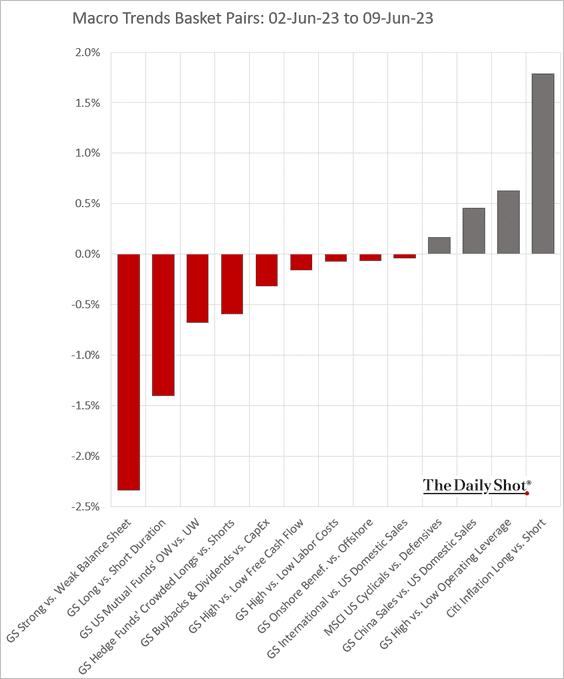
– Companies with weak balance sheets outperformed.
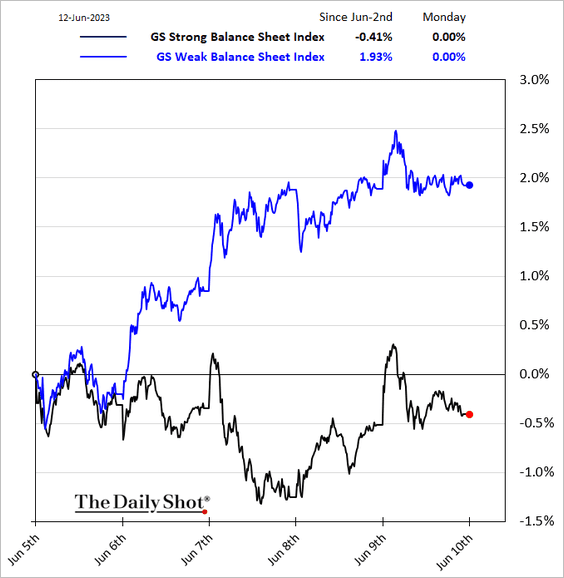
Here is (roughly) why we saw the above divergence.
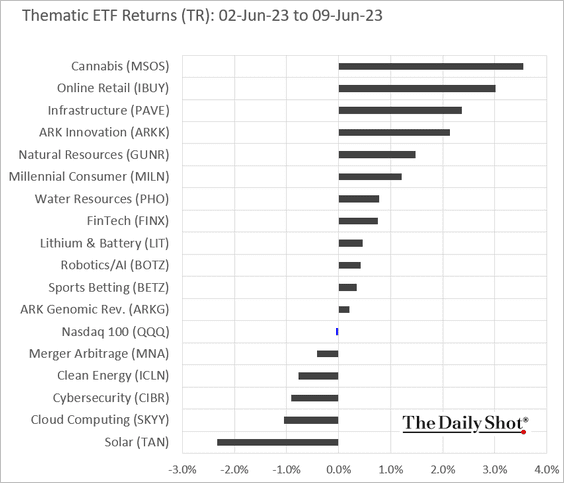
• Thematic ETFs:
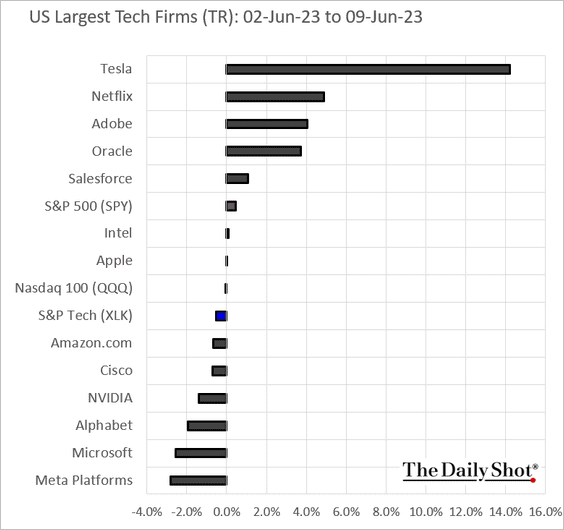
• Largest US tech firms:
Back to Index
Credit
1. Economic indicators continue to signal wider HY spreads.
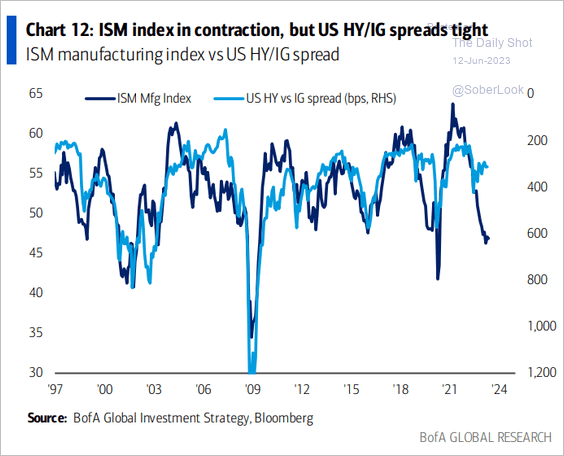 Source: BofA Global Research
2. Tighter lending standards point to further weakness in business credit.
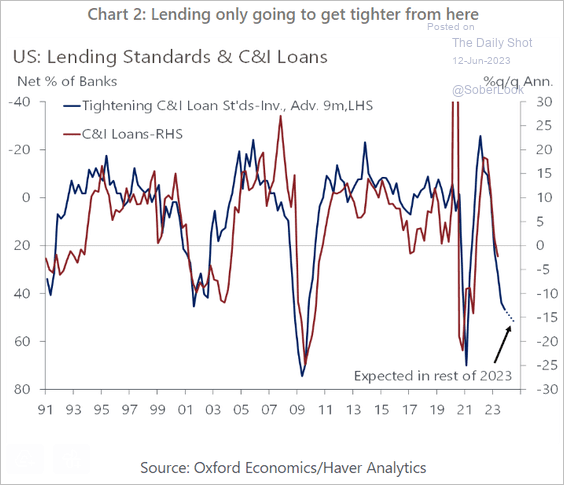 Source: Oxford Economics
3. Commercial real estate financing costs have been surging.
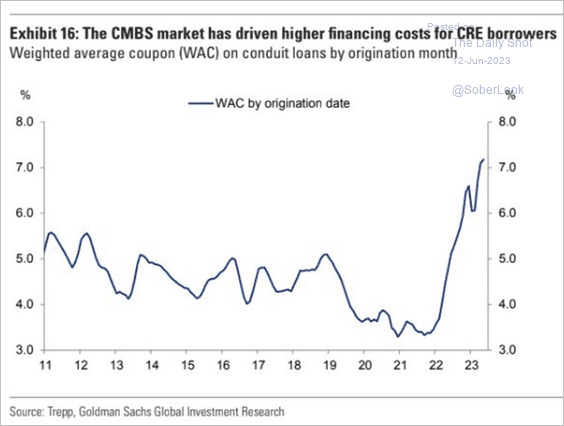 Source: Goldman Sachs
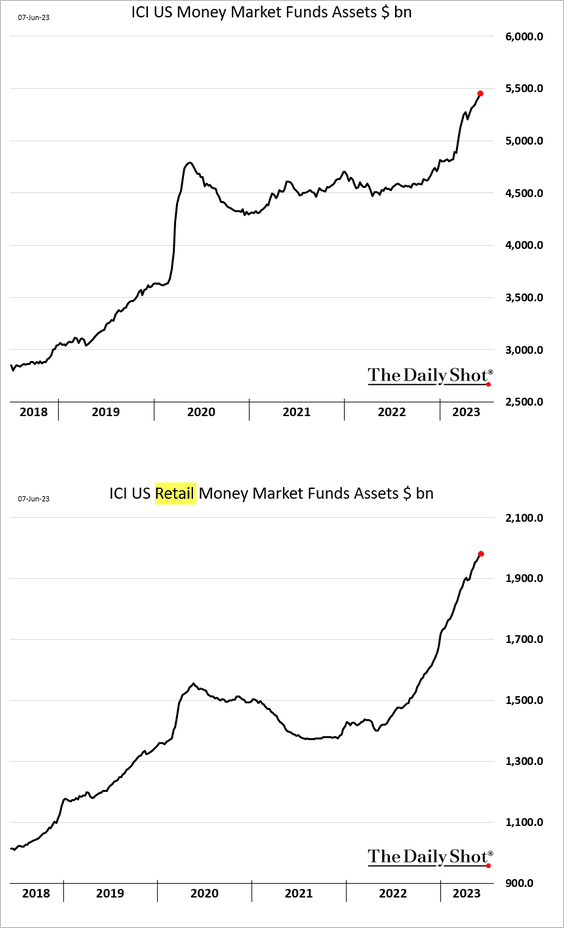
4. Money market funds’ AUM keeps rising.
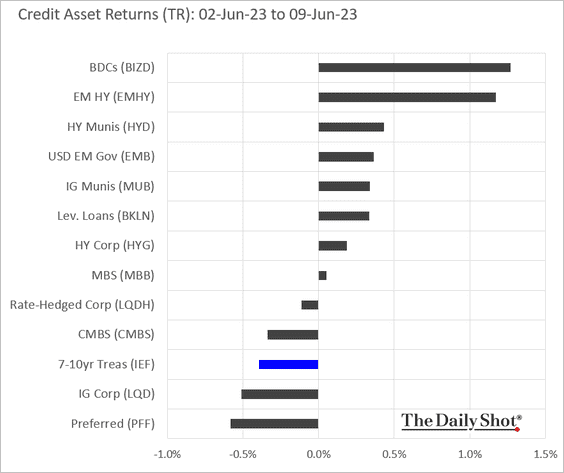
5. Here is a look at last week’s performance by asset class.
Back to Index
Global Developments
1. Leading indicators signal sharp declines in G20 inflation in the months ahead, …
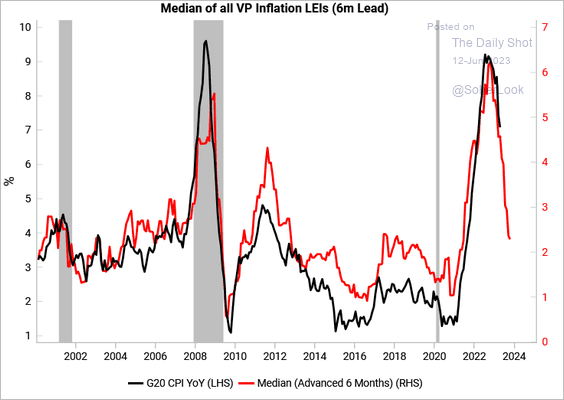 Source: Variant Perception
… as China exports disinflation.
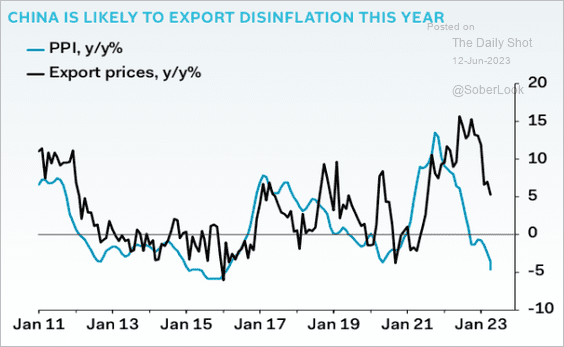 Source: Pantheon Macroeconomics
——————–
2. Here is a look at Morgan Stanley’s expected 12-month returns vs. risk across global assets.
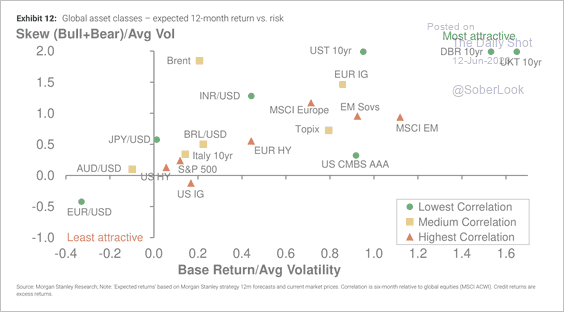 Source: Morgan Stanley Research
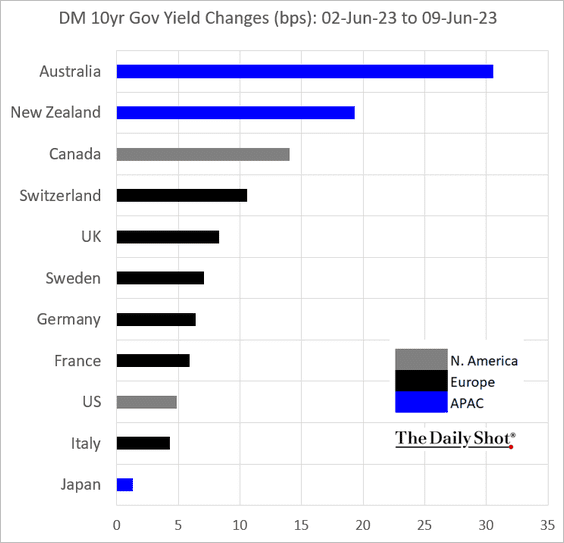
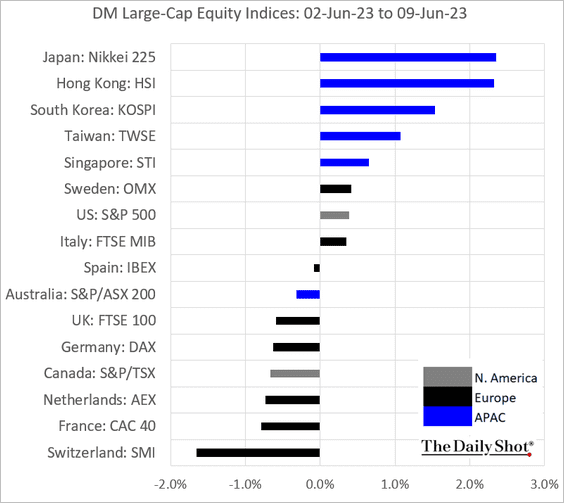
3. Next, we have some DM performance data from last week.
• Currencies:
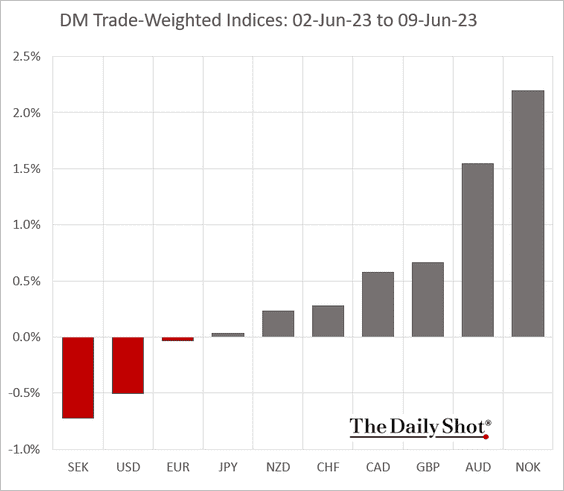
• Bond yields:
• Large-cap equity indices:
——————–
Food for Thought
1. Share of employment by occupation since 1840:
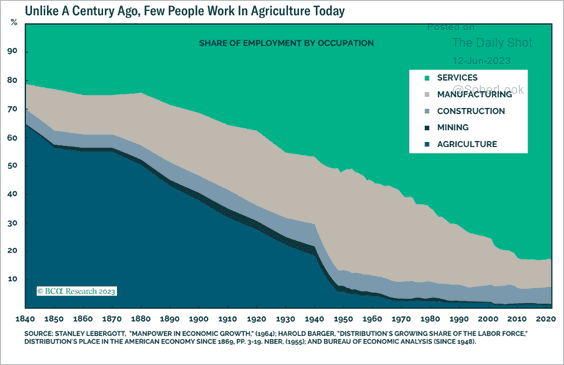 Source: BCA Research
2. Women’s labor force participation:
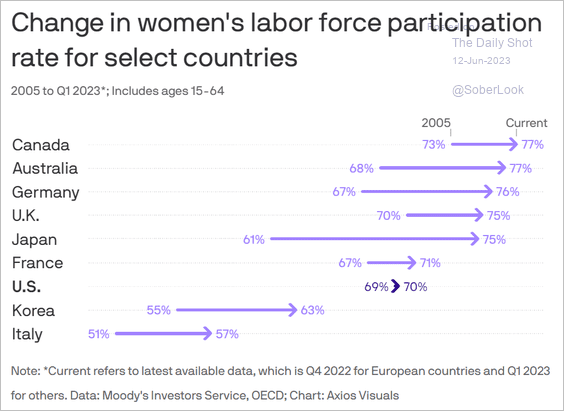 Source: @axios Read full article
3. Inflation-adjusted hourly wages since 1965:
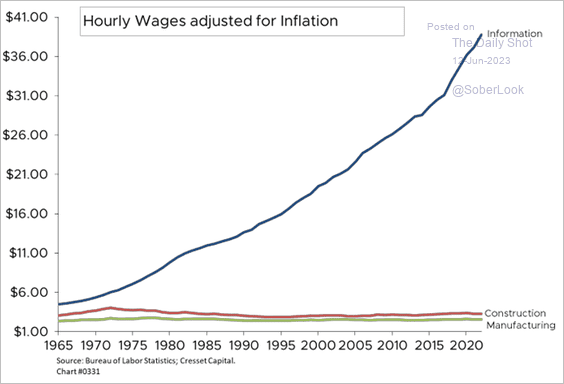 Source: Jack Ablin, Cresset Wealth Advisors
4. Average hourly wages for US teens:
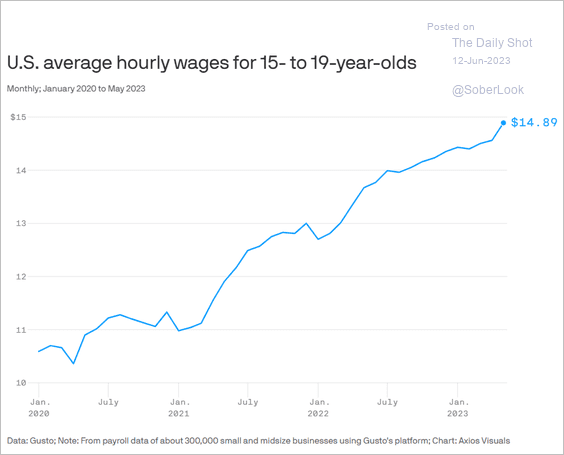 Source: @axios Read full article
5. Share of Americans who feel that they belong and are accepted in the US:
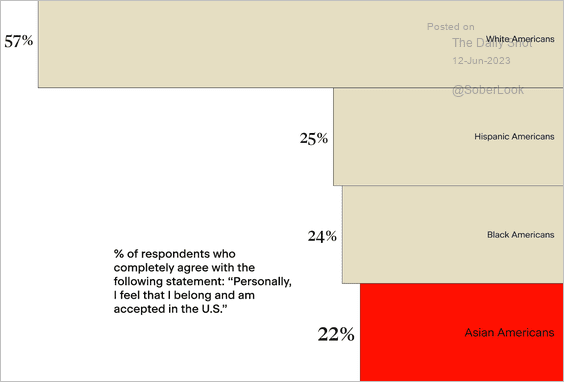 Source: STAATUS Index
6. GOP nomination odds in the betting markets:
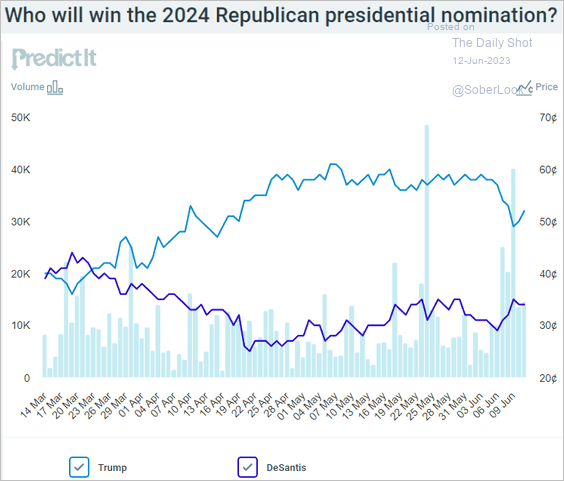 Source: @PredictIt
7. Global military spending:
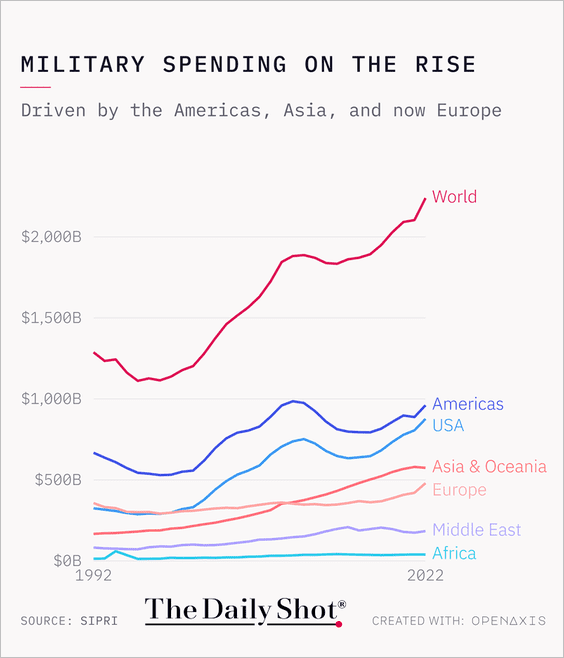 Source: @TheDailyShot
8. It’s hard to get any work done.
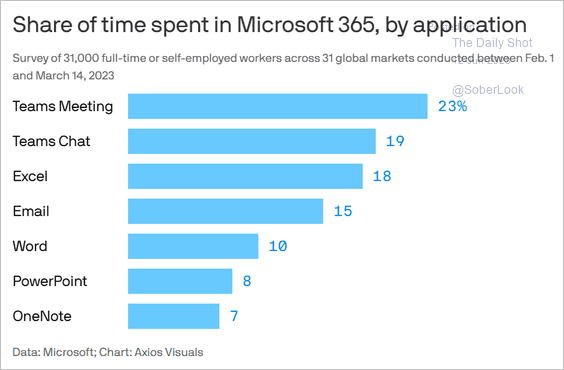 Source: @axios Read full article
——————–
Back to Index